Application of Nano-Silicon Dioxide Improves Salt Stress Tolerance in Strawberry Plants


1
Department of Horticultural Science, University of Guilan, Rasht 4199613776, Iran
2
School of Agriculture, Food and Wine, University of Adelaide, Urrbrae 5064, South Australia, Australia
*
Author to whom correspondence should be addressed.
Agronomy 2019, 9(5), 246; https://0-doi-org.brum.beds.ac.uk/10.3390/agronomy9050246
Submission received: 18 April 2019
/
Revised: 4 May 2019
/
Accepted: 8 May 2019
/
Published: 17 May 2019
(This article belongs to the Special Issue Berry Crop Production and Protection)
Abstract
:Silicon application can improve productivity outcomes for salt stressed plants. Here, we describe how strawberry plants respond to treatments including various combinations of salt stress and nano-silicon dioxide, and assess whether nano-silicon dioxide improves strawberry plant tolerance to salt stress. Strawberry plants were treated with salt (0, 25 or 50 mM NaCl), and the nano-silicon dioxide treatments were applied to the strawberry plants before (0, 50 and 100 mg L−1) or after (0 and 50 mg L−1) flowering. The salt stress treatments reduced plant biomass, chlorophyll content, and leaf relative water content (RWC) as expected. Relative to control (no NaCl) plants the salt treated plants had 10% lower membrane stability index (MSI), 81% greater proline content, and 54% greater cuticular transpiration; as well as increased canopy temperature and changes in the structure of the epicuticular wax layer. The plants treated with nano-silicon dioxide were better able to maintain epicuticular wax structure, chlorophyll content, and carotenoid content and accumulated less proline relative to plants treated only with salt and no nano-silicon dioxide. Analysis of scanning electron microscopic (SEM) images revealed that the salt treatments resulted in changes in epicuticular wax type and thickness, and that the application of nano-silicon dioxide suppressed the adverse effects of salinity on the epicuticular wax layer. Nano-silicon dioxide treated salt stressed plants had increased irregular (smoother) crystal wax deposits in their epicuticular layer. Together these observations indicate that application of nano-silicon dioxide can limit the adverse anatomical and biochemical changes related to salt stress impacts on strawberry plants and that this is, in part, associated with epicuticular wax deposition.
1. Introduction
Plants routinely experience adverse environmental conditions during their growth and development. For example, conditions such as drought, salinity, and cold stress frequently have adverse effects on plant growth and metabolism [1,2]. Salt or salinity stress may have a negative effect on the growth, development, and even survival of the plant by imposing osmotic stress along with causing ion and nutritional imbalances. The application of additional nutrients, such as calcium, can be considered as one strategy to reduce the effects of the ionic imbalance and plant nutritional deficiencies that occur in saline soils, and application of silicon can also improve outcomes for plants growing in saline soils [3]. Strawberries are relatively sensitive to salinity, and salinity can cause leaf burns, necrosis, nutritional imbalance, or specific ionic toxicity (due to sodium and chloride accumulation); this decreases the quality and yield of fruit, and increases the probability of plant mortality [4]. Exploring salt stress responses in strawberry is also of interest because strawberry is a model for the study of the Rosaceae family [5].
Silicon is not classed as an essential nutrient, but it is involved in a number of metabolic pathways that increase the tolerance of plants to environmental stress, such as drought and salinity stress [6,7,8]. Application of silicon is associated with increased resistance to water loss and improvement in plant water status in saline conditions, relative to control plants [9,10]. Silicon deposits have been observed in epidermal cell walls and this deposition is associated with limiting water loss from the cuticle and excessive transpiration [11]. Previous studies have linked silicon application, in the context of salinity, with enhanced photosynthesis, increased vegetative growth and dry matter production, reduced shoot sodium, and chloride accumulation and increased potassium accumulation and reduced root-to-shoot boron transport [12,13,14]; therefore, further research is needed towards determining the complement of reasons why silicon application benefits plants [6].
One way in which silicon may be applied to plants is in the form of nanoparticles. Application of silicon nanoparticles is reported to be an effective alternative to adding silicon as part of conventional mineral fertilizers [15]. For example, Prasad et al. [16] reported that zinc nanoparticles improved seed germination, plant growth, flowering, chlorophyll content and yield of peanut (Arachis hypogaea L.) compared to zinc sulfate treatments. In addition, it has been suggested that silica oxide nanoparticles can increase cell wall thickness, which can inhibit the penetration of fungi, bacteria and nematodes, and increase resistance to disease [16]. Silicon accumulation in plants is also linked to epicuticular wax accumulation. For example, in cucumber (Cucumis sativus L., cv. Corona) changes in the fruit trichome morphology occurred in response to silicon application and the silica accumulation was restricted to the trichomes, primarily in the epicuticular wax [17]. Epicuticular wax accumulation is linked to plant water use efficiency and the regulation of the amount of moisture evaporation through the leaf [18,19]. Therefore, increasing the amount of epicuticular wax may be a type of adaptation to environmental stresses [20]. As wax deposition plays a protective role against water loss through the cuticle, increasing wax content is classified as a dehydration avoidance mechanism [19]. The aim of this study was to investigate whether application of nano-silicon dioxide suppressed the adverse effects of salt stress on strawberry (Fragaria × anansa Duch.) plant growth and development, and to study how nano-silicon dioxide application might influence changes in anatomy and biochemistry previously linked with salt stress and silicon treatments.
2. Materials and Methods
2.1. Growth Conditions and Treatments
The experiment was conducted under greenhouse conditions at University of Guilan, Rasht, Iran. Strawberry (Fragaria × anansa) plants ‘cv; Camarosa’ with 11 mm crown diameters were obtained from a commercial nursery in Kurdistan province, Iran. Nano-particles of silicon dioxide were obtained from Sigma-Aldrich (Lot 637238). Nano-silicon dioxide characteristics were: 99.5% purity and 10–20 nm particle size, and particles were applied as a suspension phase (suspended in nutrient solution) relative to control (no nSiO2) treatments of only nutrient solution. The strawberry plants (Fragaria × anansa, ‘cv; Camarosa’) were grown in the following conditions: 12 h photoperiod, 25 ± 10 °C temperature, 70 ± 10% relative humidity. Plants with 11 mm crown diameters (approximately 40 days old) which had received two weeks chilling requirement were transferred to a greenhouse and planted into 4 L containers filled with coco-peat and perlite (2/1, v/v). The plants were fertilized with modified Hoagland’s solution with or without nano-silicon dioxide. Two different nutrient solutions were used in this experiment to meet plant nutritional needs during vegetative growth and at flowering. Before the start of flowering; the nutrient solution contained elemental concentrations as follows: 150 mg L−1 N, 54 mg L−1 P, 262 mg L−1 K, 110 mg L−1 Ca, 34 mg L−1 Mg, 50 mg L−1 S, 5 mg L−1 Fe, 0.5 mg L−1 Mn, 0.5 mg L−1 Zn, 0.50 mg L−1 B, 0.05 mg L−1 Cu and 0.05 mg L−1 Mo. During flowering, the nutrient solution contained 142 mg L−1 N, 59 mg L−1 P, 227 mg L−1 K, 110 mg L−1 Ca, 39 mg L−1 Mg, 56 mg L−1 S, 5 mg L−1 Fe, 0.5 mg L−1 Mn, 0. 5 mg L−1 Zn, 0.50 mg L−1 B, 0.05 mg L−1 Cu and 0.05 mg L−1 Mo. The pH of nutrient solution was adjusted to 6. The nano-silicon dioxide (0, 50, 100 mg L−1) was incorporated into the Hoagland’s solution nutrients.
Salt stress treatments were imposed by dissolving NaCl (to achieve 0, 25 and 50 mM concentrations) into the nutrient solution which was used to water the plants (see Table 1). The plants were exposed to salt stress two weeks after planting. In order to prevent salt stress shock, salt concentrations were increased gradually during the first two weeks of the salt stress and after this period saline solution was applied every four days. In addition, the containers were irrigated with 600 mL water for leaching salt every two weeks during salinity treatment.
The plants were treated with the following concentrations of nano-silicon dioxide: 0, 50, 100 mg L−1 after planting until the beginning of flowering: when about 10% of flowers had started to open (BBCH (Biologische Bundesanstalt, Bundessortenamt und CHemische Industrie): 61) or were at vegetative stages (phenological growth stages and BBCH-identification keys of strawberry (Fragaria × ananassa Duch.). Thereafter, the plants were treated continuously during the reproductive stage (BBCH: 61–92) with treatments of 0, or 50 mg L−1 nano-silicon dioxide concentrations; the nSiO2 treatments were divided into six groups (Table 1):
2.2. Phenotypic Measurements
The fresh weight of shoots and root were measured at the end of the experiment, and harvested samples were immediately dried in an oven at 70 ºC for 48 h, and subsequently, the dry weight was determined.
Relative water contents (RWC) of leaves were determined according to Abdi et al. [21] and calculated using the following Equation:
where FW (fresh weight) of the leaves was measured immediately after picking and DW (dry weight) was measured after drying the leaves in an oven at 70 °C for 24 h or until constant weight was achieved; the leaf weight at full turgor was TW, measured after floating the leaves for 4 h in distilled water at room temperature in the dark [21]; three biological replicates per treatment were included.
RWC = (FW − DW)/(TW − DW) × 100
Relative water protection (RWP): three comparable leaves were randomly selected from three biological plant replicates were weighed to determine fresh weight (FW) and thereafter allowed to wilt at 25 °C for 8 h then weighed (Withering weight, WW). The samples were oven-dried at 70 °C for 72 h and reweighed (Dry weight, DW). Finally, RWP was calculated following [22]:
RWP = ((WW − DW)/(FW − DW))
Relative water loss (RWL): three comparable leaves were removed from each plant (three biological replications per treatment) and immediately weighed (W1). The leaves were allowed to wilt at 25 °C and weighed over 2, 5 and 8 h (W2, W3, and W4). The samples were oven-dried at 70 °C for 72 h and reweighed (Wd). RWL was calculated by the following formula [23].
RWL = ((W1 − W2) + (W2 − W4))/((3 × WD (T1 − T2)).
Membrane stability index (MSI) was measured following Sairam [24]. The leaf sections, 5 cm2 were put in 10 mL of double-distilled water. One set was kept for 30 min at 40 °C and its electrical conductivity recorded using a conductivity meter (C1), while the second set was kept for 10 min in a boiling water bath (100 °C) and subsequently measurements of conductivity were taken (C2). The electrolyte leakage or membrane stability index were calculated following [24]:
MSI = (1 − (C1/C2)) × 100
Cuticle transpiration (CT): The cuticle transpiration was calculated using the following equation in terms of weight per gram of dry matter. W5h is the leaf weight of leaves after 5 h in darkness and 20 °C, W24h is the weight of the leaves isolated after 24 h in darkness and 20 °C and DW is the dry leaf weight (48 °C at 70 °C). The cuticle transpiration was calculated using the equation [25]:
CT = (W5h − W24h)/DW
Canopy temperature depression (CTD) was determined by measurements with a hand-held infrared thermometer (Raytek Raynger ST20 Infrared Thermometer, Santa Cruz, CA, USA). A few days after irrigation, canopy temperatures (CT) were measured between 12:00 and 1:30 pm on cloudy and sunny days. For this experiment four measurement points for plant canopy temperature were chosen in each pot at approximately 15–30 cm above the leaves of the strawberry plants, approximately 30–60° from the horizontal position. Ambient temperatures (AT) were measured with a thermometer held at plant height. CTD was worked calculated following [26]:
CTD = AT − CT
Epicuticular wax layer (EWL): for determining EWL, the method of Ebercon et al. [19] was used. This measure is based on the color change that occurs when acidic potassium dichromate (K2Cr2O7) reacts with epicuticular wax. Two fully expanded leaves were harvested from each plant in each pot (six leaf disks in each replication including three biological replicates). Leaf disks (5.699 cm2) were isolated by hole-punch, and used for wax extraction. These disks were put in a tube and 15 mL of chloroform was added and the tube shaken at room temperature for 15 s. The extract was evaporated to dry in a water bath maintained at 90 °C. Then, five ml of the K2Cr2O7 solution was added to the tube and the reaction mixture left in a boiling water bath for 30 min. When the samples were cooled 10 mL of distilled water was added to tubes, tubes were mixed and finally, the absorbance was measured at 590 nm using a Spectrophotometer (Ltd T80 + UV/VIS; PG Instruments, Leicestershire, UK). The standard curve calibration was produced by using known concentrations of polyethylene glycol-6000 for EWL determination at 590 nm wavelength [19].
Scanning electron microscope (SEM) images were captured and used to examine differences in wax morphology. Preparation of leaf samples followed the method reported by Åström et al. [27]. The youngest fully developed leaf after the end of fruit production was harvested. The leaf pieces were cut from the central part of the middle leaflet, near the widest point of each leaf. The samples were fixed individually in FAA (formalin acetic acid-alcohol) solution (36% paraformaldehyde, 100% acetic acid, 85% ethanol; 10:5:85 by volume) for a minimum of 3 weeks. After fixation, the samples were dehydrated through an ethanol series (25%, 50%, 75%, and 100%) [27]. 5-8 mm completely dried pieces of prepared leaf samples, were attached with double adhesive tape to the aluminum stubs and sputter-coated with gold particles. Coated surfaces were observed using a Philips Xl 30 scanning electron microscope (Philips XL30 SEM, Amsterdam, The Netherlands) at an accelerating voltage of 10 kV [28]. SEM images of epicuticular wax of strawberry leaves at two levels of magnification (Bars; 100 µm and 25 µm) were taken at the University of Guilan.
The leaf free proline content for the strawberry plants was extracted and determined by following the method described by Bates et al. [29]. 500 mg of the leaf samples were homogenized in 5 mL sulfosalicylic acid (3%) and the homogenate centrifuged at 3500× g for 10 min. The supernatant was mixed with 2 mL acid ninhydrin [1.25 g of ninhydrin in glacial acetic acid (30 mL) and 6 M phosphoric acid (20 mL), with agitation, which was warmed until dissolved for Acid ninhydrin preparation] and 2 mL of glacial acetic acid in a test tube at 100 °C for 60 min, and the reaction terminated in an ice bath. The reaction mixture was extracted with 4 mL toluene, mixed vigorously with a test tube stirrer for 15–20 s. Free proline content was quantified spectrophotometrically at 520 nm using L-proline as a standard. The absorbance was measured at 520 nm. The content of proline was determined using a standard curve and expressed as µmol g−1 fresh weight following [29].
Pigment parameters of the leaves including chlorophyll and carotenoid content were measured following a method described by Abdi et al. (2016). Initially 500 mg of leaf tissues were placed in each tube with 50 mL 80% acetone solution, these samples were homogenized and then the extract sap was centrifuged for 10 min at 3000× g and absorbance of the supernatant measured at 663 nm (for chlorophyll a), 645 nm (for chlorophyll b), and 470 nm (for total carotenoids). Finally, the pigment content was calculated according to the following formulas [21]:
Chl a = 11.75 × A662 − 2.35 × A645
Chl b = 18.61 × A645 − 3.96 × A662
Car = 1.000 × A470 − 2.27 × Chl a − 81.4 × Chl b/227
2.3. Statistical Analysis
The plants were arranged in a Completely Randomized Design in a factorial layout with three factors: Salt (0, 25 and 50 mM), nano-silicon dioxide concentrations (0, 50 and 100 mg L−1) before flowering and two levels of nano-silicon dioxide (0 and 50 mg L−1) after flowering, with three replications and 12 pots (plants) per replication. All data were analyzed by a one-way analysis of variance and mean comparisons were made by least significant differences (LSD) with software (SAS, v. 9.4, Cary, NC, USA).
3. Results
Salinity and nano-silicon dioxide treatments resulted in changes in strawberry plant growth characteristics; for example the 100 mM salt treatments resulted in decreases in root and shoot fresh weight (by 35 and 65%, respectively) and in root and shoot dry weight (by 50% in the shoot to root ratio and 26% in root volume; Table 2). As expected, the 50 mM NaCl treatments reduced these growth characteristics more than the 25 mM NaCl treatment (Table 1).
Incorporation of nano-silicon dioxide (nSiO2) into the nutrient solution changed some of the growth parameters measured for the strawberry plants. For example, the plants treated with nSiO2 had higher root fresh and dry weight as compared to 0 mg L−1 nSiO2 under salt stress conditions (Table 2). The highest root dry weight (10.4 g) and fresh weight (50.9 g) was observed when plants were treated with 50 mgL−1 nSiO2 before full flowering (Si3).
Shoot fresh and dry weight were significantly affected individually by salinity and nSiO2 treatments, but no significant difference was found for any interaction effect of salinity and nSiO2 (Table 2). Strawberry plants which received 100 mg L−1 nSiO2 before the flowering stage and 50 mg L−1 thereafter (Si6) showed the highest fresh shoot weight (41.2 g), while the highest shoot dry weight (13 g) was recorded for plants which received 100 mg L−1 nSiO2 before flowering and 50 mg L−1 thereafter (Si6) or plants that received 50 mgL−1 nSiO2 before flowering stage (Si3) (Table 2); and differences between nSiO2 treated and control (no nSiO2) plants for shoot to root ratio and root volume were also recorded (Table 2). A t-test was conducted to explore any differences between the addition (S6) and absence (S1) of silicon in the nutrient solution under salinity stress conditions. This revealed that there were differences in the epicuticular wax layer and proline (Table 3).
A significant difference was found for the individual effects of salinity and nSiO2 treatments on strawberry fruit yield but there was no significant difference for any interaction effects on fruit yield (Table 4). The lowest fruit yield was observed when plants were treated with 50 mM NaCl as compared to controls (no NaCl), as the salt treatment decreased fruit yield by 61%. Furthermore, application of nSiO2 led to an overall improvement in fruit yield. The highest fruit production per plants (161 g) was obtained when plants received 100 mgL−1 nSiO2 before flowering and 50 mg L−1 after flowering stage (Si6) (Table 4).
Physiological parameters such as RWC, RWP, and MSI significantly decreased, when strawberry plants were exposed to salinity [reduced by 21%, 5.5% and 10% relative to measures in control (no NaCl) plants, respectively], but RWL was not affected by salt stress. The lowest values were recorded for plants were exposed to 50 mM NaCl (Table 4).
There was no significant difference between nSiO2 treatments and control (no nSiO2) for RWC and RWP, but RWL and MSI of nSiO2 treated plants was significantly higher than control (no nSiO2) plants. The highest RWL and MSI was measured in plants that continuously received 50 mg L−1 nSiO2 (Si4) over the growth and development stages (Table 4).
The canopy temperature of strawberry plants was significantly reduced by salt stress, especially when the plants had been exposed to 50 mM NaCl during growth and development. Nano-silicon dioxide application raised canopy temperature of strawberry plants both in cloudy and sunny days (Table 4). No significant difference was observed for cuticle transpiration (CT) in nSiO2 treated and control (no nSiO2) plants.
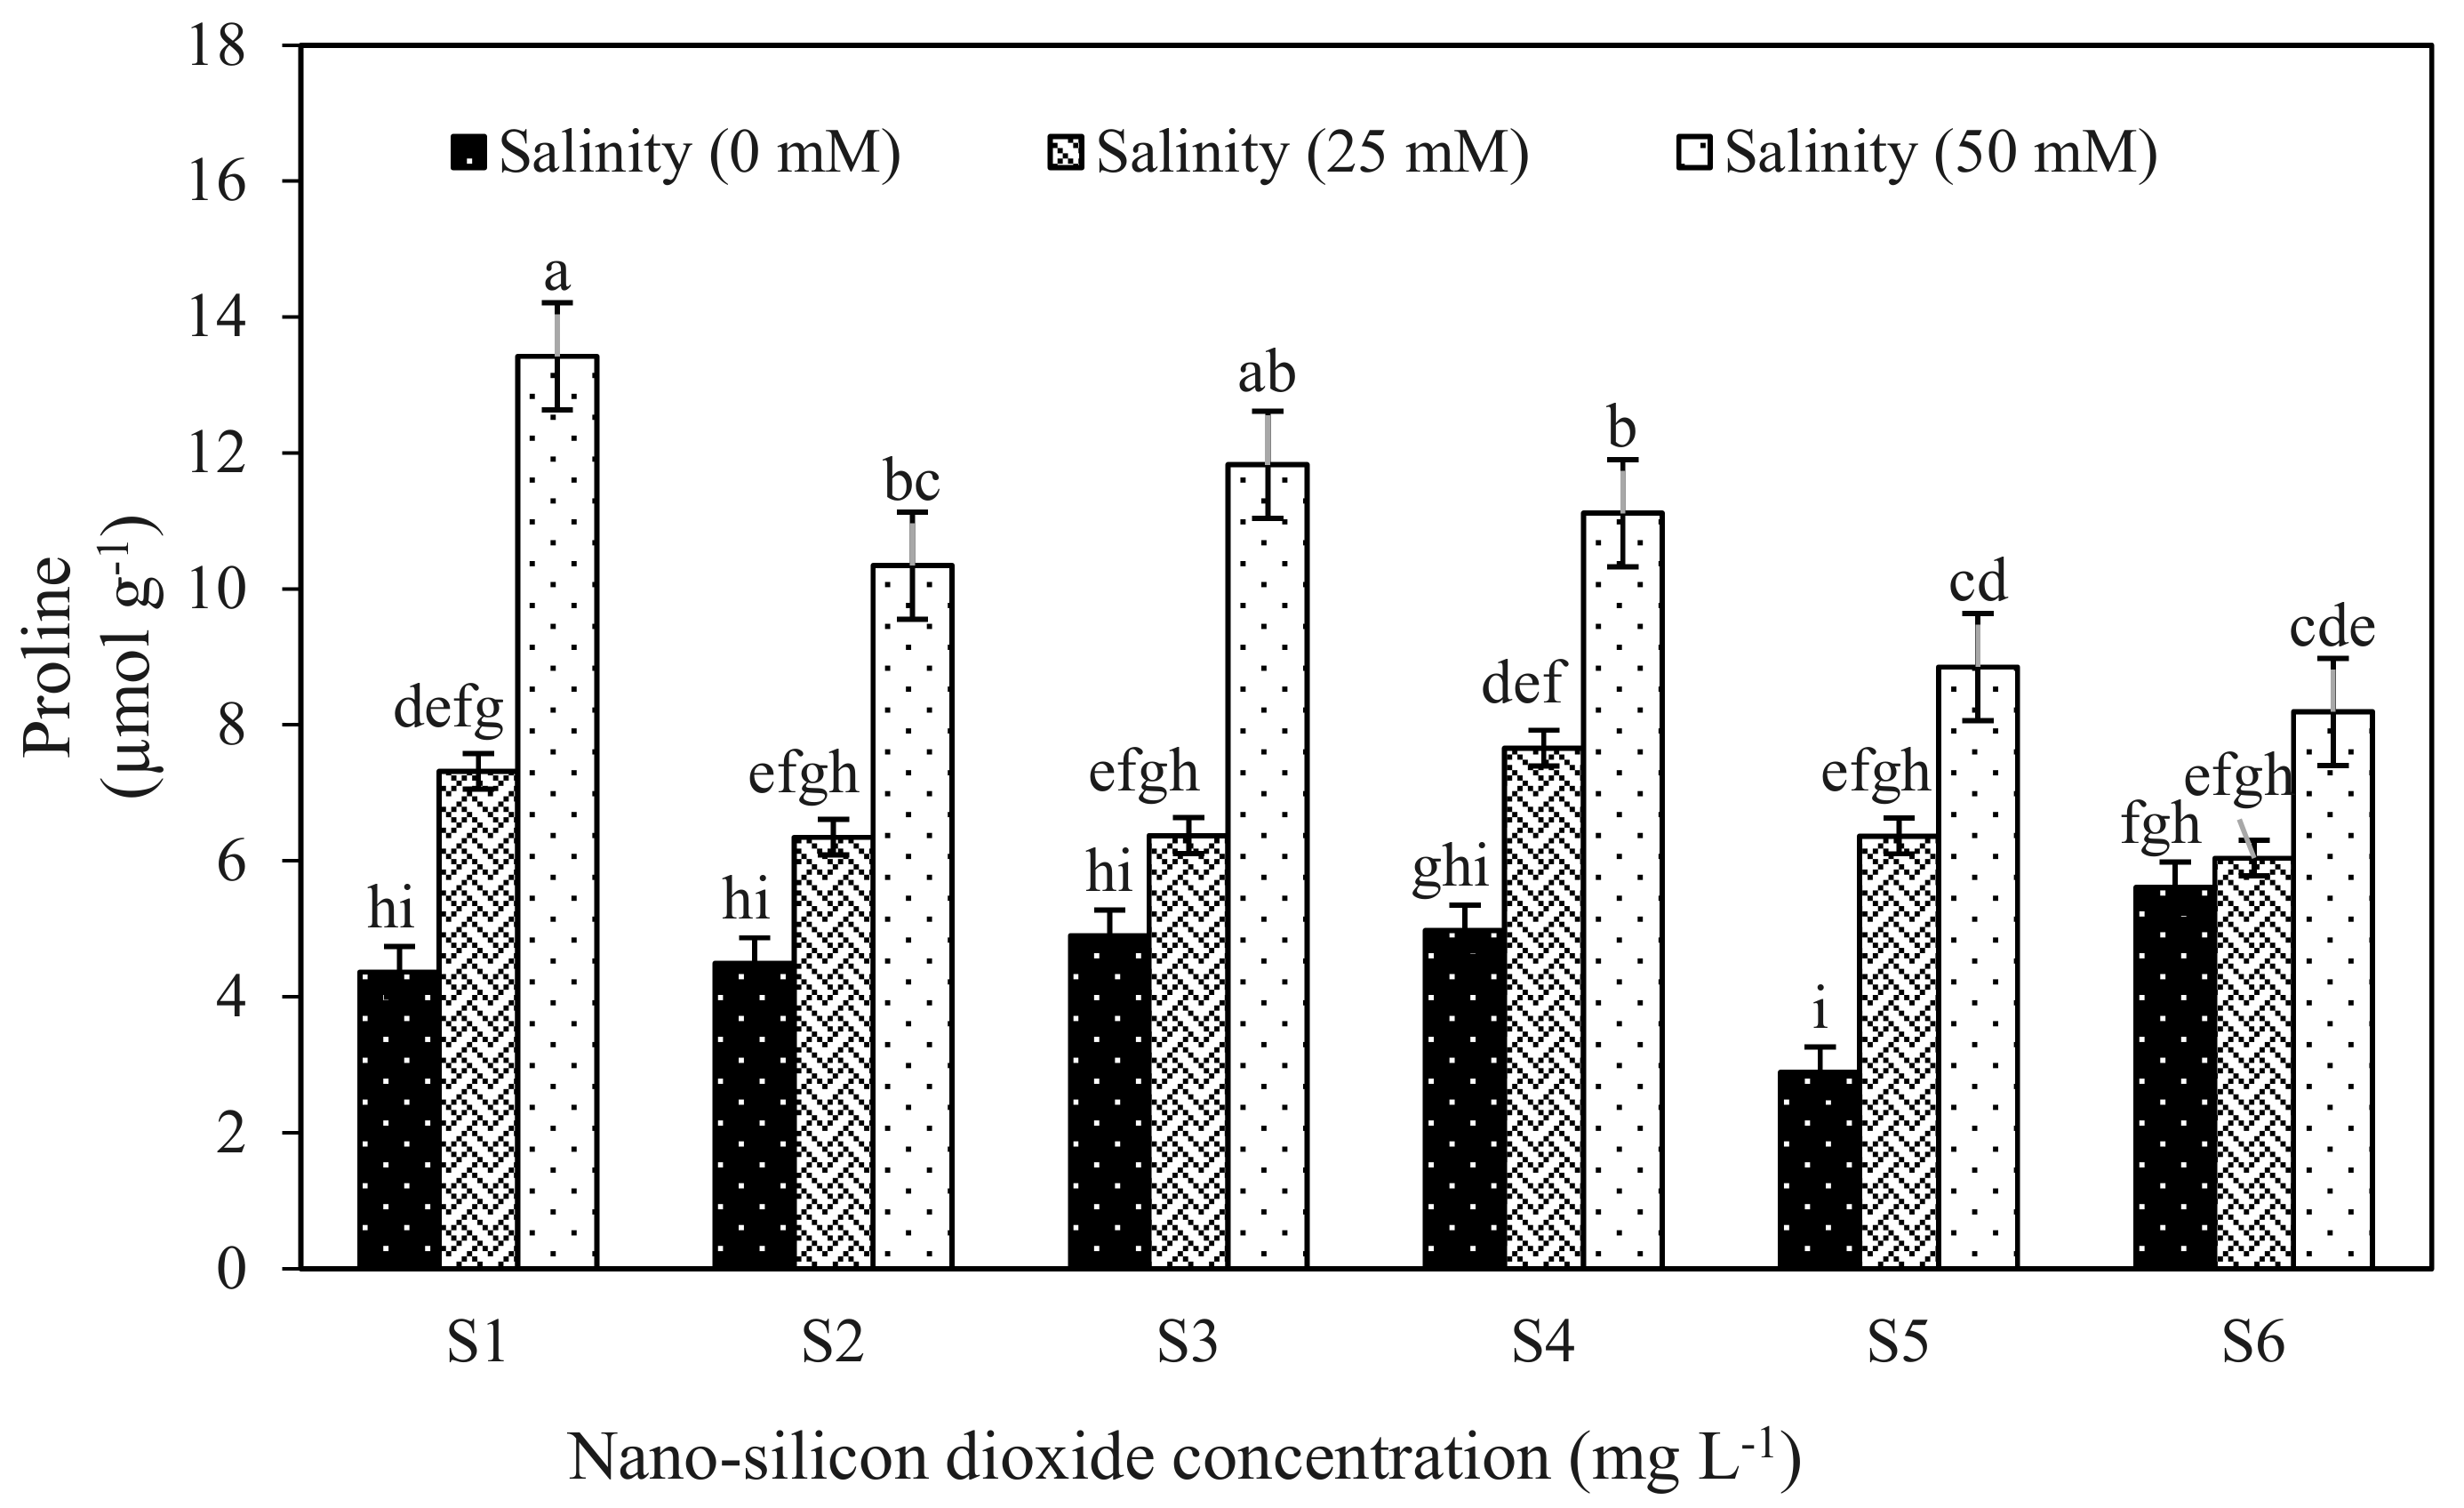
Proline content of salt treated strawberry plant leaves increased by 15 and 81% under 50 mM and 100 mM salinity treatments but incorporation of nSiO2 to the nutrient solution limited proline accumulation. The highest proline content was found in 0 mg L−1 nSiO2 (S1) treated plants under salt stress conditions (Table 5; Figure 1). NSiO2 treatment caused a significant decrease in proline content in salt stress plants compared to the strawberry plants treated with salt treatments without nano-silicon dioxide treatment. The results revealed a negative correlation (−0.63058 **; p < 0.01) between proline content and EWL.
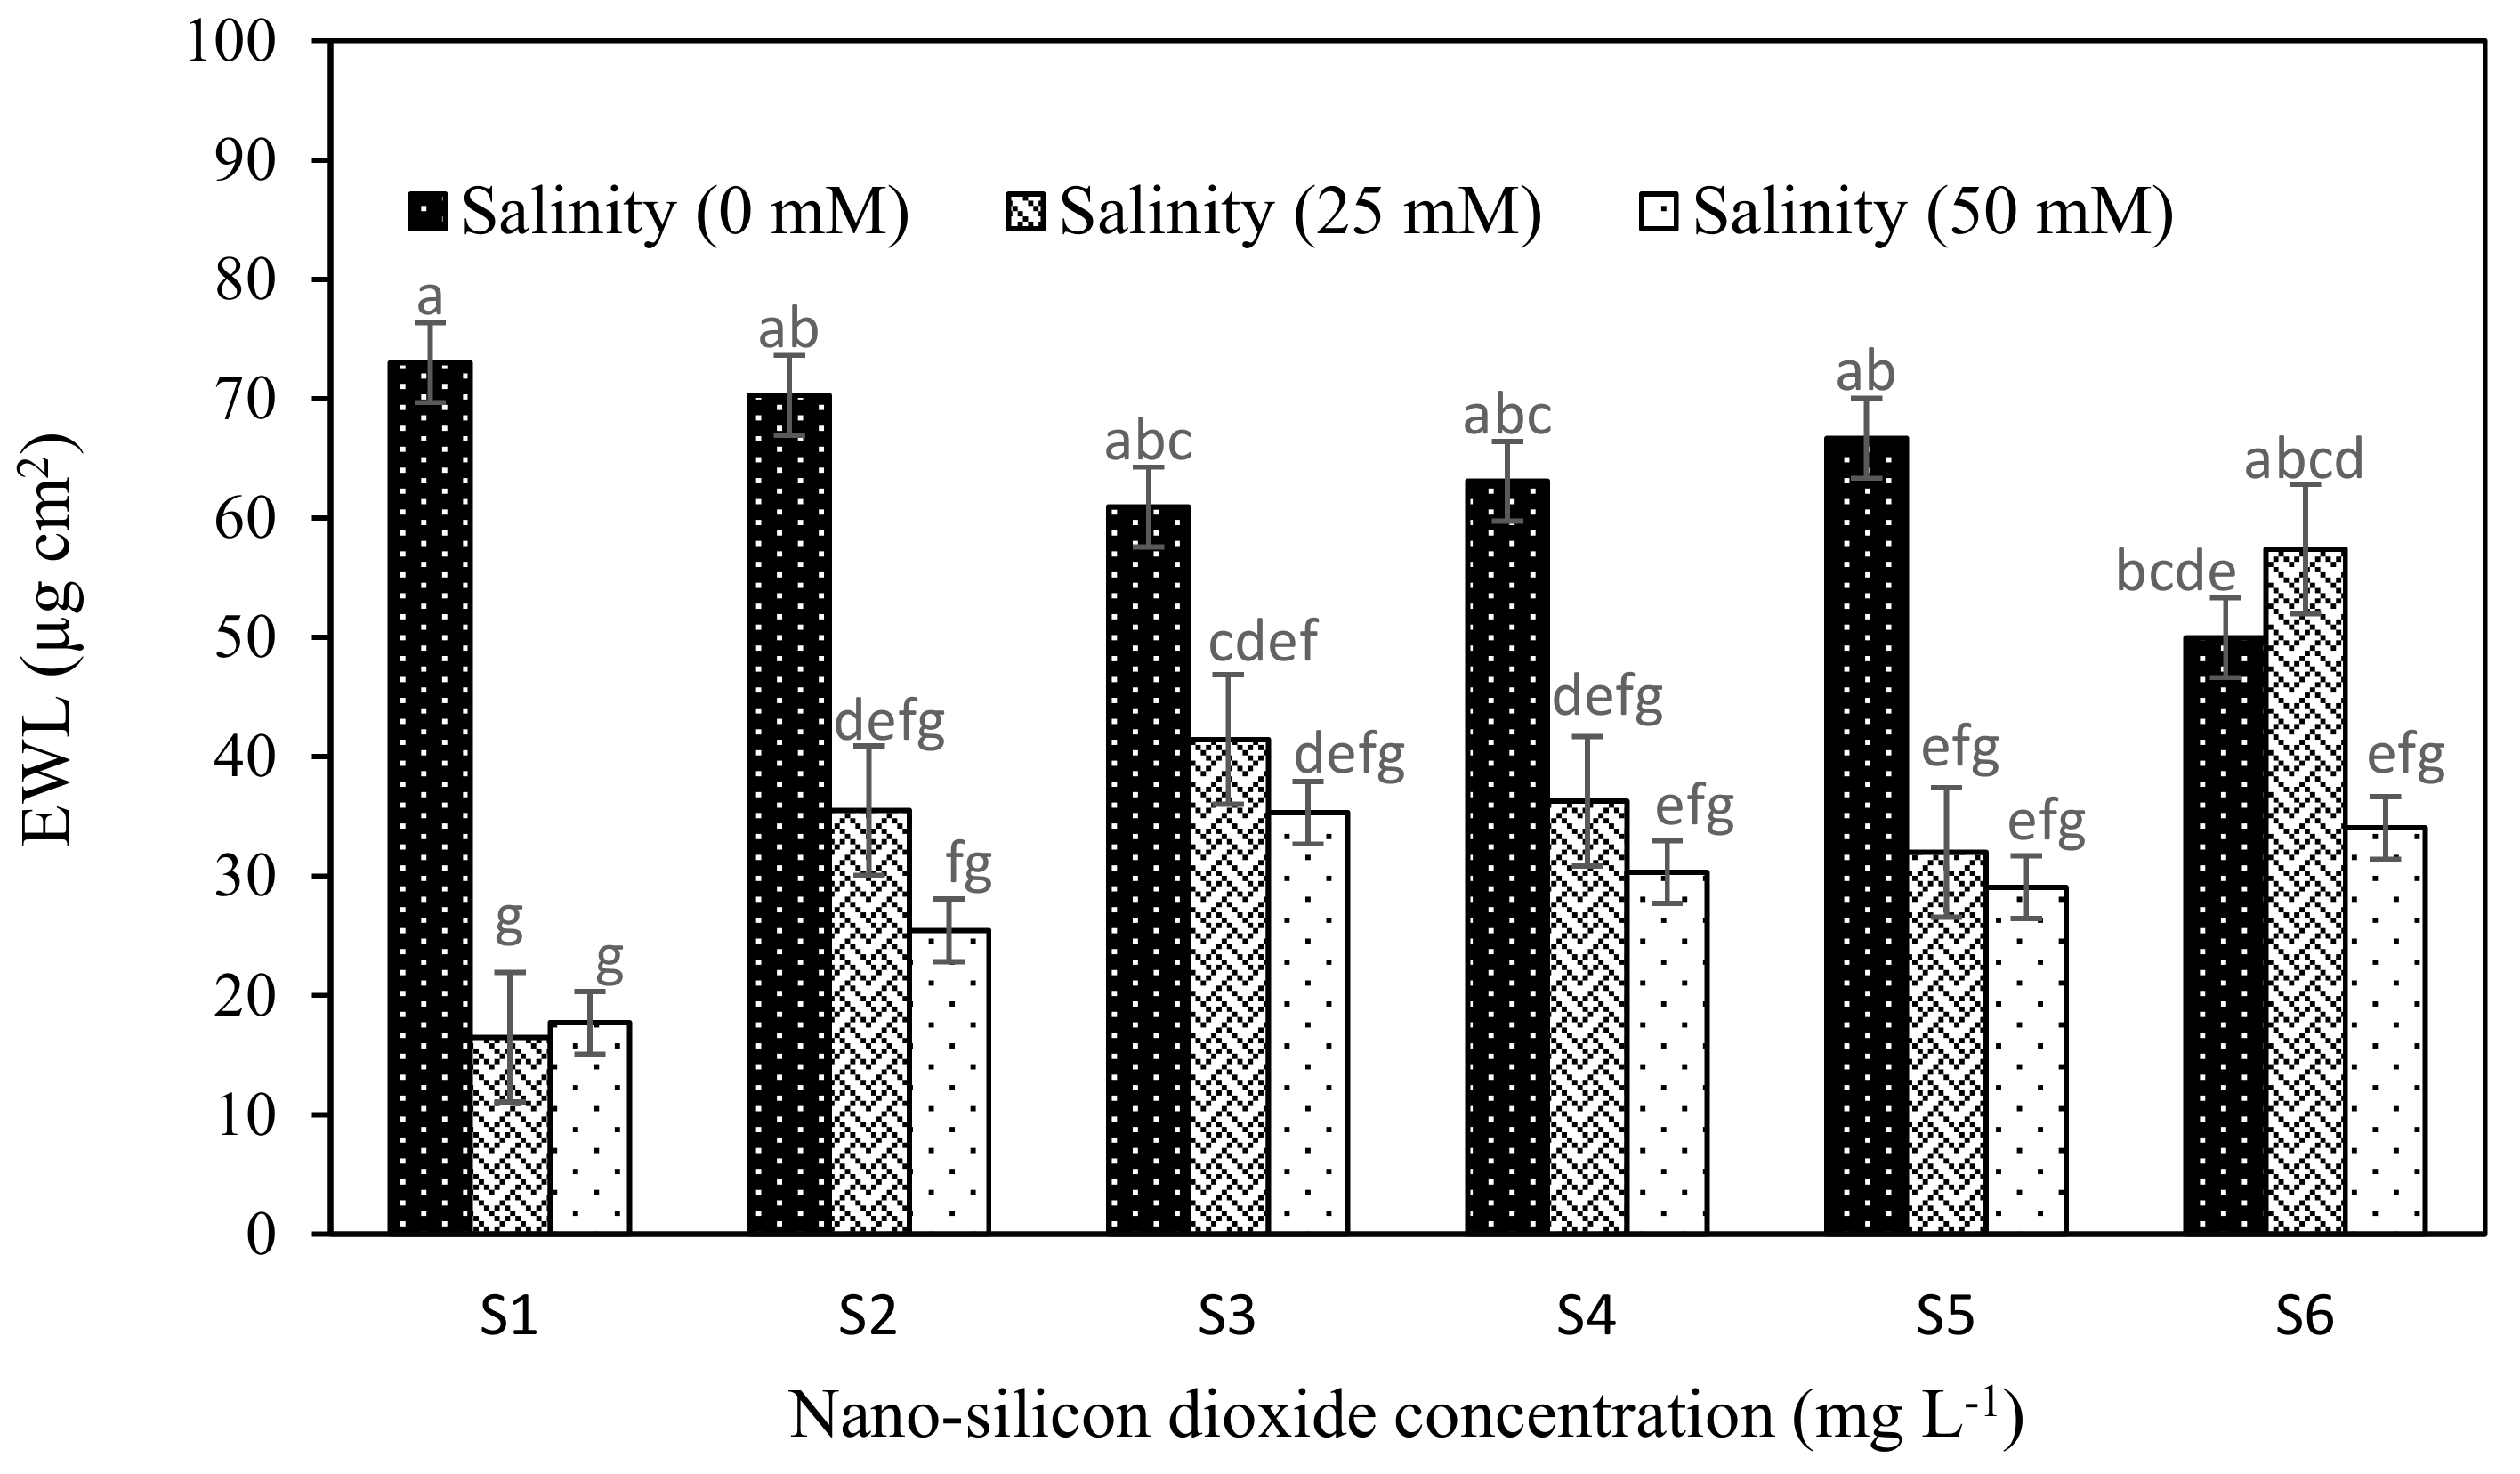
There were differences in the epicuticular wax layer and proline content of salt and nSiO2 treated plants (Figure 1 and Figure 2). The epicuticular wax layer (EWL) was significantly reduced in strawberry plants when exposed to salt stress relative to controls (no NaCl). EWL was low when plants were exposed to 25 and 50 mM NaCl compared to controls (no NaCl) (Table 4). NSiO2 treated plants had higher EWL than controls (no nSiO2). The highest EWL observed was in plants that received 100 mgL−1 nSiO2 before flowering and 50 mg L−1 thereafter (Si6).
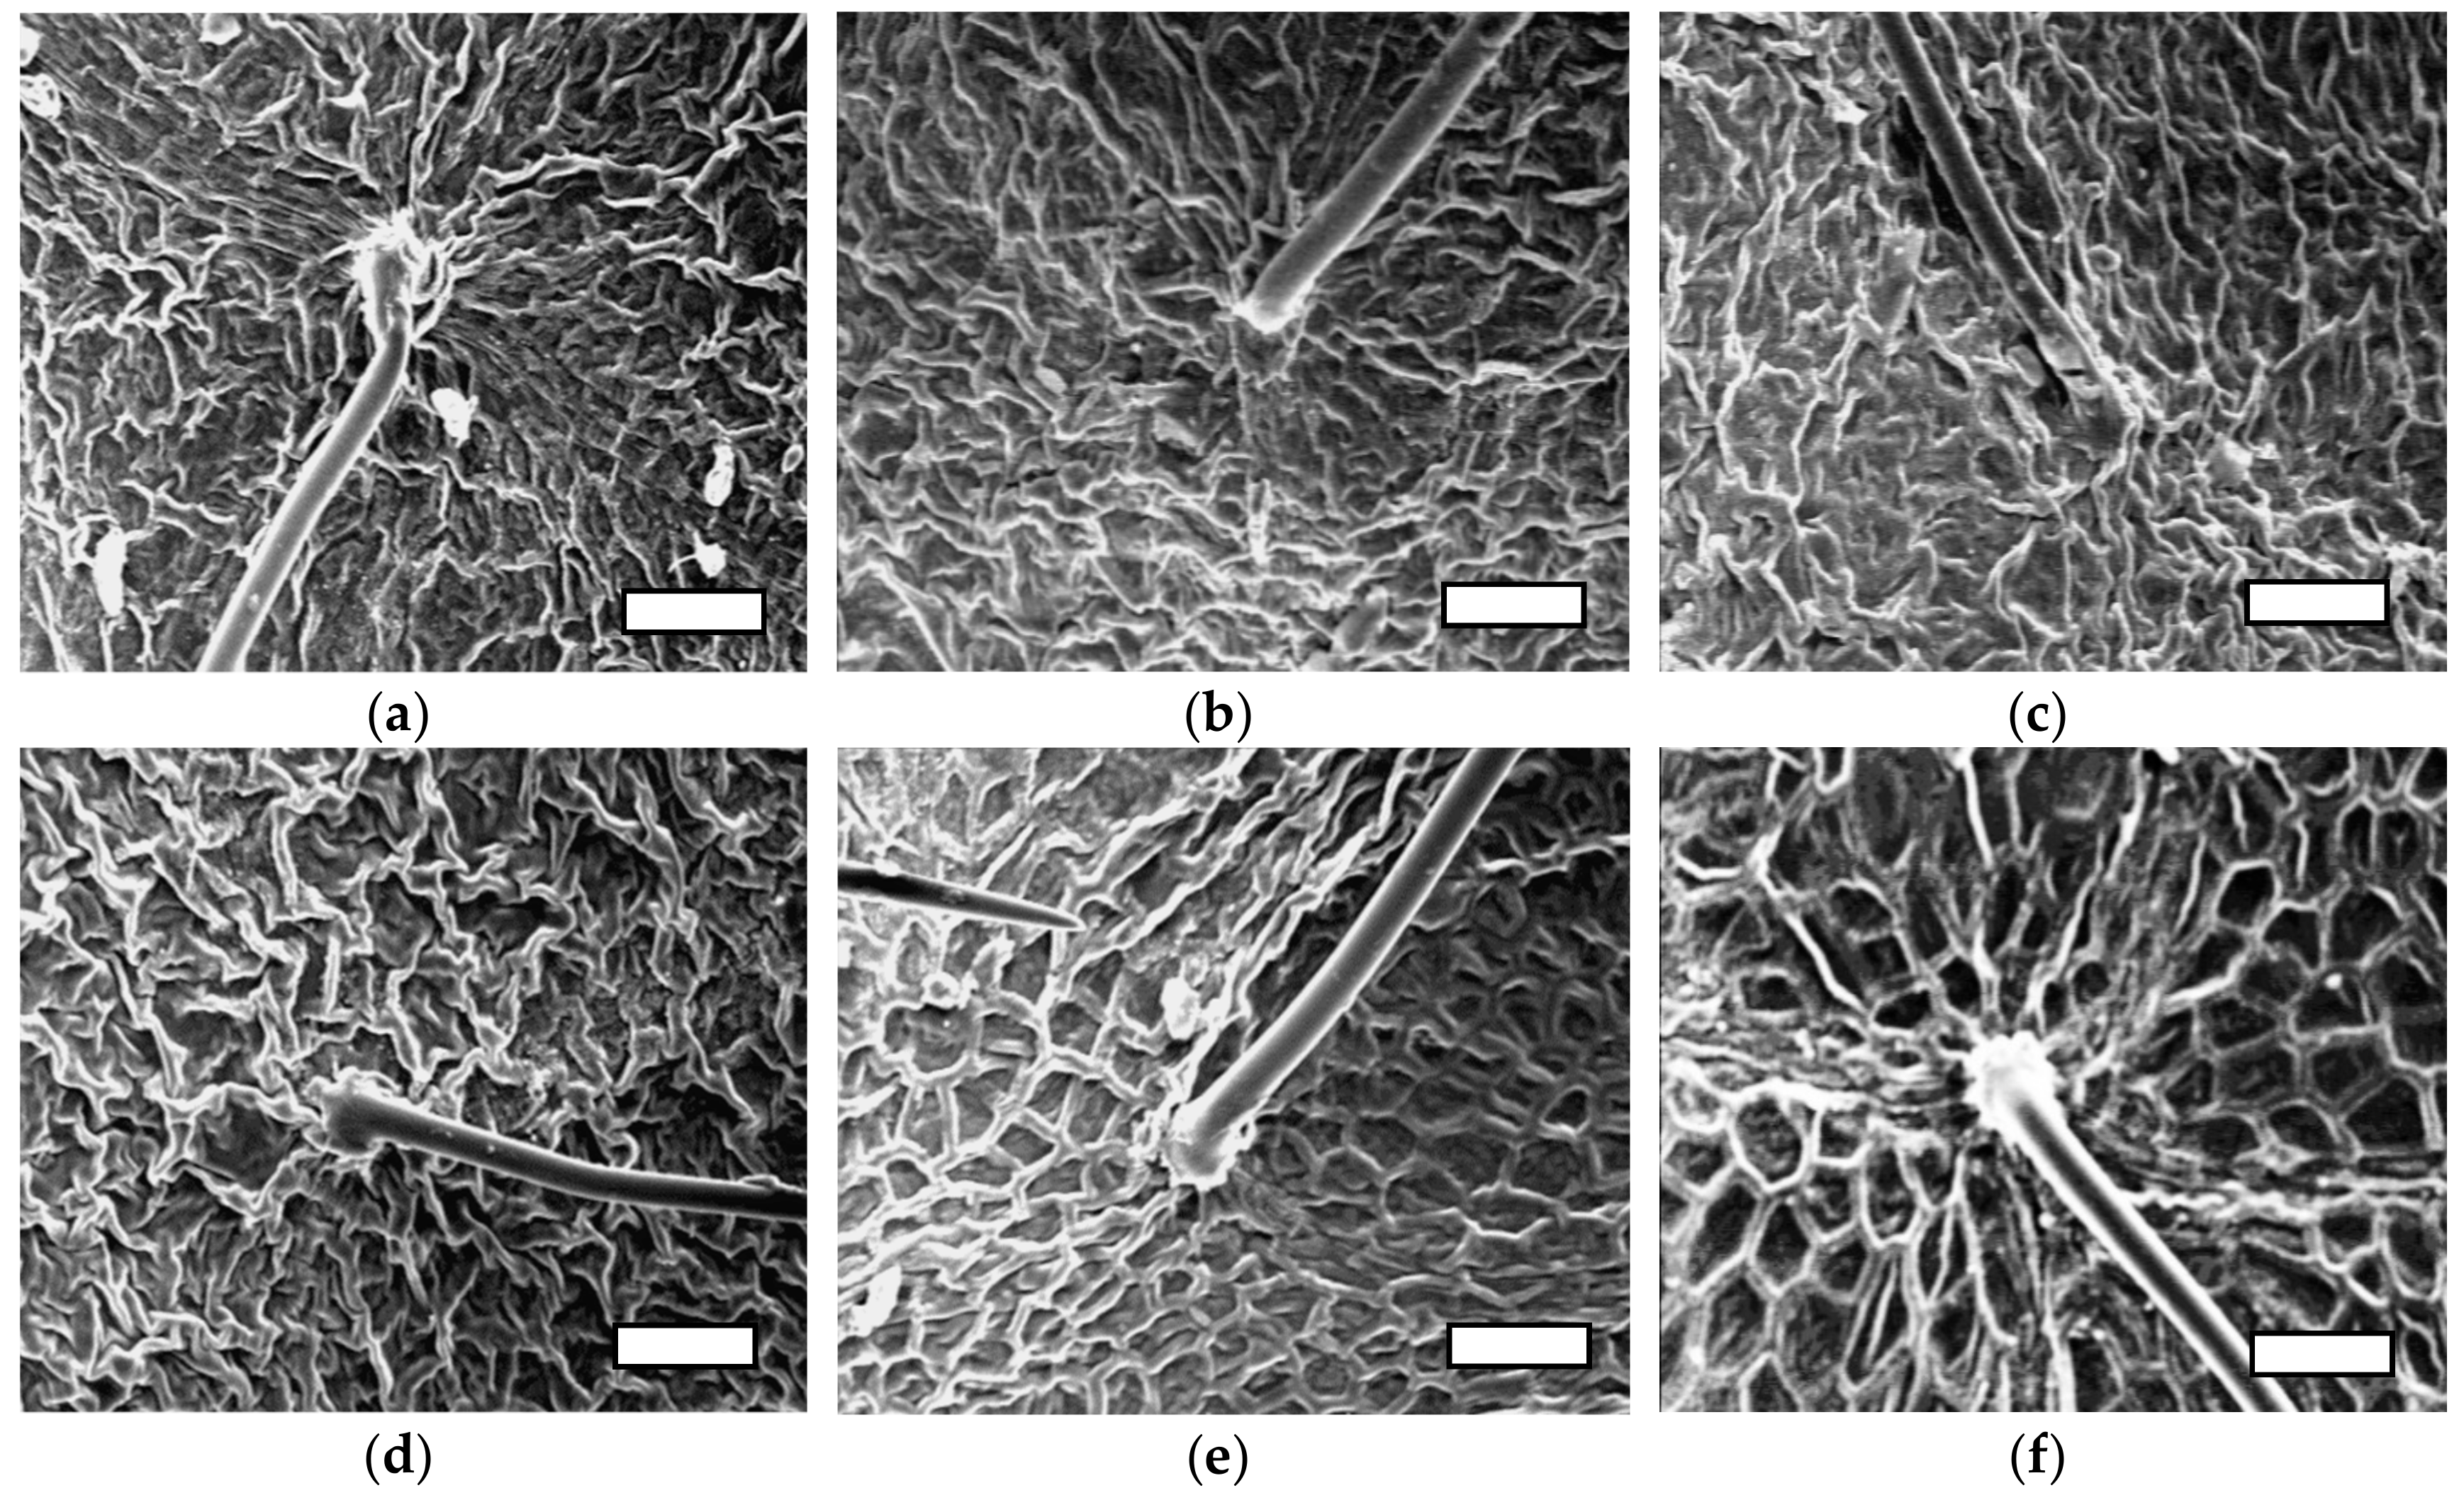
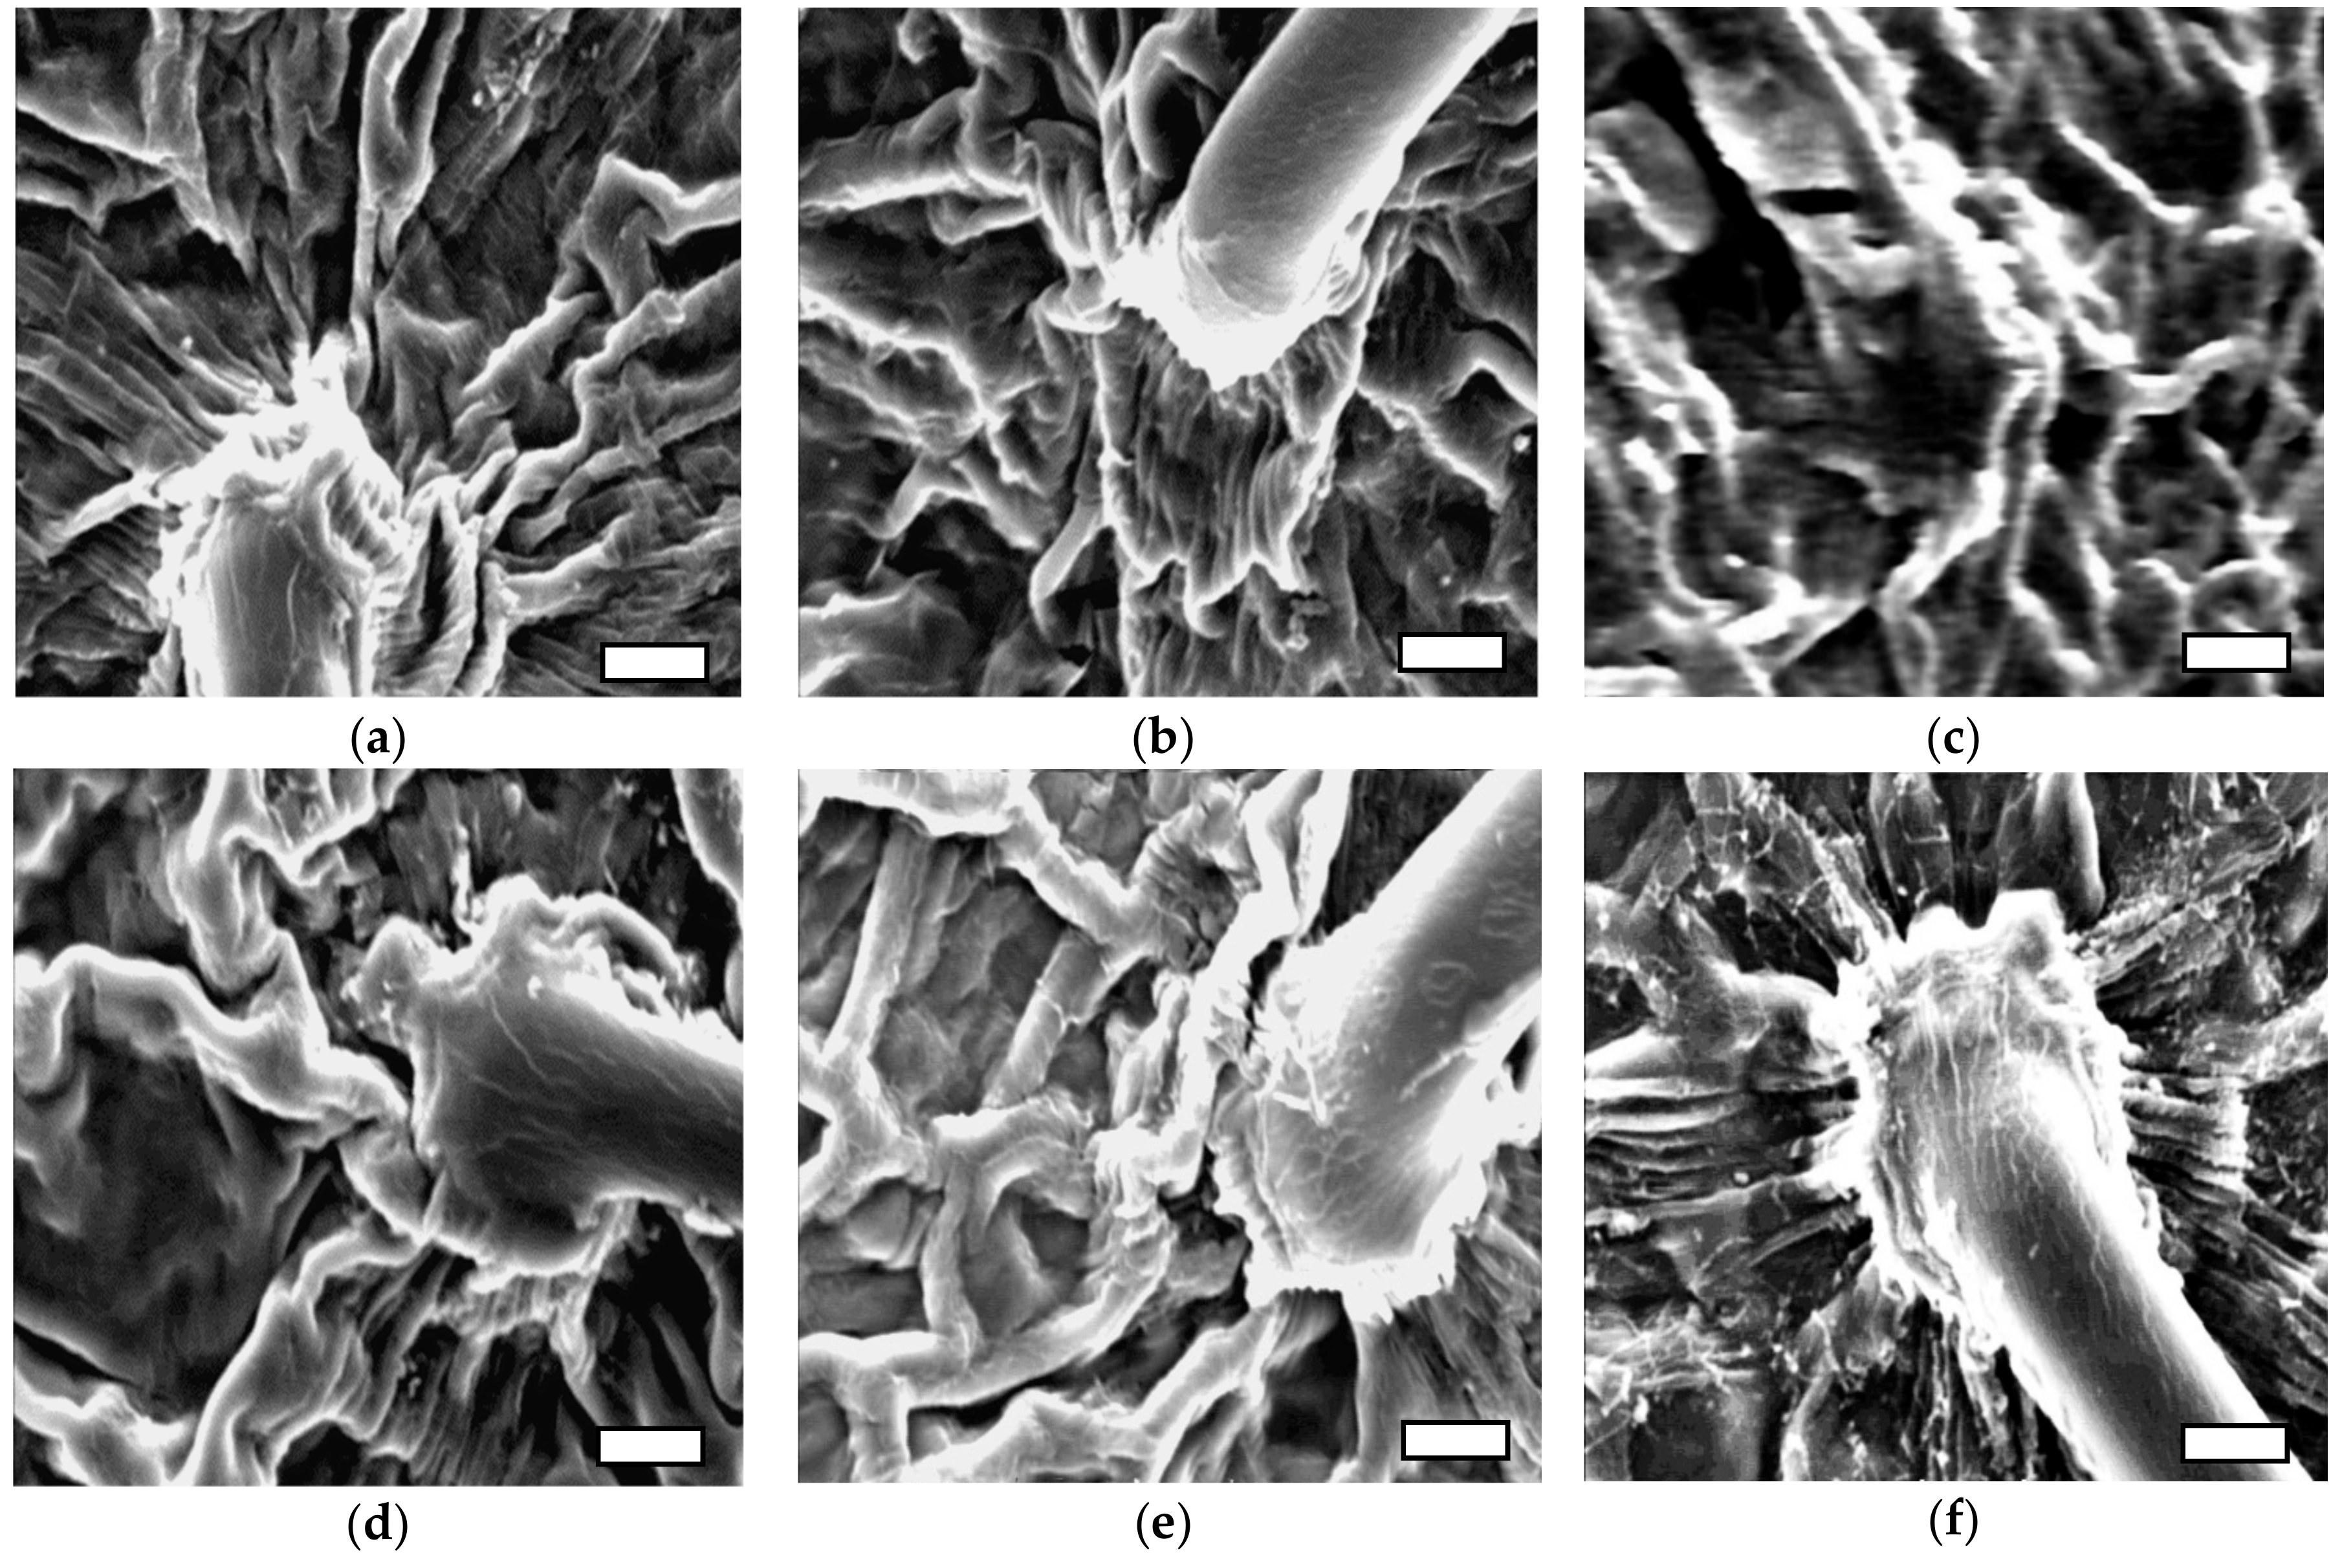
To further investigate the quantitative differences in EWL (Table 4; Figure 2) imaging techniques were used to check for qualitative differences EWL (Figure 3 and Figure 4). The interaction effect of nSiO2 and salinity on EWL had revealed that salinity treatments (25 and 50 mM) significantly reduced EWL both in control (no nSiO2) and nSiO2 treated strawberry plants except for the plants pre-treated with 100 mg L−1 nSiO2 before BBCH: 61 and 50 mg L−1 after BBCH: 61. This treatment increased EWL under salinity stressed conditions especially when plants were exposed to moderate stress (Figure 2, Figure 3 and Figure 4). The scanning electron microscopic (SEM) images revealed that there were two forms of wax crystals on the strawberry leaf surface; regular (rougher) like a spider web structure and irregular (smoother) crystals. In the non-stressed conditions, leaf surfaces were covered with irregular-shaped wax crystals and formed a dense network. The size of the wax crystal was thicker and a less dense network was observed in plants treated with NaCl in comparison to controls (no NaCl). The crystal was deposited in the epicuticle layer when plants were treated with nSiO2, and this appeared to result in an increase in thickness in the wax crystal under stress conditions. Additionally, a crystal structure with sparser arrangements of plate-shaped wax under salt stress conditions was observed, suggesting a decrease in the total number of crystalloids present per unit area compared to control (no NaCl). Notable changes in wax morphology occurred in plants treated with 50 mM NaCl. Overall, the results clearly showed that as salinity increased epicuticular wax crystals, displayed morphology changes at the strawberry leaf surface (Figure 3 and Figure 4).
4. Discussion
Differences in morphological, physiological and biochemical characteristics, such as shoot and root fresh weight and dry weight, RWC, EWL, RWL, cuticle transpiration, and MSI, and proline content and canopy temperature were observed in strawberry plants treated with different combinations of salinity and nano-silicon dioxide treatments. Application of nSiO2 reduced the negative effects of salinity and improved vegetative growth of strawberry plants (Table 2, Table 3, Table 4 and Table 5). These findings are consistent with previous reports for similar studies in other plant species (Figure 5), which demonstrated that nSiO2 increased proliferation of apple (Malus pumila Borkh) explants under non-stressed or osmotic-stressed conditions [21,30]. The application of silicon was also shown to increase root growth of rice (Oryza sativa L.) plants under drought stress conditions [31]; and an increase in Si-mediated root growth was observed in sorghum (Sorghum bicolor) under drought stress [32]. However, root growth recovery with silicon treatments after salt stress has not always been observed. For example, positive effects have been reported for silicon treatments, on the shoot growth of wheat (Triticum aestivum L.), but without obvious effect on the roots [33]; and similar observations were made for cucumber plants [34].
The beneficial effect of nSiO2 in relation to improving germination of soybean (Glycine max) seeds was suggested to be related to increasing nitrate reductase activity [35], and was linked to plants ability to uptake and use water and nutrition by seeds [36]. Another suggestion as to the benefits of silicon or nano-silicon for plants grown under stressful conditions relates to increased photosynthetic rate, stomatal conductivity, and water use efficiency; traits which then improve the tolerance to salinity of tomato plants [37]. Here we observe and explore a possible association between nSiO2 treatment, epicuticular wax, and proline accumulation.
Proline is an osmolyte that usually accumulates under stress conditions and plays an important role in osmotic adjustment in plants [38]. It has been reported that the proline content of wheat leaves increased under water stress conditions, while the addition of silicon decreased proline accumulation, consistent with proline accumulation being linked as a sign of stress damage in experimental conditions [39]. The proline content in sorghum plants under drought stress conditions decreased significantly, while sugar contents in the roots were reported to be increased by silicon treatments [32]. Si application in soybean plants has been reported to cause a reduction in proline content under drought stress [40]. Proline has been considered as a possible carbon and nitrogen source for rapid recovery from stress, a stabilizer for membranes and some macromolecules, and also a free radical scavenger [41]. For example proline content increased in maize seedlings when exposed to salinity treatments, but decreased with Si plus NaCl treatments [42]; and in this example Si may provide a protective role helping to prevent lipid peroxidation induced by NaCl, because this was significantly lower in the Si-treated maize seedlings under salt stress than those under salt stress without Si treatment [42]. Both epicuticular wax and proline content have been reported to be significantly increased during water deficit conditions [43]. But in the current study, proline content increased and epicuticular wax (EWL) decreased in strawberry plants when exposed to salt stress. In this study moderate salt stress (25 mM) when followed by 100 mg L−1 nSiO2 before BBCH: 61 and 50 mg L−1 after BBCH: 61 significantly increased EWL (Table 5; Figure 2).
The role of silicon in regulating the water status of plants is of interest, particularly in the context that the initial reduction of the growth of plants under salt stress is due to the osmotic effect of the salt [44]. The researchers found that RWC increased in response to silicon treatments under stress conditions, not only by reducing transpiration rate through the deposition of silicon in leaf and stem epidermis cells, but also by increasing potassium absorbance and translocation to stomatal guard cells, where potassium influences stomatal conductivity [45,46]. It has been suggested that Si can increase plants water content under salinity stress, due to findings that Si reduced the osmotic potential (more negative) and increased turgor pressure of tomato leaves under salt stress [47]. In this study, RWC of strawberry plants when treated with nSiO2 was higher than that of control plants (Table 3). This observation is consistent with previous reports indicating that RWC in wheat plants was significantly lower under stress conditions, and adding silicon nutrition completely restored RWC to the levels observed in the non-stress plants [48,49]. Similar effects of silicon on RWC of leaf beans were reported for plants grown in hydroponic culture [50]. Overcoming the osmotic stress and physiological deficiency of conditions where water is limited is one of the most important adaptation strategies of plants under salinity conditions. The research on the influence of silicon has shown that it can significantly improve the outcome for salt stressed plants, and the mode of action may be in preventing the loss of water from plants by reducing the rate of transpiration [51].
In the current work, we observed that the membrane stability index (MSI) was markedly decreased by salt stress. Previously it has been shown that strawberry plants under salinity accumulated more H2O2 compared to control plants, and a combination of salinity with silicon nutrition via the nutrient solution significantly ameliorated the impact of salinity on membrane integrity, lipid peroxidation and H2O2 content [52].
The results of this study showed that canopy temperature of strawberry plants increased under salt stress. Previous studies revealed that lower canopy temperature genotypes appear to exhibit better tolerance to drought stress; for example, in water stress conditions, increases in canopy temperature were observed in wheat (Triticum aestivum L. and T. durum L.) [53] and cowpea (Vigna unguiculata L.) varieties [54]. We suggest that for strawberry plants limited water availability under salt stress conditions results in rising canopy temperatures. Given the fact that the temperature, amount of light and moisture content affect the morphology of leaf wax, and since variability in these factors coincide, it is difficult to detect their individual effects [55]. However, plants with well-developed layers of epicuticular wax showed lower leaf and canopy temperatures, reduced rates of transpiration, and improved water status as compared to control, and also plants adapted to hot climatic conditions possess a thick cuticle with reduced transpiration rates [56].
Silicon application may reduce the loss of water through the cuticle due to silica deposition underlying epidermal cells of leaf and stem plants influencing water loss [46]. The formation of a silica- cuticle double layer on leaf epidermal cells may be effective in altering leaf transpiration and water loss from the leaf surface could be limited due to Si deposition [57]. Si accumulates in the epidermal tissues, and a layer of cellulose matrix-Si is created when calcium and pectin are present, which provides protection to the plant [58]. Silicification occurs in the endodermis in parts of roots of gramineae during maturation; and in the cell walls of other tissues including vascular, epidermal, and cortical cells in older roots; and in shoots including hull and leaf sheath, as well as in the inflorescence [58].
Results of an investigation on rice showed that a layer of deposited Si (2.5 μm) is formed under cuticle with a double layer of Si-cuticle in the leaf blades [59]. Results of other studies revealed that the silicified structures were found on cell wall epidermal surfaces as separate rosettes and knobs sheltered in spicules, also silicon deposition on surfaces has effects on stem (3–7 mm) and leaf (0.2–1.0) thickness [58]. Silicon is absorbed in roots, and transported passively through the transpiration stream and deposited in beneath the cuticle, forming a cuticle-silica double layer [60]. It was suggested that this physical barrier delayed and reduced the penetration of fungus in rice leaves, cucumber, melon (Cucumis melo L) and pumpkin (Cucurbita pepo L.), and vine seedlings [61].
In the current study, nSiO2 application was associated with strawberry plants maintaining higher chlorophyll content under saline conditions. Therefore, addition of nSiO2 in nutrient solutions could help alleviate the negative effects of NaCl on chlorophyll content in strawberry. Inhibition of chlorophyll biosynthesis, and acceleration of its degradation and oxidative damage induced by salinity could be considered as reasons for the declining chlorophyll content [52]. Further research is needed to explore the influence of silicon on the biosynthesis of new chlorophyll and the protection of existing chlorophyll against salinity-induced oxidative stress [52]. Previous studies showed that salt stress in cowpea, kidney bean (Phaseolus vulgaris L.), faba bean (Vicia faba L.) and soybean caused significant reductions in plant growth, but Si supplementation greatly improved the growth of these plants by increasing total photosynthetic pigments and photosynthetic rate, chlorophyll content, stomatal conductance, transpiration, and intercellular carbon dioxide concentration [62].
5. Conclusions
Salinity stress treatments were detrimental to morphological and physiological parameters of strawberry plants. In this study, nSiO2 treatments suppressed the negative effects of salinity, possibly by improving the Epicuticular Wax Layer (EWL); and nSiO2 treatments enabled salt stressed plants to better maintain their chlorophyll content and leaf relative water content (RWC) and relative water protection (RWP) relative to controls (no SiO2). Observations were made that are relevant to improving strawberry productivity in both saline and control (no added NaCl) conditions, in particular, the data indicated that application of 50 mg L−1 nSiO2 before stage ‘BBCH:61’ increased root growth, and that treatments with 100 mg L−1 nSiO2 positively influenced strawberry plant growth rate and productivity (Table 2). We conclude by suggesting three possible directions for future research: (1) Further exploring how variation in the timing of silicon treatments influences EWL deposition by testing EWL at multiple plant developmental stages; (2) investigation of whether there is genetic variation for EWL deposition in strawberry; and (3) testing to distinguish the benefit of greater EWL deposition in saline conditions relative to the benefit of the other signalling and physiological changes that are linked to increased silicon uptake (Figure 5).
Author Contributions
Conceptualization, S.A., M.G., and M.E.; Methodology, S.A.; Formal analysis, S.A., M.G., M.E., C.S.B.; Investigation, S.A.; Data curation, S.A.; Writing—Original draft preparation, S.A.; Writing—Review and editing, S.A. and C.S.B.; Supervision, M.G. and M.E.
Funding
This research was funded by Iran Nanotechnology Innovation Council (INIC) under the grant number of 116399, the University of Guilan under the grant number of 1397/2690481881 and also partially was funded by Hasan Ebrahimzade Maboud’s Charity Fund.
Conflicts of Interest
The authors declare no conflict of interest. The funders had no role in the design of the study; in the collection, analyses, or interpretation of data; in the writing of the manuscript, or in the decision to publish the results.
References
- Gómez-del-Campo, M.; Baeza, P.; Ruiz, C.; Lissarrague, J.R. Water-stress induced physiological changes in leaves of four container-grown grapevine cultivars (Vitis vinifera L.). VITIS J. Grapevine Res. 2015, 43, 99. [Google Scholar]
- Azizinya, S.; Ghanadha, M.R.; Zali, A.A.; Samadi, B.Y.; Ahmadi, A. An evaluation of quantitative traits related to drought resistance in synthetic wheat genotypes in stress and non-stress conditions. Iran. J. Agric. Sci. 2005, 36, 281–293. [Google Scholar]
- Malakuti, M.J.; Keshavarz, P.; Karimian, N. Comprehensive Diagnosis and Optimal Fertilizer Recommendation for Sustainable Agriculture; Tarbiat Modares University Press: Tehran, Iran, 2008; p. 132. [Google Scholar]
- Sun, Y.; Niu, G.; Wallace, R.; Masabni, J.; Gu, M. Relative Salt Tolerance of Seven Strawberry Cultivars. Horticulturae 2015, 1, 27–43. [Google Scholar]
- Rousseau-Gueutin, M.; Lerceteau-Köhler, E.; Barrot, L.; Sargent, D.J.; Monfort, A.; Simpson, D.; Arús, P.; Guérin, G.; Denoyes-Rothan, B. Comparative genetic mapping between octoploid and diploid fragaria species reveals a high level of colinearity between their genomes and the essentially disomic behavior of the cultivated octoploid strawberry. Genetics 2008, 179, 2045–2060. [Google Scholar] [CrossRef] [PubMed]
- Flam-Shepherd, R.; Huynh, W.Q.; Coskun, D.; Hamam, A.M.; Britto, D.T.; Kronzucker, H.J. Membrane fluxes, bypass flows, and sodium stress in rice: The influence of silicon. J. Exp. Bot. 2018, 69, 1679–1692. [Google Scholar] [CrossRef]
- Bao-Shan, L.; Shao-Qi, D.; Chun-Hui, L.; Li-Jun, F.; Shu-Chun, Q.; Min, Y. Effect of TMS (nanostructured silicon dioxide) on growth of Changbai larch seedlings. J. For. 2004, 15, 138–140. [Google Scholar] [CrossRef]
- Alva, A.K.; Mattos, D.; Paramasivam, S.; Patil, B.; Dou, H.; Sajwan, K.S. Potassium Management for Optimizing Citrus Production and Quality. Int. J. Fruit Sci. 2006, 6, 3–43. [Google Scholar] [CrossRef]
- Gao, X.; Zou, C.; Wang, L.; Zhang, F. Silicon Decreases Transpiration Rate and Conductance from Stomata of Maize Plants. J. Plant Nutr. 2006, 29, 1637–1647. [Google Scholar] [CrossRef]
- Gao, X.; Zou, C.; Wang, L.; Zhang, F. Silicon Improves Water Use Efficiency in Maize Plants. J. Plant Nutr. 2005, 27, 1457–1470. [Google Scholar] [CrossRef]
- Naranjo, E.M.; Andrades-Moreno, L.; Davy, A.J. Silicon alleviates deleterious effects of high salinity on the halophytic grass Spartina densiflora. Plant Physiol. Biochem. 2013, 63, 115–121. [Google Scholar] [CrossRef] [PubMed]
- Ahmed, M.; Kamran, A.; Asif, M.; Qadeer, U.; Ahmed, Z.I.; Goyal, A. Silicon priming: A potential source to impart abiotic stress tolerance in wheat: A review. Aust. J. Crop Sci. 2013, 7, 484. [Google Scholar]
- Shi, Y.; Wang, Y.; Flowers, T.J.; Gong, H. Silicon decreases chloride transport in rice (Oryza sativa L.) in saline conditions. J. Plant Physiol. 2013, 170, 847–853. [Google Scholar] [CrossRef]
- Agarie, S. Effect of silicon on growth, dry matter production and photosynthesis in rice plants. Crop Prod. Improv. Tech. Asia 1993, 225–234. [Google Scholar]
- Prasad, T.; Sudhakar, P.; Sreenivasulu, Y.; Latha, P.; Munaswamy, V.; Reddy, K.R.; Sreeprasad, T.S.; Sajanlal, P.R.; Pradeep, T. Effect of nanoscale zinc oxide particles on the germination, growth and yield of peanut. J. Plant Nutr. 2012, 35, 905–927. [Google Scholar] [CrossRef]
- Wang, L.-J.; Wang, Y.-H.; Li, M.; Fan, M.-S.; Zhang, F.-S.; Wu, X.-M.; Yang, W.-S.; Li, T.-J. Synthesis of ordered biosilica materials. Chin. J. Chem. 2002, 20, 107–110. [Google Scholar] [CrossRef]
- Samuels, A.L. The Effects of Silicon Supplementation on Cucumber Fruit: Changes in Surface Characteristics. Ann. Bot. 1993, 72, 433–440. [Google Scholar] [CrossRef]
- Jenks, M.A.; Ashworth, E.N. Plant epicuticular waxes: Function, production, and genetics. Hortic. Rev. 1999, 23, 1–68. [Google Scholar]
- González, A.; Ayerbe, L. Effect of terminal water stress on leaf epicuticular wax load, residual transpiration and grain yield in barley. Euphytica 2010, 172, 341–349. [Google Scholar] [CrossRef]
- Cameron, K.D.; Teece, M.A.; Smart, L.B. Increased accumulation of cuticular wax and expression of lipid transfer protein in response to periodic drying events in leaves of tree tobacco. Plant Physiol. 2006, 140, 176–183. [Google Scholar] [CrossRef]
- Abdi, S.; Abbaspur, N.; Avestan, S.; Barker, A.V. Physiological responses of two grapevine (Vitis vinifera L.) cultivars to CycocelTM treatment during drought. J. Hortic. Sci. Biotechnol. 2016, 91, 211–219. [Google Scholar] [CrossRef]
- Hasheminasab, H.; Assad, M.T.; Aliakbari, A.; Sahhafi, S.R. Evaluation of some physiological traits associated with improved drought tolerance in Iranian wheat. Annu. Biol. Res. 2012, 3, 1719–1725. [Google Scholar]
- Yang, R.-C.; Jana, S.; Clarke, J.M. Phenotypic Diversity and Associations of Some Potentially Drought-responsive Characters in Durum Wheat. Crop. Sci. 1991, 31, 1484–1491. [Google Scholar] [CrossRef]
- Sairam, R.K. Effect of moisture-stress on physiological activities of two contrasting wheat genotypes. Indian J. Exp. Biol. 1994, 32, 594. [Google Scholar]
- David, M. Osmotic adjustment capacity and cuticular transpiration in several wheat cultivars cultivated in Algeria. Rom. Agric. Res. 2009, 26, 29–33. [Google Scholar]
- Dong, B.; Shi, L.; Shi, C.; Qiao, Y.; Liu, M.; Zhang, Z. Grain yield and water use efficiency of two types of winter wheat cultivars under different water regimes. Agric. Water Manag. 2011, 99, 103–110. [Google Scholar] [CrossRef]
- Åström, H.; Metsovuori, E.; Saarinen, T.; Lundell, R.; Hänninen, H. Morphological characteristics and photosynthetic capacity of Fragaria vesca L. winter and summer leaves. Flora Morphol. Distrib. Funct. Ecol. Plants 2015, 215, 33–39. [Google Scholar] [CrossRef]
- Li, X.-W.; Jiang, J.; Zhang, L.-P.; Yu, Y.; Ye, Z.-W.; Wang, X.-M.; Zhou, J.-Y.; Chai, M.-L.; Zhang, H.-Q.; Arus, P.; et al. Identification of volatile and softening-related genes using digital gene expression profiles in melting peach. Tree Genet. Genomes 2015, 11. [Google Scholar] [CrossRef]
- Bates, L.S.; Waldren, R.P.; Teare, I.D. Rapid determination of free proline for water-stress studies. Plant Soil 1973, 39, 205–207. [Google Scholar] [CrossRef]
- Avestan, S.; Naseri, L.; Barker, A.V. Evaluation of nanosilicon dioxide and chitosan on tissue culture of apple under agar-induced osmotic stress. J. Plant Nutr. 2017, 40, 2797–2807. [Google Scholar] [CrossRef]
- Chen, W.; Yao, X.; Cai, K.; Chen, J. Silicon alleviates drought stress of rice plants by improving plant water status, photosynthesis and mineral nutrient absorption. Biol. Trace Elem. Res. 2011, 142, 67–76. [Google Scholar] [CrossRef]
- Yin, L.; Wang, S.; Liu, P.; Wang, W.; Cao, D.; Deng, X.; Zhang, S. Silicon-mediated changes in polyamine and 1-aminocyclopropane-1-carboxylic acid are involved in silicon-induced drought resistance in Sorghum bicolor L. Plant Physiol. Biochem. 2014, 80, 268–277. [Google Scholar] [CrossRef] [PubMed]
- Gong, H.; Chen, K.; Chen, G.; Wang, S.; Zhang, C. Effects of Silicon on Growth of Wheat Under Drought. J. Plant Nutr. 2003, 26, 1055–1063. [Google Scholar] [CrossRef]
- Hattori, T.; Sonobe, K.; Inanaga, S.; An, P.; Morita, S. Effects of Silicon on Photosynthesis of Young Cucumber Seedlings Under Osmotic Stress. J. Plant Nutr. 2008, 31, 1046–1058. [Google Scholar] [CrossRef]
- Lu, C.; Zhang, C.; Wen, J.; Wu, G.; Tao, M. Research of the effect of nanometer materials on germination and growth enhancement of Glycine max and its mechanism. Soybean Sci. 2001, 21, 168–171. [Google Scholar]
- Zheng, L.; Hong, F.; Lu, S.; Liu, C. Effect of Nano-TiO2 on Strength of Naturally Aged Seeds and Growth of Spinach. Boil. Trace Elem. Res. 2005, 104, 083–092. [Google Scholar] [CrossRef]
- Haghighi, M.; Pessarakli, M. Influence of silicon and nano-silicon on salinity tolerance of cherry tomatoes (Solanum lycopersicum L.) at early growth stage. Sci. Hortic. 2013, 161, 111–117. [Google Scholar] [CrossRef]
- Nayyar, H.; Walia, D. Water Stress Induced Proline Accumulation in Contrasting Wheat Genotypes as Affected by Calcium and Abscisic Acid. Boil. Plant. 2003, 46, 275–279. [Google Scholar] [CrossRef]
- Pei, Z.; Ming, D.F.; Liu, D.; Wan, G.L.; Geng, X.X.; Gong, H.J.; Zhou, W.J. Silicon improves the tolerance to water-deficit stress induced by polyethylene glycol in wheat (Triticum aestivum L.) seedlings. J. Plant Growth Regul. 2010, 29, 106–115. [Google Scholar] [CrossRef]
- Lee, S.K.; Sohn, E.Y.; Hamayun, M.; Yoon, J.Y.; Lee, I.J. Effect of silicon on growth and salinity stress of soybean plant grown under hydroponic system. Agrofor. Syst. 2010, 80, 333–340. [Google Scholar] [CrossRef]
- Jain, M.; Mathur, G.; Koul, S.; Sarin, N. Ameliorative effects of proline on salt stress-induced lipid peroxidation in cell lines of groundnut (Arachis hypogaea L.). Plant Cell Rep. 2001, 20, 463–468. [Google Scholar] [CrossRef]
- Moussa, H.R. Influence of exogenous application of silicon on physiological response of salt-stressed maize (Zea mays L.). Int. J. Agric. Biol. 2006, 8, 293–297. [Google Scholar]
- Surendar, K.K.S.K.K.; Devi, D.D.D.D.D.; Ravi, I.R.I.; Jeyakumar, P.J.P.; Kumar, S.R.K.S.R.; Velayudham, V.K. Impact of water deficit on epicuticular wax, proline and free amino acid content and yield of banana cultivars and hybrids. Plant Gene Trait 2013, 4. [Google Scholar] [CrossRef]
- Zhu, J.-K. Salt and Drought Stress Signal Transduction in Plants. Annu. Rev. Plant Boil. 2002, 53, 247–273. [Google Scholar] [CrossRef]
- Marafon, A.C.; Endres, L. Silicon: Fertilization and nutrition in higher plants. Rev. Cienc. Amazon. J. Agric. Environ. Sci. 2013. [Google Scholar] [CrossRef]
- Liang, Y.; Nikolic, M.; Bélanger, R.; Gong, H.; Song, A. Silicon in Agriculture: From Theory to Practice; Springer: New York, NY, USA, 2015; p. 235. [Google Scholar]
- Romero-Aranda, M.R.; Jurado, O.; Cuartero, J. Silicon alleviates the deleterious salt effect on tomato plant growth by improving plant water status. J. Plant Physiol. 2006, 163, 847–855. [Google Scholar] [CrossRef]
- Tuna, A.L.; Kaya, C.; Higgs, D.; Murillo-Amador, B.; Aydemir, S.; Girgin, A.R. Silicon improves salinity tolerance in wheat plants. Environ. Exp. Bot. 2008, 62, 10–16. [Google Scholar] [CrossRef]
- Tahir, M.A.; Aziz, T.; Farooq, M.; Sarwar, G. Silicon-induced changes in growth, ionic composition, water relations, chlorophyll contents and membrane permeability in two salt-stressed wheat genotypes. Arch. Agron. Soil Sci. 2012, 58, 247–256. [Google Scholar] [CrossRef]
- Zuccarini, P. Effects of silicon on photosynthesis, water relations and nutrient uptake of Phaseolus vulgaris under NaCl stress. Boil. Plant. 2008, 52, 157–160. [Google Scholar] [CrossRef]
- Savant, N.K.; Korndörfer, G.H.; Datnoff, L.E.; Snyder, G.H. Silicon nutrition and sugarcane production: A review 1. J. Plant Nutr. 1999, 22, 1853–1903. [Google Scholar] [CrossRef]
- Yaghubi, K.; Ghaderi, N.; Vafaee, Y.; Javadi, T. Potassium silicate alleviates deleterious effects of salinity on two strawberry cultivars grown under soilless pot culture. Sci. Hortic. 2016, 213, 87–95. [Google Scholar] [CrossRef]
- Blum, A.; Shpiler, L.; Golan, G.; Mayer, J. Yield stability and canopy temperature of wheat genotypes under drought-stress. Field Crop Res. 1989, 22, 289–296. [Google Scholar] [CrossRef]
- Ndiso, J.; Chemining’Wa, G.; Olubayo, F.; Saha, H. Effect of drought stress on canopy temperature, growth and yield performance of cowpea varieties. Int. J. Plant Soil Sci. 2016, 9, 1–12. [Google Scholar] [CrossRef]
- Shepherd, T.; Griffiths, D.W. The effects of stress on plant cuticular waxes. New Phytol. 2006, 171, 469–499. [Google Scholar] [CrossRef] [PubMed]
- Mohammed, S. The Role of Leaf Epicuticular Wax an Improved Adaptation to Moisture Deficit Environments in Wheat. Ph.D. Thesis, Texas A & M University, College Station, TX, USA, May 2014. [Google Scholar]
- Keller, C.; Rizwan, M.; Davidian, J.C.; Pokrovsky, O.S.; Bovet, N.; Chaurand, P.; Meunier, J.D. Effect of silicon on wheat seedlings (Triticum turgidum L.) grown in hydroponics and exposed to 0 to 30 µM Cu. Planta 2015, 241, 847–860. [Google Scholar] [CrossRef]
- Sahebi, M.; Hanafi, M.M.; Akmar, A.S.N.; Rafii, M.Y.; Azizi, P.; Tengoua, F.F.; Azwa, J.N.M.; Shabanimofrad, M. Importance of Silicon and Mechanisms of Biosilica Formation in Plants. BioMed Int. 2015, 2015, 1–16. [Google Scholar] [CrossRef] [PubMed]
- Prychid, C.J.; Rudall, P.J.; Gregory, M. Systematics and Biology of Silica Bodies in Monocotyledons. Bot. Rev. 2003, 69, 377–440. [Google Scholar] [CrossRef]
- Fawe, A.; Menzies, J.G.; Chérif, M.; Bélanger, R.R. Silicon and disease resistance in dicotyledons. In Studies Plant Science; Elsevier: Amsterdam, The Netherlands, 2001; Volume 8, pp. 159–169. [Google Scholar]
- Pozza, E.A.; Pozza, A.A.A.; Botelho, D.M.D.S. Silicon in plant disease control. Rev. Ceres 2015, 62, 323–331. [Google Scholar] [CrossRef]
- Zhang, W.; Xie, Z.; Lang, D.; Cui, J.; Zhang, X. Beneficial effects of silicon on abiotic stress tolerance in legumes. J. Plant Nutr. 2017, 40, 2224–2236. [Google Scholar] [CrossRef]
- Agarie, S.; Uchida, H.; Agata, W.; Kubota, F.; Kaufman, P.B. Effects of Silicon on Transpiration and Leaf Conductance in Rice Plants (Oryza sativa L.). Plant Prod. Sci. 1998, 1, 89–95. [Google Scholar] [CrossRef]
Figure 1.
Proline concentrations of strawberry leaves from plants grown in three levels of salinity 0 mM (black bars), 25 mM (grey bars) and 50 mM (white bars) and treated with different levels of nano-silicon dioxide. Mean values with the same letters are not significantly different by least significant differences (LSD) test at p ≤ 0.01. The content of photosynthetic pigments such as chlorophylls and carotenoids was significantly reduced in salt stressed plants relative to controls (no NaCl), especially for the 50 mM NaCl treatment where there was a 21% decrease in the total chlorophyll. Photosynthetic pigment content, including chlorophyll a, decreased in response to the salinity stress treatments and in contrast, the chlorophyll b and carotenoid content increased in response to the mild salinity level, but under the more severe 50 mM NaCl stress these pigments were reduced in comparison to controls (no NaCl). The treatments with nSiO2 increased chlorophyll a, b and total chlorophyll and carotenoid content compared to controls (no nSiO2) under stress and non-stress condition (Table 5).

Figure 2.
EWL concentrations of strawberry in three levels of salinity 0 mM (black bars), 25 mM (grey bars) and 50 mM (white bars) treated with different levels nano-silicon dioxide. Mean values with the same letter are not significantly different by least significant differences (LSD) test at p ≤ 0.01.

Figure 3.
The effects of salt stress and nSiO2 on the epidermal cell walls of strawberry leaves. (a) Cont; 0 mM NaCl + 0 mg L−1 nSio2, (b) 0 mM NaCl + 100.50 mg L−1 SiO2 (c) 25 mM NaCl + 0 mg L−1 SiO2 (d) 25 mM NaCl + 100,50 mg L−1 SiO2, (e) 50 mM NaCl + 0 mg L−1 SiO2, (f) 50 mM NaCl + 100.50 mg L−1 SiO2. Scanning electron microscope (SEM) image of the strawberry leaves. White scale bars = 100 µm.

Figure 4.
The effects of salt stress and nSiO2 on the epidermal cell walls of strawberry leaves. (a) Cont; 0 mM NaCl + 0 mg L−1 nSio2, (b) 0 mM NaCl + 100,50 mg L−1 SiO2 (c) 25 mM NaCl + 0 mg L−1 SiO2 (d) 25 mM NaCl + 100,50 mg L−1 SiO2, (e) 50 mM NaCl + 0 mg L−1 SiO2, (f) 50 mM NaCl + 100,50 mg L−1 SiO2. Scanning electronmicroscope (SEM) image of the strawberry leaves. White scale bars = 20 µm.

Figure 5.
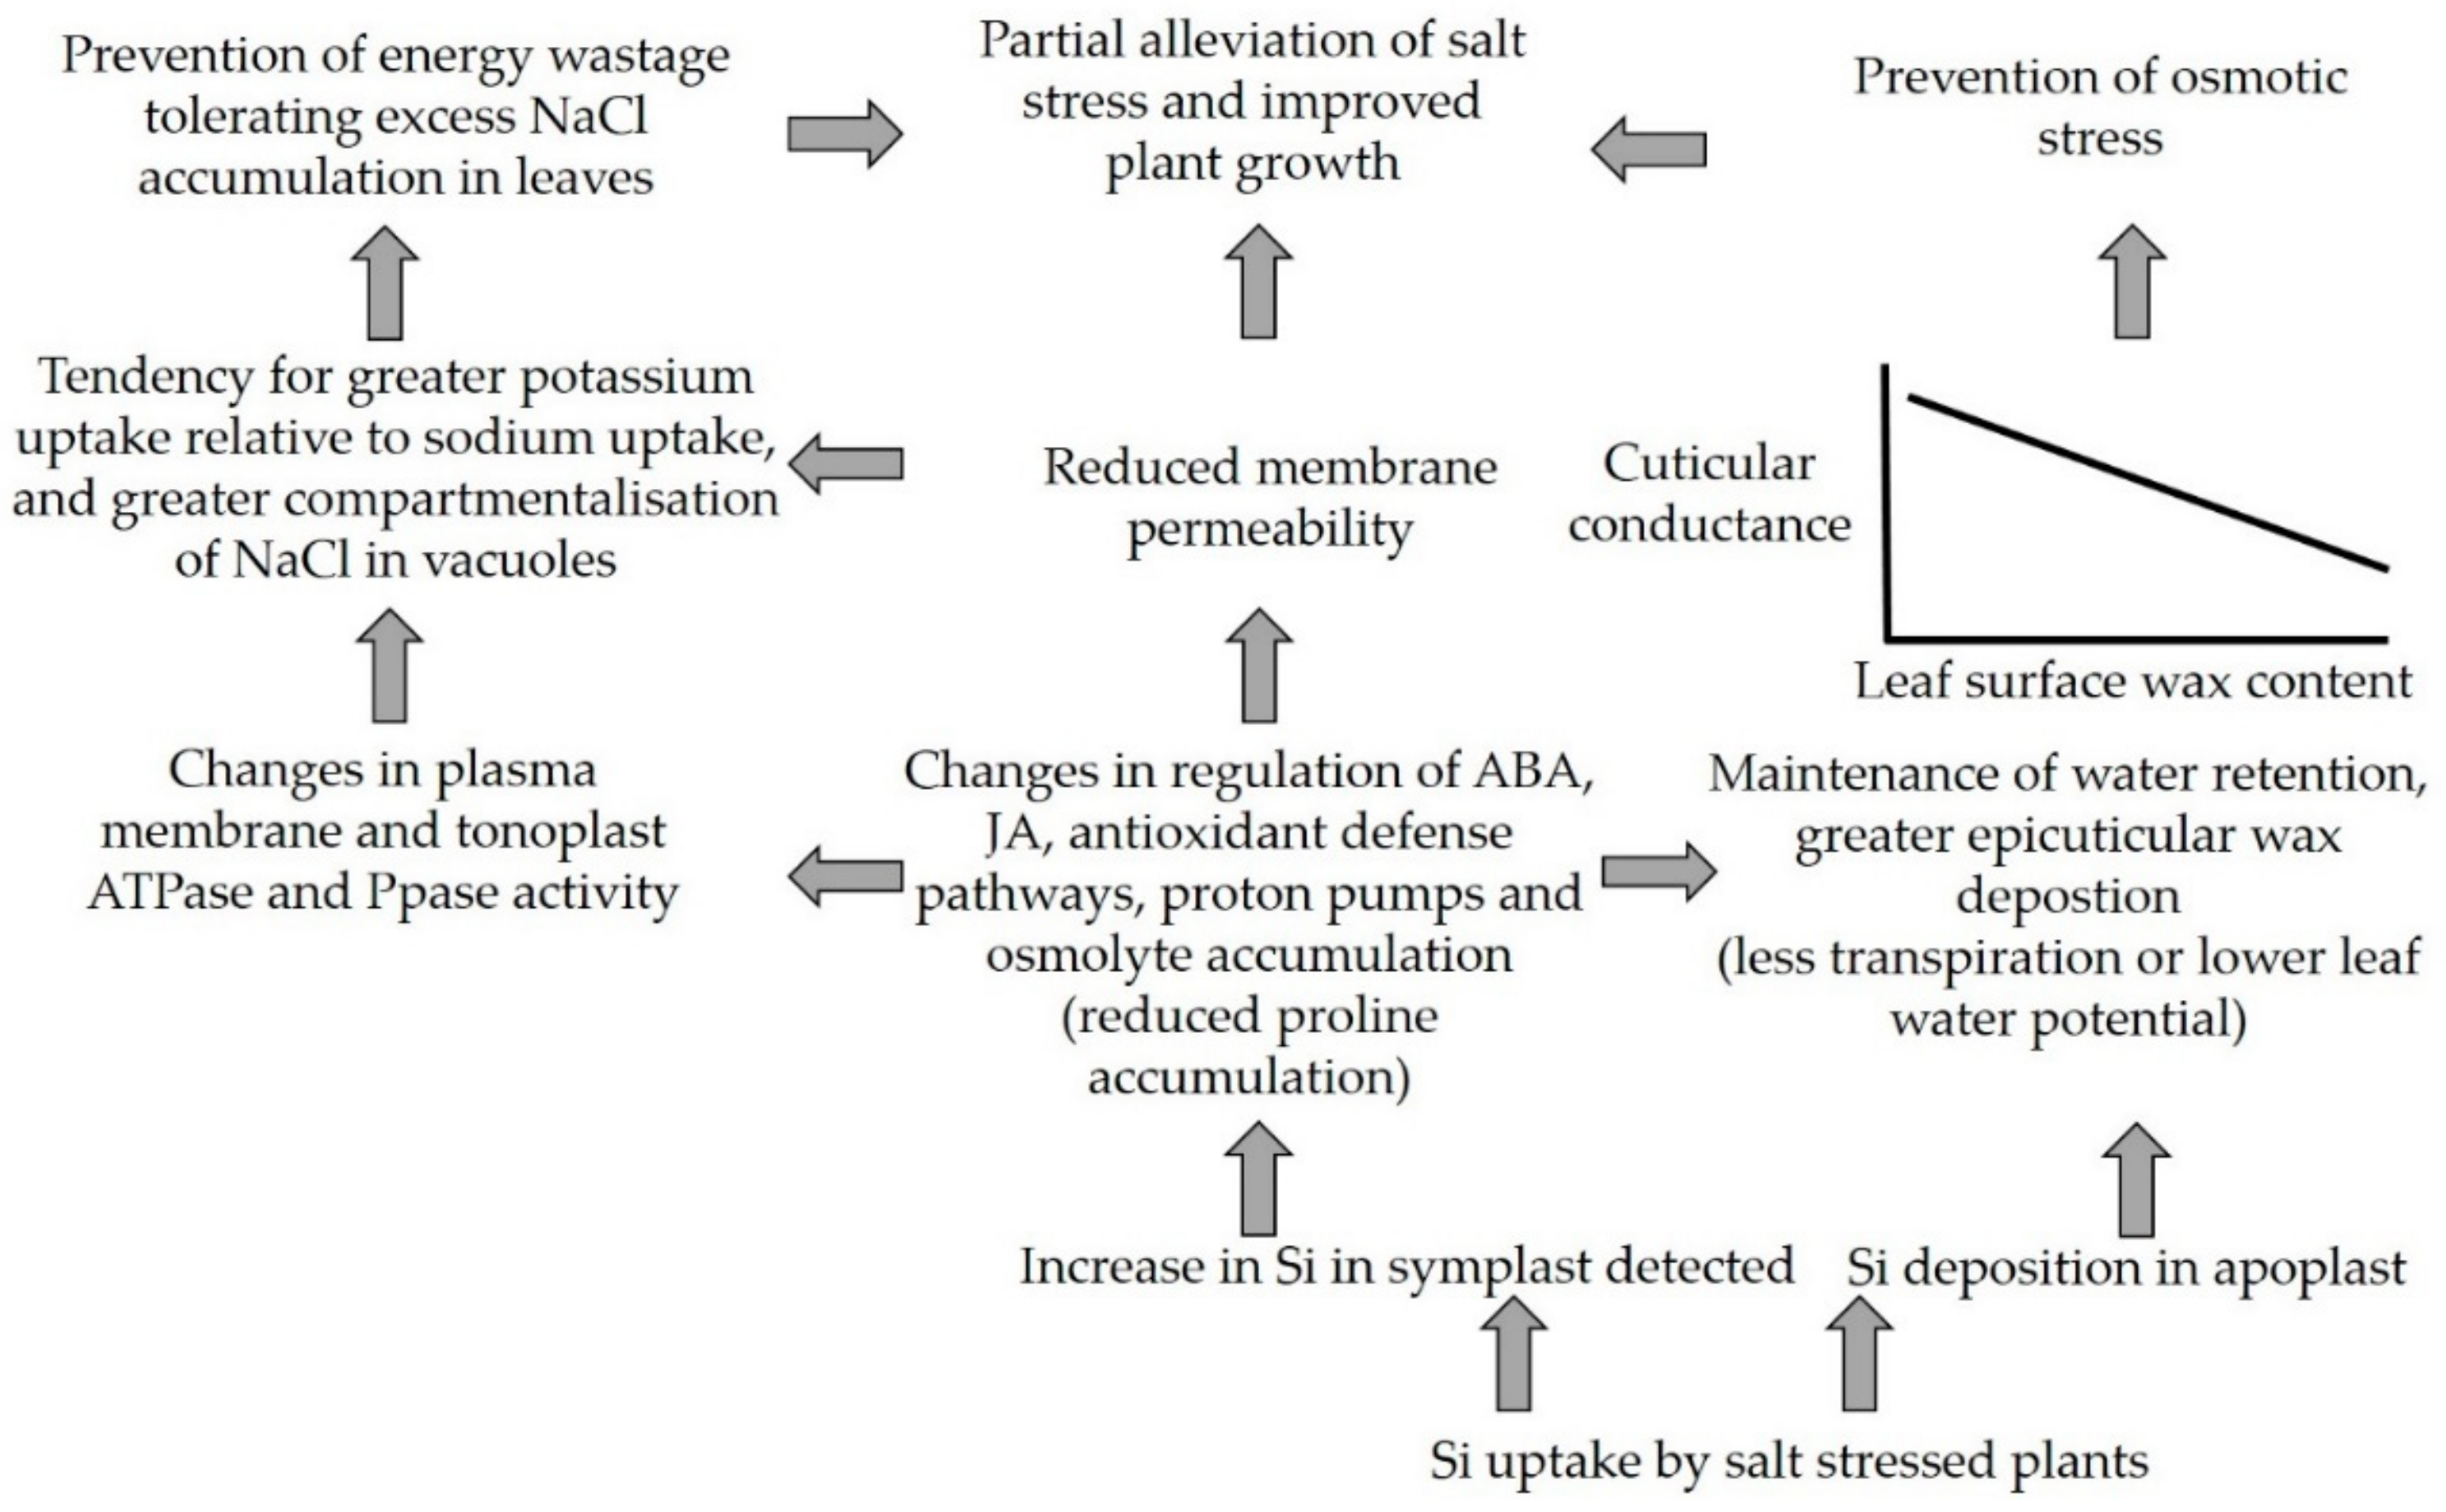
Schematic diagram indicating the beneficial responses that occur in salt stressed plants when they are supplied supplemental silicon. Abscisic acid (ABA); jasmonic acid (JA), ATPase (enzymes that catalyze the decomposition of ATP into ADP and a free phosphate ion or the inverse reaction), Ppase (proton-pumping pyrophosphatase); schematic adapted from Liang et al. 2015 [46] and the representation of the relationship between cuticular conductance and leaf wax surface content is adapted from Agarie et al., 1998 [63].
Figure 5.
Schematic diagram indicating the beneficial responses that occur in salt stressed plants when they are supplied supplemental silicon. Abscisic acid (ABA); jasmonic acid (JA), ATPase (enzymes that catalyze the decomposition of ATP into ADP and a free phosphate ion or the inverse reaction), Ppase (proton-pumping pyrophosphatase); schematic adapted from Liang et al. 2015 [46] and the representation of the relationship between cuticular conductance and leaf wax surface content is adapted from Agarie et al., 1998 [63].


Table 1.
Combinations of nano-silicon dioxide and salinity stress treatments tested.
| Salinity (mM) | nSiO2 mg L−1 before BBCH: 61 | nSiO2 mg L−1 after BBCH: 61 | Treatments | |
|---|---|---|---|---|
| 0 mM (Control—no NaCl) | 0 | 0 (Control—no NaCl, no SiO2) | S1 | 0 mM NaCl + 0 mg L−1 nSiO2 |
| 50 | S2 | 0 mM NaCl + 0.50 mg L−1 SiO2 | ||
| 50 | 0 | S3 | 0 mM NaCl + 50. 0 mg L−1 SiO2 | |
| 50 | S4 | 0 mM NaCl + 50.50 mg L−1 SiO2 | ||
| 100 | 0 | S5 | 0 mM NaCl + 100.0 mg L−1 SiO2 | |
| 50 | S6 | 0 mM NaCl + 100.50 mg L−1 SiO2 | ||
| 25 mM | 0 | 0 (Control—no SiO2) | S1 | 25 mM NaCl + 0 mg L−1 nSio2 |
| 50 | S2 | 25 mM NaCl + 0.50 mg L−1 SiO2 | ||
| 50 | 0 | S3 | 25 mM NaCl + 50.0 mg L−1 SiO2 | |
| 50 | S4 | 25 mM NaCl + 50.50 mg L−1 SiO2 | ||
| 100 | 0 | S5 | 25 mM NaCl + 100.0 mg L−1 SiO2 | |
| 50 | S6 | 25 mM NaCl + 100.50 mg L−1 SiO2 | ||
| 50 mM | 0 | 0 (Control—no SiO2) | S1 | 50 mM NaCl + 0 mg L−1 nSio2 |
| 50 | S2 | 50 mM NaCl + 0.50 mg L−1 SiO2 | ||
| 50 | 0 | S3 | 50 mM NaCl + 50.0 mg L−1 SiO2 | |
| 50 | S4 | 50 mM NaCl + 50.50 mg L−1 SiO2 | ||
| 100 | 0 | S5 | 50 mM NaCl+ 100.0 mg L−1 SiO2 | |
| 50 | S6 | 50 mM NaCl+ 100.50 mg L−1 SiO2 | ||
BBCH: Biologische Bundesanstalt, Bundessortenamt und CHemische Industrie. S1 = control (no nSiO2 application before or after BBCH: 61). S2 = 50 mg L−1 nSiO2 just after BBCH: 61. S3 = 50 mg L−1 nSiO2 before BBCH: 61. S4 = 50 mg L−1 nSiO2 throughout all growth and development stages. S5 = 100 mg L−1 nSiO2 before BBCH: 61. S6 = 100 mg L−1 nSiO2 before BBCH: 61 and 50 mg L−1 after BBCH: 61.
Table 2.
Effect of nSiO2 and salt stress on biomass parameters, root and shoot dry weight and fresh weight of strawberry cv “Camarosa”, including analysis of variance.
Table 2.
Effect of nSiO2 and salt stress on biomass parameters, root and shoot dry weight and fresh weight of strawberry cv “Camarosa”, including analysis of variance.
| Root Fresh Weight (g) | Root Dry Weight (g) | Shoot Fresh Weight (g) | Shoot Dry Weight (g) | Shoot/Root | Root Volume (cm3 per plant) | |
|---|---|---|---|---|---|---|
| Salinity (mM) | ||||||
| 0 | 52.1 a | 10.99 a | 51.94 a | 16.16 a | 0.996 a | 51.00 a |
| 25 | 43.2 b | 8.44 b | 36.76 b | 12.23 b | 0.850 a | 41.88 b |
| 50 | 36.7 c | 7.11 c | 18.14 c | 5.58 c | 0.494 b | 37.50 b |
| Nano-silicon Dioxide (mg L−1) | ||||||
| S1 | 36.72 c | 6.95 c | 28.54 c | 9.22 c | 0.777 a | 35.88 b |
| S2 | 44.86 abc | 9.04 ab | 33.97 b | 10.7 bc | 0.757 a | 41.77 ab |
| S3 | 50.92 a | 10.35 a | 38.33 b | 11.50 ab | 0.752 a | 49.77 a |
| S4 | 41.41 bc | 8.01 bc | 35.92 b | 11.25 abc | 0.867 a | 41.11 ab |
| S5 | 46.34 abc | 9.13 ab | 35.74 c | 12.24 ab | 0.771 a | 43.77 ab |
| S6 | 47.53 ab | 9.92 a | 41.18 a | 13.04 a | 0.866 a | 48.44 a |
| Analysis of Variance | ||||||
| Salinity | ** | ** | ** | ** | ** | ** |
| nSiO2 | ** | * | * | ** | ns | ns |
| Salinity × nSiO2 | ns | ns | ns | ns | ns | ns |
Means of the main effects followed by different letters in each column indicate significant difference at p ≤ 0.05 by the least significant difference (LSD). ns, * or ** indicate non-significance (p > 0.05) or significance at p ≤ 0.05 or p ≤ 0.01, by the F-test, respectively.
Table 3.
Student’s t-test of nano-silicon dioxide effects on morphological and physiological parameters of strawberry plants exposed to 50 mM NaCl salinity stress; ns (no significant difference); Pr > [t] (p-value for the effect of the variable on the response and t statistic) * (significant difference).
| S1 | S6 | T Value | Pr > F | Pr > [t] | ||||||
|---|---|---|---|---|---|---|---|---|---|---|
| Mean | Std Dev | Std Err | Mean | Std Dev | Std Err | Pooled (Equal) | Satterthwaite (Unequal) | |||
| Fresh weight | 12.98 | 0.849 | 0.49 | 21.32 | 3.89 | 2.24 | −3.63 | 0.0909 | 0.0222 * | 0.059 ns |
| Dry weight | 4.28 | 1.017 | 0587 | 6.55 | 0.606 | 0.35 | −3.31 | 0.524 | 0.0297 * | 0.0402 * |
| Root fresh weight | 30.42 | 4.79 | 2.76 | 34.55 | 7.72 | 4.45 | −0.79 | 0.475 | 0.475 ns | 0.483 ns |
| Root dry weight | 4.92 | 0.70 | 0.407 | 8.29 | 2.314 | 1.33 | −2.41 | 0.17 | 0.0733 ns | 0.117 ns |
| Root volume | 28.33 | 7.63 | 4.40 | 40.00 | 5.00 | 2.88 | −2.21 | 0.60 | 0.091 ns | 0.102 ns |
| Shoot/root | 0.431 | 0.0449 | 0.0259 | 0.637 | 0.183 | 0.106 | −1.89 | 0.112 | 0.131 ns | 0.185 ns |
| Membrane stability index (MSI) | 64.22 | 10.31 | 5.95 | 80.00 | 2.68 | 1.55 | −2.57 | 0.127 | 0.062ns | 0.109 ns |
| Proline | 13.42 | 0.549 | 0.316 | 8.19 | 0.641 | 0.370 | 10.72 | 0.844 | 0.0004 ** | 0.0005 ** |
| Epicuticular wax layer (EWL) | 17.06 | 5.65 | 3.266 | 34.03 | 8.29 | 4.78 | −2.93 | 0.635 | 0.043 * | 0.050 * |
Table 4.
Effect of nSiO2 and salt stress on fruit yield, Relative Water Content (RWC); Relative Water Protection (RWP); Relative Water Loss (RWL); Membrane Stability Index (MSI), Cuticle Transpiration (CT) and canopy temperature for strawberry cv ‘Camarosa’.
Table 4.
Effect of nSiO2 and salt stress on fruit yield, Relative Water Content (RWC); Relative Water Protection (RWP); Relative Water Loss (RWL); Membrane Stability Index (MSI), Cuticle Transpiration (CT) and canopy temperature for strawberry cv ‘Camarosa’.
| Fruit Yield (g) | RWC (%) | RWP (%) | RWL (%) | MSI (%) | CT (g H2O/g Dry Weight) | Canopy Temperature (°C) | ||||
|---|---|---|---|---|---|---|---|---|---|---|
| Cloudy Day | Sunny Day | |||||||||
| Salinity (mM) | ||||||||||
| 0 | 198.06 a | 85.1 a | 0.91 a | 0.156 a | 83.9 a | 0.587 a | 3.91 a | 2.72 a | ||
| 25 | 149.40 b | 81.79 a | 0.87 ab | 0.154 a | 79.3 a | 0.832 a | 3.57 a | 2.04 a | ||
| 50 | 77.39 c | 67.37 b | 0.86 b | 0.168 a | 75.5 b | 0.908 a | 2.18 b | 0.10 b | ||
| Nano-silicon dioxide (mg L−1) | ||||||||||
| S1 | 124.05 c | 76.71 a | 0.861 a | 0.107 c | 74.2 bc | 1.111 a | 2.33 c | 0.713 c | ||
| S2 | 142.33 abc | 75.99 a | 0.901 a | 0.161 ab | 79.1 abc | 0.593 a | 3.15 b | 0.861 c | ||
| S3 | 151.92 ab | 75.26 a | 0.877 a | 0.161 ab | 79.6 abc | 0.788 a | 3.20 b | 1.14 c | ||
| S4 | 140.79 bc | 78.33 a | 0.883 a | 0.202 a | 84.64 a | 0.753 a | 3.15 b | 1.46 bc | ||
| S5 | 129.34 c | 80.91 a | 0.875 a | 0.158 b | 71.9 c | 0.843 a | 3.48 ab | 3.06 a | ||
| S6 | 161.26 a | 81.32 a | 0.911 a | 0.168 ab | 82.2 ab | 0.564 a | 4.02 a | 2.48 ab | ||
| Analysis of Variance | ||||||||||
| Salinity | ** | ** | ns | ns | ** | ns | ** | ** | ||
| Nano-silicon dioxide | ** | ns | ns | ** | * | ns | ** | ** | ||
| Salinity × Naon-silicon dioxide | ns | ns | ns | ns | ns | ns | ns | ns | ||
Means of the main effects followed by different letters in each column indicate significant difference at p ≤ 0.05 least significant range (LSD). ns, * or ** indicate non-significance (p > 0.05) or significance at p ≤ 0.05 or p ≤ 0.01, by the F-test, respectively.
Table 5.
Effect of nSiO2 and salt stress on Epicuticular Wax Layer (EWL), proline, chlorophyll (Chl a and Chl b and total) and carotenoids content of strawberry cv Camarosa under various conditions tested.
Table 5.
Effect of nSiO2 and salt stress on Epicuticular Wax Layer (EWL), proline, chlorophyll (Chl a and Chl b and total) and carotenoids content of strawberry cv Camarosa under various conditions tested.
| EWL (µg cm2) | Proline (µmol g−1) | Chl a (mg g−1 Fresh Weight) | Chl b (mg g−1 Fresh Weight) | Total Chl (mg g−1 Fresh Weight) | Carotenoids (mg g−1 Fresh Weight) | |
|---|---|---|---|---|---|---|
| Salinity (mM) | ||||||
| 0 | 63.43 a | 5.83 c | 7.78 a | 2.75 a | 10.53 a | 2.86 b |
| 25 | 36.52 b | 6.68 b | 7.41 b | 2.88 a | 10.30 a | 3.24 a |
| 50 | 28.54 b | 10.53 a | 5.96 c | 2.38 b | 8.35 b | 2.63 c |
| Nano-Silicon Dioxide (mg L−1) | ||||||
| S1 | 35.53 b | 8.36 a | 6.48 c | 2.38 c | 8.86 c | 2.66 c |
| S2 | 43.74 ab | 7.06 bcd | 6.87 bc | 2.46 c | 9.34 bc | 2.69 c |
| S3 | 45.89 ab | 7.69 abc | 6.68 c | 2.39 c | 9.08 c | 2.82 bc |
| S4 | 43.22 ab | 7.91 ab | 7.57 a | 3.11 a | 10.68 a | 3.02 ab |
| S5 | 42.57 ab | 6.03 d | 7.53 a | 2.96 a | 10.50 a | 3.23 a |
| S6 | 47.12 a | 6.61 cd | 7.18 ab | 2.71 b | 9.89 b | 3.03 ab |
| Analysis of Variance | ||||||
| Salinity | ** | ** | ** | ** | ** | ** |
| Nano-silicon dioxide | ns | ** | ** | ** | ** | ** |
| Salininty × Nano-silicon dioxide | * | * | ** | ** | ** | ** |
Means of the main effects followed by different letters in each column indicate significant difference at p ≤ 0.05 by least significant range (LSD). ns, * or ** indicate non-significance (p > 0.05) or significance at p ≤ 0.05 or p ≤ 0.01, by the F-test, respectively.
© 2019 by the authors. Licensee MDPI, Basel, Switzerland. This article is an open access article distributed under the terms and conditions of the Creative Commons Attribution (CC BY) license (http://creativecommons.org/licenses/by/4.0/).
Share and Cite
MDPI and ACS Style
Avestan, S.; Ghasemnezhad, M.; Esfahani, M.; Byrt, C.S. Application of Nano-Silicon Dioxide Improves Salt Stress Tolerance in Strawberry Plants. Agronomy 2019, 9, 246. https://0-doi-org.brum.beds.ac.uk/10.3390/agronomy9050246
AMA Style
Avestan S, Ghasemnezhad M, Esfahani M, Byrt CS. Application of Nano-Silicon Dioxide Improves Salt Stress Tolerance in Strawberry Plants. Agronomy. 2019; 9(5):246. https://0-doi-org.brum.beds.ac.uk/10.3390/agronomy9050246
Chicago/Turabian StyleAvestan, Saber, Mahmood Ghasemnezhad, Masoud Esfahani, and Caitlin S. Byrt. 2019. "Application of Nano-Silicon Dioxide Improves Salt Stress Tolerance in Strawberry Plants" Agronomy 9, no. 5: 246. https://0-doi-org.brum.beds.ac.uk/10.3390/agronomy9050246
Note that from the first issue of 2016, this journal uses article numbers instead of page numbers. See further details here.