Mapping of Diabetes Susceptibility Loci in a Domestic Cat Breed with an Unusually High Incidence of Diabetes Mellitus

 ,
,  ,
,
Abstract
: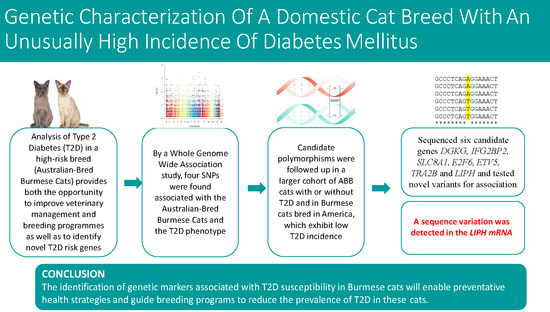
1. Introduction
2. Materials and Methods
2.1. Characterisation of Australian-Bred Burmese Cats
2.2. US-Bred Burmese Cats
2.3. Genome-Wide Association Mapping and Analyses for Association with Diabetes: Genomic
2.4. PCR, Gel, Digest and High-Resolution Melt Analysis
2.5. Sequencing of Candidate Genes
3. Results
3.1. Search for Genetic Markers Associated with Type 2 Diabetes
3.2. Validation of the Candidate Type 2 Diabetes Associated SNPs
3.3. Selection of Candidate Type 2 Diabetes Genes
3.4. Search for Polymorphisms within Candidate Genes
4. Discussion
Supplementary Materials
Author Contributions
Funding
Acknowledgments
Conflicts of Interest
References
- Pal, A.; McCarthy, M.I. The genetics of type 2 diabetes and its clinical relevance. Clin. Genet. 2013, 83, 297–306. [Google Scholar] [CrossRef] [PubMed]
- Teslovich, T.M.; Fuchsberger, C.; Ramensky, V.; Yajnik, P.; Koboldt, D.C.; Larson, D.E.; Zhang, Q.; Lin, L.; Welch, R.; Ding, L.; et al. Re-sequencing expands our understanding of the phenotypic impact of variants at GWAS loci. PLoS Genet. 2014, 10, e1004147. [Google Scholar] [CrossRef] [Green Version]
- Dorajoo, R.; Liu, J.; Boehm, B.O. Genetics of Type 2 Diabetes and Clinical Utility. Genes 2015, 6, 372–384. [Google Scholar] [CrossRef] [Green Version]
- Forcada, Y.; Holder, A.; Church, D.B.; Catchpole, B. A polymorphism in the melanocortin 4 receptor gene (MC4R:c.92C>T) is associated with diabetes mellitus in overweight domestic shorthaired cats. J. Vet. Intern. Med. 2014, 28, 458–464. [Google Scholar] [CrossRef] [PubMed] [Green Version]
- Lederer, R.; Rand, J.S.; Jonsson, N.N.; Hughes, I.P.; Morton, J.M. Frequency of feline diabetes mellitus and breed predisposition in domestic cats in Australia. Vet. J. 2009, 179, 254–258. [Google Scholar] [CrossRef] [PubMed]
- Marshall, R.D.; Rand, J.S.; Morton, J.M. Treatment of newly diagnosed diabetic cats with glargine insulin improves glycaemic control and results in higher probability of remission than protamine zinc and lente insulins. J. Feline Med. Surg. 2009, 11, 683–691. [Google Scholar] [CrossRef] [PubMed]
- Feldhahn, J.R.; Rand, J.S.; Martin, G. Insulin sensitivity in normal and diabetic cats. J. Feline Med. Surg. 1999, 1, 107–115. [Google Scholar] [CrossRef]
- Mbanya, J.C.; Kengne, A.P.; Assah, F. Diabetes care in Africa. Lancet 2006, 368, 1628–1629. [Google Scholar] [CrossRef]
- Mbanya, J.C.N.; Motala, A.A.; Sobngwi, E.; Assah, F.K.; Enoru, S.T. Diabetes in sub-Saharan Africa. Lancet 2010, 375, 2254–2266. [Google Scholar] [CrossRef]
- Sieber-Ruckstuhl, N.S.; Kley, S.; Tschuor, F.; Zini, E.; Ohlerth, S.; Boretti, F.S.; Reusch, C.E. Remission of diabetes mellitus in cats with diabetic ketoacidosis. J. Vet. Intern. Med. 2008, 22, 1326–1332. [Google Scholar] [CrossRef]
- Zini, E.; Hafner, M.; Osto, M.; Franchini, M.; Ackermann, M.; Lutz, T.A.; Reusch, C.E. Predictors of clinical remission in cats with diabetes mellitus. J. Vet. Intern. Med. 2010, 24, 1314–1321. [Google Scholar] [CrossRef] [PubMed] [Green Version]
- Rand, J.S.; Bobbermien, L.M.; Hendrikz, J.K.; Copland, M. Over representation of Burmese cats with diabetes mellitus. Aust. Vet. J. 1997, 75, 402–405. [Google Scholar] [CrossRef] [PubMed]
- Fogle, B. The New Encyclopedia of the Cat, 1st ed.; DK Publishing, Inc.: New York, NY, USA, 2001. [Google Scholar]
- McCann, T.M.; Simpson, K.E.; Shaw, D.J.; Butt, J.A.; Gunn-Moore, D.A. Feline diabetes mellitus in the UK: The prevalence within an insured cat population and a questionnaire-based putative risk factor analysis. J. Feline Med. Surg. 2007, 9, 289–299. [Google Scholar] [CrossRef] [PubMed]
- O’Leary, C.A.; Duffy, D.L.; Gething, M.A.; McGuckin, C.; Rand, J.S. Investigation of diabetes mellitus in Burmese cats as an inherited trait: A preliminary study. N. Z. Vet. J. 2013, 61, 354–358. [Google Scholar] [CrossRef] [PubMed]
- Panciera, D.L.; Thomas, C.B.; Eicker, S.W.; Atkins, C.E. Epizootiologic patterns of diabetes mellitus in cats: 333 cases (1980–1986). J. Am. Vet. Med. Assoc 1990, 197, 1504–1508. [Google Scholar] [PubMed]
- Prahl, A.; Guptill, L.; Glickman, N.W.; Tetrick, M.; Glickman, L.T. Time trends and risk factors for diabetes mellitus in cats presented to veterinary teaching hospitals. J. Feline Med. Surg. 2007, 9, 351–358. [Google Scholar] [CrossRef]
- Gandolfi, B.; Alhaddad, H. Investigation of inherited diseases in cats: Genetic and genomic strategies over three decades. J. Feline Med. Surg. 2015, 17, 405–415. [Google Scholar] [CrossRef]
- Menotti-Raymond, M.; David, V.A.; Pflueger, S.M.; Lindblad-Toh, K.; Wade, C.M.; O’Brien, S.J.; Johnson, W.E. Patterns of molecular genetic variation among cat breeds. Genomics 2008, 91, 1–11. [Google Scholar] [CrossRef] [Green Version]
- Lease, K. A Trip Down Burmese Memory Lane. R.A.S. Cat Control J. 1997, 28, 17. [Google Scholar]
- Alhaddad, H.; Gandolfi, B.; Grahn, R.A.; Rah, H.C.; Peterson, C.B.; Maggs, D.J.; Good, K.L.; Pedersen, N.C.; Lyons, L.A. Genome-wide association and linkage analyses localize a progressive retinal atrophy locus in Persian cats. Mamm. Genome 2014, 25, 354–362. [Google Scholar] [CrossRef]
- Karyadi, D.M.; Karlins, E.; Decker, B.; Carpintero-Ramirez, G.; Parker, H.G.; Wayne, R.K.; Ostrander, E.A. A copy number variant at the KITLG locus likely confers risk for canine squamous cell carcinoma of the digit. PLoS Genet. 2013, 9, e1003409. [Google Scholar] [CrossRef] [PubMed] [Green Version]
- Thoresen, S.I.; Bjerkås, E.; Aleksandersen, M.; Peiffer, R.L. Diabetes mellitus and bilateral cataracts in a kitten. J. Feline Med. Surg. 2002, 4, 115–122. [Google Scholar] [CrossRef] [PubMed]
- Hackendahl, M.; Schaer, N. Insulin resistance in diabetic patients: Causes and management. Compend. Contin. Educ. Pract. Vet. 2006, 28, 271–284. [Google Scholar]
- Niessen, S.J.M.; Church, D.B.; Forcada, Y. Hypersomatotropism, acromegaly, and hyperadrenocorticism and feline diabetes mellitus. Vet. Clin. N. Am. Small Anim. Pract. 2013, 43, 319–350. [Google Scholar] [CrossRef] [PubMed]
- Xenoulis, P.G.; Steiner, J.M. Canine and feline pancreatic lipase immunoreactivity. Vet. Clin. Pathol. 2012, 41, 312–324. [Google Scholar] [CrossRef] [PubMed]
- Steiner, J.M. Is it pancreatitis? Vet. Med. Bonn. Springs Edw. 2006, 101, 158. [Google Scholar]
- Gottlieb, S.; Rand, J.S.; Marshall, R.; Morton, J. Glycemic status and predictors of relapse for diabetic cats in remission. J. Vet. Intern. Med. 2015, 29, 184–192. [Google Scholar] [CrossRef] [Green Version]
- Animal–Cardiology, S.M.; Echocardiography, D.; Echocardiography, T.; Angiography, C.T.; Hearts, I.N. 2012 ACVIM Forum Research Abstracts Program. J. Vet. Intern. Med. 2012, 26, 690–822. [Google Scholar] [CrossRef] [Green Version]
- Purcell, S.; Neale, B.; Todd-Brown, K.; Thomas, L.; Ferreira, M.A.; Bender, D.; Maller, J.; Sklar, P.; De Bakker, P.I.; Daly, M.J.; et al. PLINK: A tool set for whole-genome association and population-based linkage analyses. Am. J. Hum. Genet. 2007, 81, 559–575. [Google Scholar] [CrossRef] [Green Version]
- Liew, M.; Pryor, R.; Palais, R.; Meadows, C.; Erali, M.; Lyon, E.; Wittwer, C. Genotyping of single-nucleotide polymorphisms by high-resolution melting of small amplicons. Clin. Chem. 2004, 50, 1156–1164. [Google Scholar] [CrossRef]
- Menotti-Raymond, M.A.; David, V.A.; Wachter, L.L.; Butler, J.M.; O’Brien, S.J. An STR forensic typing system for genetic individualization of domestic cat (Felis catus) samples. J. Forensic Sci. 2005, 50, 1061–1070. [Google Scholar] [CrossRef] [PubMed] [Green Version]
- Kehler, J.S.; David, V.A.; Schäffer, A.A.; Bajema, K.; Eizirik, E.; Ryugo, D.K.; Hannah, S.S.; O’Brien, S.J.; Menotti-Raymond, M. Four independent mutations in the feline fibroblast growth factor 5 gene determine the long-haired phenotype in domestic cats. J. Hered. 2007, 98, 555–566. [Google Scholar] [CrossRef] [PubMed]
- Choi, Y.; Sims, G.E.; Murphy, S.; Miller, J.R.; Chan, A.P. Predicting the functional effect of amino acid substitutions and indels. PLoS ONE 2012, 7, e46688. [Google Scholar] [CrossRef] [PubMed] [Green Version]
- Willet, C.E.; Haase, B. An updated felCat5 SNP manifest for the Illumina Feline 63k SNP genotyping array. Anim. Genet. 2014, 45, 614–615. [Google Scholar] [CrossRef]
- Dorajoo, R.; Blakemore, A.I.; Sim, X.; Ong, R.T.; Ng, D.P.; Seielstad, M.; Wong, T.Y.; Saw, S.M.; Froguel, P.; Liu, J.; et al. Replication of 13 obesity loci among Singaporean Chinese, Malay and Asian-Indian populations. Int. J. Obes. 2012, 36, 159–163. [Google Scholar] [CrossRef] [Green Version]
- Thorleifsson, G.; Walters, G.B.; Gudbjartsson, D.F.; Steinthorsdottir, V.; Sulem, P.; Helgadottir, A.; Styrkarsdottir, U.; Gretarsdottir, S.; Thorlacius, S.; Jonsdottir, I.; et al. Genome-wide association yields new sequence variants at seven loci that associate with measures of obesity. Nat. Genet. 2009, 41, 18–24. [Google Scholar] [CrossRef]
- Pihlajamäki, J.; Lerin, C.; Itkonen, P.; Boes, T.; Floss, T.; Schroeder, J.; Dearie, F.; Crunkhorn, S.; Burak, F.; Jimenez-Chillaron, J.C.; et al. Expression of the splicing factor gene SFRS10 is reduced in human obesity and contributes to enhanced lipogenesis. Cell Metab. 2011, 14, 208–218. [Google Scholar] [CrossRef] [Green Version]
- Benrahma, H.; Charoute, H.; Lasram, K.; Boulouiz, R.; Atig, R.K.; Fakiri, M.; Rouba, H.; Abdelhak, S.; Barakat, A. Association analysis of IGF2BP2, KCNJ11, and CDKAL1 polymorphisms with type 2 diabetes mellitus in a Moroccan population: A case-control study and meta-analysis. Biochem. Genet. 2014, 52, 430–442. [Google Scholar] [CrossRef]
- Morahan, G.; Huang, D.; Ymer, S.I.; Cancilla, M.R.; Stephen, K.; Dabadghao, P.; Werther, G.; Tait, B.D.; Harrison, L.C.; Colman, P.G. Linkage disequilibrium of a type 1 diabetes susceptibility locus with a regulatory IL12B allele. Nat. Genet. 2001, 27, 218–221. [Google Scholar] [CrossRef]
- Morahan, G.; Kaur, G.; Singh, M.; Rapthap, C.C.; Kumar, N.; Katoch, K.; Mehra, N.K.; Huang, D. Association of variants in the IL12B gene with leprosy and tuberculosis. Tissue Antigens 2007, 69 (Suppl. 1), 234–236. [Google Scholar] [CrossRef]
- Sur, I.; Tuupanen, S.; Whitington, T.; Aaltonen, L.A.; Taipale, J. Lessons from functional analysis of genome-wide association studies. Cancer Res. 2013, 73, 4180–4184. [Google Scholar] [CrossRef] [PubMed] [Green Version]
- Ram, R.; Mehta, M.; Nguyen, Q.T.; Larma, I.; Boehm, B.O.; Pociot, F.; Concannon, P.; Morahan, G. Systematic Evaluation of Genes and Genetic Variants Associated with Type 1 Diabetes Susceptibility. J. Immunol. 2016, 96, 3043–3053. [Google Scholar] [CrossRef] [PubMed] [Green Version]
- Pontius, J.U.; Mullikin, J.C.; Smith, D.R.; Team, A.S.; Lindblad-Toh, K.; Gnerre, S.; Clamp, M.; Chang, J.; Stephens, R.; Neelam, B.; et al. Initial sequence and comparative analysis of the cat genome. Genome Res. 2007, 17, 1675–1689. [Google Scholar] [CrossRef] [PubMed] [Green Version]
- Lipinski, M.J.; Froenicke, L.; Baysac, K.C.; Billings, N.C.; Leutenegger, C.M.; Levy, A.M.; Longeri, M.; Niini, T.; Ozpinar, H.; Slater, M.R.; et al. The ascent of cat breeds: Genetic evaluations of breeds and worldwide random-bred populations. Genomics 2008, 91, 12–21. [Google Scholar] [CrossRef] [PubMed] [Green Version]
- Gottlieb, S.; Rand, J. Managing feline diabetes: Current perspectives. Vet. Med. 2018, 9, 33–42. [Google Scholar] [CrossRef] [PubMed] [Green Version]
- Gottlieb, S.; Rand, J.S. Remission in cats: Including predictors and risk factors. Vet. Clin. N. Am. Small Anim. Pract. 2013, 43, 245–249. [Google Scholar] [CrossRef]
- Roomp, K.; Rand, J. Intensive blood glucose control is safe and effective in diabetic cats using home monitoring and treatment with glargine. J. Feline Med. Surg. 2009, 11, 668–682. [Google Scholar] [CrossRef]
- Zini, E.; Linscheid, P.; Franchini, M.; Kaufmann, K.; Monnais, E.; Kutter, A.P.; Ackermann, M.; Lutz, T.A.; Reusch, C.E. Partial sequencing and expression of genes involved in glucose metabolism in adipose tissues and skeletal muscle of healthy cats. Vet. J. 2009, 180, 66–70. [Google Scholar] [CrossRef] [Green Version]

| SNP | Illumina No. | A1 | F_A | F_U | p | Odds Ratio |
|---|---|---|---|---|---|---|
| SNP1 | 10566 | G | 0.75 | 0.15 | 0.00014 | 17 |
| SNP2 | 10762 | G | 0.5 | 0 | 0.00026 | NA |
| SNP3 | 30747 | G | 0.1 | 0.65 | 0.00033 | 0.059 |
| SNP4 | 36147 | G | 0.8 | 0.2 | 0.00015 | 16 |
| SNP5 | 36165 | A | 0.1 | 0.65 | 0.00033 | 0.059 |
| SNP6 | 36166 | A | 0.1 | 0.65 | 0.00033 | 0.059 |
| SNP | A1 | F_A | F_U | p Value | OR | Chromosome Position |
|---|---|---|---|---|---|---|
| SNP1 | T | 0.59 | 0.38 | 0.00089 | 2.4 | chrA3: 10995614 |
| SNP2 | G | 0.29 | 0.52 | 0.00043 | 0.4 | chrA3: 134626291 |
| SNP3 | C | 0.17 | 0.46 | 5.35 × 10⁻⁶ | 0.2 | chrC1: 23237623 |
| SNP4 | C | 0.63 | 0.41 | 0.0013 | 2.5 | chrC2: 83660325 |
| SNP5 | T | 0.32 | 0.49 | 0.012 | 0.5 | chrC2: 84129862 |
| SNP6 | A | 0.30 | 0.34 | 0.53 | 0.8 | chrC2: 84135537 |
| Chr | SNPs | Haplotype | F (Diabetic) | F (Unaffected) | p Value | Chromosome Position |
|---|---|---|---|---|---|---|
| C2 | 4 and 5 | CC | 0.51 | 0.29 | 0.0006 | 93563976 and 94157910 |
| C2 | 5 and 6 | CC | 0.55 | 0.34 | 0.001 | 94157910 and 94165023 |
Publisher’s Note: MDPI stays neutral with regard to jurisdictional claims in published maps and institutional affiliations. |
© 2020 by the authors. Licensee MDPI, Basel, Switzerland. This article is an open access article distributed under the terms and conditions of the Creative Commons Attribution (CC BY) license (http://creativecommons.org/licenses/by/4.0/).
Share and Cite
Balmer, L.; O’Leary, C.A.; Menotti-Raymond, M.; David, V.; O’Brien, S.; Penglis, B.; Hendrickson, S.; Reeves-Johnson, M.; Gottlieb, S.; Fleeman, L.; et al. Mapping of Diabetes Susceptibility Loci in a Domestic Cat Breed with an Unusually High Incidence of Diabetes Mellitus. Genes 2020, 11, 1369. https://0-doi-org.brum.beds.ac.uk/10.3390/genes11111369
Balmer L, O’Leary CA, Menotti-Raymond M, David V, O’Brien S, Penglis B, Hendrickson S, Reeves-Johnson M, Gottlieb S, Fleeman L, et al. Mapping of Diabetes Susceptibility Loci in a Domestic Cat Breed with an Unusually High Incidence of Diabetes Mellitus. Genes. 2020; 11(11):1369. https://0-doi-org.brum.beds.ac.uk/10.3390/genes11111369
Chicago/Turabian StyleBalmer, Lois, Caroline Ann O’Leary, Marilyn Menotti-Raymond, Victor David, Stephen O’Brien, Belinda Penglis, Sher Hendrickson, Mia Reeves-Johnson, Susan Gottlieb, Linda Fleeman, and et al. 2020. "Mapping of Diabetes Susceptibility Loci in a Domestic Cat Breed with an Unusually High Incidence of Diabetes Mellitus" Genes 11, no. 11: 1369. https://0-doi-org.brum.beds.ac.uk/10.3390/genes11111369