Using Reciprocal Transplants to Assess Local Adaptation, Genetic Rescue, and Sexual Selection in Newly Established Populations

 ,
,
Abstract
:
1. Introduction
2. Materials and Methods
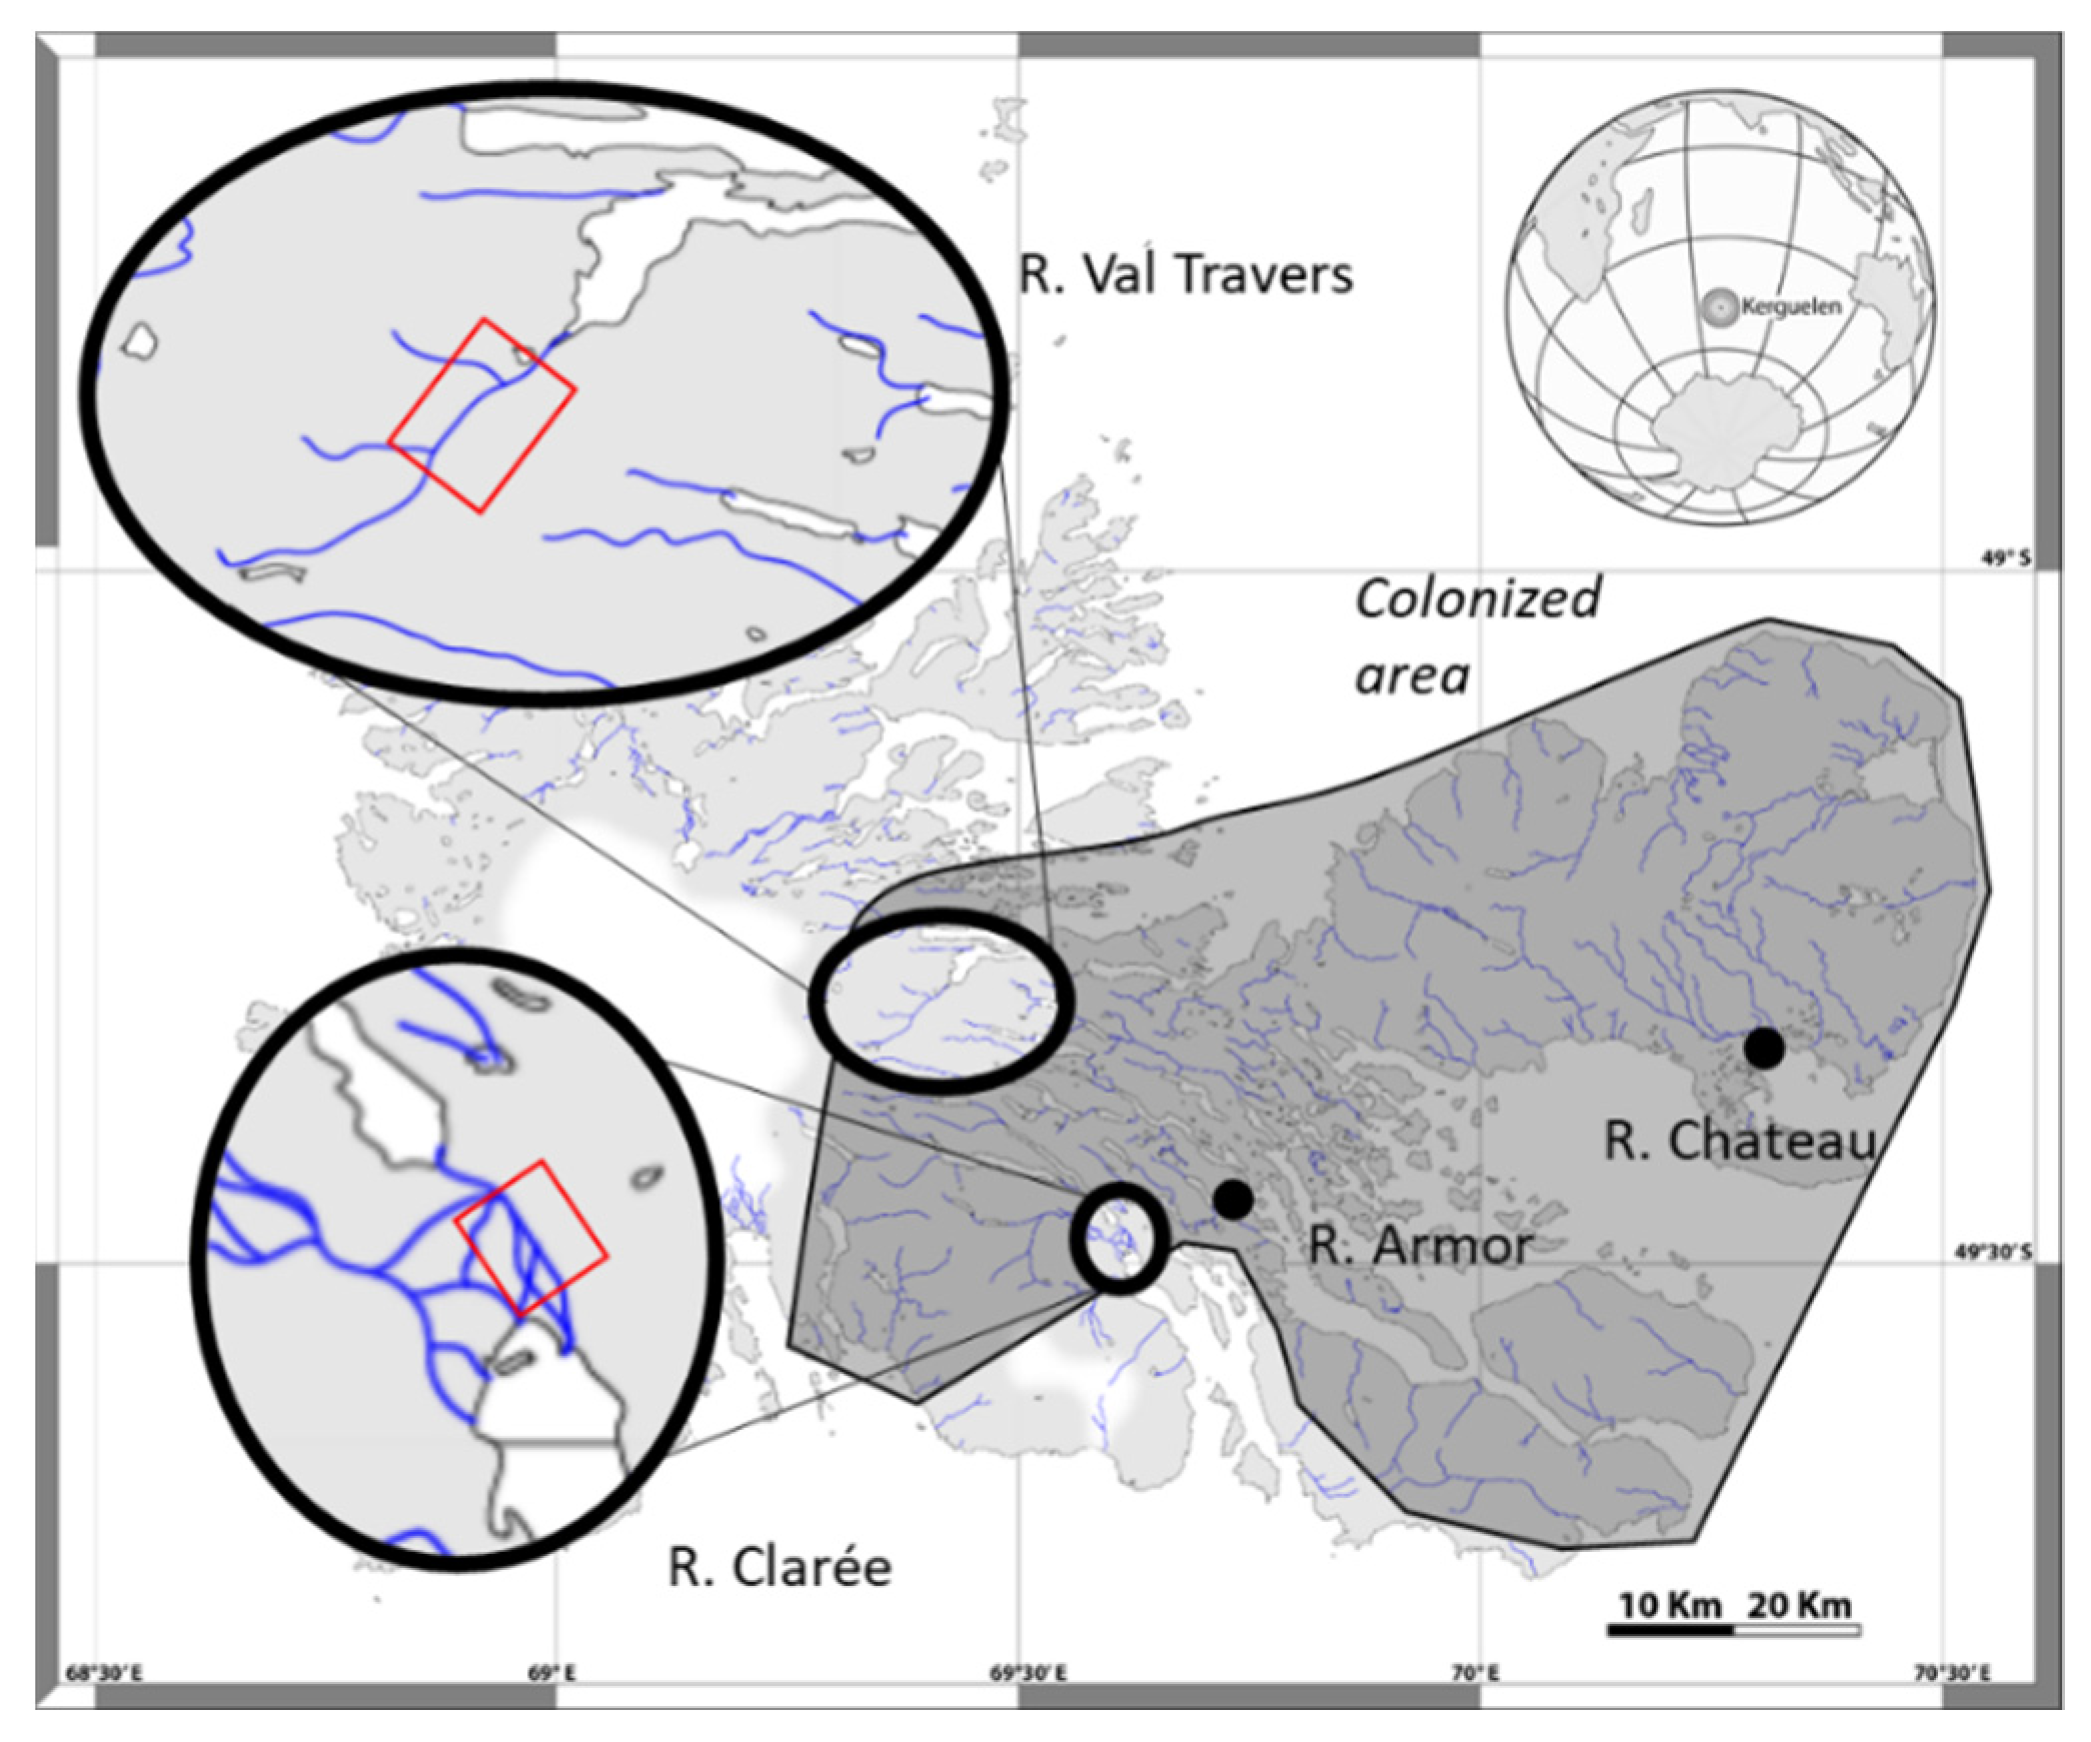
2.1. Sites and Populations Description
2.2. Transplantation Experiment and Populations Sampling
2.3. Ethical Statement
2.4. Genetic Analyses
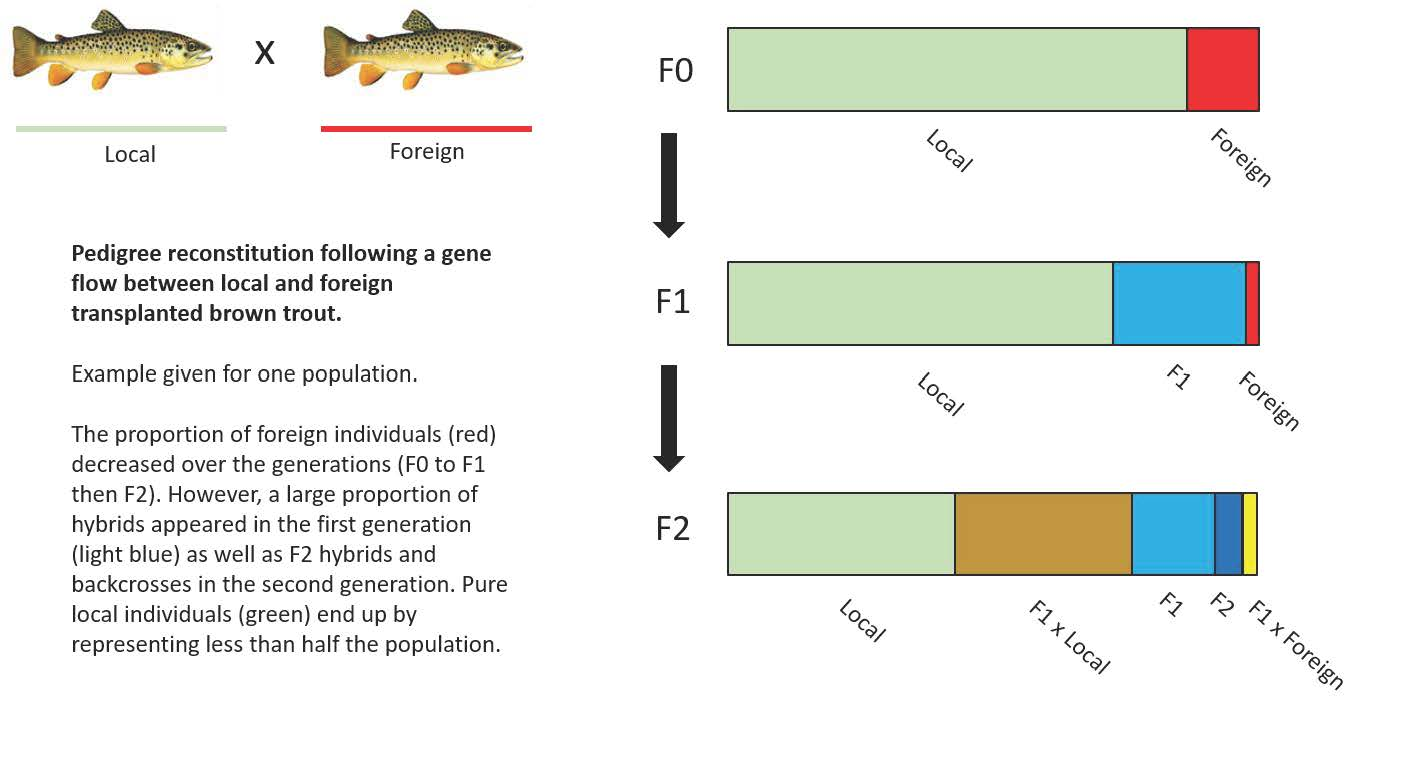
2.5. Genotypic Categories Assignation and Reconstruction of Families
2.6. Estimating Fitness
2.7. Components of Selection
3. Results
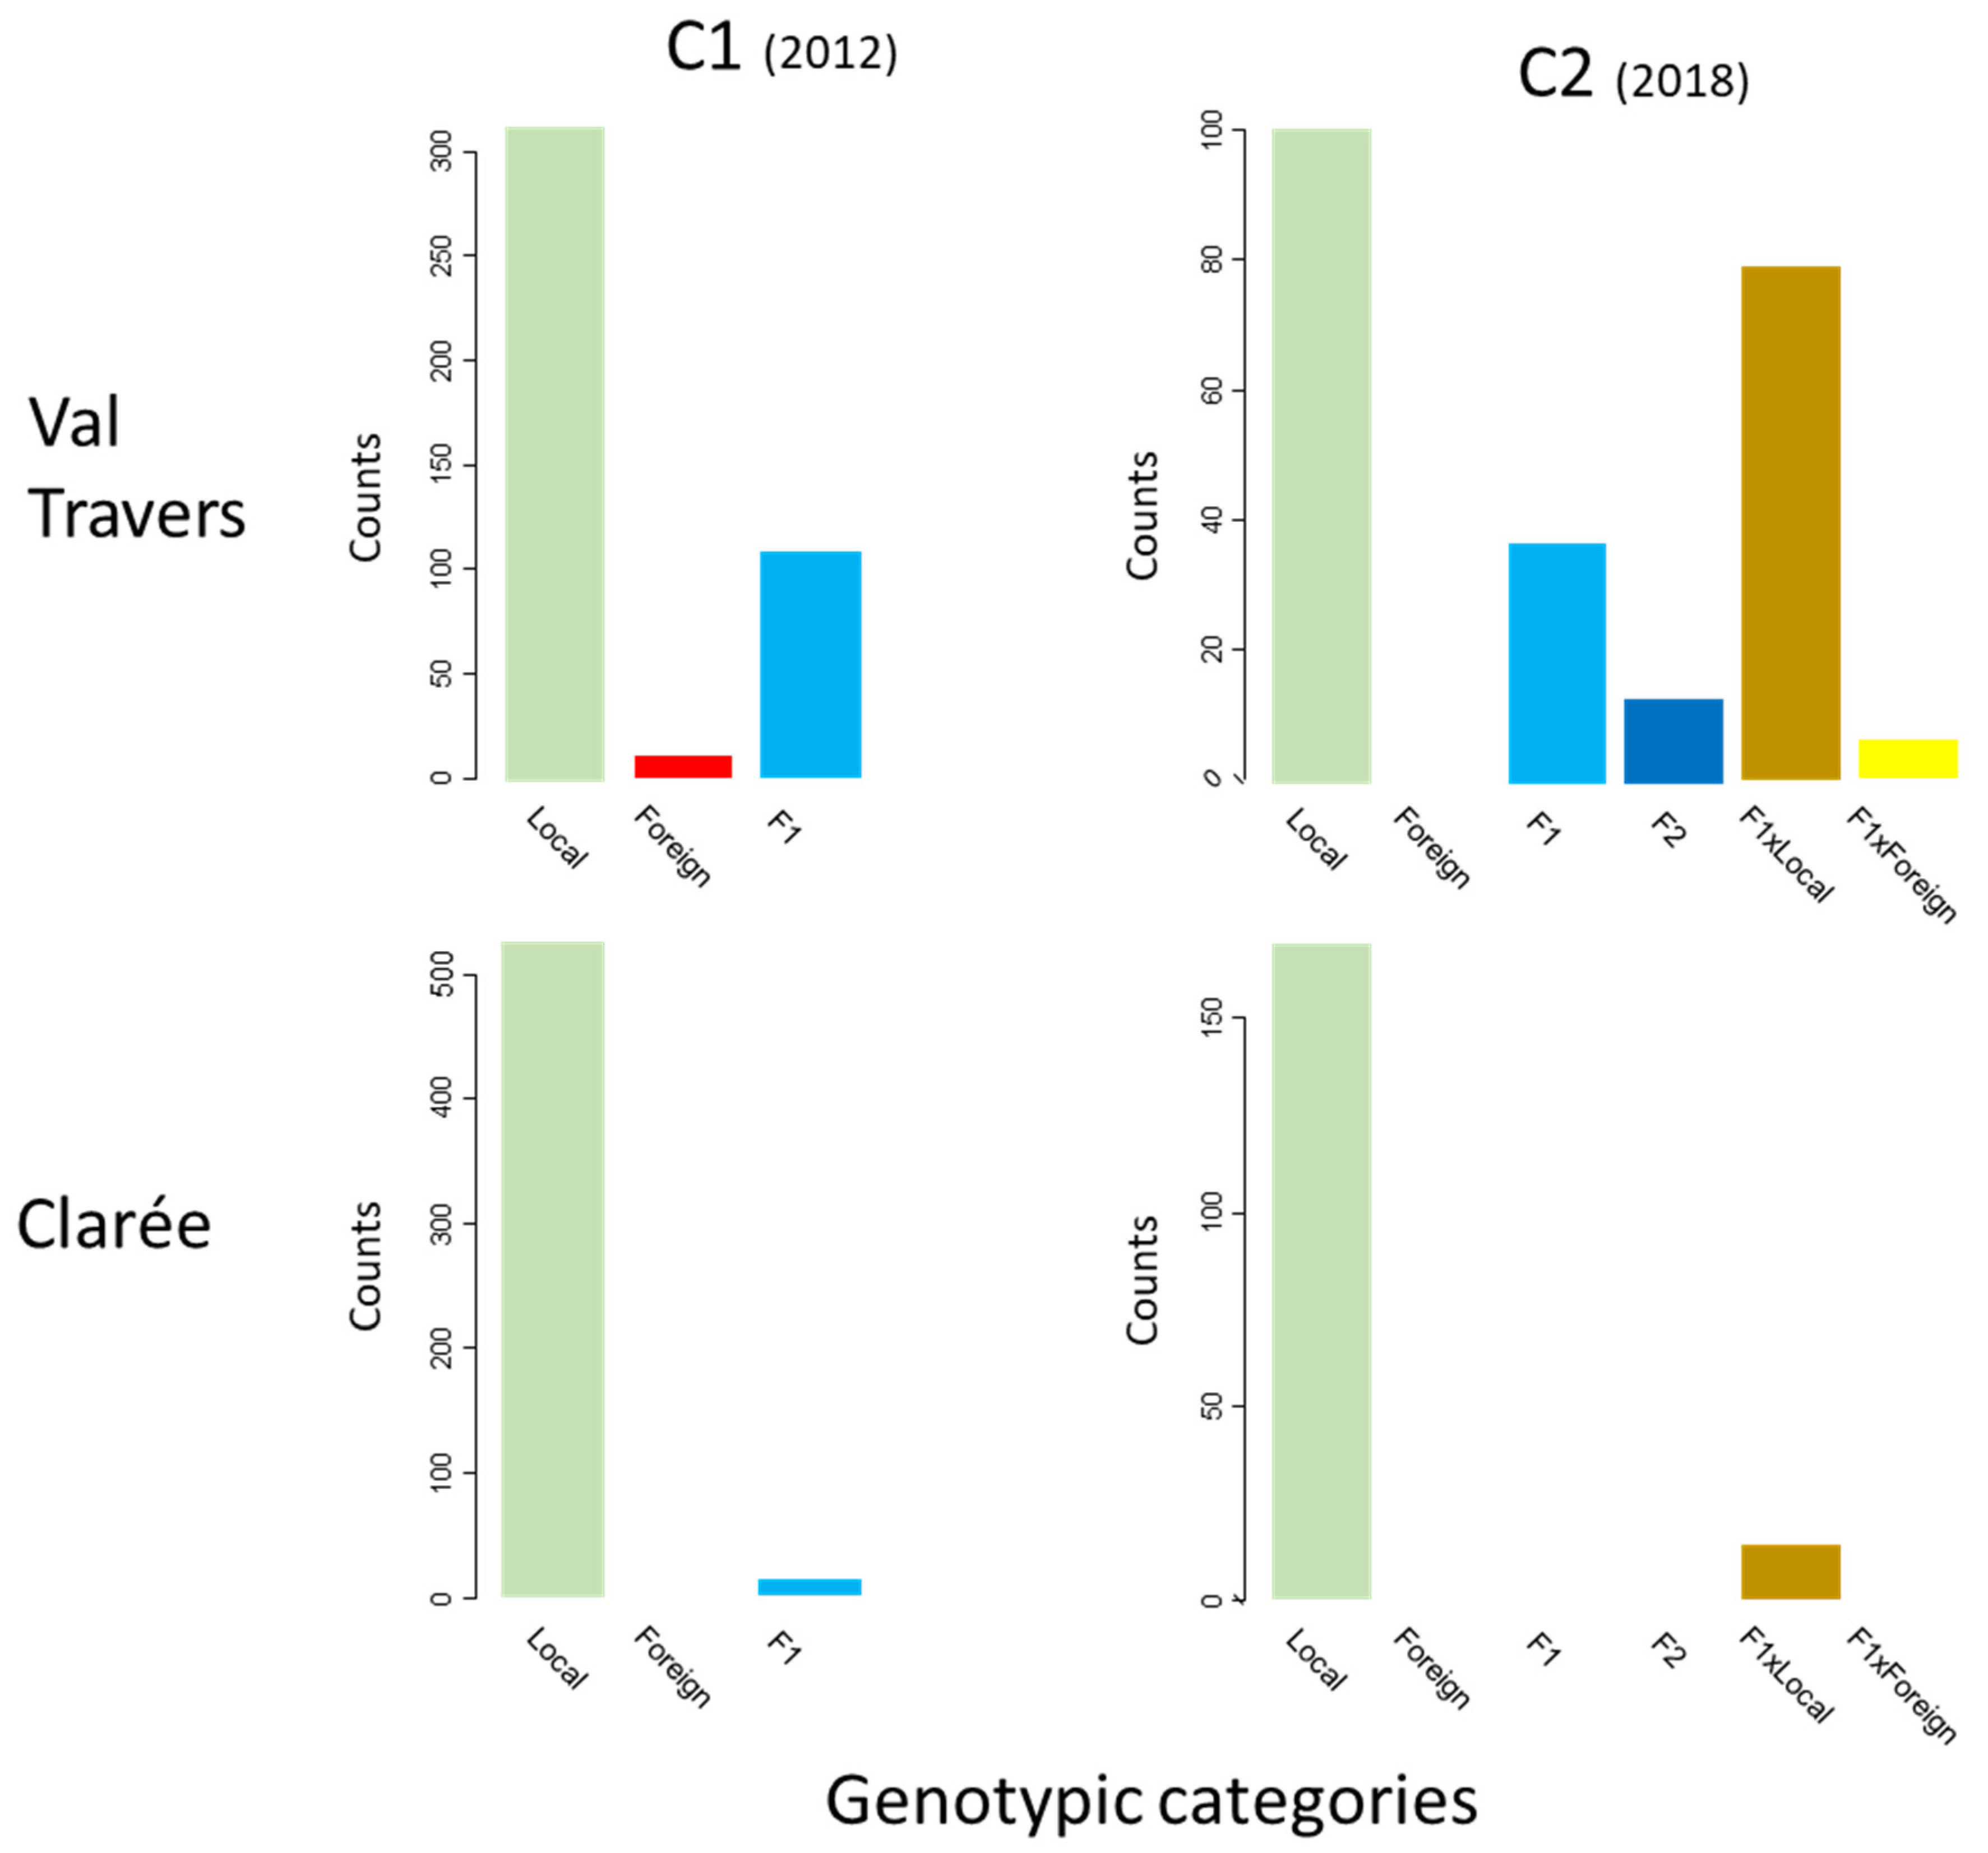
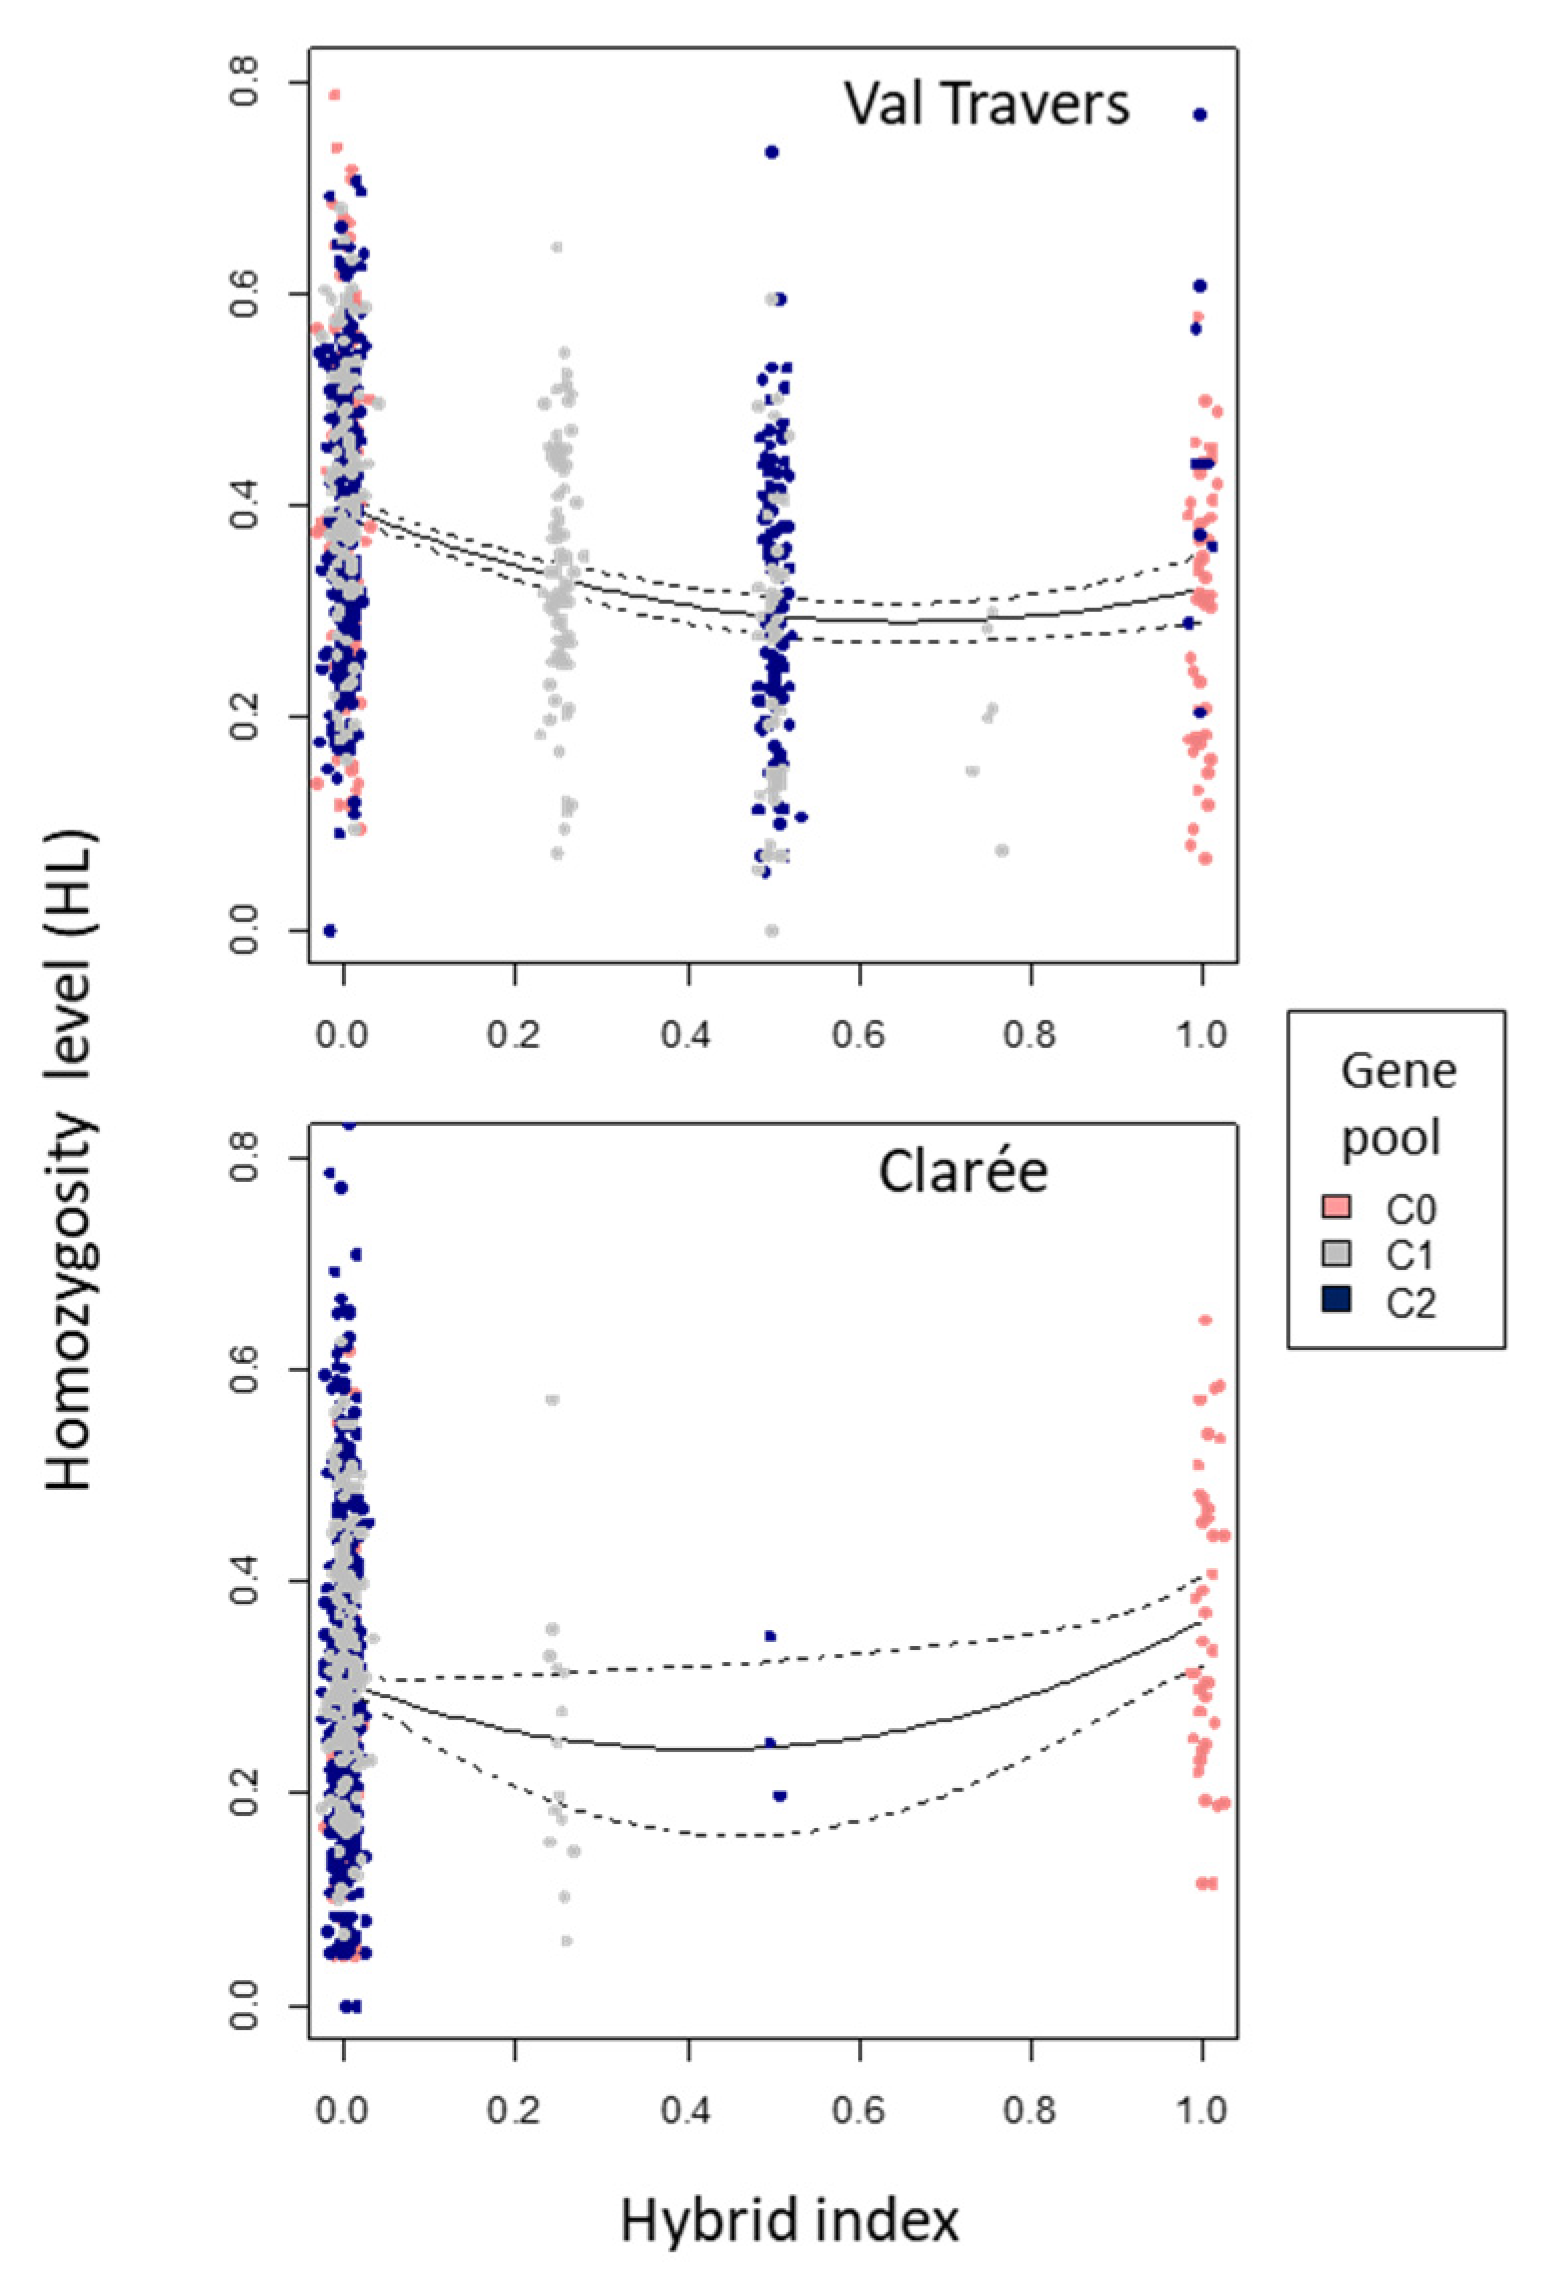
3.1. Gene Flow
3.2. Fitness of the Different Genotypic Categories
3.3. Components of Selection
4. Discussion
4.1. Local Adaptation
4.2. Genetic Rescue
4.3. Other Drivers of Gene Flow
Author Contributions
Funding
Acknowledgments
Conflicts of Interest
Appendix A. Model Code and Data for Density Estimation
- (A)
- Model code
- (A)
- Data for Clarée
- (A)
- Data for Val Travers
Appendix B. Genotyping Protocols, Genotyping Errors Detection, and Sample Sizes
- (A)
- Genotyping
- (A)
- Microsatellite Error Rates

| multiplex A | ||||||
| microsatellite | Ssa197 | SsaD190 | StrUBA | T3-13 | SSOSL438 | Ssa179NVH |
| error rates (%) | 0 | 1.26 | 4.04 | 2.78 | 7.83 | 2.27 |
| multiplex B | ||||||
| microsatellite | Str58 | Ssa103NVH | OmyRT5U | Ss4 | ||
| error rates (%) | 0 | 0 | 0.76 | 0.51 | ||
| multiplex C | ||||||
| microsatellite | SSOSL85 | SSOSL311 | SsaT47Lee | Ssa121NVH | SSOSL417 | Ssa159NVH |
| error rates (%) | 0.51 | 0.51 | 1.01 | 4.29 | 1.26 | 0.51 |
Appendix C. Density Estimates, and Estimates of the Proportion of Transplanted Individuals
| Age Class | Sampling Date | 2.5% Quantile | 50% Quantile | 97.5% Quantile |
|---|---|---|---|---|
| 1< age < 2 years | 27/12/2009 | 235.7 | 256.2 | 3659 |
| 27/12/2009 | 420.8 | 420.8 | 514.3 | |
| 27/12/2009 | 923.8 | 923.8 | 1097 | |
| 23/12/2010 | 849.3 | 874.3 | 974.2 | |
| 23/12/2010 | 821.2 | 821.2 | 1049 | |
| Average | 650.16 | |||
| age > 2 years | 27/12/2009 | 607.8 | 841.6 | 2010 |
| 27/12/2009 | 808.3 | 808.3 | 1212 | |
| Average | 824.95 | |||
| Total density per hectare | 1475.11 |
| Dispersal Scenario | Restricted | Unrestricted |
|---|---|---|
| Area considered (in hectare) | 1 | 18 |
| Population size | 1475.11 | 26551.98 |
| Number of transplanted individuals | 151 | 151 |
| Proportion of transplanted individuals | 0.10236525 | 0.00568696 |
| Age Class | Sampling Date | 2.5% Quantile | 50% Quantile | 97.5% Quantile |
|---|---|---|---|---|
| 1< age < 2 years | 04/01/2010 | 2268 | 2268 | 2721 |
| 05/01/2010 | 698.6 | 698.6 | 1048 | |
| 06/01/2010 | 1115 | 1203 | 1437 | |
| 04/01/2011 | 727.8 | 787.5 | 918.7 | |
| 16/01/2012 | 435.1 | 468.5 | 602.4 | |
| 16/01/2012 | 997.6 | 1081 | 1358 | |
| Average | 1084.43 | |||
| age > 2 years | 04/01/2010 | 2721 | 3628 | 10,430 |
| 05/01/2010 | 815 | 1514 | 7335 | |
| 06/01/2010 | 1027 | 1349 | 3286 | |
| 04/01/2011 | 584.6 | 680.1 | 1110 | |
| 16/01/2012 | 468.5 | 870.1 | 3514 | |
| 16/01/2012 | 775.9 | 969.9 | 8037 | |
| Average | 1076.62 | |||
| Total density per hectare | 2161.05 |
| Dispersal Scenario | Restricted | Unrestricted |
|---|---|---|
| Area considered (in hectare) | 1 | 9 |
| Population size | 2161.05 | 19,449.48 |
| Number of transplanted individuals | 151 | 151 |
| Proportion of transplanted individuals | 0.069873333 | 0.007763704 |
References
- Williams, G.C. Natural Selection, the Costs of Reproduction, and a Refinement of Lack’s Principle. Am. Nat. 1966, 100, 687–690. [Google Scholar] [CrossRef] [Green Version]
- Baker, H.G.; Stebbins, G.L. Genetics of Colonizing Species, Proceedings. In International Union of Biological Sciences Symposia on General Biology 1964; Academic Press: Asilomar, CA, USA, 1965. [Google Scholar]
- Hendry, A.P.; Wenburg, J.K.; Bentzen, P.; Volk, E.C.; Quinn, T.P. Rapid Evolution of Reproductive Isolation in the Wild: Evidence from Introduced Salmon. Science 2000, 290, 516–518. [Google Scholar] [CrossRef] [PubMed] [Green Version]
- Barrett, S.C. Foundations of Invasion Genetics: The Baker and Stebbins Legacy. Mol. Ecol. 2015, 24, 1927–1941. [Google Scholar] [CrossRef] [PubMed]
- Wright, S. Evolution in Mendelian Populations. Genetics 1931, 16, 97. [Google Scholar] [PubMed]
- Garant, D.; Forde, S.E.; Hendry, A.P. The Multifarious Effects of Dispersal and Gene Flow on Contemporary Adaptation. Funct. Ecol. 2007, 24, 434–443. [Google Scholar] [CrossRef]
- Von Wettberg, E.J.; Marques, E.; Murren, C.J. Local Adaptation or Foreign Advantage? Effective Use of a Single-Test Site Common Garden to Evaluate Adaptation across Ecological Scales. New Phytol. 2016, 211, 8–10. [Google Scholar] [CrossRef] [PubMed]
- Fitzpatrick, S.W.; Reid, B.N. Does Gene Flow Aggravate or Alleviate Maladaptation to Environmental Stress in Small Populations? Evol. Appl. 2019, 12, 1402–1416. [Google Scholar] [CrossRef] [Green Version]
- Hogg, J.T.; Forbes, S.H.; Steele, B.M.; Luikart, G. Genetic Rescue of an Insular Population of Large Mammals. Proc. R. Soc. B Biol. Sci. 2006, 273, 1491–1499. [Google Scholar] [CrossRef] [Green Version]
- Frankham, R. Genetic Rescue of Small Inbred Populations: Meta-Analysis Reveals Large and Consistent Benefits of Gene Flow. Mol. Ecol. 2015, 24, 2610–2618. [Google Scholar] [CrossRef]
- Tomasini, M.; Peischl, S. When Does Gene Flow Facilitate Evolutionary Rescue? arXiv 2020, arXiv:bio/622142. [Google Scholar] [CrossRef]
- Fitzpatrick, S.W.; Bradburd, G.S.; Kremer, C.T.; Salerno, P.E.; Angeloni, L.M.; Funk, W.C. Genomic and Fitness Consequences of Genetic Rescue in Wild Populations. Curr. Biol. 2020, 30, 517–522. [Google Scholar] [CrossRef] [PubMed] [Green Version]
- Schiffers, K.; Bourne, E.C.; Lavergne, S.; Thuiller, W.; Travis, J.M. Limited Evolutionary Rescue of Locally Adapted Populations Facing Climate Change. Philos. Trans. R. Soc. B Biol. Sci. 2013, 368, 20120083. [Google Scholar] [CrossRef] [PubMed] [Green Version]
- Bourne, E.C.; Bocedi, G.; Travis, J.M.; Pakeman, R.J.; Brooker, R.W.; Schiffers, K. Between Migration Load and Evolutionary Rescue: Dispersal, Adaptation and the Response of Spatially Structured Populations to Environmental Change. Proc. R. Soc. B Biol. Sci. 2014, 281, 20132795. [Google Scholar] [CrossRef] [PubMed] [Green Version]
- Ceballos, G.; Ehrlich, P.R.; Dirzo, R. Biological Annihilation via the Ongoing Sixth Mass Extinction Signaled by Vertebrate Population Losses and Declines. Proc. Natl. Acad. Sci. USA 2017, 114, E6089–E6096. [Google Scholar] [CrossRef] [PubMed] [Green Version]
- Razgour, O.; Forester, B.; Taggart, J.B.; Bekaert, M.; Juste, J.; Ibáñez, C.; Puechmaille, S.J.; Novella-Fernandez, R.; Alberdi, A.; Manel, S. Considering Adaptive Genetic Variation in Climate Change Vulnerability Assessment Reduces Species Range Loss Projections. Proc. Natl. Acad. Sci. USA 2019, 116, 10418–10423. [Google Scholar] [CrossRef] [Green Version]
- Davis, M.B.; Shaw, R.G. Range Shifts and Adaptive Responses to Quaternary Climate Change. Science 2001, 292, 673–679. [Google Scholar] [CrossRef] [Green Version]
- Taylor, E.B. A Review of Local Adaptation in Salmonidac, with Particular Reference to Pacific and Atlantic Salmon. Aquaculture 1991, 98, 185–207. [Google Scholar] [CrossRef]
- Adkison, M.D. Population Differentiation in Pacific Salmons: Local Adaptation Genetic Drift, or the Environment? Can. J. Fish. Aquat. Sci. 1995, 52, 2762–2777. [Google Scholar] [CrossRef]
- Haugen, T.O.; Vøllestad, L.A. Population Differences in Early Life-History Traits in Grayling. J. Evol. Biol. 2000, 13, 897–905. [Google Scholar] [CrossRef]
- Garcia de Leaniz, C.; Fleming, I.A.; Einum, S.; Verspoor, E.; Jordan, W.C.; Consuegra, S.; Aubin-Horth, N.; Lajus, D.; Letcher, B.H.; Youngson, A.F. A Critical Review of Adaptive Genetic Variation in Atlantic Salmon: Implications for Conservation. Biol. Rev. 2007, 82, 173–211. [Google Scholar] [CrossRef]
- Fraser, D.J.; Weir, L.K.; Bernatchez, L.; Hansen, M.M.; Taylor, E.B. Extent and Scale of Local Adaptation in Salmonid Fishes: Review and Meta-Analysis. Heredity 2011, 106, 404–420. [Google Scholar] [CrossRef] [PubMed] [Green Version]
- Bartels, D.; Salamini, F. Desiccation Tolerance in the Resurrection Plant craterostigma Plantagineum. A Contribution to the Study of Drought Tolerance at the Molecular Level. Plant Physiol. 2001, 127, 1346–1353. [Google Scholar] [CrossRef]
- Beacham, T.D.; Murray, C.B. Sexual Dimorphism in Length of Upper Jaw and Adipose Fin of Immature and Maturing Pacific Salmon (Oncorhynchus). Aquaculture 1986, 58, 269–276. [Google Scholar] [CrossRef]
- Bernatchez, L. Ecological Theory of Adaptive Radiation: Empirical Assessment from Coregonine Fishes (Salmoniformes); Hendry, A.P., Stearns, S.C., Eds.; Oxford University Press: Oxford, UK, 2004; pp. 175–207. [Google Scholar]
- Derome, N.; Bernatchez, L. The Transcriptomics of Ecological Convergence between 2 Limnetic Coregonine Fishes (Salmonidae). Mol. Biol. Evol. 2006, 23, 2370–2378. [Google Scholar] [CrossRef] [PubMed]
- Normandeau, E.; Hutchings, J.A.; Fraser, D.J.; Bernatchez, L. Population-Specific Gene Expression Responses to Hybridization between Farm and Wild Atlantic Salmon. Evol. Appl. 2009, 2, 489–503. [Google Scholar] [CrossRef] [PubMed]
- Vandersteen Tymchuk, W.; O’reilly, P.; Bittman, J.; MacDonald, D.; Schulte, P. Conservation Genomics of Atlantic Salmon: Variation in Gene Expression between and within Regions of the Bay of Fundy. Mol. Ecol. 2010, 19, 1842–1859. [Google Scholar] [CrossRef] [PubMed]
- Bernatchez, L.; Renaut, S.; Whiteley, A.R.; Derome, N.; Jeukens, J.; Landry, L.; Lu, G.; Nolte, A.W.; Østbye, K.; Rogers, S.M.; et al. On the Origin of Species: Insights from the Ecological Genomics of Lake Whitefish. Philos. Trans. R. Soc. B Biol. Sci. 2010, 365, 1783–1800. [Google Scholar] [CrossRef] [Green Version]
- Goetz, F.; Rosauer, D.; Sitar, S.; Goetz, G.; Simchick, C.; Roberts, S.; Johnson, R.; Murphy, C.; Bronte, C.R.; Mackenzie, S. A Genetic Basis for the Phenotypic Differentiation between Siscowet and Lean Lake Trout (Salvelinus Namaycush). Mol. Ecol. 2010, 19, 176–196. [Google Scholar] [CrossRef]
- Jensen, L.F.; Hansen, M.M.; Pertoldi, C.; Holdensgaard, G.; Mensberg, K.-L.D.; Loeschcke, V. Local Adaptation in Brown Trout Early Life-History Traits: Implications for Climate Change Adaptability. Proc. R. Soc. B Biol. Sci. 2008, 275, 2859–2868. [Google Scholar] [CrossRef] [Green Version]
- Stelkens, R.B.; Jaffuel, G.; Escher, M.; Wedekind, C. Genetic and Phenotypic Population Divergence on a Microgeographic Scale in Brown Trout. Mol. Ecol. 2012, 21, 2896–2915. [Google Scholar] [CrossRef] [Green Version]
- Westley, P.A.; Ward, E.J.; Fleming, I.A. Fine-scale local adaptation in an invasive freshwater fish has evolved in contemporary times. Proc. R. Soc. B 2013, 280, 2012–2327. [Google Scholar] [CrossRef] [PubMed] [Green Version]
- Yamamoto, S.; Maekawa, K.; Tamate, T.; Koizumi, I.; Hasegawa, K.; Kubota, H. Genetic Evaluation of Translocation in Artificially Isolated Populations of White-Spotted Charr (Salvelinus Leucomaenis). Fish. Res. 2006, 78, 352–358. [Google Scholar] [CrossRef]
- Robinson, Z.L.; Coombs, J.A.; Hudy, M.; Nislow, K.H.; Letcher, B.H.; Whiteley, A.R. Experimental Test of Genetic Rescue in Isolated Populations of Brook Trout. Mol. Ecol. 2017, 26, 4418–4433. [Google Scholar] [CrossRef] [Green Version]
- Lecomte, F.; Beall, E.; Chat, J.; Davaine, P.; Gaudin, P. The Complete History of Salmonid Introductions in the Kerguelen Islands, Southern Ocean. Polar Biol. 2013, 36, 457–475. [Google Scholar] [CrossRef]
- Labonne, J.; Vignon, M.; Prévost, E.; Lecomte, F.; Dodson, J.J.; Kaeuffer, R.; Aymes, J.-C.; Jarry, M.; Gaudin, P.; Davaine, P.; et al. Invasion Dynamics of a Fish-Free Landscape by Brown Trout (Salmo Trutta). PLoS ONE 2013, 8, e71052. [Google Scholar] [CrossRef] [PubMed] [Green Version]
- Verfaillie, D.; Favier, V.; Dumont, M.; Jomelli, V.; Gilbert, A.; Brunstein, D.; Gallée, H.; Rinterknecht, V.; Menegoz, M.; Frenot, Y. Recent Glacier Decline in the Kerguelen Islands (49 S, 69 E) Derived from Modeling, Field Observations, and Satellite Data. J. Geophys. Res. Earth Surf. 2015, 120, 637–654. [Google Scholar] [CrossRef] [Green Version]
- Pitman, K.J.; Moore, J.W.; Sloat, M.R.; Beaudreau, A.H.; Bidlack, A.L.; Brenner, R.E.; Hood, E.W.; Pess, G.R.; Mantua, N.J.; Milner, A.M.; et al. Glacier Retreat and Pacific Salmon. BioScience 2020, 70, 220–236. [Google Scholar] [CrossRef]
- Kirkpatrick, M.; Barton, N.H. Evolution of a Species’ Range. Am. Nat. 1997, 150, 1–23. [Google Scholar] [CrossRef] [Green Version]
- Labonne, J.; Kaeuffer, R.; Guéraud, F.; Zhou, M.; Manicki, A.; Hendry, A.P. From the Bare Minimum: Genetics and Selection in Populations Founded by Only a Few Parents. Evol. Ecol. Res. 2016, 17, 21–34. [Google Scholar]
- Turesson, G. The Genotypical Response of the Plant Species to the Habitat. Hereditas 1922, 3, 211–350. [Google Scholar] [CrossRef]
- Hereford, J. A Quantitative Survey of Local Adaptation and Fitness Trade-Offs. Am. Nat. 2009, 173, 579–588. [Google Scholar] [CrossRef] [PubMed] [Green Version]
- Kawecki, T.J.; Ebert, D. Conceptual Issues in Local Adaptation. Ecol. Lett. 2004, 7, 1225–1241. [Google Scholar] [CrossRef] [Green Version]
- Jarry, M.; Beall, E.; Davaine, P.; Guéraud, F.; Gaudin, P.; Aymes, J.-C.; Labonne, J.; Vignon, M. Sea Trout (Salmo Trutta) Growth Patterns during Early Steps of Invasion in the Kerguelen Islands. Polar Biol. 2018, 41, 925–934. [Google Scholar] [CrossRef]
- Gharbi, K.; Gautier, A.; Danzmann, R.G.; Gharbi, S.; Sakamoto, T.; Høyheim, B.; Taggart, J.B.; Cairney, M.; Powell, R.; Krieg, F.; et al. A Linkage Map for Brown Trout (Salmo Trutta): Chromosome Homeologies and Comparative Genome Organization with Other Salmonid Fish. Genetics 2006, 172, 2405–2419. [Google Scholar] [CrossRef] [PubMed] [Green Version]
- Anderson, E.; Thompson, E. A Model-Based Method for Identifying Species Hybrids Using Multilocus Genetic Data. Genetics 2002, 160, 1217–1229. [Google Scholar] [PubMed]
- Wang, J. Estimating Genotyping Errors from Genotype and Reconstructed Pedigree Data. Methods Ecol. Evol. 2018, 9, 109–120. [Google Scholar] [CrossRef] [Green Version]
- Ovidio, M.; Philippart, J.-C.; Baras, É. Biais Methodologique Dans l’estimation Du Domaine Vital et de La Mobilite de S. Trutta Suite a l’adoption de Differentes Frequences de Localisation. Aquat. Living Resour. 2001, 6, 449–454. [Google Scholar] [CrossRef]
- Jonsson, B.; Jonsson, N. Habitats as Template for Life Histories. In Ecology of Atlantic Salmon and Brown Trout; Springer: Berlin/Heidelberg, Germany, 2011; pp. 1–21. [Google Scholar]
- Aparicio, J.; Ortego, J.; Cordero, P. What Should We Weigh to Estimate Heterozygosity, Alleles or Loci? Mol. Ecol. 2006, 15, 4659–4665. [Google Scholar] [CrossRef]
- Alho, J.S.; Välimäki, K.; Merilä, J. Rhh: An R Extension for Estimating Multilocus Heterozygosity and Heterozygosity–Heterozygosity Correlation. Mol. Ecol. Resour. 2010, 10, 720–722. [Google Scholar] [CrossRef]
- Delph, L.F. The Study of Local Adaptation: A Thriving Field of Research. J. Hered. 2017, 109, 1–2. [Google Scholar] [CrossRef]
- Latreille, A.C.; Pichot, C. Local-Scale Diversity and Adaptation along Elevational Gradients Assessed by Reciprocal Transplant Experiments: Lack of Local Adaptation in Silver Fir Populations. Ann. For. Sci. 2017, 74, 77. [Google Scholar] [CrossRef] [Green Version]
- Labonne, J.; Aymes, J.-C.; Beall, E.; Chat, J.; Dopico-Rodriguez, E.V.; Vasquez, E.G.; Gaudin, P.; Gueraud, F.; Henry, A.; Horreo-Escandon, J.-L.; et al. Ecologie Évolutive de La Colonisation Des Îles Kerguelen Par Les Salmonidés. Scientific report, Université de Pau et des Pays de l’Adour. Available online: https://hal.archives-ouvertes.fr/hal-01210200/document (accessed on 17 November 2020).
- Pavey, S.A.; Collin, H.; Nosil, P.; Rogers, S.M. The Role of Gene Expression in Ecological Speciation. Ann. N. Y. Acad. Sci. 2010, 1206, 110. [Google Scholar] [CrossRef] [PubMed] [Green Version]
- Quinn, T.P.; Kinnison, M.T.; Unwin, M.J. Evolution of Chinook Salmon (Oncorhynchus Tshawytscha) Populations in New Zealand: Pattern, Rate, and Process. In Microevolution Rate, Pattern, Process; Springer: Berlin/Heidelberg, Germany, 2001; pp. 493–513. [Google Scholar]
- Aubin-Horth, N.; Bourque, J.-F.; Daigle, G.; Hedger, R.; Dodson, J.J. Longitudinal Gradients in Threshold Sizes for Alternative Male Life History Tactics in a Population of Atlantic Salmon (Salmo Salar). Can. J. Fish. Aquat. Sci. 2006, 63, 2067–2075. [Google Scholar] [CrossRef] [Green Version]
- Miskelly, C.M.; Taylor, G.A.; Gummer, H.; Williams, R. Translocations of Eight Species of Burrow-Nesting Seabirds (Genera Pterodroma, Pelecanoides, Pachyptila and Puffinus: Family Procellariidae). Biol. Conserv. 2009, 142, 1965–1980. [Google Scholar] [CrossRef]
- Sax, D.F.; Stachowicz, J.J.; Brown, J.H.; Bruno, J.F.; Dawson, M.N.; Gaines, S.D.; Grosberg, R.K.; Hastings, A.; Holt, R.D.; Mayfield, M.M.; et al. Ecological and Evolutionary Insights from Species Invasions. Trends Ecol. Evol. 2007, 22, 465–471. [Google Scholar] [CrossRef]
- Charlesworth, D.; Charlesworth, B. Inbreeding Depression and Its Evolutionary Consequences. Annu. Rev. Ecol. Syst. 1987, 18, 237–268. [Google Scholar] [CrossRef]
- Cain, B.; Wandera, A.B.; Shawcross, S.G.; Edwin Harris, W.; Stevens-Wood, B.; Kemp, S.J.; OKITA-OUMA, B.; Watts, P.C. Sex-Biased Inbreeding Effects on Reproductive Success and Home Range Size of the Critically Endangered Black Rhinoceros. Conserv. Biol. 2014, 28, 594–603. [Google Scholar] [CrossRef]
- Forcada, J.; Hoffman, J.I. Climate Change Selects for Heterozygosity in a Declining Fur Seal Population. Nature 2014, 511, 462–465. [Google Scholar] [CrossRef]
- Haanes, H.; Markussen, S.S.; Herfindal, I.; Røed, K.H.; Solberg, E.J.; Heim, M.; Midthjell, L.; Sæther, B.-E. Effects of Inbreeding on Fitness-Related Traits in a Small Isolated Moose Population. Ecol. Evol. 2013, 3, 4230–4242. [Google Scholar] [CrossRef]
- Servedio, M.R. Beyond Reinforcement: The Evolution of Premating Isolation by Direct Selection on Preferences and Postmating, Prezygotic Incompatibilities. Evolution 2001, 55, 1909–1920. [Google Scholar] [CrossRef]
- Svensson, E.I.; Eroukhmanoff, F.; Friberg, M. Effects of Natural and Sexual Selection on Adaptive Population Divergence and Premating Isolation in a Damselfly. Evolution 2006, 60, 1242–1253. [Google Scholar] [CrossRef] [PubMed]
- Dolgin, E.; Whitlock, M.; Agrawal, A. Male Drosophila Melanogaster Have Higher Mating Success When Adapted to Their Thermal Environment. J. Evol. Biol. 2006, 19, 1894–1900. [Google Scholar] [CrossRef] [PubMed] [Green Version]
- Hendry, A.P.; Nosil, P.; Rieseberg, L.H. The speed of ecological speciation. Funct. Ecol. 2007, 21, 455–464. [Google Scholar] [CrossRef] [PubMed] [Green Version]
- Qvarnström, A.; Brommer, J.E.; Gustafsson, L. Testing the Genetics Underlying the Co-Evolution of Mate Choice and Ornament in the Wild. Nature 2006, 441, 84–86. [Google Scholar] [CrossRef]
- Labonne, J.; Hendry, A.P. Natural and Sexual Selection Giveth and Taketh Away Reproductive Barriers: Models of Population Divergence in Guppies. Am. Nat. 2010, 176, 26–39. [Google Scholar] [CrossRef] [Green Version]
- Maan, M.E.; Seehausen, O. Ecology, Sexual Selection and Speciation. Ecol. Lett. 2011, 14, 591–602. [Google Scholar] [CrossRef]
- Wedekind, C.; Seebeck, T.; Bettens, F.; Paepke, A.J. MHC-Dependent Mate Preferences in Humans. Proc. R. Soc. Lond. B Biol. Sci. 1995, 260, 245–249. [Google Scholar]
- Daniel, M.J.; Koffinas, L.; Hughes, K.A. Mating Preference for Novel Phenotypes Can Be Explained by General Neophilia in Female Guppies. Am. Nat. 2020. [Google Scholar] [CrossRef]
- Gil, J.; Caudron, A.; Labonne, J. Can Female Preference Drive Intraspecific Diversity Dynamics in Brown Trout (Salmo Trutta, L.)? Ecol. Freshw. Fish 2016, 25, 352–359. [Google Scholar] [CrossRef]
- Forsberg, L.A.; Dannewitz, J.; Petersson, E.; Grahn, M. Influence of Genetic Dissimilarity in the Reproductive Success and Mate Choice of Brown Trout–Females Fishing for Optimal MHC Dissimilarity. J. Evol. Biol. 2007, 20, 1859–1869. [Google Scholar] [CrossRef]
- Garner, S.R.; Bortoluzzi, R.N.; Heath, D.D.; Neff, B.D. Sexual Conflict Inhibits Female Mate Choice for Major Histocompatibility Complex Dissimilarity in Chinook Salmon. Proc. R. Soc. B Biol. Sci. 2010, 277, 885–894. [Google Scholar] [CrossRef] [PubMed] [Green Version]
- Tentelier, C.; Barroso-Gomila, O.; Lepais, O.; Manicki, A.; Romero-Garmendia, I.; Jugo, B. Testing Mate Choice and Overdominance at MH in Natural Families of Atlantic Salmon Salmo Salar. J. Fish Biol. 2017, 90, 1644–1659. [Google Scholar] [CrossRef] [PubMed]
- Ayala, F.J.; Campbell, C.A. Frequency-Dependent Selection. Annu. Rev. Ecol. Syst. 1974, 5, 115–138. [Google Scholar] [CrossRef]
- Hughes, K.A.; DU, L.; RODD, F.H.; REZNICK, D.N. Familiarity Leads to Female Mate Preference for Novel Males in the Guppy, Poecilia Reticulata. Anim. Behav. 1999, 58, 907–916. [Google Scholar] [CrossRef] [Green Version]
- Gauthey, Z.; Hendry, A.; Elosegi, A.; Tentelier, C.; Labonne, J. The Context Dependence of Assortative Mating: A Demonstration with Conspecific Salmonid Populations. J. Evol. Biol. 2016, 29, 1827–1835. [Google Scholar] [CrossRef]
- Schwartz, A.K.; Hendry, A.P. Sexual Selection and the Detection of Ecological Speciation. Evol. Ecol. Res. 2006, 8, 399–413. [Google Scholar]
- Svensson, E.; Gosden, T. Contemporary Evolution of Secondary Sexual Traits in the Wild. Funct. Ecol. 2007, 21, 422–433. [Google Scholar] [CrossRef]
- Hendry, A.P. Ecological Speciation! Or the Lack Thereof? Can. J. Fish. Aquat. Sci. 2009, 66, 1383–1398. [Google Scholar] [CrossRef] [Green Version]
- Candolin, U.; Heuschele, J. Is Sexual Selection Beneficial during Adaptation to Environmental Change? Trends Ecol. Evol. 2008, 23, 446–452. [Google Scholar] [CrossRef]
- Doherty, P.F.; Sorci, G.; Royle, J.A.; Hines, J.E.; Nichols, J.D.; Boulinier, T. Sexual Selection Affects Local Extinction and Turnover in Bird Communities. Proc. Natl. Acad. Sci. USA 2003, 100, 5858–5862. [Google Scholar] [CrossRef] [Green Version]
- Kokko, H.; Brooks, R. Sexy to Die for? Sexual Selection and the Risk of Extinction. In Annales Zoologici Fennici; JSTOR: New York, NY, USA, 2003; pp. 207–219. [Google Scholar]
- Servedio, M.R.; Boughman, J.W. The Role of Sexual Selection in Local Adaptation and Speciation. Annu. Rev. Ecol. Evol. Syst. 2017, 48, 85–109. [Google Scholar] [CrossRef]
- Carle, F.L.; Strub, M.R. A new method for estimating population size from removal data. Biometrics 1978, 34, 621–630. [Google Scholar] [CrossRef]


| Dispersal Scenario.(and Initial Percentage of Transplanted Individuals) | Population | Variables | Genotypic Category | Statistics | ||
|---|---|---|---|---|---|---|
| Local | Foreign | Sum | p-Value | |||
| Expected fitness | 428.6461 | 3.3539 | 432 | |||
| (0.77%) | Val Travers | Observed fitness | 368 | 64 | 432 | |
| Χ2 value | 8.580 | 1096.612 | 1105.192 | p < 0.0001 | ||
| Unrestricted | ||||||
| Expected fitness | 524.9973 | 3.0027 | 528 | |||
| (0.57%) | Clarée | Observed fitness | 526.5 | 1.5 | 528 | |
| Χ2 value | 0.0043 | 0.7520 | 0.7563 | p = 0.08 | ||
| Expected fitness | 410.8147 | 30.1853 | 432 | |||
| (6.98%) | Val Travers | Observed fitness | 368 | 64 | 432 | |
| Χ2 value | 2.8456 | 37.8806 | 40.7262 | p < 0.0001 | ||
| Restricted | ||||||
| Expected fitness | 473.9511 | 54.0489 | 528 | |||
| (10.24%) | Clarée | Observed fitness | 526.5 | 1.5 | 528 | |
| Χ2 value | 5.826 | 51.09 | 56.916 | p < 0.0001 | ||
| Population | Variables | Genotypic Category | Statistics | |||
|---|---|---|---|---|---|---|
| Local | F1 | Foreign | Sum | p-Value | ||
| Expected fitness | 171.54 | 59 | 5.46 | 236 | ||
| Val Travers | Observed fitness | 159 | 55.5 | 21.5 | 236 | |
| Chi square value | 0.916 | 0.207 | 47.078 | 48.202 | p < 0.0001 | |
| Expected fitness | 181.96 | 1.04 | 0 | 183 | ||
| Clarée | Observed fitness | 176 | 7 | 0 | 183 | |
| Chi square value | 0.195 | 34.165 | 0 | 34.360 | p < 0.0001 | |
| Population | Hybrid Index Effect | Degrees of Freedom | Mean Square | F Value | p Value |
|---|---|---|---|---|---|
| Linear term | 1 | 0.064184 | 0.3717 | 0.5424 | |
| Val Travers | Non-Linear term | 1 | 0.194016 | 0.2898 | 0.2898 |
| Residuals | 382 | 0.1726664 | |||
| Linear term | 1 | 0.004937 | 0.0706 | 0.7906 | |
| Clarée | Non-Linear term | 1 | 0.064213 | 0.9179 | 0.3385 |
| Residuals | 835 | 0.069953 | 1.2004 |
| Population | Hybrid Index Effect | Degrees of Freedom | Mean Square | F Value | p Value |
|---|---|---|---|---|---|
| Linear term | 1 | 1.19384 | 70.456 | <0.0001 | |
| Val Travers | Non-Linear term | 1 | 0.45615 | 26.921 | <0.0001 |
| Residuals | 859 | 0.01694 | |||
| Linear term | 1 | 0.098087 | 5.1809 | 0.02309 | |
| Clarée | Non-Linear term | 1 | 0.085691 | 4.5261 | 0.03367 |
| Residuals | 835 | 0.018933 | 1.2004 |
Publisher’s Note: MDPI stays neutral with regard to jurisdictional claims in published maps and institutional affiliations. |
© 2020 by the authors. Licensee MDPI, Basel, Switzerland. This article is an open access article distributed under the terms and conditions of the Creative Commons Attribution (CC BY) license (http://creativecommons.org/licenses/by/4.0/).
Share and Cite
Labonne, J.; Manicki, A.; Chevalier, L.; Tétillon, M.; Guéraud, F.; Hendry, A.P. Using Reciprocal Transplants to Assess Local Adaptation, Genetic Rescue, and Sexual Selection in Newly Established Populations. Genes 2021, 12, 5. https://0-doi-org.brum.beds.ac.uk/10.3390/genes12010005
Labonne J, Manicki A, Chevalier L, Tétillon M, Guéraud F, Hendry AP. Using Reciprocal Transplants to Assess Local Adaptation, Genetic Rescue, and Sexual Selection in Newly Established Populations. Genes. 2021; 12(1):5. https://0-doi-org.brum.beds.ac.uk/10.3390/genes12010005
Chicago/Turabian StyleLabonne, Jacques, Aurélie Manicki, Louise Chevalier, Marin Tétillon, François Guéraud, and Andrew P. Hendry. 2021. "Using Reciprocal Transplants to Assess Local Adaptation, Genetic Rescue, and Sexual Selection in Newly Established Populations" Genes 12, no. 1: 5. https://0-doi-org.brum.beds.ac.uk/10.3390/genes12010005