
TEfinder: A Bioinformatics Pipeline for Detecting New Transposable Element Insertion Events in Next-Generation Sequencing Data

 , ,
, ,  and
and
Abstract
:1. Introduction
2. Materials and Methods
2.1. Requirements
- The default DNA fragment length or insert size of the short-read sequencing library is 400 base pairs (bp). For a sequencing library with an insert size of 500, this value can be modified by including “-fis 500”;
- The default maximum distance between reads for merging and forming clusters has been set to 150 bp. To decrease the value of this parameter by 30 bp, the “-md” argument can be set to 120;
- The default maximum target site duplication (TSD) length is 20 bp. Modifying this value can be useful if the TSD lengths of the TEs being analyzed are known leading to more targeted TE analysis results. The maximum TSD length can be increased to 30 bp by setting “-k 30”;
- The “-picard” argument should be set to the full path of the picard.jar file.
- An additional Java argument relating to Picard’s maximum memory heap size can be submitted to the pipeline as a fraction of the total memory allocated, leading to enhancement of the overall runtime. A maximum memory heap size of 25,000 MB is set via “-maxHeapMem 25000”;
- Multithreading is supported for the SAMtools commands of the pipeline via the thread option. The number of threads can be set to 4 using “-threads 4”;
- A working directory name can be provided as such “-workingdir TEfinder_Y1” for better file organization and differentiation amongst TEfinder runs;
- An output name can be provided to be appended to the default output names for effective labeling of files, such as “-outname Y1”;
- Users can also specify GTF as the output argument, “-out gtf” (case insensitive), which reports the TE insertions in GTF format;
- Lastly, if the user includes the optional argument “-intermed yes” (case insensitive), all intermediate files including the TE-specific directories are provided in addition to the output files.
2.2. Implementation
2.2.1. Preprocessing
- A FASTA file of the reference genome sequence. No special requirement.
- A BAM file of aligned paired-end reads to the reference genome sequence.
    bwa index reference.fasta
    bwa mem -R “@RG\tID:sample\tPL:illumina\tLB:LIB\tSM:sample” \
    reference.fasta sample_R1.fq sample_R2.fq > sample.bam
- 3.
-
GTF file of TE annotation in the reference genome sequence.
    build_lmer_table -sequence reference.fasta -freq reference.freq
    RepeatScout -sequence reference.fasta -output TElib.fa -freq \
    reference.freq
RepeatMasker -lib TElib.fa -dir workingdir -gff reference.fasta
- 4.
-
Text file with names of the TEs of interest.
2.2.2. Pipeline
    TEfinder -alignment sample.bam -fa reference.fa -gtf TEs.gtf \
    -te List_of_TEs.txt
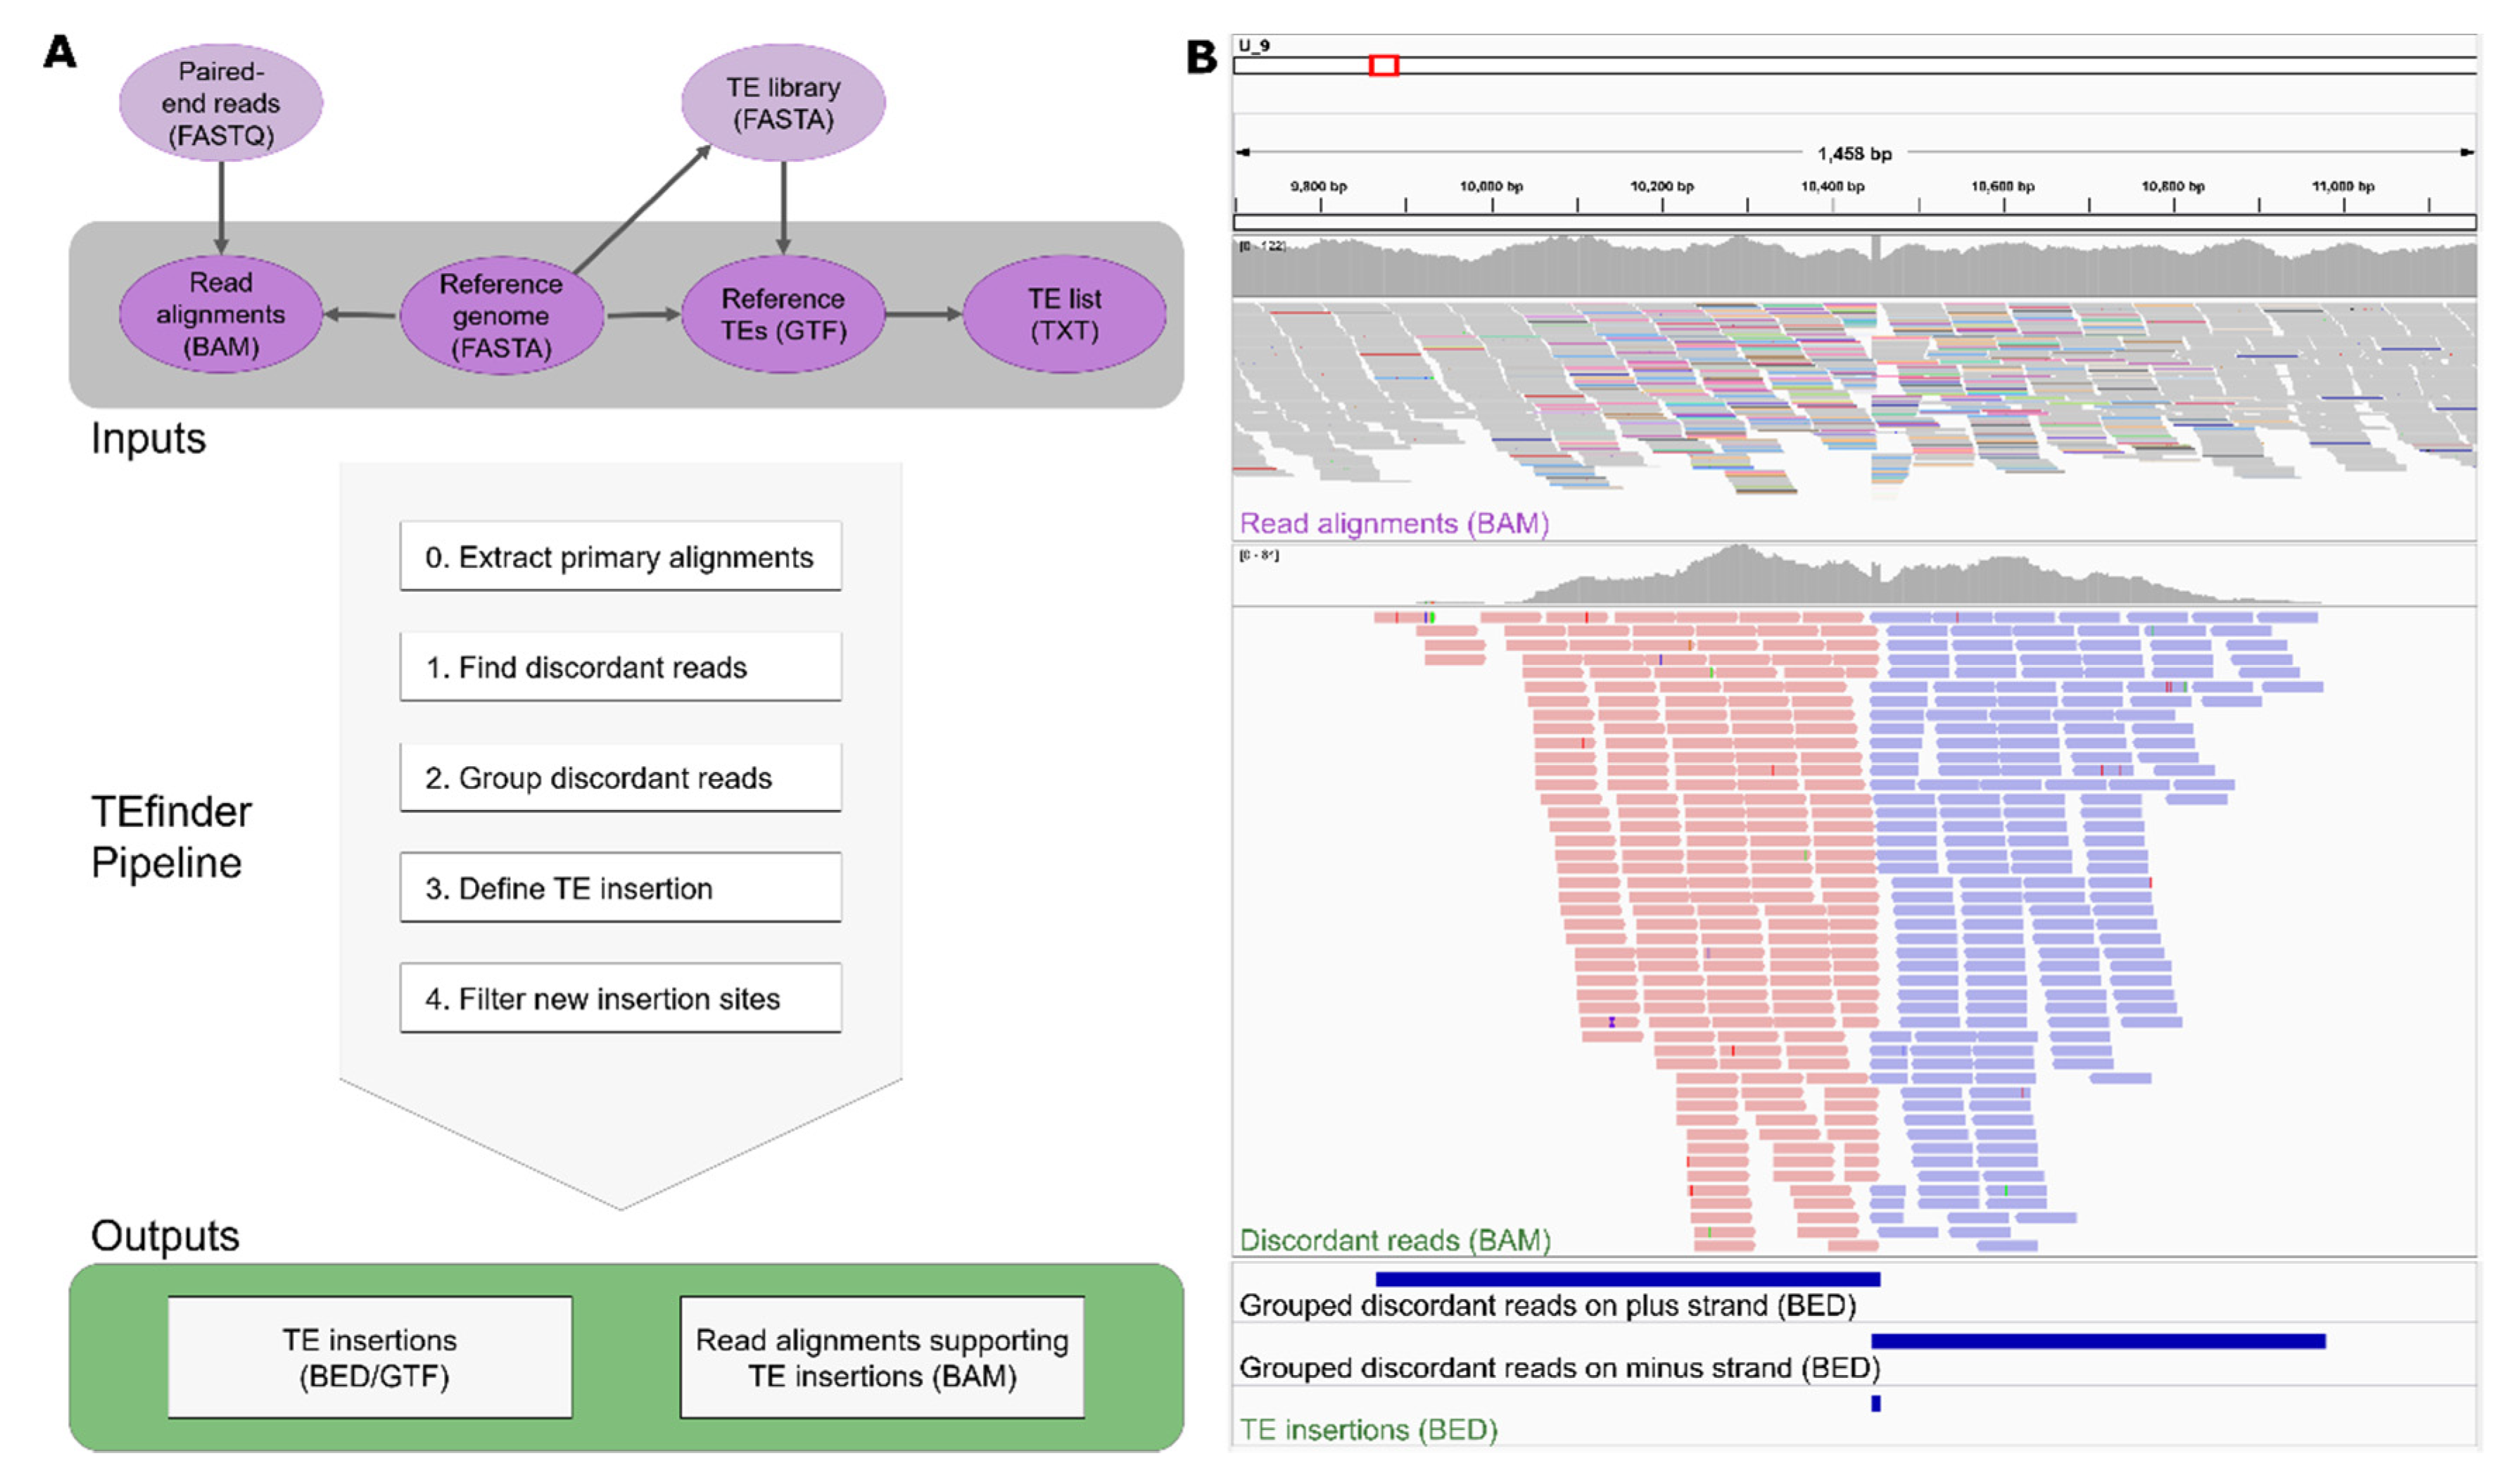
- Identify discordant reads. The program extracted all primary reads mapped to known TEs in the reference using BEDTools intersect. Then, alignments of the selected reads and their pairs were extracted from the input BAM file using the FilterSamReads tool of Picard [15]. Among those, reads were selected as discordant if the corresponding mate mapped to a different sequence or the read pair had an insert size that exceeded a threshold of 10 times the mean insert size (Figure 1B, top panel).
- Group discordant reads. Once the discordant read alignments had been filtered, the regions of clustered reads were identified using the BEDTools merge so that reads aligned to the plus strand and minus strand were grouped separately (Figure 1B, middle and bottom panels). In this step, the reads had to be overlapping or within a given distance to be considered in the same group.
- Define a TE insertion site. Each plus-strand group was coupled with the nearest minus-strand group. The coupled regions went through a filtering step to remove incorrect orientations, considering that TE sequences should be present between forward and reverse groups and not the reverse order. Due to the nature of duplication of the target site upon the transposon insertion, TSD sequences may have been present in both forward and reverse strands, resulting in an overlap between forward and reverse clusters. If an overlapping site was smaller than the maximum TSD length, the location was reported as a possible TE insertion site. If they were not overlapping due to low coverage or other reasons, and the distance between the groups was smaller than the given threshold, the region in between was reported.
- Filter new insertion sites. The identified insertion sites were filtered based upon 3 criteria: Occurrence in repeat regions, supporting read count, and strand bias. If the insertion site coincided with a TE-annotated site in the reference genome sequence, its filter label became “in_repeat”. If the total supporting reads for the insertion event was less than the cutoff 10, then the filtering process labeled this low confidence event as “weak_evidence”. Strand bias was critical for filtering out insertion events. Two threshold values were calculated based on the forward read count (F), and if the reverse read count (R) fell outside those boundaries (R < F0.8 or R > F1.25), then the event likely was not caused by TIP and received a “stand_bias” label. If an insertion site passed all three filtering criteria, then it was labeled “PASS”, representing high confidence insertion events (Figure 1).
2.3. Testing Dataset and Processing
2.4. Experimental Validation
3. Results
3.1. Data Preparation
3.2. Total TE Insertion Events Detected
3.3. Sensitivity and Applicability of TEfinder
4. Discussion
5. Conclusions
Supplementary Materials
Author Contributions
Funding
Acknowledgments
Conflicts of Interest
References
- Chénais, B.; Caruso, A.; Hiard, S.; Casse, N. The impact of transposable elements on eukaryotic genomes: From genome size increase to genetic adaptation to stressful environments. Gene 2012, 509, 7–15. [Google Scholar] [CrossRef]
- Bourque, G.; Burns, K.H.; Gehring, M.; Gorbunova, V.; Seluanov, A.; Hammell, M.; Imbeault, M.; Izsvák, Z.; Levin, H.L.; Macfarlan, T.S.; et al. Ten things you should know about transposable elements. Genome Biol. 2018, 19, 1–12. [Google Scholar] [CrossRef] [PubMed]
- Huang, C.R.L.; Burns, K.H.; Boeke, J.D. Active transposition in genomes. Annu. Rev. Genet. 2012, 46, 651–675. [Google Scholar] [CrossRef] [Green Version]
- Munoz-Lopez, M.; Garcia-Perez, J. DNA Transposons: Nature and Applications in Genomics. Curr. Genom. 2010, 11, 115–128. [Google Scholar] [CrossRef] [Green Version]
- Burns, K.H. Transposable elements in cancer. Nat. Rev. Cancer 2017, 17, 415–424. [Google Scholar] [CrossRef]
- Jönsson, M.E.; Garza, R.; Johansson, P.A.; Jakobsson, J. Transposable Elements: A Common Feature of Neurodevelopmental and Neurodegenerative Disorders. Trends Genet. 2020, 36, 610–623. [Google Scholar] [CrossRef]
- Seidl, M.F.; Thomma, B.P.H.J. Transposable Elements Direct The Coevolution between Plants and Microbes. Trends Genet. 2017, 33, 842–851. [Google Scholar] [CrossRef]
- Wicker, T.; Sabot, F.; Hua-Van, A.; Bennetzen, J.L.; Capy, P.; Chalhoub, B.; Flavell, A.; Leroy, P.; Morgante, M.; Panaud, O.; et al. A unified classification system for eukaryotic transposable elements. Nat. Rev. Genet. 2007, 8, 973–982. [Google Scholar] [CrossRef]
- Hawkey, J.; Hamidian, M.; Wick, R.R.; Edwards, D.J.; Billman-Jacobe, H.; Hall, R.M.; Holt, K.E. ISMapper: Identifying transposase insertion sites in bacterial genomes from short read sequence data. BMC Genom. 2015, 16, 667. [Google Scholar] [CrossRef] [Green Version]
- Gardner, E.J.; Lam, V.K.; Harris, D.N.; Chuang, N.T.; Scott, E.C.; Pittard, W.S.; Mills, R.E.; Devine, S.E. The Mobile Element Locator Tool (MELT): Population-scale mobile element discovery and biology. Genome Res. 2017, 27, 1916–1929. [Google Scholar] [CrossRef] [Green Version]
- 1000 Genomes Project Consortium. A global reference for human genetic variation. Nature 2015, 526, 68–74. [Google Scholar] [CrossRef] [Green Version]
- Langmead, B.; Salzberg, S.L. Fast gapped-read alignment with Bowtie 2. Nat. Methods 2012, 9, 357–359. [Google Scholar] [CrossRef] [Green Version]
- Quinlan, A.R.; Hall, I.M. BEDTools: A flexible suite of utilities for comparing genomic features. Bioinformatics 2010, 26, 841–842. [Google Scholar] [CrossRef] [PubMed] [Green Version]
- Li, H.; Handsaker, B.; Wysoker, A.; Fennell, T.; Ruan, J.; Homer, N.; Marth, G.; Abecasis, G.; Durbin, R. The Sequence Alignment/Map format and SAMtools. Bioinformatics 2009, 25, 2078–2079. [Google Scholar] [CrossRef] [PubMed] [Green Version]
- Picard Toolkit. Available online: http://broadinstitute.github.io/picard (accessed on 28 January 2021).
- Zhuang, J.; Wang, J.; Theurkauf, W.; Weng, Z. TEMP: A computational method for analyzing transposable element polymorphism in populations. Nucleic Acids Res. 2014, 42, 6826–6838. [Google Scholar] [CrossRef]
- Schmitz, R.J.; Schultz, M.D.; Urich, M.A.; Nery, J.R.; Pelizzola, M.; Libiger, O.; Alix, A.; McCosh, R.B.; Chen, H.; Schork, N.J.; et al. Patterns of population epigenomic diversity. Nature 2013, 495, 193–198. [Google Scholar] [CrossRef] [Green Version]
- Quadrana, L.; Bortolini Silveira, A.; Mayhew, G.F.; LeBlanc, C.; Martienssen, R.A.; Jeddeloh, J.A.; Colot, V. The Arabidopsis thaliana mobilome and its impact at the species level. Elife 2016, 5. [Google Scholar] [CrossRef]
- Li, H.; Durbin, R. Fast and accurate short read alignment with Burrows-Wheeler transform. Bioinformatics 2009, 25, 1754–1760. [Google Scholar] [CrossRef] [Green Version]
- Marco-Sola, S.; Sammeth, M.; Guigó, R.; Ribeca, P. The GEM mapper: Fast, accurate and versatile alignment by filtration. Nat. Methods 2012, 9, 1185–1188. [Google Scholar] [CrossRef]
- Bao, W.; Kojima, K.K.; Kohany, O. Repbase Update, a database of repetitive elements in eukaryotic genomes. Mob. DNA 2015, 6, 11. [Google Scholar] [CrossRef] [Green Version]
- Smit, A.F.A.; Hubley, R. RepeatModeler Open-1.0. 2015. Available online: http://www.repeatmasker.org (accessed on 28 January 2021).
- Price, A.L.; Jones, N.C.; Pevzner, P.A. De novo identification of repeat families in large genomes. Bioinformatics 2005, 21, i351–i358. [Google Scholar] [CrossRef] [Green Version]
- Smit, A.F.A.; Hubley, R.; Green, P. RepeatMasker Open-4.0. 2015. Available online: http://www.repeatmasker.org (accessed on 28 January 2021).
- Afgan, E.; Baker, D.; Batut, B.; van den Beek, M.; Bouvier, D.; Čech, M.; Chilton, J.; Clements, D.; Coraor, N.; Grüning, B.A.; et al. The Galaxy platform for accessible, reproducible and collaborative biomedical analyses: 2018 update. Nucleic Acids Res. 2018, 46, W537–W544. [Google Scholar] [CrossRef] [Green Version]
- Thorvaldsdottir, H.; Robinson, J.T.; Mesirov, J.P. Integrative Genomics Viewer (IGV): High-performance genomics data visualization and exploration. Brief. Bioinform. 2013, 14, 178–192. [Google Scholar] [CrossRef] [Green Version]
- Ma, L.J.; Van Der Does, H.C.; Borkovich, K.A.; Coleman, J.J.; Daboussi, M.J.; Di Pietro, A.; Dufresne, M.; Freitag, M.; Grabherr, M.; Henrissat, B.; et al. Comparative genomics reveals mobile pathogenicity chromosomes in Fusarium. Nature 2010, 464, 367–373. [Google Scholar] [CrossRef]
- Zhang, Y.; Yang, H.; Turra, D.; Zhou, S.; Ayhan, D.H.; DeIulio, G.A.; Guo, L.; Broz, K.; Wiederhold, N.; Coleman, J.J.; et al. The genome of opportunistic fungal pathogen Fusarium oxysporum carries a unique set of lineage-specific chromosomes. Commun. Biol. 2020, 3, 50. [Google Scholar] [CrossRef] [Green Version]
- Kistler, H.C.; Rep, M.; Ma, L.-J. Structural dynamics of Fusarium genomes. In Fusarium, Genomics, Molecular and Cellular Biology; Caister Academic Press: Norfolk, UK, 2013; pp. 31–42. [Google Scholar]
- Ayhan, D.H.; López-Díaz, C.; Di Pietro, A.; Ma, L.-J. Improved Assembly of Reference Genome Fusarium oxysporum f. sp. lycopersici Strain Fol4287. Microbiol. Resour. Announc. 2018, 7. [Google Scholar] [CrossRef] [Green Version]
- Raeder, U.; Broda, P. Rapid preparation of DNA from filamentous fungi. Lett. Appl. Microbiol. 1985, 1, 17–20. [Google Scholar] [CrossRef]


| Sample | Total Reads | Discordant Mate Mapping Quality ≥ 5 | Percent Reads Mapping to Reference | Median Coverage |
|---|---|---|---|---|
| Y1 | 62,015,365 | 475,966 | 99.41 | 67 |
| Y2 | 85,688,005 | 600,267 | 99.38 | 94 |
| Y3 | 83,109,424 | 578,959 | 99.44 | 92 |
| Y4 | 70,322,907 | 475,591 | 99.42 | 78 |
| Y5 | 76,034,020 | 567,823 | 99.37 | 83 |
| Sample | All Events | In Repeat | Weak Evidence | Strand Bias | PASS | PCR-Verified |
|---|---|---|---|---|---|---|
| Y1 | 502 | 397 | 11 | 256 | 55 | 1/1 |
| Y2 | 566 | 449 | 9 | 281 | 63 | 1/1 |
| Y3 | 570 | 455 | 8 | 264 | 60 | 1/1 |
| Y4 | 565 | 446 | 10 | 278 | 60 | 3/3 |
| Y5 | 544 | 423 | 10 | 272 | 64 | 6/7 |
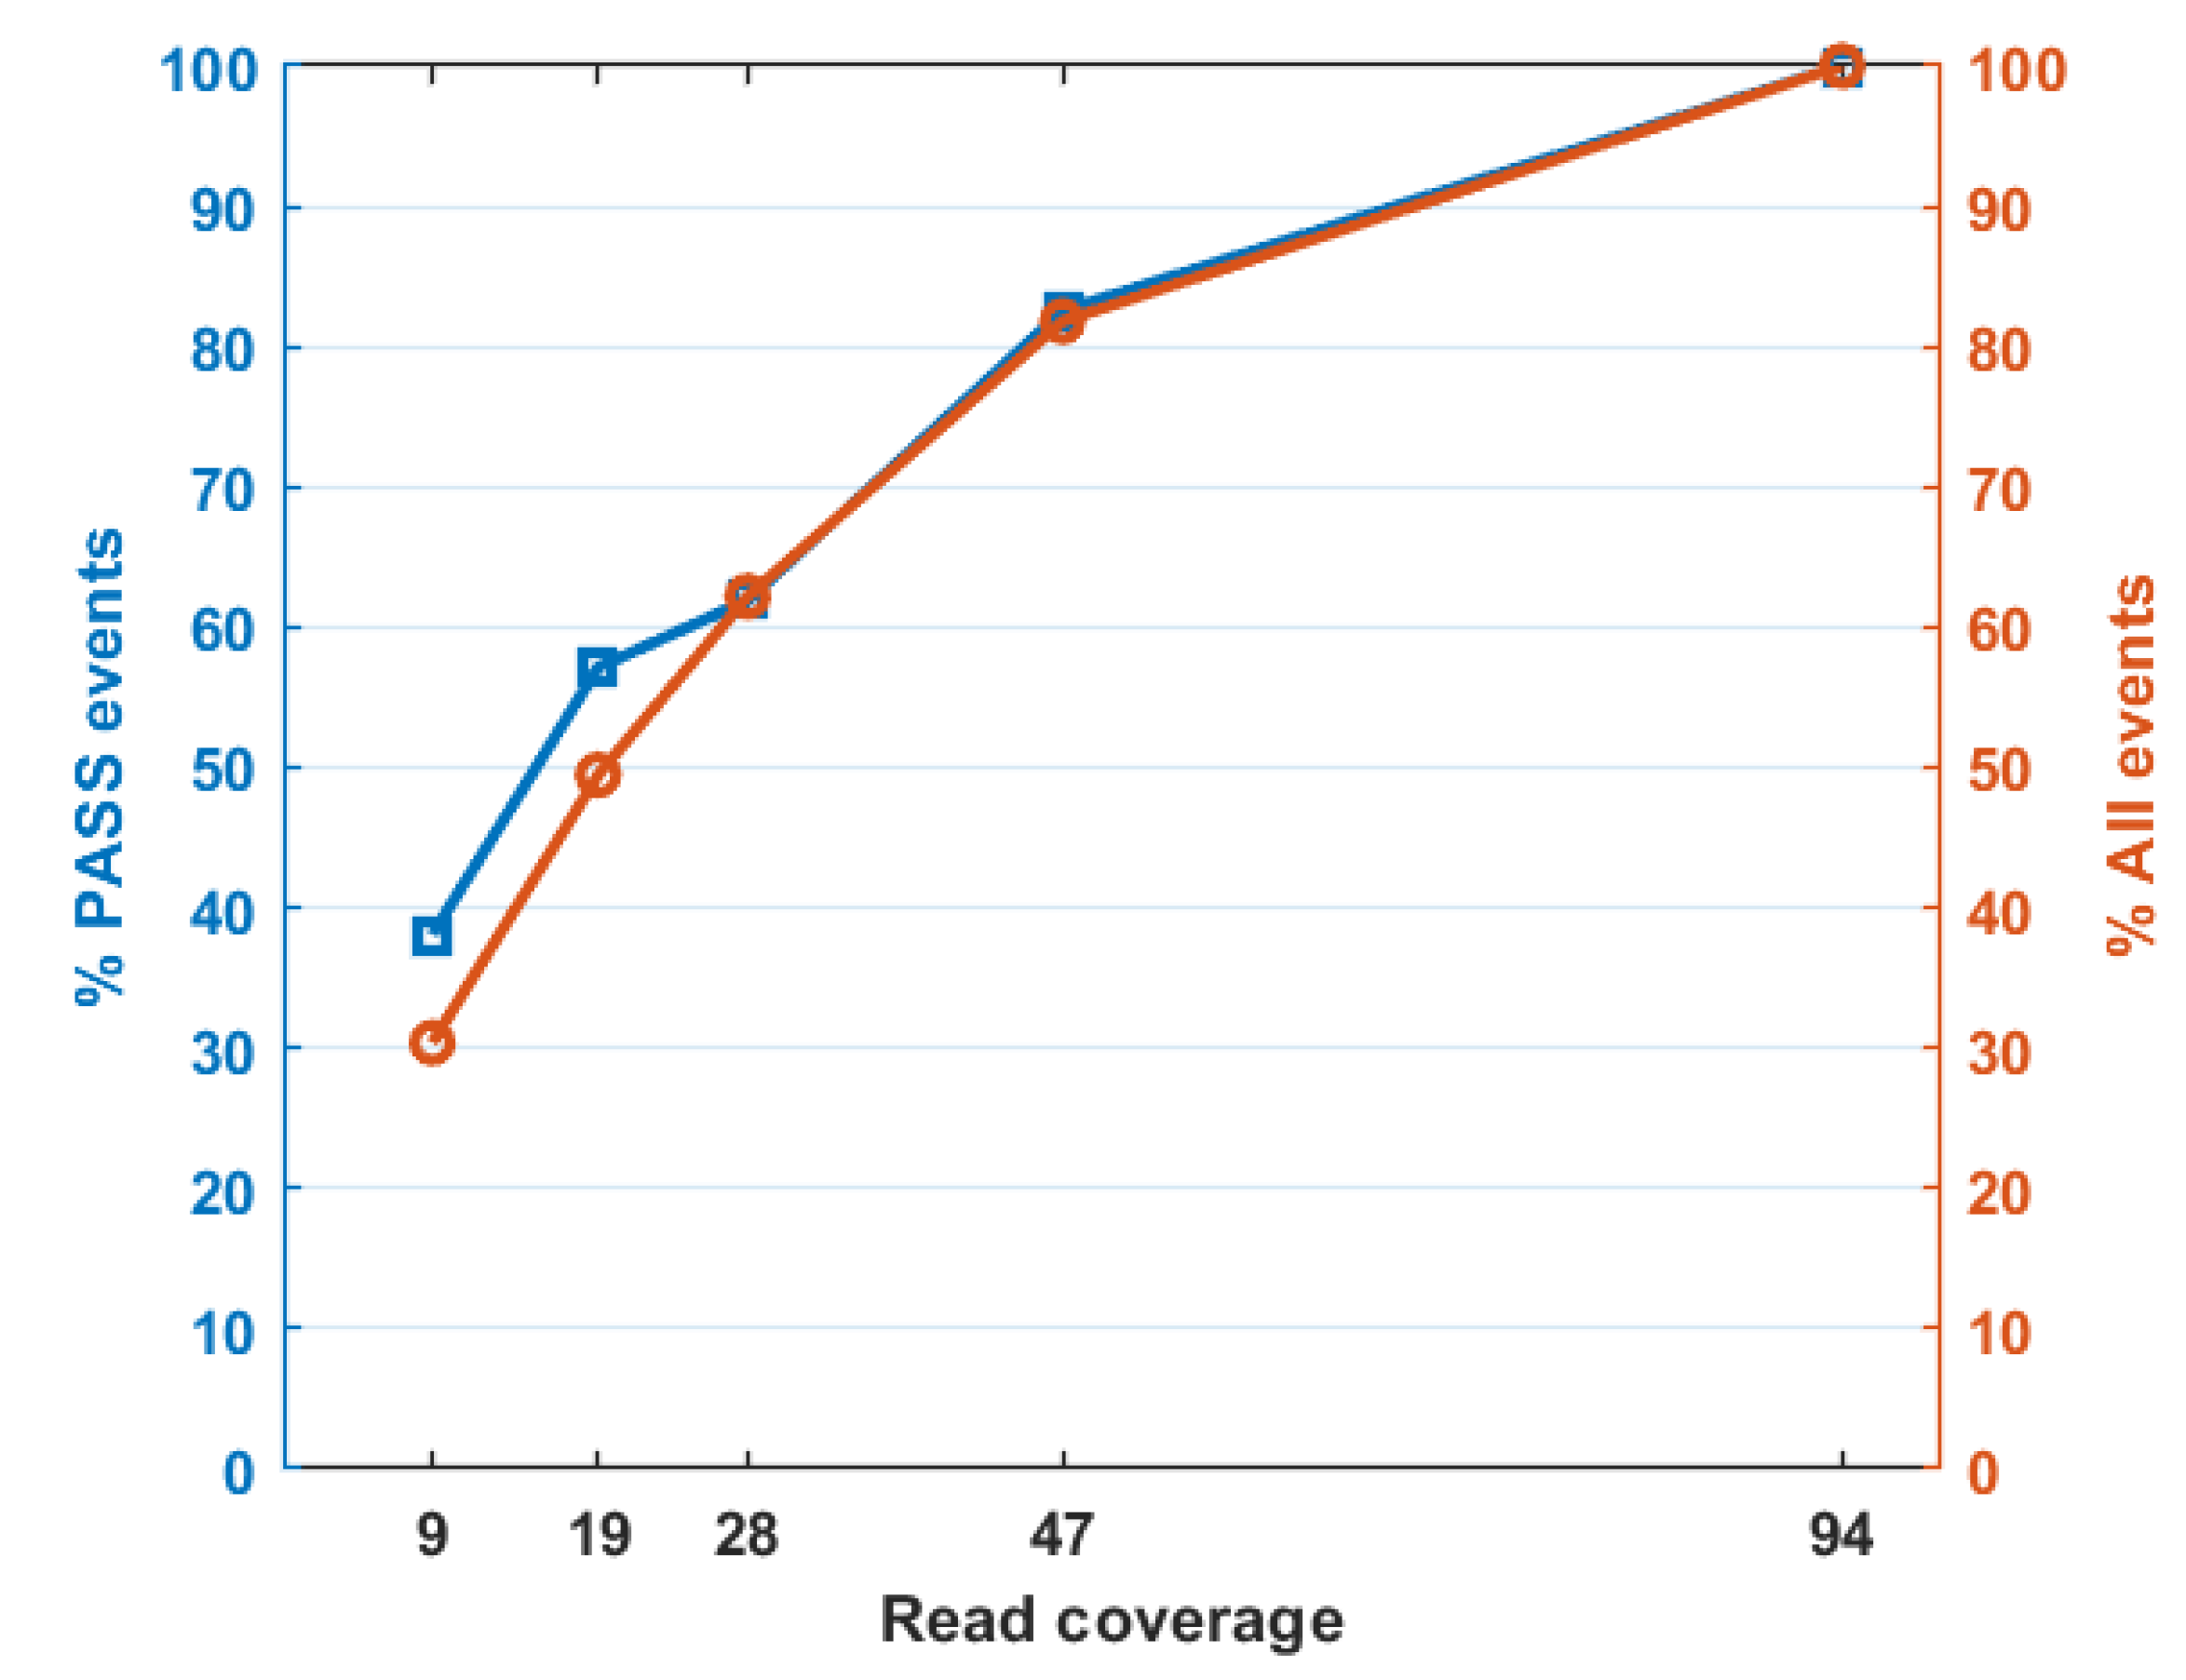
| Median Read Coverage | Reported | PASS |
|---|---|---|
| 94 | 566 | 63 |
| 47 | 463 | 52 |
| 28 | 352 | 39 |
| 19 | 280 | 36 |
| 9 | 172 | 24 |
Publisher’s Note: MDPI stays neutral with regard to jurisdictional claims in published maps and institutional affiliations. |
© 2021 by the authors. Licensee MDPI, Basel, Switzerland. This article is an open access article distributed under the terms and conditions of the Creative Commons Attribution (CC BY) license (http://creativecommons.org/licenses/by/4.0/).
Share and Cite
Sohrab, V.; López-Díaz, C.; Di Pietro, A.; Ma, L.-J.; Ayhan, D.H. TEfinder: A Bioinformatics Pipeline for Detecting New Transposable Element Insertion Events in Next-Generation Sequencing Data. Genes 2021, 12, 224. https://0-doi-org.brum.beds.ac.uk/10.3390/genes12020224
Sohrab V, López-Díaz C, Di Pietro A, Ma L-J, Ayhan DH. TEfinder: A Bioinformatics Pipeline for Detecting New Transposable Element Insertion Events in Next-Generation Sequencing Data. Genes. 2021; 12(2):224. https://0-doi-org.brum.beds.ac.uk/10.3390/genes12020224
Chicago/Turabian StyleSohrab, Vista, Cristina López-Díaz, Antonio Di Pietro, Li-Jun Ma, and Dilay Hazal Ayhan. 2021. "TEfinder: A Bioinformatics Pipeline for Detecting New Transposable Element Insertion Events in Next-Generation Sequencing Data" Genes 12, no. 2: 224. https://0-doi-org.brum.beds.ac.uk/10.3390/genes12020224