
Unravelling the Distinct Effects of Systolic and Diastolic Blood Pressure Using Mendelian Randomisation

 and
and
Abstract
:1. Introduction
2. Methods
2.1. Two-Sample MR Analysis
2.2. Genetic Instruments for Blood Pressure
2.3. Outcomes
2.4. Ethical Approval
2.5. Statistical Analysis
3. Results
4. Discussion
5. Conclusions
Supplementary Materials
Author Contributions
Funding
Institutional Review Board Statement
Informed Consent Statement
Data Availability Statement
Acknowledgments
Conflicts of Interest
References
- Forouzanfar, M.H.; Liu, P.; Roth, G.A.; Ng, M.; Biryukov, S.; Marczak, L.; Alexander, L.; Estep, K.; Abate, K.H.; Akinyemiju, T.F.; et al. Global Burden of Hypertension and Systolic Blood Pressure of at Least 110 to 115 mm Hg, 1990–2015. JAMA 2017, 317, 165–182. [Google Scholar] [CrossRef] [PubMed] [Green Version]
- Yusuf, S.; Joseph, P.; Rangarajan, S.; Islam, S.; Mente, A.; Hystad, P.; Brauer, M.; Kutty, V.R.; Gupta, R.; Wielgosz, A.; et al. Modifiable risk factors, cardiovascular disease, and mortality in 155 722 individuals from 21 high-income, middle-income, and low-income countries (PURE): A prospective cohort study. Lancet 2020, 395, 795–808. [Google Scholar] [CrossRef] [Green Version]
- Ettehad, D.; Emdin, C.A.; Kiran, A.; Anderson, S.G.; Callender, T.; Emberson, J.; Chalmers, J.; Rodgers, A.; Rahimi, K. Blood pressure lowering for prevention of cardiovascular disease and death: A systematic review and meta-analysis. Lancet 2016, 387, 957–967. [Google Scholar] [CrossRef] [Green Version]
- Rapsomaniki, E.; Timmis, A.; George, J.; Pujades-Rodriguez, M.; Shah, A.D.; Denaxas, S.; White, I.R.; Caulfield, M.J.; Deanfield, J.E.; Smeeth, L.; et al. Blood pressure and incidence of twelve cardiovascular diseases: Lifetime risks, healthy life-years lost, and age-specific associations in 1·25 million people. Lancet 2014, 383, 1899–1911. [Google Scholar] [CrossRef] [Green Version]
- Flint, A.C.; Conell, C.; Ren, X.; Banki, N.M.; Chan, S.L.; Rao, V.A.; Melles, R.B.; Bhatt, D.L. Effect of Systolic and Diastolic Blood Pressure on Cardiovascular Outcomes. N. Engl. J. Med. 2019, 381, 243–251. [Google Scholar] [CrossRef]
- Williams, B.; Lindholm, L.H.; Sever, P. Systolic pressure is all that matters. Lancet 2008, 371, 2219–2221. [Google Scholar] [CrossRef]
- Franklin, S.S.; Larson, M.G.; Khan, S.A.; Wong, N.D.; Leip, E.P.; Kannel, W.B.; Levy, D. Does the relation of blood pressure to coronary heart disease risk change with aging? The Framingham Heart Study. Circulation 2001, 103, 1245–1249. [Google Scholar] [CrossRef] [Green Version]
- Cruickshank, J.M. Coronary flow reserve and the J curve relation between diastolic blood pressure and myocardial infarction. BMJ 1988, 297, 1227–1230. [Google Scholar] [CrossRef] [Green Version]
- Lip, S.; Tan, L.E.; Jeemon, P.; McCallum, L.; Dominiczak, A.F.; Padmanabhan, S. Diastolic Blood Pressure J-Curve Phenomenon in a Tertiary-Care Hypertension Clinic. Hypertension 2019, 74, 767–775. [Google Scholar] [CrossRef]
- Arvanitis, M.; Qi, G.; Bhatt, D.L.; Post, W.S.; Chatterjee, N.; Battle, A.; McEvoy, J.W. Linear and Nonlinear Mendelian Randomization Analyses of the Association Between Diastolic Blood Pressure and Cardiovascular Events: The J-Curve Revisited. Circulation 2021, 143, 895–906. [Google Scholar] [CrossRef]
- Malik, R.; Georgakis, M.K.; Vujkovic, M.; Damrauer, S.M.; Elliott, P.; Karhunen, V.; Giontella, A.; Fava, C.; Hellwege, J.N.; Shuey, M.M.; et al. Relationship Between Blood Pressure and Incident Cardiovascular Disease: Linear and Nonlinear Mendelian Randomization Analyses. Hypertension 2021, 77, 2004–2013. [Google Scholar] [CrossRef] [PubMed]
- Holmes, M.V.; Ala-Korpela, M.; Smith, G.D. Mendelian randomization in cardiometabolic disease: Challenges in evaluating causality. Nat. Rev. Cardiol. 2017, 14, 577–590. [Google Scholar] [CrossRef] [PubMed] [Green Version]
- Ference, B.A.; Julius, S.; Mahajan, N.; Levy, P.D.; Williams, K.A.; Flack, J.M. Clinical Effect of Naturally Random Allocation to Lower Systolic Blood Pressure Beginning Before the Development of Hypertension. Hypertension 2014, 63, 1182–1188. [Google Scholar] [CrossRef] [Green Version]
- Wan, E.Y.F.; Fung, W.T.; Schooling, C.M.; Au Yeung, S.L.; Kwok, M.K.; Yu, E.Y.T.; Wang, Y.; Chan, E.W.Y.; Wong, I.C.K.; Lam, C.L.K. Blood Pressure and Risk of Cardiovascular Disease in UK Biobank. Hypertension 2021, 77, 367–375. [Google Scholar] [CrossRef] [PubMed]
- Georgakis, M.K.; Gill, D.; Webb, A.J.S.; Evangelou, E.; Elliott, P.; Sudlow, C.L.M.; Dehghan, A.; Malik, R.; Tzoulaki, I.; Dichgans, M. Genetically determined blood pressure, antihypertensive drug classes, and risk of stroke subtypes. Neurology 2020, 95, e353–e361. [Google Scholar] [CrossRef] [PubMed]
- Nazarzadeh, M.; Pinho-Gomes, A.C.; Byrne, K.S.; Canoy, D.; Raimondi, F.; Solares, J.R.A.; Otto, C.M.; Rahimi, K. Systolic Blood Pressure and Risk of Valvular Heart Disease: A Mendelian Randomization Study. JAMA Cardiol. 2019, 4, 788–795. [Google Scholar] [CrossRef]
- Evangelou, E.; Warren, H.R.; Mosen-Ansorena, D.; Mifsud, B.; Pazoki, R.; Gao, H.; Ntritsos, G.; Dimou, N.; Cabrera, C.P.; Karaman, I.; et al. Genetic analysis of over 1 million people identifies 535 new loci associated with blood pressure traits. Nat. Genet. 2018, 50, 1412–1425. [Google Scholar] [CrossRef] [Green Version]
- Neale, B. Rapid GWAS of Thousands of Phenotypes in the UK Biobank 2020. Available online: http://www.nealelab.is/uk-biobank/ukbround2announcement (accessed on 15 March 2022).
- Nikpay, M.; Goel, A.; Won, H.H.; Hall, L.M.; Willenborg, C.; Kanoni, S.; Saleheen, D.; Kyriakou, T.; Nelson, C.P.; Hopewell, J.C.; et al. A comprehensive 1,000 Genomes-based genome-wide association meta-analysis of coronary artery disease. Nat. Genet. 2015, 47, 1121–1130. [Google Scholar]
- Malik, R.; Chauhan, G.; Traylor, M.; Sargurupremraj, M.; Okada, Y.; Mishra, A.; Rutten-Jacobs, L.; Giese, A.-K.; van der Laan, S.W.; Gretarsdottir, S.; et al. Multiancestry genome-wide association study of 520,000 subjects identifies 32 loci associated with stroke and stroke subtypes. Nat. Genet. 2018, 50, 524–537. [Google Scholar] [CrossRef] [Green Version]
- Kurki, M.I.; Karjalainen, J.; Palta, P.; Sipilä, T.P.; Kristiansson, K.; Donner, K.; Reeve, M.P.; Laivuori, H.; Aavikko, M.; Kaunisto, M.A.; et al. FinnGen: Unique genetic insights from combining isolated population and national health register data. medRxiv 2022. [Google Scholar] [CrossRef]
- Nielsen, J.B.; Thorolfsdottir, R.B.; Fritsche, L.G.; Zhou, W.; Skov, M.W.; Graham, S.E.; Herron, T.J.; McCarthy, S.; Schmidt, E.M.; Sveinbjornsson, G.; et al. Biobank-driven genomic discovery yields new insight into atrial fibrillation biology. Nat. Genet. 2018, 50, 1234–1239. [Google Scholar] [CrossRef] [PubMed]
- Pattaro, C.; Teumer, A.; Gorski, M.; Chu, A.Y.; Li, M.; Mijatovic, V.; Garnaas, M.; Tin, A.; Sorice, R.; Li, Y.; et al. Genetic associations at 53 loci highlight cell types and biological pathways relevant for kidney function. Nat. Commun. 2016, 7, 10023. [Google Scholar] [CrossRef] [PubMed]
- Xue, A.; Wu, Y.; Zhu, Z.; Zhang, F.; Kemper, K.E.; Zheng, Z.; Yengo, L.; Lloyd-Jones, L.R.; Sidorenko, J.; Wu, Y.; et al. Genome-wide association analyses identify 143 risk variants and putative regulatory mechanisms for type 2 diabetes. Nat. Commun. 2018, 9, 2941. [Google Scholar] [CrossRef] [PubMed] [Green Version]
- Skrivankova, V.W.; Richmond, R.C.; Woolf, B.A.R.; Davies, N.M.; Swanson, S.A.; VanderWeele, T.J.; Timpson, N.J.; Higgins, J.P.T.; Dimou, N.; Langenberg, C.; et al. Strengthening the reporting of observational studies in epidemiology using mendelian randomisation (STROBE-MR): Explanation and elaboration. BMJ 2021, 375, n2233. [Google Scholar] [CrossRef] [PubMed]
- Buniello, A.; MacArthur, J.A.L.; Cerezo, M.; Harris, L.W.; Hayhurst, J.; Malangone, C.; McMahon, A.; Morales, J.; Mountjoy, E.; Sollis, E.; et al. The NHGRI-EBI GWAS Catalog of published genome-wide association studies, targeted arrays and summary statistics 2019. Nucleic Acids Res. 2019, 47, D1005–D1012. [Google Scholar] [CrossRef] [Green Version]
- Staley, J.R.; Blackshaw, J.; Kamat, M.A.; Ellis, S.; Surendran, P.; Sun, B.B.; Paul, D.S.; Freitag, D.; Burgess, S.; Danesh, J.; et al. PhenoScanner: A database of human genotype–phenotype associations. Bioinformatics 2016, 32, 3207–3209. [Google Scholar] [CrossRef] [Green Version]
- The SPRINT Research Group. A Randomized Trial of Intensive versus Standard Blood-Pressure Control. N. Engl. J. Med. 2015, 373, 2103–2116. [Google Scholar] [CrossRef]
- Cushman, W.C.; Evans, G.W.; Cutler, J.A. Long-Term Cardiovascular Effects of 4.9 Years of Intensive Blood Pressure Control in Type 2 Diabetes Mellitus: The Action to Control Cardiovascular Risk in Diabetes Follow-On Blood-Pressure Study; American Heart Association: Dallas, TX, USA, 2015. [Google Scholar]
- Lacey, B.; Lewington, S.; Clarke, R.; Kong, X.L.; Chen, Y.; Guo, Y.; Yang, L.; Bennett, D.; Bragg, F.; Bian, Z.; et al. Age-specific association between blood pressure and vascular and non-vascular chronic diseases in 0·5 million adults in China: A prospective cohort study. Lancet Glob. Health 2018, 6, e641–e649. [Google Scholar] [CrossRef]
- SPS3 Study Group. Blood-pressure targets in patients with recent lacunar stroke: The SPS3 randomised trial. Lancet 2013, 382, 507–515. [Google Scholar] [CrossRef] [Green Version]
- Anderson, A.H.; Yang, W.; Townsend, R.R.; Pan, Q.; Chertow, G.M.; Kusek, J.W.; Charleston, J.; He, J.; Kallem, R.; Lash, J.P.; et al. Time-Updated Systolic Blood Pressure and the Progression of Chronic Kidney Disease. J. Am. Coll. Cardiol. 2015, 162, 258–265. [Google Scholar] [CrossRef] [Green Version]
- Emdin, C.A.; Anderson, S.G.; Woodward, M.; Rahimi, K. Usual Blood Pressure and Risk of New-Onset Diabetes. J. Am. Coll. Cardiol. 2015, 66, 1552–1562. [Google Scholar] [CrossRef] [PubMed]
- Emdin, C.A.; Anderson, S.G.; Salimi-Khorshidi, G.; Woodward, M.; MacMahon, S.; Dwyer, T.; Rahimi, K. Usual blood pressure, atrial fibrillation and vascular risk: Evidence from 4.3 million adults. Int. J. Epidemiol. 2016, 46, 162–172. [Google Scholar] [CrossRef] [PubMed]
- Burgess, S.; Thompson, S.G. Avoiding bias from weak instruments in Mendelian randomization studies. Int. J. Epidemiol. 2011, 40, 755–764. [Google Scholar] [CrossRef] [PubMed] [Green Version]
- Shim, H.; Chasman, D.I.; Smith, J.D.; Mora, S.; Ridker, P.M.; Nickerson, D.A.; Krauss, R.M.; Stephens, M. A multivariate genome-wide association analysis of 10 LDL subfractions, and their response to statin treatment, in 1868 Caucasians. PLoS ONE 2015, 10, e0120758. [Google Scholar] [CrossRef] [PubMed] [Green Version]
- Haycock, P.C.; Burgess, S.; Wade, K.H.; Bowden, J.; Relton, C.; Davey Smith, G. Best (but oft-forgotten) practices: The design, analysis, and interpretation of Mendelian randomization studies. Am. J. Clin. Nutr. 2016, 103, 965–978. [Google Scholar] [CrossRef] [Green Version]
- Bowden, J.; Davey Smith, G.; Burgess, S. Mendelian randomization with invalid instruments: Effect estimation and bias detection through Egger regression. Int. J. Epidemiol. 2015, 44, 512–525. [Google Scholar] [CrossRef] [Green Version]
- Burgess, S.; Thompson, S.G. Interpreting findings from Mendelian randomization using the MR-Egger method. Eur. J. Epidemiol. 2017, 32, 377–389. [Google Scholar] [CrossRef] [Green Version]
- Sanderson, E.; Davey Smith, G.; Windmeijer, F.; Bowden, J. An examination of multivariable Mendelian randomization in the single-sample and two-sample summary data settings. Int. J. Epidemiol. 2019, 48, 713–727. [Google Scholar] [CrossRef] [Green Version]
- Bowden, J.; Del Greco, M.F.; Minelli, C.; Davey Smith, G.; Sheehan, N.; Thompson, J. A framework for the investigation of pleiotropy in two-sample summary data Mendelian randomization. Stat. Med. 2017, 36, 1783–1802. [Google Scholar] [CrossRef] [Green Version]
- Bowden, J.; Davey Smith, G.; Haycock, P.C.; Burgess, S. Consistent Estimation in Mendelian Randomization with Some Invalid Instruments Using a Weighted Median Estimator. Genet. Epidemiol. 2016, 40, 304–314. [Google Scholar] [CrossRef] [Green Version]
- Verbanck, M.; Chen, C.-Y.; Neale, B.; Do, R. Detection of widespread horizontal pleiotropy in causal relationships inferred from Mendelian randomization between complex traits and diseases. Nat. Genet. 2018, 50, 693–698. [Google Scholar] [CrossRef] [PubMed]
- Hemani, G.; Zheng, J.; Elsworth, B.; Wade, K.H.; Haberland, V.; Baird, D.; Laurin, C.; Burgess, S.; Bowden, J.; Langdon, R.; et al. The MR-Base platform supports systematic causal inference across the human phenome. eLife 2018, 7, e34408. [Google Scholar] [CrossRef] [PubMed]
- Sanderson, E.; Spiller, W.; Bowden, J. Testing and correcting for weak and pleiotropic instruments in two-sample multivariable Mendelian randomization. Stat. Med. 2021, 40, 5434–5452. [Google Scholar] [CrossRef]
- Lieb, W.; Jansen, H.; Loley, C.; Pencina, M.J.; Nelson, C.P.; Newton-Cheh, C.; Kathiresan, S.; Reilly, M.; Assimes, T.L.; Boerwinkle, E.; et al. Genetic Predisposition to Higher Blood Pressure Increases Coronary Artery Disease Risk. Hypertension 2013, 61, 995–1001. [Google Scholar] [CrossRef] [PubMed]
- Yu, Z.; Coresh, J.; Qi, G.; Grams, M.; Boerwinkle, E.; Snieder, H.; Teumer, A.; Pattaro, C.; Köttgen, A.; Chatterjee, N.; et al. A bidirectional Mendelian randomization study supports causal effects of kidney function on blood pressure. Kidney Int. 2020, 98, 708–716. [Google Scholar] [CrossRef]
- Hyman, M.C.; Levin, M.G.; Gill, D.; Walker, V.M.; Georgakis, M.K.; Davies, N.M.; Marchlinski, F.E.; Damrauer, S.M. Genetically Predicted Blood Pressure and Risk of Atrial Fibrillation. Hypertension 2021, 77, 376–382. [Google Scholar] [CrossRef]
- Higgins, H.; Mason, A.M.; Larsson, S.C.; Gill, D.; Langenberg, C.; Burgess, S. Estimating the Population Benefits of Blood Pressure Lowering: A Wide-Angled Mendelian Randomization Study in UK Biobank. J. Am. Heart Assoc. 2021, 10, e021098. [Google Scholar] [CrossRef] [PubMed]
- Aikens, R.C.; Zhao, W.; Saleheen, D.; Reilly, M.P.; Epstein, S.E.; Tikkanen, E.; Salomaa, V.; Voight, B.F. Systolic Blood Pressure and Risk of Type 2 Diabetes: A Mendelian Randomization Study. Diabetes 2017, 66, 543–550. [Google Scholar] [CrossRef] [Green Version]
- Surendran, P.; Feofanova, E.V.; Lahrouchi, N.; Ntalla, I.; Karthikeyan, S.; Cook, J.; Chen, L.; Mifsud, B.; Yao, C.; Kraja, A.T.; et al. Discovery of rare variants associated with blood pressure regulation through meta-analysis of 1.3 million individuals. Nat. Genet. 2020, 52, 1314–1332. [Google Scholar] [CrossRef]
- Li, Y.; Wei, F.-F.; Thijs, L.; Boggia, J.; Asayama, K.; Hansen, T.W.; Kikuya, M.; Björklund-Bodegård, K.; Ohkubo, T.; Jeppesen, J.; et al. Ambulatory hypertension subtypes and 24-hour systolic and diastolic blood pressure as distinct outcome predictors in 8341 untreated people recruited from 12 populations. Circulation 2014, 130, 466–474. [Google Scholar] [CrossRef] [Green Version]
- Franklin, S.S.; Pio, J.R.; Wong, N.D.; Larson, M.G.; Leip, E.P.; Vasan, R.S.; Levy, D. Predictors of new-onset diastolic and systolic hypertension: The Framingham Heart Study. Circulation 2005, 111, 1121–1127. [Google Scholar] [CrossRef] [PubMed] [Green Version]
- McEvoy, J.W.; Daya, N.; Rahman, F.; Hoogeveen, R.C.; Blumenthal, R.S.; Shah, A.M.; Ballantyne, C.M.; Coresh, J.; Selvin, E. Association of Isolated Diastolic Hypertension as Defined by the 2017 ACC/AHA Blood Pressure Guideline with Incident Cardiovascular Outcomes. JAMA 2020, 323, 329–338. [Google Scholar] [CrossRef] [PubMed]
- Nielsen, W.B.; Lindenstrom, E.; Vestbo, J.; Jensen, G.B. Is diastolic hypertension an independent risk factor for stroke in the presence of normal systolic blood pressure in the middle-aged and elderly? Am. J. Hypertens. 1997, 10, 634–639. [Google Scholar] [CrossRef] [Green Version]
- Sun, D.; Zhou, T.; Heianza, Y.; Li, X.; Fan, M.; Fonseca, V.A.; Qi, L. Type 2 Diabetes and Hypertension. Circ. Res. 2019, 124, 930–937. [Google Scholar] [CrossRef]
- Burgess, S.; Davey Smith, G.; Davies, N.M.; Dudbridge, F.; Gill, D.; Glymour, M.M.; Hartwig, F.P.; Holmes, M.V.; Minelli, C.; Relton, C.L.; et al. Guidelines for performing Mendelian randomization investigations. Wellcome Open Res. 2020, 4, 186. [Google Scholar] [CrossRef]


| Traits | Consortium/Cohort | Sample Size (Cases) | Population | Reference |
|---|---|---|---|---|
| Systolic blood pressure | Evangelou E (2018) | 757,601 | European | [17] |
| Systolic blood pressure | Neale Lab (2017) | 317,756 | European | [18] |
| Diastolic blood pressure | Evangelou E (2018) | 757,601 | European | [17] |
| Diastolic blood pressure | Neale Lab (2017) | 317,756 | European | [18] |
| Coronary artery disease | CARDIoGRAMplusC4D | 184,305 (60,801) | 77% European | [19] |
| Myocardial infarction | CARDIoGRAMplusC4D | 171,875 (43,676) | 77% European | [19] |
| Stroke | MEGASTROKE | 446,696 (40,585) | European | [20] |
| Heart failure | FinnGen | 208,178 (13,087) | European | [21] |
| Atrial fibrillation | Nielsen JB (2018) | 1,030,836 (60,620) | European | [22] |
| Chronic kidney disease | CKDGen | 117,165 (12,385) | European | [23] |
| Type 2 diabetes | Xue A (2018) | 655,666 (61,714) | European | [24] |
| Two-Sample MR | Multivariable MR | |||||||
|---|---|---|---|---|---|---|---|---|
| SBP_Excl (SBP) * | DBP_Excl (DBP) ** | SBPexc+DBPexc (SBP) § | SBPexc+DBPexc (DBP) § | |||||
| Estimates | p-Value | Estimates | p-Value | Estimate | p-Value | Estimate | p-Value | |
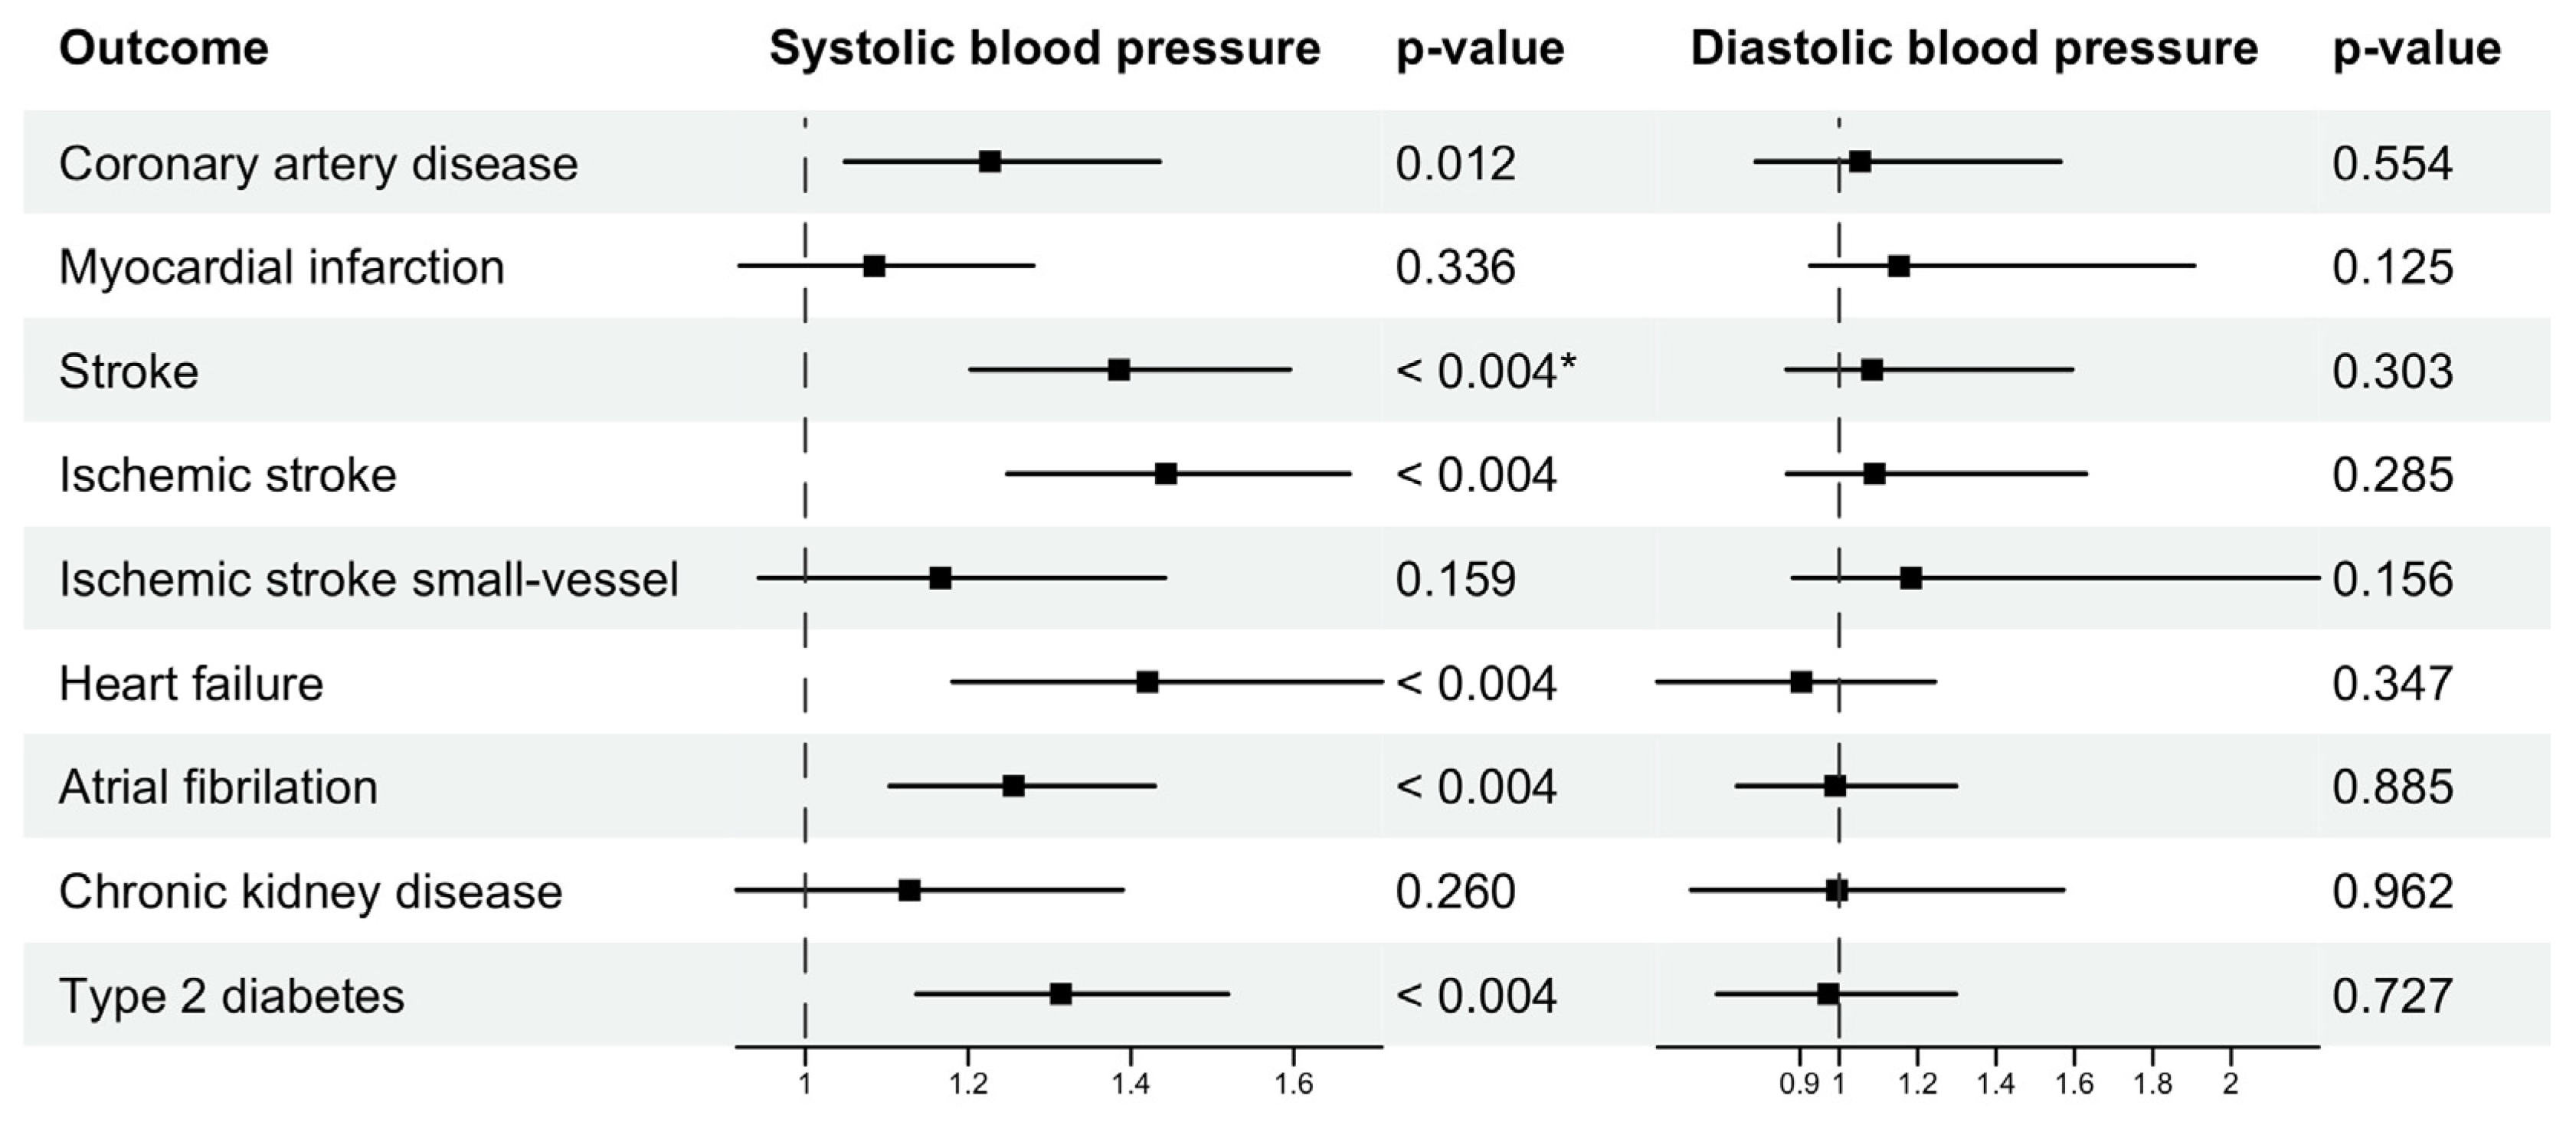
| AF | 0.0247 | 8.11 × 10⁻⁶ | 0.0104 | 0.3872 | 0.0244 | 0.0007 | −0.0347 | 0.8853 |
| HF | 0.0341 | 2.17 × 10⁻⁵ | −0.003 | 0.8529 | 0.0516 | 0.0003 | −0.1297 | 0.3470 |
| T2DM | 0.0252 | 0.0001 | 0.0162 | 0.3297 | 0.0260 | 0.0003 | −0.0151 | 0.7266 |
| CAD | 0.0172 | 0.0148 | 0.0347 | 0.0453 | 0.0238 | 0.0116 | −0.0162 | 0.5542 |
| Stroke | 0.0365 | 3.03 × 10⁻⁹ | 0.0375 | 0.0047 | 0.0398 | 1.17 × 10⁻⁵ | 0.0195 | 0.3034 |
| Ischemic stroke | 0.0396 | 4.07 × 10⁻⁹ | 0.0431 | 0.0009 | 0.0418 | 1.85 × 10⁻⁶ | 0.0250 | 0.2854 |
| Ischemic stroke small-vessel | 0.0181 | 0.0553 | 0.06 | 0.0034 | 0.0108 | 0.1585 | 0.0484 | 0.1559 |
| MI | 0.0079 | 0.2816 | 0.0341 | 0.0520 | 0.0117 | 0.3364 | 0.0096 | 0.1249 |
| CKD | 0.0111 | 0.2045 | 0.0118 | 0.6163 | 0.0219 | 0.2598 | −0.0226 | 0.9621 |
Publisher’s Note: MDPI stays neutral with regard to jurisdictional claims in published maps and institutional affiliations. |
© 2022 by the authors. Licensee MDPI, Basel, Switzerland. This article is an open access article distributed under the terms and conditions of the Creative Commons Attribution (CC BY) license (https://creativecommons.org/licenses/by/4.0/).
Share and Cite
Le, N.N.; Tran, T.Q.B.; Lip, S.; McCallum, L.; McClure, J.; Dominiczak, A.F.; Gill, D.; Padmanabhan, S. Unravelling the Distinct Effects of Systolic and Diastolic Blood Pressure Using Mendelian Randomisation. Genes 2022, 13, 1226. https://0-doi-org.brum.beds.ac.uk/10.3390/genes13071226
Le NN, Tran TQB, Lip S, McCallum L, McClure J, Dominiczak AF, Gill D, Padmanabhan S. Unravelling the Distinct Effects of Systolic and Diastolic Blood Pressure Using Mendelian Randomisation. Genes. 2022; 13(7):1226. https://0-doi-org.brum.beds.ac.uk/10.3390/genes13071226
Chicago/Turabian StyleLe, Nhu Ngoc, Tran Q. B. Tran, Stefanie Lip, Linsay McCallum, John McClure, Anna F. Dominiczak, Dipender Gill, and Sandosh Padmanabhan. 2022. "Unravelling the Distinct Effects of Systolic and Diastolic Blood Pressure Using Mendelian Randomisation" Genes 13, no. 7: 1226. https://0-doi-org.brum.beds.ac.uk/10.3390/genes13071226