Review of PM Oxidative Potential Measured with Acellular Assays in Urban and Rural Sites across Italy


Department of Chemical and Pharmaceutical Sciences, University of Ferrara, 44121 Ferrara, Italy
*
Author to whom correspondence should be addressed.
Atmosphere 2019, 10(10), 626; https://0-doi-org.brum.beds.ac.uk/10.3390/atmos10100626
Submission received: 11 September 2019
/
Revised: 30 September 2019
/
Accepted: 11 October 2019
/
Published: 16 October 2019
(This article belongs to the Special Issue Oxidative Potential of Atmospheric Aerosols)
Abstract
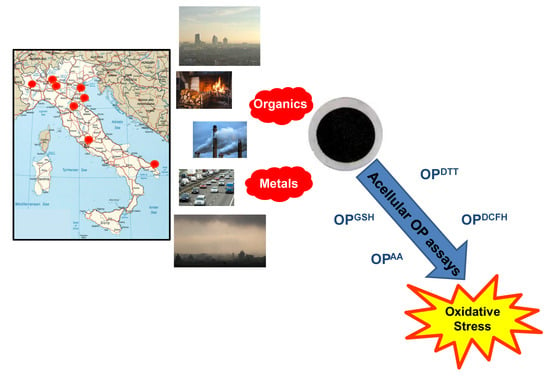
:This work is an overview of the oxidative potential (OP) values up to date measured in Italy, with the aim to provide a picture of the spatial and seasonal variability of OP in the various geographical areas across Italy. The summarized works used the common acellular assays-based dithiothreitol (OPDTT), ascorbic acid (OPAA), glutathione (OPGSH), and 2′,7′-dichlorodfluorescein (OPDCFH) assays. The paper describes the association of OP responses with PM chemical composition, the sensitivity of various acellular OP assays to PM components and emission sources, and PM size distribution of the measured OP values. Our synthesis indicates that crustal and transition metals (e.g., Fe, Ni, Cu, Cr, Mn, Zn, and V), secondary ions and carbonaceous components (elemental carbon, EC, organic carbon, OC and water soluble carbon, WSOC) show significant correlations with OP across different urban and rural areas and size ranges. These chemical species are mainly associated with various PM sources, including residual/fuel oil combustion, traffic emissions, and secondary organic aerosol formation. Although the OP assays are sensitive to the same redox-active species, they differ in the association with PM chemical components. The DDT assay is mainly sensitive to the organic compounds that are mostly accumulated in the fine PM fraction, i.e., tracers of burning sources, and redox active organics associated with other markers of photochemical aging. In contrast, OPAA and OPGSH were mostly responsive to metals, mainly those related to non-exhaust traffic emissions (Cu, Zn, Cr, Fe, Ni, Mn, Sn, Cd, Pb), that are mainly accumulated in the coarse PM. Among the investigated sites, our synthesis shows larger OP values in Trentino region and the Po Valley, that may be explained by the high density of anthropogenic sources, and the orographic and meteorological characteristics, that favor the pollutants accumulation and aerosol photo-oxidative aging.
1. Introduction
In recent years, the oxidative potential (OP) of particulate matter (PM) has been proposed as a biologically relevant metric to be associated with a number of health endpoints and biomarkers of toxic effects in humans [1,2,3,4,5,6,7]. It is based on the increasing consensus that the oxidative stress is an important mechanism of human toxicity related to exposure to atmospheric aerosols. OP measures the capacity of inhaled PM to induce a redox imbalance generated by the interaction of redox-active species present in PM with physiological species undergoing Fenton reactions and redox cycling [6,8,9,10,11]. A range of acellular assays have been developed for measuring OP, having the advantages of low price, speed, practicality, and high data throughput, when compared to cellular assays [12,13,14,15,16,17,18]. Among them, the most commonly used are based on dithiothreitol as a proxy of cellular reductants (DTT assay, OPDTT), or endogen antioxidant species, such as ascorbic acid (AA assay, OPAA) and glutathione (GSH assay, OPGSH). The acellular version of the 2′,7′-dichlorodfluorescein (DCFH) assay uses the enzymatic production of the fluorescent probe largely used for the evaluation of oxidative stress in living cells.
The present work summarizes the PM oxidative properties up to date measured in Italy using OP acellular assays, with the aim of giving a general insight of PM OP across the Italian territory, that has not been reported yet, in spite of the increasing number of OP measurements carried out in Europe [6,19,20,21,22]. In addition, the study reviews the association described in previous studies between OP from different assays with several inorganic ad organic components, that effect PM oxidative properties, i.e., metals, ions, and carbonaceous components. The aim is to give a picture of the spatial and seasonal variability of different contributions to OP in the various geographical areas across Italy. The relevance of such an investigation is based on the large variability in the chemical composition of different PM size fractions in various locations across Italy, as a consequence of the strong differences in the density of anthropogenic sources and the orographic and meteorological characteristics [23,24].
As the reviewed papers use different acellular OP assays, an additional outcome of our synthesis is the comparison among the sensitivities of various acellular OP assays to PM composition, emission sources, and particle size.
2. Methodology
2.1. PM Sampling and Filter Extraction
In general, daily PM10 or PM2.5 samples were collected by using low-volume samplers to sample an air volume of about 55 m3 per day. The particles were collected on Teflon membranes on quartz filters to be submitted to different instrumental analysis for chemical characterization.
In most studies, filter-collected PM samples were extracted with high-purity Milli-Q water using continuous agitation or ultra-sonication at room temperature, followed by filtering through polypropylene syringe filters. Therefore, the water-soluble fraction was investigated, to represent the bioavailable PM component [25,26]. Otherwise, some papers also investigated the PM insoluble fractions by skipping filtration of water suspension [17] or extraction with microwave-assisted acid digestion [27,28].
2.2. Quantification of PM Oxidative Potential Using Acellular Assays
Overall, the reported studies applied 4 of the most common acellular methods typically used in this field: The dithiothreitol (DTT), the ascorbic acid (AA), the glutathione (GSH), and the 2′,7′-dichlorofluorescin (DCFH) assays. Details of the experimental protocols used for OP measurement is reported in each reviewed paper. A summary of the methods is provided below.
2.2.1. DTT Assay
DTT is a surrogate for the cellular oxidant NADPH, which reduces oxygen to the superoxide anion. OP is measured by the rate at which DTT is consumed, which is proportional to the concentration of redox-active species in the PM sample. Specifically, solvent-extracted (e.g., in water or methanol) PM samples are incubated with DTT and a potassium phosphate buffer under controlled conditions (T = 37 °C and pH = 7.4) for times varying from 15–90 min. A small aliquot is removed from the mixture at designated times and mixed with 1% w/v Trichloraoacetic acid (TCA) to quench DTT reactions. The aliquot is mixed with 0.5 mL 5,5′-dithiobis (2-nitrobenzoic acid) (DTNB) to form 2-nitro-5-mercaptobenzoic acid (TNB) by reacting with the residual DTT, which is then measured at the wavelengths of 4 using a UV/Vis spectrometer [8,13,26].
An alternative method has been proposed for measuring the superoxide anion produced by DTT, or by tris (2-carboxyethyl) phosphine (TCEP), based on the determination of the cytochrome c (cyt-c) reduction rate [29]. It uses two alternative analytical methods, i.e., a spectrophotometric measure of cyt-c light absorption at 550 nm, and an amperometric assay, based on self-assembled Cyt-c immobilized monolayers on modified gold electrodes.
2.2.2. AA and GSH Assays
The chemical OPAA protocol is very similar to the OPDTT protocol. After controlled incubation of the antioxidant AA in the aqueous extract, the measurement of AA depletion over time is directly followed by the decrease of UV-Vis absorbance of the ascorbic ion at the wavelengths of 265 nm [23,24].
Modified AA procedures have also been used, performed in a synthetic surrogate respiratory tract lining fluid (RTLF), containing endogenous antioxidants at physiological levels, which is more indicative of realistic lung conditions, i.e., reduced glutathione (GSH), uric acid (UA), and citrate (Cit), in addition to ascorbate (Asc) [30]. In some OP protocols, the remaining concentrations of antioxidants in SLF is quantified at specific time intervals, using reversed-phase HPLC with electrochemical detection and/or enzyme-linked assay for total glutathione and GSH [17,19,31,32].
2.2.3. DCFH Assay
The 2′,7′-dichlorofluorescin (DCFH) assay is a direct detection method performed by a fluorescence technique using a specific florigenic probe, that is widely applied also for the ROS determination in biological assays. The nonfluorescent DCFH is oxidized to the fluorescent dichlorofluorescein (DCF) by ROS in the presence of horseradish peroxidase (HRP). The formed DCF can be easily measured by fluorescence at the excitation and emission wavelengths of 485 and 530 nm, respectively. The ROS concentration may be then calculated in terms of H2O2 equivalent [21,25,26,33].
2.3. Analytical Methodologies for Chemical Characterization
Macro-elements, soluble and insoluble fractions of micro-elements, inorganic ions and organic components—elemental carbon (EC), organic carbon (OC), water soluble carbon (WSOC)—were determined in most of the investigated PM samples (Table 1). Details of the experimental procedures are reported in each reviewed paper. A summary of the methods is provided below.
Major elements (Al, Si, Fe, Ca, Cr, and Ti) were determined using X-ray fluorescence (XRF, e.g., [34]). Trace elements—such as B, Cd, Ce, Co, Cs, Cu, La, Mn, Mo, Ni, Pb, Rb, Sb, Se, Sn, Sr, Tl, V, Zn, and Zr—were determined using inductively coupled plasma mass spectroscopy (ICP-MS), [23,24]. Ion Chromatography was used to quantify cations (Na+, NH4+, K+, Mg2+, Ca2+) and anions, namely Cl−, NO2−, NO3−, SO42− and ions of low weight (LW) carboxylic acids, i.e., oxalate, acetate, glycolate, proponiate, formate, and pyruvate chromatography [23,34]. Also sugars and anidrosugars, were determined by high-performance anion exchange chromatography combined with pulsed amperometry detection [24].
In general, organic carbon (OC) and elemental carbon (EC) concentrations were quantified using a thermo-optical analyser (Sunset Laboratory OC/EC analysers) [18,30], and water-soluble organic carbon (WSOC) was analyzed with a total carbon analyzer instrument [23]. From these values, the contribution of prima (POC) and secondary organic species (SOC) to OC was estimated [24,34].
3. Results and Discussion
3.1. Study Overview
The relevant studies concerning Italian sites published up to May 2019 were searched in the Web of Science database, using as inclusion criteria that they report OP data of PM samples collected in Italian sites measured using cell-free systems. In total, 19 independent studies were identified. Among these, 11 papers were detailed investigations specifically devoted to locations in Italy, while 8 were general studies in European cities also including Italian sites.
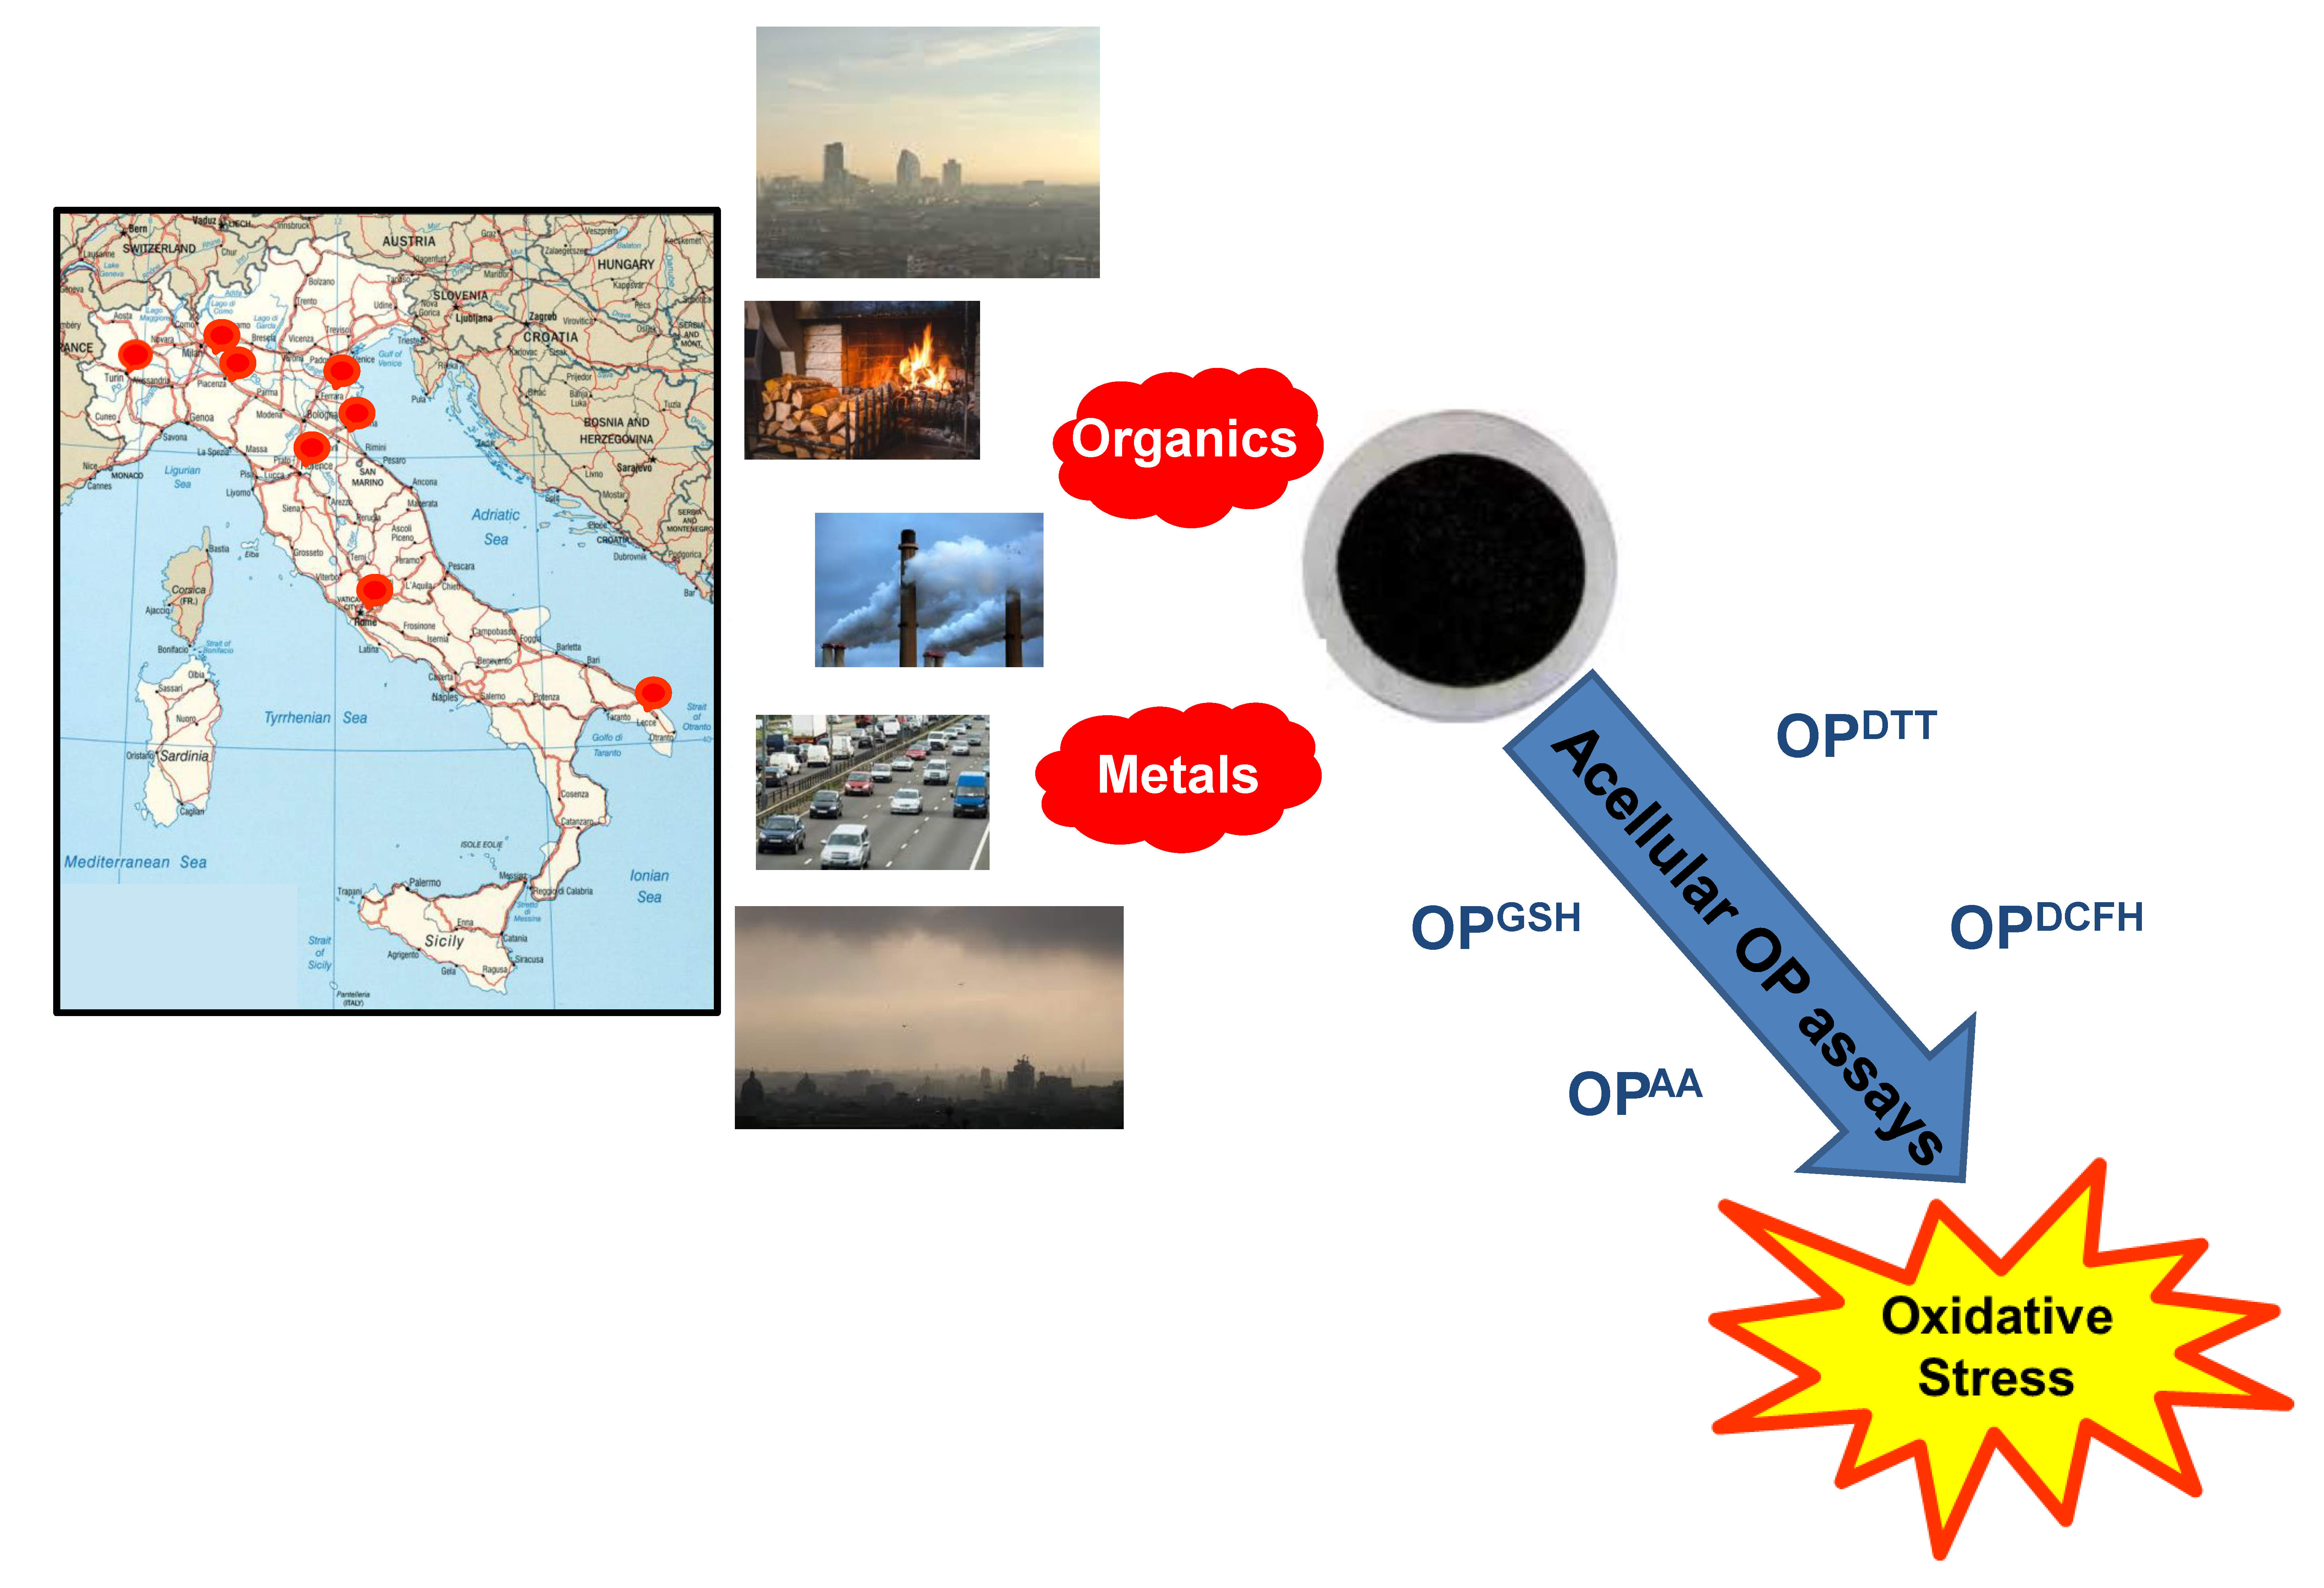
Overall, nine sites have been investigated located in different regions to cover the main geographical areas across the Italian peninsula, even if their spatial distribution is rather inhomogeneous, with Northern Italy, mainly the Po Valley, quite extensively monitored and other areas, especially Southern Italy, still lacking data (Figure 1). The monitoring stations include urban, industrial, traffic, and semi-rural sites, so that they may give information on the impact of anthropogenic sources on PM oxidative property.
The reviewed studies were based on four of the most commonly used OP acellular assays, often using two or more OP assays in combination, i.e., 11 studies measured OPDTT, 11 studies OPAA, 3 studies OPGSH, and 6 studies OPDCFH.
Table 1 summarizes the relevant information on the studies considered in our synthesis, by grouping the data according with PM dimensional fractions. The table reports the characteristics of PM samples collection, i.e., site location, period and duration of PM sampling, the acellular assays used for OP measurement, and the chemical species analyzed for PM characterization.
Different particle size fractions were investigated, including total suspended particles, PM10, PM2.5, and size-aggregated fractions, even if most of the studies concerned fine PM2.5 fraction.
OP of total suspended particles (TSP) were measured in Milan, the biggest Italian city in Northern Italy (~1,400,000 inhabitants). Three campaigns were conducted in January, July, and October 2013. The OPDTT and OPDCHF responses were measured at two sites with different traffic loads, i.e., low emission zone and busy traffic site, giving comparable data [28].
Oxidative properties of PM10 samples were investigated in Trentino region (Alpine valley in Northern Italy) in April–May 2016, at an urban background and industrial sites, in order to characterize the impact of local emission sources, including a Zn coating factory [23]. OPDTT and OPAA of PM10 particles were measured also in Lecce, an urban background site in Southern Italy over a whole year, from December 2014 to October 2015, so that it was possible to investigate seasonal trend (autumn–winter, AW, vs. spring–summer, SS) [34]. In the same campaign, also PM2.5 granulometric fraction was simultaneously collected and analyzed to investigate the variation of the OPDTT and OPAA activity in relation with the particle size and chemical composition [24]. At the same site, an independent study was conducted by Chirizzi et al. to measure OPDTT of the water-soluble PM2.5 and PM10 particles, with the specific concern of characterizing the impact of Saharan dust outbreaks [27]. For both coarse PM10 and fine PM2.5 particles, OPDCHF was investigated in Milan on a weekly basis in a year-long period (December 2009 to November 2010) and related to PM chemical properties [35].
Oxidative properties of fine particles were investigated at an urban site (Bologna, 400,000 inhabitants) and a rural location (SPC, san Pietro Capofiume, 30 km far from Bologna) located in the Emilia Romagna region, in the Eastern side of Po Valley, one of the most polluted areas in Europe. One monitoring campaign was conducted in February–July 2013 [18] and the other one in March 2018 [30]. OP of PM2.5 samples in some Italian cities were also measured as a part of more general studies concerning different locations over Europe. Rome was included in a study that measured OPDTT in 2010 [20] and also in a work carried out in February 2017 to measure OPDCHF of particles collected using PILS system [21]. Two studies measured OPAA and OPGSH of fine PM at Turin, a big industrial city (~900,000 inhabitants) located on the Western side of the Po Plain [19,31] and one of them, concerning 20 European sites over one year, also included smaller city Pavia (~70,000 inhabitants) [31].
In addition, some studies measured OP in size-resolved PM fractions. One included PM samples collected in April–July 20 in Milan, among six cities and three rural sites across Europe [16]. Three PM size classes (PM>7, PM3–7, PM3) were characterized for OPDTT and for total elements. Others were performed on PM sampled in Rome and Ferrara, eastern Po valley, and also on PM from specific sources [25,26,33]. They used DTT, AA, and DCFH assays to measure OP of nine size-segregated PM fractions, i.e., cut-sizes: 0.18, 0.32, 0.56, 1.0, 1.8, 3.2, 5.6, 10, and 18 μm.
Finally, two papers concern oxidative properties of indoor air. They are general studies concerning several European cities, within the European Union project OFFICAIR, including Milan and Florence, a big city (~1,000,000 inhabitants) located in the center of Italy [17,32]. PM2.5 particles were collected in mechanically ventilated offices and their OP was measured by using the ascorbate and glutathione assays.
Overall, the operative protocols used by the Authors varied widely by study for each of the four assays. The extraction procedures changed in terms of the used solvent (water, phosphate buffer at pH7.4, or methanol), duration time, and temperature of agitation or ultra-sonication operations and also different reagent concentrations were employed.
In addition, the units for expressing the OP responses varied by assay and study: They are based on time rate-of-change, expressed as nmol or % depletion per min. They may be volume-based values (nmol or % depletion per min per m3 of air) or mass-based data (nmol or % depletion per min per μg of PM; sometimes referred as intrinsic OP). However, the conversion between the volume- and mass-based metrics (OPV and OPm, respectively) was not always possible, since data on PM mass concentration was not always reported in the papers.
It is evident that such a protocol variability strongly affects the magnitude of the measured responses, with the consequence that not reliable and conclusive results are reported within every study, that can make comparisons across studies difficult.
3.2. Association of Oxidative Potential with PM Chemical Composition
Most of the reviewed studies performed the characterization of the chemical composition of the PM samples and investigated the association of OP responses with PM components (Table 1). In general, the papers concern volume-based OP, as mostly relevant metric for epidemiologic studies, since it reflects the actual exposure to redox-active PM upon inhalation, being a combination of the intrinsic PM oxidative potential with the total PM concentration [6,8,9,10,11,12,13,14,15,16]. Therefore, in the following OP indicates volume-based OP, OPV, when not specified.
The aim of the correlation analysis is to single out the PM components that drive OP responses from different assays and also to estimate the contribution of each individual species to OP. Table 2 summarizes the results from correlation analysis reported in the reviewed studies, grouped according with PM dimensional fractions. Most of the analyses were based on Pearson or Spearman correlations, assuming statistically significant relationships at p < 0.01 or p < 0.05 levels. The table reports the PM components having the highest association with OP responses from different assays.
In the following, the results of such associations will be compared among the different studies, with the aim to give a picture of different species contributing to OP in the various geographical areas across Italy.
In general, three main classes of inorganic and organic species showed the highest associations with OP from different assays, in agreement with literature data [8,19,36,37,38,39,40]:
- -
- Metals. The major PM components, such as alkali (Na, K) and hearth metals (Ca, Mg, Ba, Al) can be originated from resuspension of road dust, road abrasion, and soil dust emissions. Trace elements are several transition metals (i.e., Fe Cu, Zn, Pb, Cr, Ni, Mn, Sn, Cd) associated with non-tail pipe traffic emissions, mainly related to brake and tire wear [11,25,39,41,42,43,44]. Finally, K and Rb can be considered as tracers of the biomass burning [23,26].
- -
- Carbonaceous components. They include elemental, EC, organic, OC, and water soluble organic carbon, WSOC. OC may be discriminated between primary (POC) and secondary organic species (SOC), based on the quantification of individual compounds, as tracers of specific sources, i.e., sugars, levoglucosan—widely used tracer of biomass burning [22,31,37,43]; n-alkane and PAHs—tracers of tail pipe traffic emissions [20]; carboxylic acids and quinones—markers of photochemical formation of SOA [45,46,47,48,49,50,51,52].
- -
3.2.1. Association with Metals
Several studies across Italy reported that the volume-normalized OPAA data are widely correlated with both soluble and total fractions of several elements, i.e., Mn, Fe, Cu, Cr, Zn, Ni, Al, K, Mg, Ca, Cd, Ba, and Rb. This has been found for ambient PM10 particles at Trento [23] and Lecce [34], for PM2.5 at Bologna [18] and Lecce [24] and in general studies including Turin [19,31], Milan, and Florence [17,32]. Correlations with the same metals were also observed for OPDTT responses for PM10 and PM2.5 samples at Trento [23], Lecce [24,27,37] and Bologna [18], for TSP at Milan [28] and for size aggregated PM3, PM3-7, PM7 particles at Milan [16]. OPGSH showed significant correlations with some metals, including copper, tin, molybdenum, and aluminum in outdoor and indoor PM2.5 particles [17,32]. By investigating outdoor and indoor (office buildings) PM2.5 samples in Firenze and Milan, the correlation analysis revealed that indoor OPAA and OPGSH responses were significantly associated with fewer components (Cu and Mo) compared with outdoor OP. It is noteworthy that mean indoor OP values were substantially lower than the related outdoor data, with a mean indoor/outdoor ratio of 0.62. This suggests that the indoor air is generally less oxidatively dangerous than outdoors, even if the indoor air chemistry might involve complex formation of other redox-active species which alter the oxidative properties of PM.
3.2.2. Association with Organic Species
Many studies across Italy show that the OP assays are sensitive to organic species, described by WSOC, EC, and OC. In particular, some authors investigated the discrimination between primary and secondary OC in detail. They found that OPDTT and OPAA data at Lecce and Trento were mainly associated with POC [23,34], that is also confirmed by association of OPDTT with anhydrosugras emitted from wood combustion [23]. Conversely, Chirizzi found that secondary organic species have a larger effect on OPDTT with respect to primary OC, as OPDTTV is more strongly correlated with OC than with EC [27]. This result is consistent with the data of other authors, suggesting that photochemical aging is an important factor in determining PM redox properties. In fact, Perrone found a strong correlation of OPDTT with global radiation, a proxy for secondary oxidizing organics [28], while others observed that OPDTT and OPAA values were strongly associated with secondary ions, such as SO42−, NO3−, NH4+ and low weight carboxylic acids, produced by atmospheric photo oxidation of organics [24,34]. This correlation is the strongest in spring/summer at Lecce, characterized by highest solar irradiance values [24].
3.2.3. Intercorrelation among Species
Some studies reported that the chemical components associated with PM-induced OP exhibited strong inter-correlations among them [23,34,37]. Consequently, the association of OP with each individual species is difficult, and monodimensional analysis may produce misleading results. In these cases, a multivariate approach has to be preferred to take such cross-correlations into account and also to evaluate the effects of possible multicomponent interactions, e.g., between metals and organics and/or emission sources.
As an example, Pietrogrande applied the cluster hierarchical analysis for investigating the associations of OPDTT and OPAA with several chemical markers [23]. Even if several species resulted cross-correlated from Pearson’s analysis, the computed HA dendrograms clearly showed that OPDTT values were closest to K+ and Rb and then to a larger group formed by Mg2+, Pb, SO42−, WSTC, and Mn. This finding may indicate that the DTT activity is mainly driven by primary emissions, such as biomass burning (K+, Rb, and WSTC) and traffic (Mg2+, Pb, and Mn), and also by secondary particle formation (SO42−). Otherwise, in the HA dendrogram the species closest to OPAA was Cu followed by Zn, and then to a wide group of chemical components, including Al, K, Rb, Ca, and Mg elements. This suggests that the OPAA values are mainly dominated by contribution from industrial/agricolture activities and non-exhaust traffic emissions.
3.3. Comparison among Different Acellular Assays
3.3.1. Sensitivity of Different Acellular Assays
The reviewed studies confirmed the general finding that the various OP assays display different sensitivity towards the same redox-active PM components, because they capture the redox reactions of different species [4,6,8,10,12,13,14,15,37,46]. Overall, DTT mainly responded to the organic compounds, as traced by OC, EC, that represent burning sources, including fuel vehicular and biomass burning emissions—and redox active species such as quinones, associated with other markers of photochemical aging (SO42−, NO3−). In addition, OPDTT responses are also affected by traffic-related metals. In contrast, OPAA and OPGSH were mostly responsive to metals, mainly related to non-exhaust traffic emissions (Cu, Zn, Cr, Fe, Ni, Mn, Sn, Cd, Pb) [12,18,25,26,27,28,32,33,34,35,36].
Although both OPDTTV and OPAAV are sensitive to the same redox-active species, they show different sensitivity, as found in outdoor and indoor fine particles [22]. This point was investigated in detail by performing linear regression analysis on OPDTT and OPAA as a function of species concentration, and comparing the slope of best fitting lines, as a measure of each assay sensitivity to the investigated species [23,24]. Both assays showed similar sensitivity to the soluble fractions of K, Ca, Mn, Rb, and WSTC, while AA was six times more sensitive Zn and times to Cu compared with DTT [23].
Overall, it must be pointed out that association of volume-normalized OPDTT with transition metals should be interpreted with caution, as it may be due to similar variations in metal and PM concentrations, and also to higher concentration of metals compared with that of quinones, that are more efficient than metals to DTT oxidation [48,49].
Finally, DTT and DCFH showed different sensitivity when applied to TSP samples at Milan, with OPDCFH mainly associated with OC, TC, SO42−, NO3−, NH4+ markers secondary aerosol [28].
3.3.2. Correlation between OP Responses from Different Acellular Assays
The paper summarized in this study describe contrasting results on the relationship between OP responses from the various assays, as reported in other literature references [4,6,8,10,11,12,13,14,15].
Concerning the most investigated comparison between OPDTT and OPAA responses, no significant correlation was found between the measurements on PM2.5 at Bologna (Pearson correlation coefficient, r < 0.4), even if the values obtained with both assays were similarly correlated with metals, i.e., OPDTT was found highly correlated with several metals (Cu, Zn, Cr, Fe, Ni, Mn), whereas OPAA only moderately with Cu and Mn [18]. This result is consistent with other papers reporting that OPDTT—similarly to OPDCFH—is mostly sensitive towards the combustive and secondary compounds of PM, i.e., Mo, Ni, SO42−, Cd, and WSOC, in contrast with OPAA, that mainly responds to high concentrations of water soluble fractions of Mn, Sr, Rb, Se, P, and Ca, that are typical markers of pellet ash and also in brake dust [25,26,28,35,36,37,41,44].
In contrast, a significant correlation was found between OPDTT and OPAA responses measured on PM10 at an industrial site (Ala, Pearson correlation coefficient r = 0.60, p < 0.01), and at urban background site (Trento, r = 0.71, p < 0.01, [23]), and also at Lecce (r = 0.52, p < 0.01), where DTT and AA assays provide similar OP values within the same variability range [34]. This suggests that DTT and AA assays have similar associations with the chemical species in the studied PM samples, that are additionally strengthen by the inter-correlations among their concentrations.
In the alternative method proposed based on the cytochrome c (cyt-c) reduction rate, TCEP is more reactive towards quinones, in comparison to DTT, suggesting that it may be used as more sensitive device for measuring OP of low amount of ROS-generating compounds, such as quinines, in complex mixtures [29].
3.3.3. PM Size Distribution of OP Responses
The dimensional profile of redox activity of various PM size fractions has been investigated in several reviewed studies. Literature data suggest that the OP responses, both volume- and mass-based values, show a clear size distribution, as a consequence of the specific sensitivity of each OP assay used for measurement towards the redox-active components accumulated in the different PM fractions [4,6,8,13,14,15,16,21,45,50]. This is very relevant for its toxicological concern, since different size fractions may reach different parts of the lung, and therefore display different toxicological effects [1,6,7,8,11].
Accordingly, to literature, DTT has been found most reactive towards species accumulated in the fine fraction, such as tracers of burning sources, including fuel vehicular and biomass burning emissions—OC, EC, K, Rb, levoglucosan—and markers of secondary aerosol, such as quinones and ions (SO4 2−, NO3−). In particular:
- ■
- Similar OPDTTV values were measured in Lecce for PM2.5 and PM10 fractions (close to 0.20 ± 0.04 nmol min−1 m−3), while the intrinsic OPDTTm value was larger for PM2.5 than for PM10 [24];
- ■
- An average ratio of 0.86 (±0.10 standard deviation) was found between OPDTTV of PM2.5 and PM10 particles in an independent study in Lecce, with the differences between the two fractions maximized for Saharan dust events and minimized for high carbon content samples [27];
- ■
- By investigating OP distribution of size-segregated PM samples collected in Rome and Ferrara, Simonetti found that OPDTTV, as well as OPDCFHV responses, shows a size distribution profile characterized by of a broad maximum in the 0.32–1.8 μm PM, that is similar to that of the markers of BB emissions [25];
- ■
- In a study concerning PM3, PM3–7, and PM>7 in 17 sites in Europe, including Milan, Shafer found that OPDTTV is dominated by the PM3 fraction, since it represents 76% of total OP activity, with the PM3-7 contributing on average 17% and PM>7 7%. Accordingly, PM3 fraction showed a higher intrinsic OPDTTm in comparison with the larger particles. No chemical components were found associated with DTT activity (Spearman r > 0.7) in the PM3 size cut, while tracers of biomass burning—K and Rb—and of non-tailpipe vehicle emission—Fe, Sn, Cu, Sb, and Ba—exhibited good correlations with OPDTTV in the PM3–7 size fraction [16].
The OPDCFH responses showed a similar size profile as OPDTT data, since the measured values tend to increase with decreasing aerosol median diameter (Rome, [21]).
Otherwise, the AA assay has been found more sensitive towards metals mainly accumulated in the coarse fraction, as tracers of re-suspended road dust and brake abrasion. Simonetti found a clear OPAAV size distribution profile with the maximum in the size range 3.2–5.6 μm, that is the same size particle distribution displayed by the tracers of brake abrasion to re-suspended road dust, i.e., Cu and Fe [25,26]. This conclusion has been also confirmed by the chemical composition of the insoluble fractions (microwave assisted digestion with HNO3/H2O2 mixture) of the size-resolved PM samples. It mainly consists of particles belonging to the coarse mode (maximum in the 3.2–10 μm range), with the dominant contribution of soil re-suspended dust, together with break and tire wear, mainly traced by Ca, Al, Fe, Cu, Mo, Sb, and Sn. Consistently, Perrone found significantly higher OPAAV responses for PM10 than for PM2.5 particles, i.e., 0.35 ± 0.06 vs. 0.21 ± 0.03 nmol min−1 m−3 in AW and 0.23 ± 0.04 vs. 0.09 ± 0.01 nmol min−1 m−3 in SS, respectively [24].
3.4. Spatial Variability of OP in Different Areas across Italy
Although several OPDTT and OPAA values have been up to date measured across Italy, the meaningful comparison among the data has to be restricted to the OP responses obtained with similar experimental assay protocols, to generate reliable and conclusive results within every study. Such a comparison across studies may give a picture of the spatial and seasonal variability of aerosol OP across the Italian peninsula to obtain insight into the contribution of sources, atmospheric processes, and meteorological conditions.
3.4.1. OP Responses of PM10 Particles
Four independent studies assessed the OPDTT and OPAA values of the PM10 particles in three different locations, i.e., Trentino region, Lecce, and Milan using close assay protocols [23,24,27,28,34]. The data are summarized in Figure 2a,b to describe spatial and seasonal variation among the three study sites.
Overall, we can observe a remarkable uniformity in OPDTT values across Italy, since similar values were measured in the different sites, also independent of seasonality. Inside such a general uniformity, the OPDTT levels were nearly triple in the northern Trentino region (0.61 ± 0.2 nmol min−1 m−3) compared to the southern site of Lecce (0.24 ± 0.9 nmol min−1 m−3). Such a trend is opposite to that of PM10 mass concentration, as PM10 mass is lower in Trentino (mean value 14 ± 10 µg m−3) than at Lecce (mean value 37 ± 25 µg m−3) and therefore it may be explained by variation in PM10 chemical composition, as reported in the reviewed papers [23,34]. As the DTT assay mainly responds to organic components, we can infer that the increase in OPDTT in Trentino may be mainly related to the larger impact of carbonaceous particles released by combustion sources (road traffic and domestic heating). Such a hypothesis is supported by a similar high OPDTT value of 0.72 ± 0.29 nmol min−1 m−3 measured at Lecce for a specific subset of PM10 samples characterized by high total carbon content [27]. This assumption can be associated with morphological and climatic differences among the different sites. In fact, Trentino is a pre-alpine region, close to the high mountain chain of the Alps, that is characterized by cold winters, low wind speed, and frequent stable atmospheric conditions, especially during winter. These conditions favor pollutant accumulation, that strengthens the impact from anthropogenic source emissions [23]. Otherwise, Lecce is a coastal site of the Central Mediterranean area, away from large sources of local pollution with high wind speed and high boundary layers that favor pollutant dispersion [51].
For comparison, the Figure 2a also reports the OPDTT data of total suspended particles measured in Milan, although the comparison is weakened by the difference in particle size compared to PM10 [28]. Overall, we can observe a surprising low OPDTT value close to 0.61 ± 0.2 nmol min−1 m−3 associated with a high mass concentration (up to 9 µg m−3 in the cold season). This may be likely explained by the different assay operative conditions, that used methanol instead of phosphate buffer as extraction solvent.
PM10 samples at Lecce and in Trentino region were also investigated with AA assay (data summarized in Figure 2b). As seen in the figure, inside the general homogeneity of the OPAA values, the contrast across the two sites is still larger than that for OPDTT data, with comparable values at Lecce (OPAA ~ 0.24 nmol min−1 m−3) and an increase up to 0.68 ± 0.42 nmol min−1 m−3 at Trento and further to 1.41 ± 0.4 nmol min−1 m−3 at the industrial site Ala.
As this difference corresponds to relatively small variation in PM concentrations across the study sites, it is likely explained by a contrasting mix of sources that can significantly change concentrations of the chemical drivers of oxidative activity. Based on the specific reactivity of AA towards metals, higher OPAA in Trentino may be mainly associated with higher levels of AA-active metals. In fact, three main emission sources are present in the investigated region: Traffic in a congested major motorway (Fe, Pb, Ca, Mg, Mn), a zinc coating industry (Cl−, NO3−, NH4+, Ca2+, Cu, Zn) and the widespread pesticide use in the surrounding vineyards (Cu). Consequently, the concentrations of PM-associated airborne metals are higher at Ala in comparison with Lecce, in particularly Zn (24.5 ng m−3 at Ala vs. 7 ng m−3 at Lecce) and Cu (8.4 ng m−3 vs. 6.1 ng m−3). This concentration trend explains the larger differences for OPAA than for OPDTT, on the basis of the specific sensitivity of the AA assay to these metals.
3.4.2. OP Responses of PM2.5 Particles
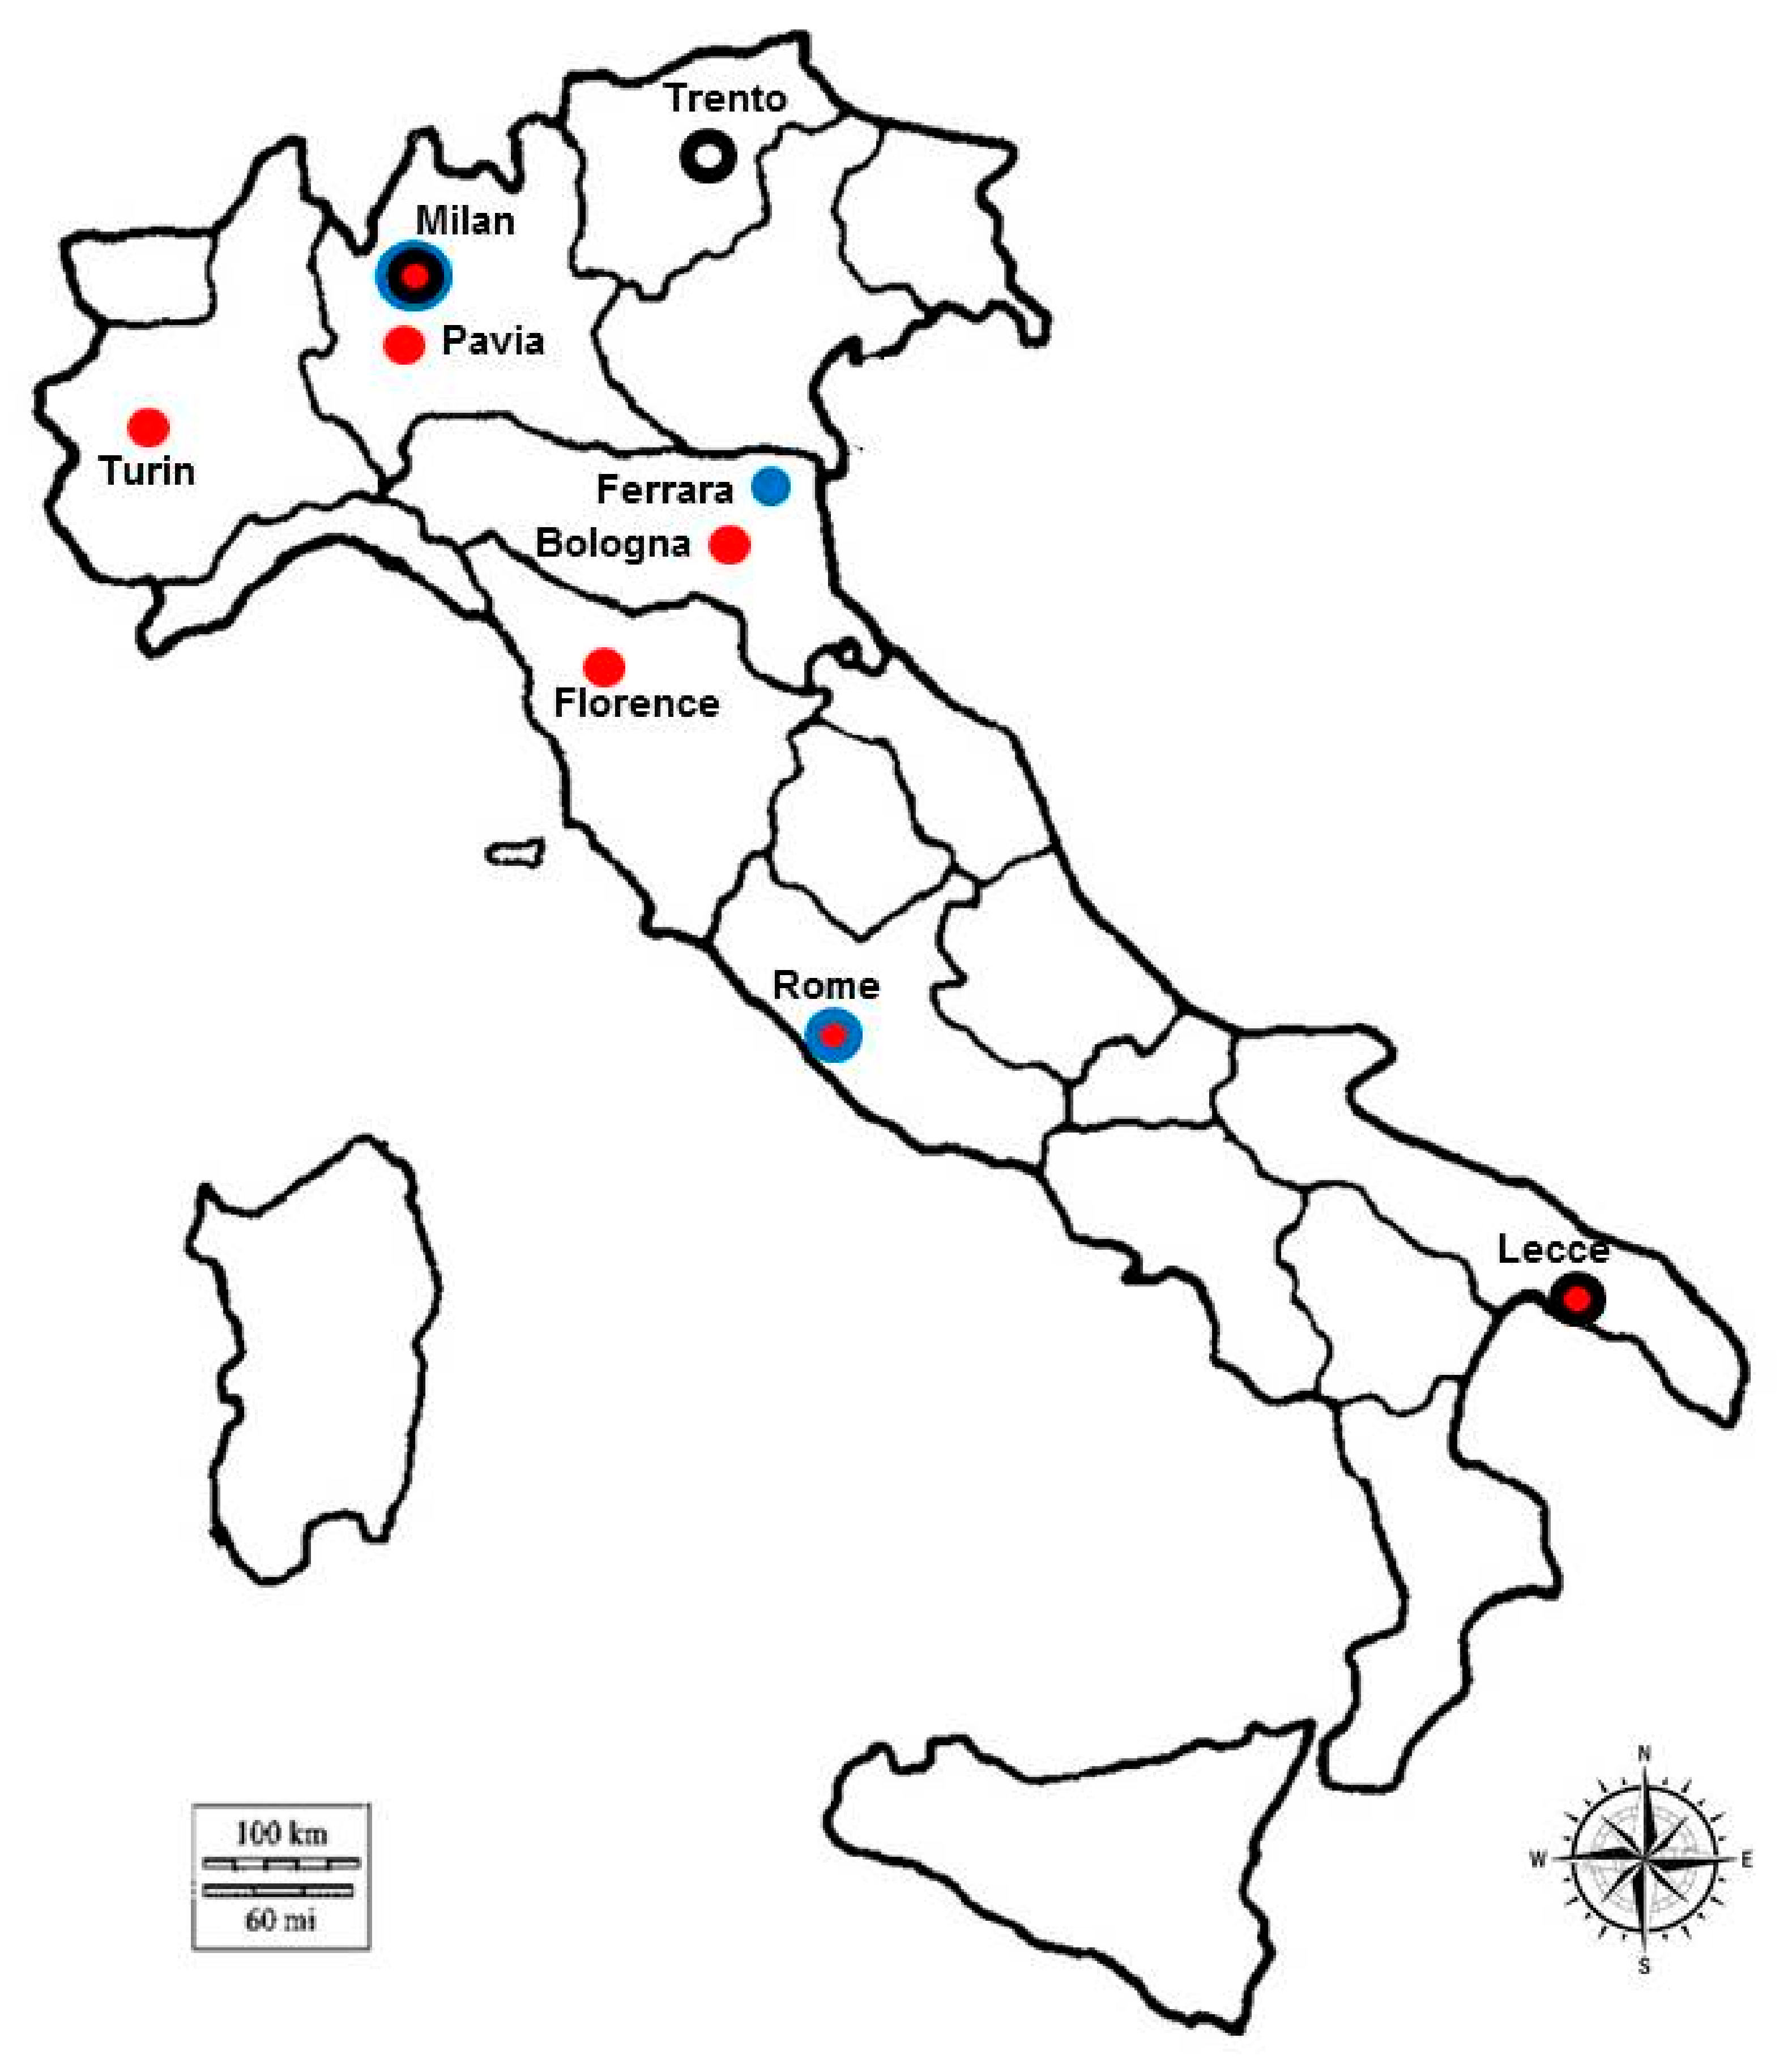
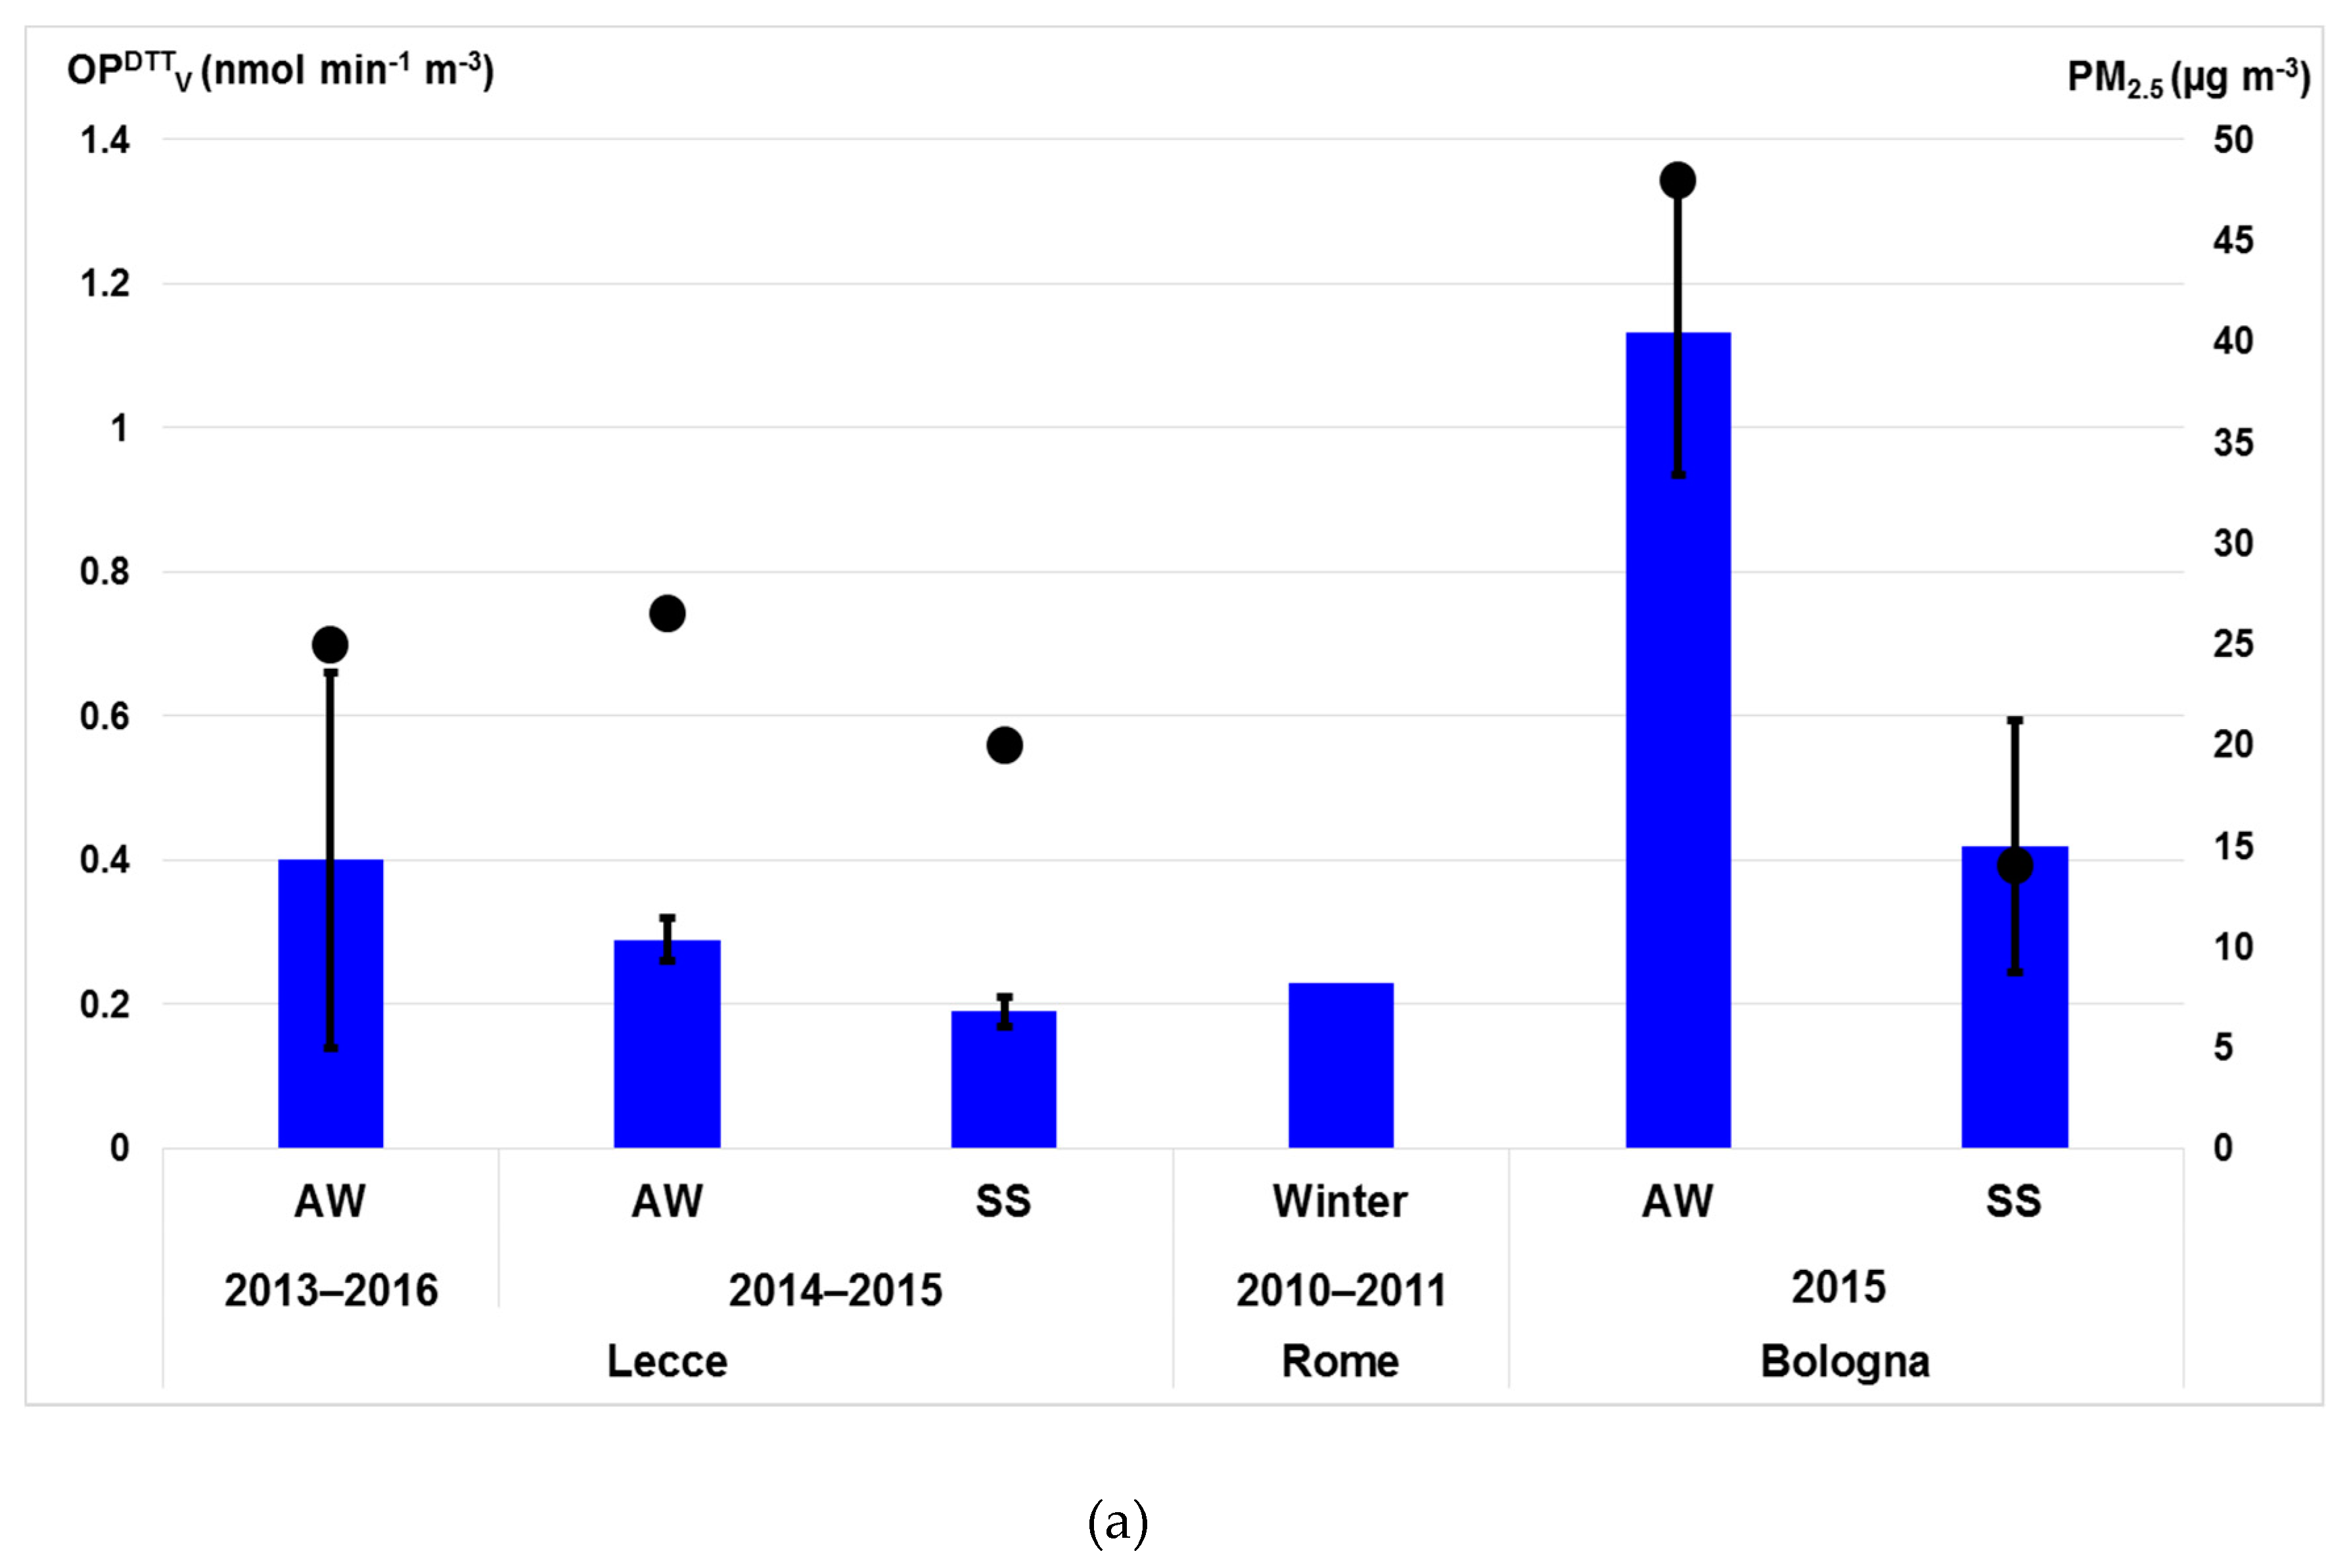
Among the reviewed papers, four studies reported OPDTTV responses measured with similar assay protocol for PM2.5 samples collected at Lecce, Rome, and Bologna in both seasons, as summarized in Figure 3a [18,20,24,27]. Compared with PM10 particles, the location-dependence (or source-dependence) of PM oxidative potential is more evident for the PM2.5 size, with values nearly 5 times higher at Bologna in AW (1.1 ± 0.2 nmol min−1 m−3) than at Lecce in SS (0.2 ± 0.02 nmol min−1 m−3). This variation can be explained by higher PM2.5 concentrations at Bologna in wintertime (48 µg m−3) compared to those in all the investigates studies (14 to 25 µg m−3) and also by the intrinsic redox reactivity, measured as mass-normalized OPDTTm value, that is higher at Bologna compared to Lecce i.e., 0.029 nmol min−1 µg−1 vs. 0.010 min−1 µg−1. In addition, a clear seasonal trend is shown at both sites, with larger winter increase at Bologna (4 times higher) compared to Lecce (2 times).
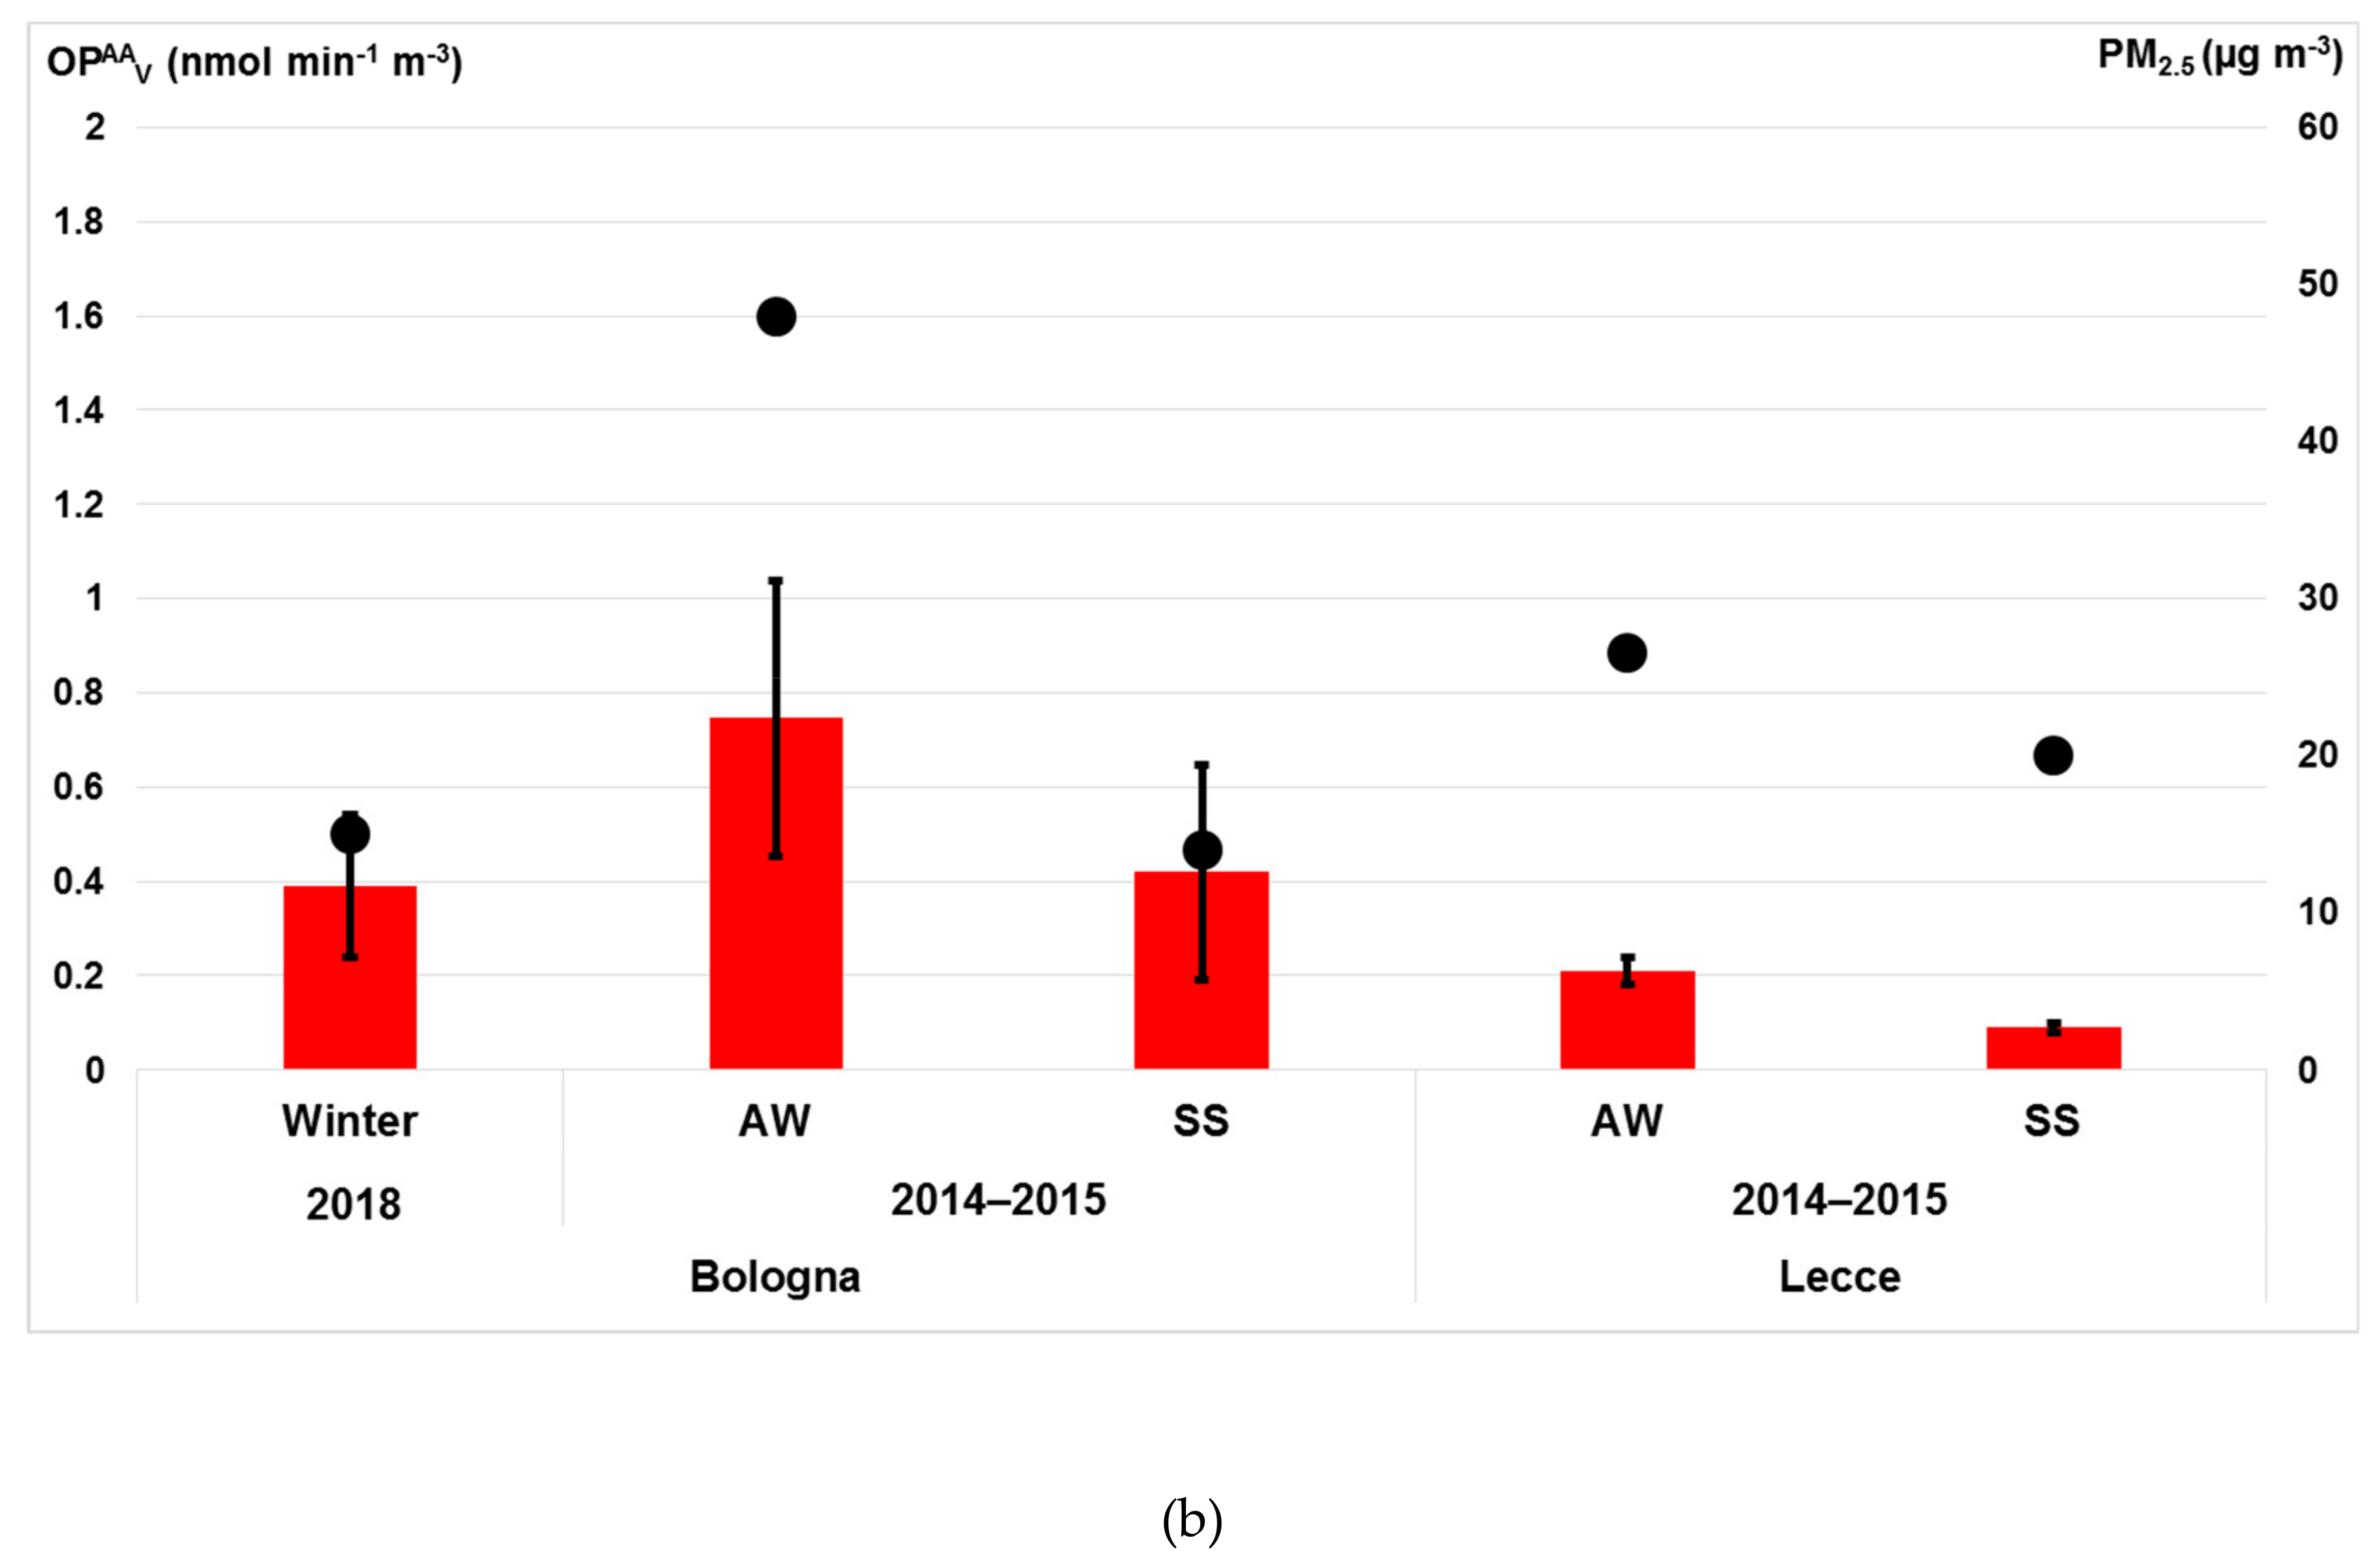
Three studies measured OPAA values of PM2.5 samples collected at Bologna and Lecce in different seasons (data summarized in Figure 3b, [18,24,30]). The highest OPAAV responses were measured in Bologna, as their value was nearly triple (0.75 ± 0.2 nmol min−1 m−3) compared to Lecce (~0.20 nmol min−1 m−3) with a clear increase during cold season at both sites. As PM2.5 mass concentrations were similar at both sites, the OPAA variations can be mainly explained by differences in the intrinsic redox reactivity, as confirmed by higher OPAAm measured at Bologna than at Lecce, mainly during the warm season, i.e., 0.03 nmol min−1 µg−1 vs. 0.005 nmol min−1 µg−1, respectively.
Considering that the OPDTT values showed the higher spatial and temporal variations, compared to OPAA, and that DDT assay is mostly sensitive to organic species, we can infer that the observed behavior for PM2.5 OP is mainly associated with the contribution of secondary organics, especially highly oxidized organics traced by SOC concentration. In fact, significantly higher SOC concentrations have been found at Bologna compared to Lecce, mainly in the cold season, both as concentration values (on average, ≈ 3 vs. 1.5 µg m−3) and relative contribution to PM2.5 mass (~50% vs. 15%) [24,52]. The high contribution of secondary pollutants in the Po Plain has been motivated by the large impact of anthropogenic emissions, mainly wood combustion for domestic heating during winter, combined with the stable atmospheric conditions (Hmix ≈ 300 m), that promote pollutant accumulation in the atmosphere and therefore favor the photochemical aging of organic aerosol. In particularly, PAHs can be converted into large oxidized aromatic, e.g., DTT-active quinones, as strongly supported by chamber studies [48,49]. This explanation is also consistent with the positive correlation observed for PM samples in Milan between OPDTTm with global radiation and, to a lesser and low extent, also with T, O3, and chemical components formed by photochemical reactions (SO42− and oxalic acid) [28].
4. Conclusions
Our review based on 19 independent studies in 9 sites in Italy gives an insight on the spatial and seasonal variations of PM redox activity across the peninsula. The reviewed papers are based on the most common acellular assays, including the DTT, AA, GSH, and DCFH, for the simple, fast, and reliable measurement of OP. However, care should be taken when comparing OP results from different studies, as they often use varying operative protocols, since a unique standard method is still lacking. Future work should be needed to optimize and standardize the operative conditions of each OP acellular assay in order to provide consistent data for comparison between data of different locations and times.
The study supports the current literature highlighting that most OP assays respond to metals, mainly associated with vehicle traffic emission, and also to organics, from sources like biomass burning. In addition, DTT assay is especially sensitive to photochemically aged organics, as found in the Po Plain during winter. Inside a general similarity among different investigated sites, the OPDTTV and OPAAV responses show some differences, in particular between Northern and Southern regions. They may be explained by variation in PM chemical composition, as consequence of the different impact of emission sources and atmospheric conditions. However, to date, only a limited number of Italian locations has been investigated for OP: Further studies should to be continued in order to homogeneously cover the different geographical areas across the Italian peninsula.
Although the conclusions reached in this review are based on limited available studies, they clearly confirm that OP is a multipollutant parameter, that integrates the composition effects into just one measurement, rather than speciation of individual components requiring a suite of instrumental measurements. As OP captures the redox active components and sources that can be related to health end points, it can be used as predictor of adverse health impacts associated with an oxidative stress mechanism. Though the promising results for understanding what chemical species and interactions drive OP, further investigations are needed for determining the underlying mechanism of the adverse health outcomes associated with PM exposure.
Author Contributions
The contribution of the authors is summarized as follows: Conceptualization, M.C.P., data curation, M.R. and E.Z.; writing—original draft, M.C.P.; writing—review and editing, M.R.
Funding
This research received no external funding.
Acknowledgments
This review was written to be presented at the International Workshop “PM Oxidative Potential: response of acellular assays to predict PM-induced oxidative stress activity” held in Ferrara on 3 July 2019. The Authors acknowledge the Italian Aerosol Society for organizing and financially supporting the Workshop.
Conflicts of Interest
The authors declare no conflict of interest.
References
- Abrams, J.Y.; Weber, R.J.; Klein, M.; Samat, S.E.; Chang, H.H.; Strickland, M.J.; Verma, V.; Fang, T.; Bates, J.T.; Mulholland, J.A.; et al. Associations between Ambient Fine Particulate Oxidative Potential and Cardiorespiratory Emergency Department Visits. Environ. Health Perspect. 2017, 5, 10. [Google Scholar]
- Antinolo, M.; Willis, M.D.; Zhou, S.; Abbatt, J.P.D. Connecting the oxidation of soot to its redox cycling abilities. Nat. Commum. 2015, 6, 68. [Google Scholar] [CrossRef] [PubMed]
- Crobeddu, B.; Aragao-Santiago, L.; Bui, L.C.; Boland, S.; Baeza Squiban, A. Oxidative potential of particulate matter 2.5 as predictive indicator of cellular stress. Environ. Pollut. 2017, 230, 5–133. [Google Scholar] [CrossRef] [PubMed]
- Janssen, N.A.H.; Strak, M.; Yang, A.; Hellack, B.; Kelly, F.J.; Kuhlbusch, T.A.J.; Harrison, R.M.; Brunekreef, B.; Cassee, F.R.; Steenhof, M.; et al. Associations between three specific a-cellular measures of the oxidative potential of particulate matter and markers of acute airway and nasal inflammation in healthy volunteers. Occup. Environ. Med. 2015, 72, 49–56. [Google Scholar] [CrossRef]
- Mittal, M.; Siddiqui, M.R.; Tran, K.; Reddy, S.P.; Malik, A.B. Reactive oxygen species in inflammation and tissue injury. Antioxid. Redox Signal. 2014, 20, 16–1167. [Google Scholar] [CrossRef]
- Saffari, A.; Daher, N.; Shafer, M.M.; Schauer, J.J.; Sioutas, C. Global Perspective on the Oxidative Potential of Airborne Particulate Matter: A Synthesis of Research Findings. Environ. Sci. Technol. 2014, 48, 7576–7583. [Google Scholar] [CrossRef]
- Strak, M.; Janssen, N.A.H.; Godri, K.J.; Gosens, I.; Mudway, I.S.; Cassee, F.R.; Lebret, E.; Kelly, F.J.; Harrison, R.M.; Brunekreef, B.; et al. Respiratory Health Effects of Airborne Particulate Matter: The Role of Particle Size, Composition, and Oxidative Potential-The RAPTES Project. Environ. Health Perspect. 2012, 120, 1183–1189. [Google Scholar] [CrossRef]
- Bates, J.T.; Fang, T.; Verma, V.; Zeng, L.; Weber, R.J.; Tolbert, P.E.; Abrams, J.; Sarnat, S.E.; Klein, M.; Mulholland, J.A.; et al. Review of acellular assays of ambient particulate matter oxidative potential: Methods and relationships with composition, sources, and health effects. Environ. Sci. Technol. 2019, 53, 4003–4019. [Google Scholar] [CrossRef]
- Delfino, R.J.; Staimer, N.; Tjoa, T.; Gillen, D.L.; Schauer, J.J.; Shafer, M.M. Airway inflammation and oxidative potential of air pollutant particles in a pediatric asthma panel. J. Expo. Sci. Environ. Epidemiol. 2013, 23, 466–473. [Google Scholar] [CrossRef]
- Sauvain, J.; Rossi, M.J.; Riediker, M. Comparison of three acellular tests for assessing the oxidation potential of nanomaterials. Aerosol Sci. Technol. 2013, 47, 218–227. [Google Scholar] [CrossRef]
- Spagnolo, A.M.; Ottria, G.; Perdelli, F.; Cristina, M.L. Chemical Characterization of the Coarse and Fine Particulate Matter in the Environment of an Underground Railway System: Cytotoxic Effects and Oxidative Stress—A Preliminary Study. Int. J. Environ. Res. Public Health 2015, 12, 4031–4046. [Google Scholar] [CrossRef] [PubMed]
- Jiang, H.; Ahmed, C.M.S.; Canchola, A.; Chen, J.Y.; Lin, Y.-H. Use of Dithiothreitol Assay to Evaluate the Oxidative Potential of Atmospheric Aerosols. Atmosphere 2019, 10, 571. [Google Scholar] [CrossRef]
- Fang, T.; Verma, V.; Bates, J.T.; Abrams, J.; Klein, M.; Strickland, M.J.; Sarnat, S.E.; Chang, H.H.; Mulholland, J.A.; Tolbert, P.E.; et al. Oxidative potential of ambient water-soluble PM2.5 in the southeastern United States: Contrasts in sources and health associations between ascorbic acid (AA) and dithiothreitol (DTT) assays. Atmos. Chem. Phys. 2016, 16, 3865–3879. [Google Scholar] [CrossRef]
- Hedayat, F.; Stevanovic, S.; Miljevic, B.; Bottle, S.; Ristovski, Z.D. Review—Evaluating the molecular assays for measuring the oxidative potential of particulate matter. Chem. Ind. Chem. Eng. Q. 2015, 21, 201–210. [Google Scholar] [CrossRef]
- Hellack, B.; Nickel, C.; Albrecht, C.; Kuhlbusch, T.A.J.; Boland, S.; Baeza-Squiban, A.; Wohlleben, W.; Schins, R.P.F. Analytical methods to assess the oxidative potential of nanoparticles: A review. Environ. Sci. Nano 2017, 4, 1920–1926. [Google Scholar] [CrossRef]
- Shafer, M.M.; Hemming, J.D.C.; Antkiewicz, D.S.; Schauer, J.J. Oxidative potential of size-fractionated atmospheric aerosol in urban and rural sites across Europe. Faraday Discuss. 2016, 189, 381–405. [Google Scholar] [CrossRef]
- Szigeti, T.; Dunster, C.; Cattaneo, A.; Cavallo, D.; Spinazzè, A.; Saraga, D.E.; Sakellaris, I.A.; de Kluizenaar, Y.; Cornelissen, E.J.M.; Hänninen, O.; et al. Oxidative potential and chemical composition of PM2.5 in office buildings across Europe—The OFFICAIR study. Environ. Int. 2016, 92–93, 324–333. [Google Scholar] [CrossRef]
- Visentin, M.; Pagnoni, A.; Sarti, E.; Pietrogrande, M.C. Urban PM2.5 oxidative potential: Importance of chemical species and comparison of two spectrophotometric cell-free assays. Environ. Pollut. 2016, 219, 72–79. [Google Scholar] [CrossRef]
- Gulliver, J.; Morley, D.; Dunster, C.; McCrea, A.; van Nunen, E.; Tsai, M.-Y.; Probst-Hensch, N.; Eeftens, M.; Imboden, M.; Ducret-Stich, R.; et al. Land use regression models for the oxidative potential of fine particles (PM2.5) in five European areas. Environ. Res. 2018, 160, 247–255. [Google Scholar] [CrossRef]
- Jedynska, A.; Hoek, G.; Wang, M.; Yang, A.; Eeftens, M.; Cyrys, J.; Keuken, M.; Ampe, C.; Beelen, R.; Cesaroni, G.; et al. Spatial variations and development of land use regression models of oxidative potential in ten European study areas. Atmos. Environ. 2017, 150, 24–32. [Google Scholar] [CrossRef]
- Costabile, F.; Alas, H.; Aufderheide, M.; Avino, P.; Amato, F.; Argentini, S.; Barnaba, F.; Berico, M.; Bernardoni, V.; Biondi, R.; et al. First Results of the “Carbonaceous Aerosol in Rome and Environs (CARE)” Experiment: Beyond Current Standards for PM10. Atmosphere 2017, 8, 249. [Google Scholar] [CrossRef]
- Sandrini, S.; Fuzzi, S.; Piazzalunga, A.; Prati, P.; Bonasoni, P.; Cavalli, F.; Bove, M.C.; Calvello, M.; Cappelletti, D.; Colombi, C.; et al. Spatial and seasonal variability of carbonaceous aerosol across Italy. Atmos. Environ. 2014, 99, 587–598. [Google Scholar] [CrossRef]
- Pietrogrande, M.C.; Dalpiaz, C.; Dell’Anna, R.; Lazzeri, P.; Manarini, F.; Visentin, M.; Toninandel, G. Chemical composition and oxidative potential of atmospheric coarse particles at an industrial and urban background site in the alpine region of northern Italy. Atmos. Environ. 2018, 191, 340–350. [Google Scholar] [CrossRef]
- Perrone, M.R.; Bertoli, I.; Romano, S.; Russo, M.; Rispoli, G.; Pietrogrande, M.C. PM2.5 and PM10 oxidative potential at a Central Mediterranean Site: Contrasts between dithiothreitol—And ascorbic acid—Measured values in relation with particle size and chemical composition. Atmos. Environ. 2019, 210, 143–155. [Google Scholar] [CrossRef]
- Simonetti, G.; Conte, E.; Perrino, C.; Canepari, S. Oxidative potential of size-segregated PM in an urban and an industrial area of Italy. Atmos. Environ. 2018, 187, 292–300. [Google Scholar] [CrossRef]
- Simonetti, G.; Conte, E.; Massimi, L.; Frasca, D.; Perrino, C.; Canepari, S. Oxidative potential of particulate matter components generated by specific emission sources. Atmos. Environ. 2018, 6, 99–109. [Google Scholar] [CrossRef]
- Chirizzi, D.; Cesari, D.; Guascito, M.R.; Dinoi, A.; Giotta, L.; Donateo, A.; Contini, D. Influence of Saharan dust outbreaks and carbon content on oxidative potential of water-soluble fractions of PM2.5 and PM10. Atmos. Environ. 2017, 163, 1–8. [Google Scholar] [CrossRef]
- Perrone, M.G.; Zhou, J.; Malandrino, M.; Sangiorgi, G.; Rizzi, C.; Ferrero, L.; Dommen, J.; Bolzacchini, E. PM chemical composition and oxidative potential of the soluble fraction of particles at two sites in the urban area of Milan, Northern Italy. Atmos. Environ. 2016, 8, 104–113. [Google Scholar] [CrossRef]
- Ciriello, F.; Gualtieri, M.; Longhin, E.; Ruffo, R.; Camatini, M.; Parenti, P. A new method and tool for detection and quantification of PM oxidative potential. Environ. Sci. Pollut. Res. 2015, 22, 469–478. [Google Scholar] [CrossRef]
- Pietrogrande, M.C.; Bertoli, I.; Manarini, F.; Russo, M. Ascorbate assay as a measure of oxidative potential for ambient particles: Evidence for the importance of cell-free surrogate lung fluid composition. Atmos. Environ. 2019, 211, 103–112. [Google Scholar] [CrossRef]
- Künzli, N.; Mudway, I.S.; Götschi, T.; Shi, T.; Kelly, F.J.; Cook, S.; Burney, P.; Forsberg, B.; Gauderman, J.W.; Hazenkamp, M.E.; et al. Comparison of oxidative Properties, Light Absorbance, and Total and Elemental Mass Concentration of Ambient PM2.5 Collected at 20 European Sites. Environ. Health Perspect. 2006, 114, 684–690. [Google Scholar] [CrossRef] [PubMed]
- Mihucz, V.G.; Szigeti, T.; Dunster, C.; Giannoni, M.; de Kluizenaar, Y.; Cattaneo, A.; Mandin, C.; Bartzis, J.G.; Lucarelli, F.; Kelly, F.J.; et al. An integrated approach for the chemical characterization and oxidative potential assessment of indoor PM2.5. Microchem. J. 2015, 119, 22–29. [Google Scholar] [CrossRef]
- Conte, E.; Canepari, S.; Frasca, D.; Simonetti, G. Oxidative Potential of Selected PM Components. In Proceedings of the 2nd International Electronic Conference on Atmospheric Sciences, Basel, Switzerland, 16–31 July 2017; Volume 2. [Google Scholar] [CrossRef]
- Pietrogrande, M.C.; Perrone, M.R.; Manarini, F.; Romano, S.; Udisti, R.; Becagli, S. PM10 oxidative potential at a Central Mediterranean Site: Association with chemical composition and meteorological parameters. Atmos. Environ. 2018, 188, 97–111. [Google Scholar] [CrossRef]
- Daher, N.; Ruprecht, A.; Invernizzi, G.; De Marco, C.; Miller-Schulze, J.; Heo, J.B.; Shafer, M.M.; Shelton, B.R.; Schauer, J.J.; Sioutas, C. Characterization, sources and redox activity of fine and coarse particulate matter in Milan, Italy. Atmos. Environ. 2012, 49, 130–141. [Google Scholar] [CrossRef]
- Calas, A.; Uzu, G.; Martins, J.M.F.; Voisin, D.; Spadini, L.; Lacroix, T.; Jaffrezo, J.L. The importance of simulated lung fluid (SLF) extractions for a more relevant evaluation of the oxidative potential of particulate matter. Sci. Rep. 2017, 7, 2045–2322. [Google Scholar] [CrossRef]
- Fang, T.; Verma, V.; Guo, H.; King, L.E.; Edgerton, E.S.; Weber, R.J. A semi-automated system for quantifying the oxidative potential of ambient particles in aqueous extracts using the dithiothreitol (DTT) assay: Results from the Southeastern Center for Air Pollution and Epidemiology (SCAPE). Atmos. Meas. Tech. 2015, 8, 471–482. [Google Scholar] [CrossRef]
- Park, J.; Park, E.H.; Schauer, J.J.; Yi, S.-M.; Heo, J. Reactive oxygen species (ROS) activity of ambient fine particles (PM2.5) measured in Seoul, Korea. Environ. Int. 2018, 117, 276–283. [Google Scholar] [CrossRef]
- Grigoratos, T.; Martini, G. Brake wear particle emissions: A review. Environ. Sci. Pollut. Res. 2015, 22, 2491–2504. [Google Scholar] [CrossRef]
- Lyu, Y.; Guo, H.; Cheng, T.; Li, X. Particle size distributions of oxidative potential of lung-deposited particles: Assessing contributions from quinones and water-soluble metals. Environ. Sci. Technol. 2018, 52, 6592–6600. [Google Scholar] [CrossRef]
- Shuster-Meiseles, T.; Shafer, M.M.; Heo, J.; Pardo, M.; Antkiewicz, D.S.; Schauer, J.J.; Rudich, A.; Rudich, Y. ROS-generating/ARE-activating capacity of metals in roadway particulate matter deposited in urban environment. Environ. Res. 2016, 146, 252–262. [Google Scholar] [CrossRef]
- Diapouli, E.; Manousakas, M.I.; Vratolis, S.; Vasilatou, V.; Pateraki, S.; Bairachtari, K.A.; Querol, X.; Amato, F.; Alastuey, A.; Karanasiou, A.A.; et al. AIRUSE-LIFE +: Estimation of natural source contributions to urban ambient air PM10 and PM2. 5 concentrations in southern Europe—Implications to compliance with limit values. Atmos. Chem. Phys. 2017, 17, 3673–3685. [Google Scholar] [CrossRef]
- Taghvae, S.; Sowlat, M.H.; Diapouli, E.; Manousakas, M.I.; Vasilatou, V.; Eleftheriadis, K.; Sioutas, C. Source apportionment of the oxidative potential of fine ambient particulate matter (PM2.5) in Athens, Greece. Sci. Total Environ. 2019, 653, 1407–1416. [Google Scholar] [CrossRef] [PubMed]
- Charrier, J.C.; Anastasio, C. On dithiothreitol (DTT) as a measure of oxidative potential for ambient particles: Evidence for the importance of soluble transition metals. Atmos. Chem. Phys. 2012, 20, 9321–9333. [Google Scholar] [CrossRef]
- Samara, C. On the redox activity of urban aerosol particles: Implications for size distribution and relationships with organic aerosol components. Atmosphere 2017, 8, 205. [Google Scholar] [CrossRef]
- Bae, M.; Schauer, J.J.; Lee, T.; Jeong, J.; Kim, Y.; Ro, C.; Song, S.; Shon, Z. Relationship between reactive oxygen species and water-soluble organic compounds: Time-resolved benzene carboxylic acids measurement in the coastal area during the KORUS-AQ campaign. Environ. Pollut. 2017, 231, 1–12. [Google Scholar] [CrossRef]
- Decesari, S.; Sowlat, M.H.; Hasheminassab, S.; Sandrini, S.; Gilardoni, S.; Facchini, M.C.; Fuzzi, S.; Sioutas, C. Enhanced toxicity of aerosol in fog conditions in the Po Valley, Italy. Atmos. Chem. Phys. Discuss. 2017, 17, 7721–7731. [Google Scholar] [CrossRef] [Green Version]
- Jiang, H.H.; Jang, M.; Sabo-Attwood, T.; Robinson, S.E. Oxidative potential of secondary organic aerosols produced from photooxidation of different hydrocarbons using outdoor chamber under ambient sunlight. Atmos. Environ. 2016, 131, 382–389. [Google Scholar] [CrossRef]
- Tuet, W.Y.; Chen, Y.; Xu, L.; Fok, S.; Gao, D.; Weber, R.J.; Ng, N.L. Chemical oxidative potential of secondary organic aerosol (SOA) generated from the photooxidation of biogenic and anthropogenic volatile organic compounds. Atmos. Chem. Phys. 2017, 17, 839–853. [Google Scholar] [CrossRef] [Green Version]
- Velali, E.; Papachristou, E.; Pantazaki, A.; Choli-Papadopoulou, T.; Planou, S.; Kouras, A.; Manoli, E.; Besis, A.; Voutsa, D.; Samara, C. Redox activity and in vitro bioactivity of the water-soluble fraction of urban particulate matter in relation to particle size and chemical composition. Environ. Pollut. 2016, 208, 774–786. [Google Scholar] [CrossRef]
- Perrone, M.R.; Becagli, S.; Gracia Orza, J.A.; Vecchi, R.; Dinoi, A.; Udisti, R.; Cabello, M. The impact of long-range-transport on PM1 and PM2.5 at a Central Mediterranean site. Atmos. Environ. 2013, 71, 176–186. [Google Scholar] [CrossRef]
- Pietrogrande, M.C.; Bacco, D.; Ferrari, S.; Ricciardelli, I.; Scotto, F.; Trentini, A.; Visentin, M. Characteristics and major sources of carbonaceous aerosols in PM2.5 in Emilia Romagna Region (Northern Italy) from four-year observations. Sci. Total Environ. 2016, 553, 172–183. [Google Scholar] [CrossRef] [PubMed]
Figure 1.
Location of the studied sites across the Italian peninsula. Symbols indicate different PM size fractions investigated in each site, i.e., black points: PM10; red points: PM2.5; blue points: Other PM size fractions.
Figure 1.
Location of the studied sites across the Italian peninsula. Symbols indicate different PM size fractions investigated in each site, i.e., black points: PM10; red points: PM2.5; blue points: Other PM size fractions.

Figure 2.
OPV responses of PM10 samples measured using the same dithiothreitol (DTT) and ascorbic acid (AA) assay protocols: Mean values of each sampling campaign, standard errors are indicated by the bars. Points: Mean PM10 mass concentration values of each sampling campaign (right y-axis): (a) OPDTTV values of PM10 samples collected at Lecce (two independent studies), Trentino, and Milan (total suspended particles); (b) OPAAV values of PM10 samples collected at Lecce and Trentino.

Figure 3.
OPV responses of PM2.5 samples measured using the same DTT and AA assay protocols: Mean values of each sampling campaign, standard errors are indicated by the bars. Points: Mean PM2.5 mass concentration values of each sampling campaign (right y-axis): (a) OPDTTV values of PM2.5 samples collected at Lecce (two independent studies), Rome, and Bologna; (b) OPAAV values of PM2.5 samples collected at Bologna (two independent studies) and Lecce.


Table 1.
Relevant information reported in the reviewed studies, grouped according to particulate matter (PM) dimensional fractions: Site location, period, and duration of PM samples collection, acellular assay used for oxidative potential (OP) measurement, analyzed species for chemical characterization. (TSP: total suspended particles, DTT: dithiothreitol, AA: ascorbic acid, GSH: glutathione, DCFH: 2′,7′-dichlorofluorescin, EC: elemental carbon, OC: organic carbon, WSOC: water soluble organic carbon, POC: primary organic carbon, SOC: secondary organic carbon, LW: low weight, TC: total carbon, WSTC: water soluble total carbon, PAH: polycyclic aromatic hydrocarbon, BC: black carbon.)
| PM Fraction | Ref. | Location | Sampling Period | Sampling Duration | OP Assay | Chemical Characterization |
|---|---|---|---|---|---|---|
| TSP | [28] | Milan | January, June, October 2013 | 24 h | DTT, DCFH | EC, OC, inorganic ions, metals, trace organic compounds |
| PM10 | [23] | Trento | April–May 2016 | 24 h | DTT, AA | WSTC, ions, metals, sugars |
| [34] | Lecce | December 2014–October 2015 | 24 h | DTT, AA | metals, ions, EC, OC, POC, LW carboxylic acids | |
| [29] | Milan | Winter 2009 | 24 h | DTT (cit-c) | OC, metals, quinones | |
| PM10 and PM2.5 | [24] | Lecce | December 2014–October 2015 | 24 h | DTT, AA | metals, ions, EC, OC, POC, LW carboxylic acids |
| [27] | Lecce | Fall/Winter 2013–2016 | 24 h | DTT | OC, EC, POC, SOC, TC | |
| [35] | Milan | December 2009–November 2010 | 24 h | DCFH | OC, EC, WSOC, ions, metals, levoglucosan, PAHs, hopanes, alkanes | |
| PM2.5 | [18] | Bologna | February–July 2013 | 24 h | DTT, AA | metals, EC, OC |
| [30] | Bologna | mar 2018 | 24 h | AA | metals, EC, OC | |
| [20] | Rome | January 2010–January 2011 | 24h | DTT | OC, EC, PAH, hopanes | |
| [21] | Rome | January–February 2017 | 24 h | DCFH | OC, EC, BC, WSOC, water soluble BrC, metals, levoglucosan, PAH | |
| [19] | Turin | February 2010–January 2011 | 24 h | AA, GSH | metals, NO2 | |
| [17,32] | Milan, Florence | Summer/Winter 2012–2013 | 24 h | AA, GSH | OC, EC, ions, metals | |
| [31] | Turin, Pavia | June–December 2000 | 24 h | AA, GSH | metals | |
| PM3–PM3–7–PM7 | [16] | Milan | April–July 20 | 3–4 days | DTT, DCFH | metals, ions |
| 9 PM fractions 0.18–18 μm | [25] | Ferrara, Rome | February–March 2017 | 24 h | DTT, AA, DCFH | ions, metals |
| 50 µm dust | [26,33] | specific sources | - | - | DTT, AA, DCFH | OC, EC, WSOC, ions, metals |
Table 2.
Association among the measured OP and chemical composition reported in the reviewed studies, grouped according with PM dimensional fractions: Site location of PM samples collection, correlation analysis used for association at p level, acellular assay used for OP measurement, chemical species showing significant correlation to OP.
| PM Fraction | Ref. | Correlation | Assay | Chemical Species | |
|---|---|---|---|---|---|
| TSP | [28] | Milan | Spearman p < 0.01 | DTT | Solar Radiation |
| DCFH | TSP mass, OC, TC, SO42−, NO3−, NH4+, Ca, Mn, Co, Zn, As | ||||
| PM10 | [23] | Trento | Pearson p < 0.01 | DTT | SO42−, NH4+, NO3−, Cl−, Ca, Mg, K, Mn, Cu, Rb, and Zn, Fe, Ni, Pb, Sr, V, WSOC, sugars, levoglucosan |
| AA | SO42−, NH4+, NO3−, Cl−, Ca, Mg, K, Mn, Cu, Rb and Zn, Fe, Ni, Pb, Sr, V, WSOC, sugars | ||||
| [34] | Lecce | Pearson p < 0.01 | DTT | AW: K+, Ca2+, Ba, Cd, Ce, Cr, Cu, Fe, Mn, OC, EC, POC | |
| SS: NO3−, NH4+, Cu, OC, EC, POC, LW carboxylic acids | |||||
| AA | AW: K+, Ca2+, Ba, Ce, Cr, Cu, Fe, Mn, OC, EC, POC | ||||
| SS: NH4+, nss-K+, nss-Mg2+, nss-Ca2+, nss-SO42−, Cu, Mn, P, Pb, LW carboxylic acids | |||||
| PM10 and PM2.5 | [24] | Lecce | Pearson p < 0.01 | DTT | AW: K+, NO3−, Ba, Cd, Cu, Fe, Mn, P, V, OC, EC, carboxylic acids |
| SS: NO3−, SO42−, OC, EC, TC, POC | |||||
| AA | AW: NO3−, Ba, Cd, Cu, Fe, Mn, P, V, OC, EC | ||||
| SS: NO3−, SO42−, OC, EC, TC, POC | |||||
| PM2.5 | [27] | Lecce | Pearson p < 0.05 | DTT | OC, EC |
| [35] | Milan | Spearman p < 0.05 | DCFH | Ni, Cr, Cu, OC | |
| [18] | Bologna | Pearson p < 0.01 | DTT | Mn, Fe, Cu, Cr, Zn, OC, EC | |
| AA | Mn, Cu, OC, EC | ||||
| [30] | Bologna | Pearson p < 0.01 | AA | Mn, Fe, Cu, Cr, Zn, OC, EC | |
| [20] | Rome | linear regression | DTT | OC, EC Levoglucosan, ∑PAHs | |
| [21] | Rome | linear regression | DCFH | equivalent Black Carbon, ∑PAHs | |
| [19] | Turin | Pearson p < 0.05 | AA | PM2.5 mass, NO2, Cu, Fe | |
| GSH | NO2, Cu, Fe | ||||
| [17] | Milan, Florence | Spearman p < 0.01 | AA | Indoor: Cu, Mo, OC | |
| Outdoor: Fe, Cu, Cr, Ni, Cd, Sn, Sb, K+ | |||||
| GSH | Indoor: Cu, Mo, OC | ||||
| Outdoor: Cu, Sn, OC | |||||
| [31] | Turin, Pavia | Pearson | AA | Fe, Cu, Zn | |
| GSH | Cu, Al | ||||
| PM3, PM3–7, PM7 | [16] | Milan | Spearman r > 0.70 | DTT | <3 µm: - |
| 3–7 µm: Fe, Sn, Cu, Sb, Ba | |||||
| >7 µm: As, Al, Ti, Sr, Li |
AW: Autumn–winter: December to March data; SS: Spring–summer: April to October data.
© 2019 by the authors. Licensee MDPI, Basel, Switzerland. This article is an open access article distributed under the terms and conditions of the Creative Commons Attribution (CC BY) license (http://creativecommons.org/licenses/by/4.0/).
Share and Cite
MDPI and ACS Style
Pietrogrande, M.C.; Russo, M.; Zagatti, E. Review of PM Oxidative Potential Measured with Acellular Assays in Urban and Rural Sites across Italy. Atmosphere 2019, 10, 626. https://0-doi-org.brum.beds.ac.uk/10.3390/atmos10100626
AMA Style
Pietrogrande MC, Russo M, Zagatti E. Review of PM Oxidative Potential Measured with Acellular Assays in Urban and Rural Sites across Italy. Atmosphere. 2019; 10(10):626. https://0-doi-org.brum.beds.ac.uk/10.3390/atmos10100626
Chicago/Turabian StylePietrogrande, Maria Chiara, Mara Russo, and Elisa Zagatti. 2019. "Review of PM Oxidative Potential Measured with Acellular Assays in Urban and Rural Sites across Italy" Atmosphere 10, no. 10: 626. https://0-doi-org.brum.beds.ac.uk/10.3390/atmos10100626
Note that from the first issue of 2016, this journal uses article numbers instead of page numbers. See further details here.