Article

A New Geochemical Method for Determining the Sources of Atmospheric Particles: A Case Study from Gannan, Northeast China

1
State Key Laboratory of Environmental Geochemistry, Institute of Geochemistry, Chinese Academy of Sciences, Guiyang 550081, China
2
University of Chinese Academy of Sciences, Beijing 100049, China
3
Heilongjiang Institute of Geological Survey, Harbin 150036, China
*
Authors to whom correspondence should be addressed.
Submission received: 24 September 2019 / Revised: 12 October 2019 / Accepted: 16 October 2019 / Published: 20 October 2019
(This article belongs to the Special Issue Emissions, Transport and Fate of Pollutants in the Atmosphere)

Abstract

:
The geochemical characteristics of atmospheric deposition can help trace the origin and assess the impacts of pollutants. Northeast China has always been a region seriously affected by sandstorms. This study aims to explain the potential source of sandstorms in Gannan County, Heilongjiang Provence, by collecting dust and analyzing geochemistry in one year where there is no significant industrial or anthropogenic pollution. Input fluxes of deposition show that Zn and Mn were more prevalent (36.7 g·hm−2·a−1 and 77.93 g·hm−2·a−1, respectively) than other elements. The geochemical composition of atmospheric deposition samples from 17 collection points in Gannan County were determined with regard to 20 elements including nine heavy metals, two metalloids, three nonmetallic elements, a transition metal, and five other major elements. The discriminate function (DF) and chemical index of alteration (CIA) indices indicate that Gannan County (agricultural production area) and Harbin (densely inhabited district) have similar geochemical characteristics of dry deposition. The integration of Na/Al and Ca/Mg ratios with an air mass back-trajectories model shows effects from Russian dust sources (36.6%) and from the northwest desert of China (13.3%). The results will assist in developing strategies for reducing dry deposition pollution inputs to agricultural soils in the area and will effectively target policies to protect soils from long-term contaminant accumulation.

1. Introduction

Arid and semiarid regions, which make up a third of the Earth’s landmass, are major sources of dust particles which are produced by the disintegration of aggregates following creeping and saltation of larger soil particles [1,2]. The increase in the number of sandstorms is due to the intensification of desertification, which in turn is encouraged by sandstorm events exacerbating drought conditions in semiarid areas. The dust is mainly composed of iron oxide minerals (such as hematite and goethite), carbonate minerals (such as calcite and dolomite), and quartz and clay minerals (such as kaolinite, illite, and montmorillonite) [3,4,5]. A broad variety of chemical species, both organic and inorganic, have been discovered in atmospheric deposition [6]. Trace metals, which originate from different anthropogenic and natural sources [7], are constantly released into the air and constitute the major components of dry deposition particles which impact adversely on the ecological environment [8] and in turn increase the risk to human health [9]. Natural sources such as weathered materials, soils, and crustal minerals, and man-made sources such as vehicle emissions [10,11,12], residential fossil-fuel burning, non-ferrous metal processing, industrial emissions, and construction operations [6,13,14,15] have made major contributions to the concentrations of some elements in atmospheric dust [16,17].
Dust can influence radiation of light, global biogeochemical cycles, environmental pollution, and human health risks, and can also stimulate primary productivity [18,19]. Therefore, exploring deposition sources is an important research field to identify and control air pollution. Crucial factors determining the deposition rate include the chemical characteristics of the depositional environment, types and distance of emission sources, and some meteorological conditions [20,21]. In particular, information regarding the spatiotemporal variability of the dust rate provides a powerful framework for evaluating deposition characteristics in a given location [19,21,22].
Dust transmission plays an important role in Earth’s systems [1,2,3,4,5,6]. Aeolian sand is a major driving force in the climate system through its influence on light scattering/absorption, cloud properties and the ice and snow albedo [23,24,25,26,27]. East Asian deserts are the second largest source of dust [19,28]. The Taklimakan desert and the deserts of Inner Mongolia (such as Badain Jaran and Tengger) are the dominant dust sources for both the subarctic Northwestern Pacific, Greenland and even North America [25,29] Although system model research studies of dry deposition have been conducted [1,2,11,25,30,31,32,33,34], most of the investigations have been limited by the multiple solutions of the algorithms, which analyze the source information based on the pollution transmission of meteorological conditions or lack information on the geological compositions of particles, which could provide accurate source information [35,36,37,38]. In addition, research on the isotopes of dry deposition particles has revealed significant new information. For example, due to the unstable environmental conditions experienced by atmospheric particles during long-distance transmission, it is unknown whether the isotopic characteristic signals of atmospheric particles fluctuate or differ [35]. The primary and trace elements of minerals in atmospheric particulates experience less fluctuation than isotopes and rare earth elements (REEs) as a whole during their transmission in a relatively closed condition. Geochemical information of dry deposition with specifically quantitative source estimation has rarely been used in previous studies [39,40,41,42].
Detailed investigations of dry deposition in remote rural areas of China are not available in the literature; most Chinese investigations have concentrated on metropolis or urban areas. In this study, measurements of geochemical composition were conducted semi-quantitatively and traced the sources of dry deposition in the remote areas of Northeast China areas by pioneering geochemical methods combined with back-trajectory calculation analysis. This not only has important ecological and environmental significance for ascertaining the scale and source of the dry deposition at the Songnen Plain of the Northeast China, but also provides a scientific basis for regional sand control work. Moreover, the application of discriminating geochemical ratios combined with the tracer method provides a novel path for the study of dry deposition.

2. Experiments

2.1. Study Area and Sample Collection

Gannan County (Figure 1) is an important agricultural area located in Northwest Songnen Plain in the eastern part of the Greater Hinggan Mountains, Heilongjiang Province, Northeastern China (47°40′–48°00′, 123°15′–124°00′). The study area primarily encompasses Yinhe Town and Shuanhe Town, with an area of 600 km2. The climate in Songnen Plain is a semiarid continental climate where the annual mean temperature varies greatly and sandstorms are infrequent. The monthly mean temperatures range from 22.4 °C in July to −18.4 °C in January with a mean annual temperature of 3.5 °C. The rainy season occurs during the summer and accounts for approximately 60% of the mean annual rainfall (462 mm). Rice and corn are regarded as staple crops in this area where agricultural space dry farming has become the main method, and irrigation is used as an auxiliary method.
Unlike wet deposition [33], there is no common technique for collecting dry deposition accurately [33]. Although some researchers have pursued more suitable sampling techniques [43,44], no method has yet been established as a standard because both the collector geometry and the characteristics of the collection container have a strong impact on the results.
In order to estimate the processes influencing long-term dry deposition changes in the study area, atmospheric dry deposition samples were collected from 17 sampling points from Gannan County agricultural land for one year (2013). Our approach followed a systematic geochemical sampling strategy previously determined by the China Geological Survey (CGS), which allowed meaningful comparisons between our results and those of other studies in China, reflecting the dry deposition situation of Songnen Plain by studying the representative agricultural background.
The atmospheric deposition input flux can be calculated using each element’s sampling data and the area of the sampling cylinder as follows:
T = M/S = CM′/S,
where T is the input flux of the element, M is the mass of the element taken at the sample point, C is the element concentration, M’ is the total mass of the sampling point, and S refers to the cylinder head area used for atmospheric deposition collection (434 cm2 in this study).

2.2. Measurement Technique

We collected atmospheric dry deposition using a ceramic cylinder with a diameter of 15 cm and a height of 30 cm, which was positioned 5–8 m above the ground. The cylinder was soaked with 10% HCl (hydrochloric acid) for 24 h, then rinsed with Milli-Q before adding the appropriate amount of water and 20% ethylene glycol into the bottom of the cylinder. A 2-mm nylon mesh was used to cover the cylinder to prevent impurities from entering before sampling began. In addition, we set up the cylinders in 25 m × 25 m sample plots that were not occluded by trees or buildings, at sites located far from potential contamination sources (e.g., industrial sites, domestic waste, busy roads, or houses).
Curing in the collected deposition samples was accomplished by air drying at room temperature (20–25 °C), after which leaves, stones, and other impurities were removed with stainless steel forceps. Subsequently, the samples were sieved through a 63-μm Sartorius membrane filter before analysis. The total concentrations of Se (selenium), Co (cobalt), Cr (chromium), Cd (cadmium), Cu (copper), Pb (lead), Zn (zinc), Mn (manganese), Mo (molybdenum), and Ni (nickel) were determined by inductively coupled plasma mass spectrometry (ICP-MS, ELAN DRC, PerkinElmer Inc). Over a 24-h period, 50.0 mg of the sample was digested by using 1 mL HF (38%) and 1 mL HNO3 (40%) in high pressure Parr® digestion vessels at 190 °C. Insoluble residues were heated by adding 6 mL HNO3 (40%) at 140 °C for 5 h. During cooling down, 400 μL of the digest was transferred to a centrifuge tube. When analyzing trace elements in a sample, 50 ng rhodium was added as an internal standard to correct for matrix effects and instrumental drift in a liquid solution. Subsequently, Milli-Q was added to a final volume 10 mL. All the reagents were trace-metal grade. Concentrations were measured by atomic fluorescence spectrometry (AFS and AFS-230E) for As (arsenic) and Hg (mercury) and the major compounds (Al2O3, MgO, K2O, Na2O TiO2, MgO, F, N, and CaO) in deposition samples were analyzed by inductively coupled plasma optical emissions spectrometry (ICP-OES, Thermo Fisher Scientific).
For quality control (QC) and quality assurance (QA), blank control, duplicate samples, standard reference materials (GBW-07401, GBW070043; Center for Certified Reference Materials, China) were used to ascertain the precision and accuracy of the method. The sample detection limit for Hg and As was 0.001 μg/g and that for Cd, Cr, Mn, Ni, Pb, As, Cu, Zn, and As was 0.01 μg/g. The results measured for the soil standard reference were within acceptable uncertainty ranges of the certified values. The relative standard deviations (RSD) for sample properties of duplicates were <6% and standard substance recovery rates ranged from 92–107%. Blank samples were used throughout all of the experiments as well.

2.3. Uncertainties of Measurement Technique

No current methods can completely avoid the uncertainty and problems inherent in dry deposition sampling [33]. The cylinder method has been questioned as the high container walls may decrease the collection of some particles due to gravity, although some studies have shown that wall height has little effect [33]. In addition, adsorption on the inner wall may also have a minor influence under the humid or dewy conditions frequently found in containers [33]. In our study, the collector height and baseline dry conditions in Gannan County meant that we considered particle adsorption on the inner wall to be insignificant.
Surface retention may be crucial to consistent sample collection [33]. During the sampling process, liquid is kept at the bottom of the container to maximize the integrity of the dry deposition sample, avoiding differences in particle collection. Over a relatively long sampling period, some problems can arise regarding the volatilization of active substances [44], however this is not relevant for trace metals.
Although the dry deposition samples collected by this approach cannot accurately reflect the actual dust fall process, this investigation increases our understanding of dust fall in agricultural areas of Northeastern China. More importantly, direct measurements are essential for estimating dry deposition fluxes and element composition. While these most likely underestimate dry-deposited particles for the reasons discussed above, such samples are acceptably close to real conditions. This simple method has the potential to be a conventional method for obtaining information on the temporal and geographic distribution of dry deposition.

2.4. Enrichment Factors of Elements of Dry Deposition

The enrichment factor (EF) method can determine the natural or anthropogenic sources of elements by using the enrichment degree of elements in the atmospheric deposition samples, which is an important indicator for quantitative analysis of pollution levels [45,46]. Elements with low volatility and good chemical stability were generally selected as standard elements. Al [45,46,47,48,49], Fe [13,50], Sc [51] are frequently used reference elements. In our study, Al was chosen as the standardized element, and the EF was calculated as follows:
EF = (Ci/Al)samples/(Ci/Al)crust
where (Ci/Al)samples is the ratio of element i content to Al content in deposition samples and (Ci/Al)crust is the ratio of the elemental abundance to the Al abundance in the crust [52]. The elements in the earth’s crust were all assigned the abundance value of continental crustal elements using data from Rudnick et al. [52].

2.5. Discriminant Function Index

In previous studies, discriminant function (DF) was commonly used to estimate the degree of similarity between various sediments and their precursor [53,54,55]. Because Al is regarded to not produce secondary sedimentation in the air, it primarily originates from non-anthropogenic emissions [56]. Deserts in China are mainly concentrated in northwest. Recently, due to land desertification, sandy land of different degrees has also appeared in Northeast China, such as Hulun Buir Sandy Land and Horqin Sandy Land [39,57,58]. Many previous studies have suggested that the Loess Plateau in Northwest China is the main source area of dust for North China, even for the entire region of East Asia [39,40,44], although no firm evidence or strong explanation currently exists. Therefore, in order to make a direct comparison with previous studies on deserts in Northwest China, Lanzhou loess was chosen as the standard to confirm the correlation. Using Al as the reference element, the DF values of dry deposition in Beijing, Harbin, and the Gannan County area were calculated based on previous research data for comparison. The DF was calculated as follows:
DF = |(Cx1/CAl)/(CRef1/CAl-Ref2) − 1|
where (Cx1/CAl) is the ratio of elements in the dry deposition at the sampling sites to be determined, and (CRef1/CAl-Ref2) is the element ratio of the Lanzhou loess, which is regarded as one of the earliest reference standards of dust in China [59]. In general, DF values < 0.5 suggest that the dry deposition at the sampling site is similar to that of the reference standard.

2.6. Chemical Index of Alteration (CIA)

The degree of source-area weathering can be quantified by various indicators of weathering that have been proposed based on abundances of mobile and immobile element oxides (e.g., Na2O, CaO, K2O and Al2O3). The degree of weathering in the provenance area can be evaluated by various methods, several of which are based on the migration of major oxides such as Na2O, CaO, K2O, and Al2O3. Among the well-known indicators of weathering, the chemical index of alteration (CIA) method is quite common [60]:
CIA = [Al2O3/(Al2O3 + CaO* + Na2O + K2O)]∗100
where all major oxides are expressed as molar proportions (concentrations) and CaO* is the CaO content incorporated in silicate minerals (e.g., dolomite and apatite) [61,62,63]. Xie et al. (2017) assume that CaO* represents the molar fraction of the remaining CaO after eliminating CaO from apatite; that is, CaOR = mol CaO − (10/3 × mol P2O5). If CaOR ≤ Na2O, then the value of CaOR is accepted as CaO*; that is, CaOR = CaO*. If, however, CaOR > Na2O, then CaO* = Na2O, which was applied to estimate the content of CaO in the silicate fractions [61,64].

2.7. Backward Trajectories of Air Mass and Identification of Potential Source Regions

In order to determine the transportation of dry deposition or dust in the Gannan County area, we utilized data from the Global Data Assimilation System (GDAS) to calculate air mass back-trajectories with the HSYPLIT-4 model (as documented by the US National Oceanic and Atmospheric Administration and the Australian Bureau of Meteorology) [6,25]. This model usually estimates estimations of atmospheric advection and diffusion with the Lagrangian method [65], which has been used extensively in research on interregional pollution transportation and source tracing. Mineral dust in China is usually transported long distances in the lower troposphere [25], and particles in the source [6,65] area rise as far as 1500 m and are carried to the study region after one or two days [6]. The first day of each month was selected as representative, then back-trajectory calculations were performed at heights of 10, 500, and 1000 m and combined with regional background values that represented the air trajectories at the underlying surface, middle and high altitudes, respectively [40].

3. Results and Discussion

3.1. Geochemical Characteristic of Trace Metals

Table 1 summarizes the measured content of As, Cd, Cu, Cr, Hg, Ni, Pb, Zn, Co, Se, F, and Mn in atmospheric dry deposition the study area along with descriptive statistics and comparable results from other studies. Previous comparative analyses of atmospheric dry deposition indicated the transport process of elements in such deposition and enrichment with trace metals such as Cd, Cu, Hg, Pb, Zn, F, and Mn at concentrations 1.2–10 times higher than soil background concentration levels [66]. This difference was particularly true in regard to Cd, Zn, and Pb, for which the mean levels in atmospheric deposition were 0.82, 200.8, and 0.07 mg/kg, respectively. With the exception of Se, the mean concentration values of trace elements in this study were lower than reported for other cities in China [67,68,69,70,71,72]. This geographic variation in trace element concentrations in atmospheric deposition could be partially attributed to this study’s rural, rather than urban, setting. The maximum, minimum, and average values of the EFs of each element are listed in Table 2, in which the K value is the ratio of the concentration of the surface soil elements in the Gannan County region to the concentration of continental crust elements.
An EF value between 0.5 and 2 is generally considered to indicate a natural source while an EF of greater than 2 indicates that the enrichment of elements is mainly influenced by anthropogenic activity [48,67]. As shown in Table 2, the heavy metal elements Cd, Hg, Pb, As, and Zn are abundant in atmospheric deposition in Gannan County, and the mean EF values of Cd, Zn, Pb, Se, Hg, and As were all >2.
The Gannan County area is dominated by agricultural land, and there is no centralized large-scale industrial region. However, the EF results indicate that the area may be contaminated by heavy metals, although many EF values are close to 1. These results are similar to those in the same period from Harbin, the capital city of Heilongjiang province, suggesting that the deposition source is close to the continental crust. The elements can be divided into three categories: (1) S, Ni, and Co are regional loss elements with an EF lower than 1; this could be due to differentiation during the atmospheric particulates’ migration–sedimentation process; (2) Mg, Cr, Na, K, and Ca with EF values of approximately 1, which we attribute to the impact of wind upon surface soil; (3) As, Hg, Se, Pb, Zn, and Cd with EF values of 2.39, 2.56, 4.03, 4.67, and 14.67, respectively. These elements were mainly sourced from industrial or coal-fired pollution sources [56,72,73,74].

3.2. Atmospheric Dry Deposition Input Flux

As shown in Table 3, the Mn deposition flux is higher than the mean deposition flux of the other elements. The fluxes for Zn and Mn are 36.37 g·hm−2·a−1 and 77.93 g·hm−2·a−1, respectively, and are significantly higher than the values Cd, Hg, Cr, Ni, Pb, As, and Cu. The lowest annual deposition flux is Hg with a mean of 0.13 g·hm−2·a−1, lower than the mean of 1.46 g·hm−2·a−1 for Cd.
In comparison with the Beijing Plain, the Chengdu Economic Area, and the Southern Hebei Plain (Table 3), the annual deposition of heavy metal element fluxes in our study area is relatively low, indicating that Gannan County’s atmospheric heavy metal pollution is low in comparison. Taking Lake Erie in the United States [75] as a comparison, only Cd and Cu had lower annual deposition fluxes, while Ni, Pb, Zn, and Cr had greater annual deposition fluxes than in this study area, again showing that atmospheric heavy metal pollution in the Gannan County area was relatively low.

3.3. Source Identification

3.3.1. Discriminant Function Index to Trace the Source of Atmospheric Deposition

As shown in Figure 2, the distribution trend of dry deposition in the Beijing DF index is similar to that of Lanzhou loess, and only Zn has a higher value, which may result from pollution associated with surrounding industrial sources. The DF values for Harbin and Gannan County are similar in overall trend, though generally higher than for Beijing and significantly different from Lanzhou loess. The results suggest that the sources of aeolian sand and dry deposition in Gannan County, Harbin, and Beijing are different, although the DF characteristics are similar for a large number of elements.
The CIA index values of deposition samples in the Gannan County area (52.57–67.67) indicate that the particle of dry deposition in Gannan has undergone primary weathering and the main components of settlement are well preserved, including that the provenance area was strongly linearized by Al2O3 and TiO2 (R2 = 0.7955). The Al2O3/TiO2 ratio in deposition samples varies greatly among different types of provenances, and physical transport without significant chemical weathering will produce highly inconsistent Al2O3/TiO2 ratio values, which is applied to quantifying particle weathering. The ratios indicate that the dry deposition source areas in the Gannan County region may suffer from low chemical weathering and be relatively nearby. A study by Xie et al. [58] examined dry deposition in the Harbin area and found that the CIA index of dry deposition in the Harbin area and the Al2O3/TiO2 ratio were relatively similar (CIA = 67.6 − 69.58; Al2O3/TiO2 = 17.99 − 18.32), indicating a similar weathering mechanism between dry deposition in the Gannan County area and the Harbin area. This also suggests that the geochemical characteristics of dry deposition in different areas of Songnen Plain are similar although there were distinct differences in the elemental composition, particularly for some heavy metals.

3.3.2. Provenance

Based on the above research status, a new method is proposed in this study. Firstly, the potential source is determined by geochemical method and then the contribution of each source is determined by multi-end mixed calculation and an air mass back-trajectories calculation model [29,30,31]. This method not only reduces the complexity of sample test and analysis, but also provides a novel approach for the research of sand and dust migration. We adopted a newly revised tracking method to estimate the contribution of deposition from related external sources in the Gannan County area to the overall deposition. Previous studies have determined that the ideal tracer between in-situ and external sources should be stable in the inner and outer regions of the study area [30,31,32,33,34,35,64,81]. Moreover, the fingerprint spectrum should be relatively stable and discriminating during the migration process [82,83]. Combinations of Ca, Mg, Na, K, Al, and other elements have been used as tracer factors in previous studies [64].
Based on our data, we found that the relationship between Ca/Mg and Na/Al can be used to identify sediment sources. As shown in Figure 3, there is a strong correlation between the characteristics of the deposition in the study area and potential provenance, indicating that the external sources of deposition in the Gannan County area were influenced by sand dunes in surrounding areas such as the Horqin and Hulun Buir sandy lands [42]. Even the deserts in Northwest China had a certain influence on the Gannan County area. However, it is worth noting that the deposition in the Gannan County and Harbin city areas is somewhat similar to the data shown in Figure 3 and may be greatly affected by the surrounding sandy lands in Northeast China. Xie et al. [58] obtained consistent conclusions regarding the deposition source for the Harbin city area. Furthermore, recent research shows that dust deposition in Beijing is not necessary from the Gobi Desert region [68,84], which is similar to our conclusions. In addition, in comparison with deposition in the Harbin area, the Gannan County area is closer to the northwestern desert source area. Other important influences upon the reduction of deposition in the Gannan County area should be the subject of further research.
To further clarify the source of deposition in the Gannan County area, we carried out a comprehensive analysis of a large number of different types of surface soil samples from this the area (previously reported by Sun et al. [59]) and found that the Ca/Mg ratio in these deposition samples can be used as a suitable tracking factor in order to satisfy the source area fingerprint spectrum and maintain a stable migration transport process. However, considering that the source of depositional material in Northeastern China is relatively nearby, and that the Ca/Mg can be used to control the source while the Zn/Pb ratio can be used to indicate anthropogenic sources, both ratios were used to quantitatively calculate the deposition-reducing source area in the Gannan County area:
( C a M g ) Dust = X     ( C a M g ) Local + Y ( C a M g ) N + Z ( C a M g ) N W ,
( Z n P b ) Dust = X     ( Z n P b ) Local + Y ( Z n P b ) N + Z ( Z n P b ) N W ,
X + Y + Z = 100 % ,
where X, Y, and Z are the contribution rates of local, northern (N), and northwestern plus Gobi Desert (NW) sand, respectively, to deposition reduction in the Gannan County region. Because the Horqin and Hulun Buir sandy lands are the two main sources of deposition in Northeastern China, and their geochemical compositions are relatively similar, we took both as representatives of loess sources in Northeastern China to estimate the contribution rate of input sources from the Gannan County area.
After referring to data from Xie et al. [41] in regard to the Horqin and Hulun Buir sandy lands, we took the arithmetic means of the Ca/Mg and Zn/Pb ratios ((Ca/Mg)N = 1.76, (Zn/Pb)N = 3.22) as being representative of sand origin in the northern region, while that of the northern and Gobi deserts originated in the central desert of Inner Mongolia [80]. Therefore, the geochemical composition of deposition in the central Inner Mongolia desert represents the input deposition of the northwestern source ((Ca/Mg)NW = 3.23, (Zn/Pb)NW = 21.75). According to soil data from Gannan County during the same period [66], ( Ca Mg ) dust and ( Zn Pb ) dust were 2.6 and 4.83, respectively. The mean correlation contribution of deposition precipitation in the Gannan County region is X = 50.1%, Y = 36.6%, and Z = 13.3%.
These results show that with the exception of the adjacent northern sandy land, which contributes to deposition in the Gannan County region, the northwestern region impacts the long-distance transport of deposition in the agricultural region of Northern China. As the Gannan County region is mainly dominated by agriculture without direct large industrial sources, any industrial pollution may primarily be attributed to sources associated with cities in Qiqihar, similar to the industrial pollution source calculated by principal component analysis [66]. This indicates that pollution in the agricultural region of Northeast China can mainly be attributed to industrial pollution from surrounding cities. Besides, Xie et al. [42] showed that loess and paleosol in the Harbin city area originated from ancient river and lake sediments in the Songnen Plains rather than exogenous wind-transported sand and are different from the Horqin and Hulun Buir sandy lands.
According to a study of dry and wet deposition in the Harbin area [58], sediments in that area were similar to soils in the Loess Plateau of Northwestern China. Climatologically, the Heilongjiang region is mainly affected by high pressure associated with Inner Mongolia in the winter, while the Songnen Plains are mainly influenced by Hawaiian high circulation in the summer [66]. Furthermore, there is no direct evidence that strong winds from Siberia and the Russian Far East were influential. Therefore, further research is needed in regard to the transport mechanism for precipitation in North Eastern China (Figure 1).

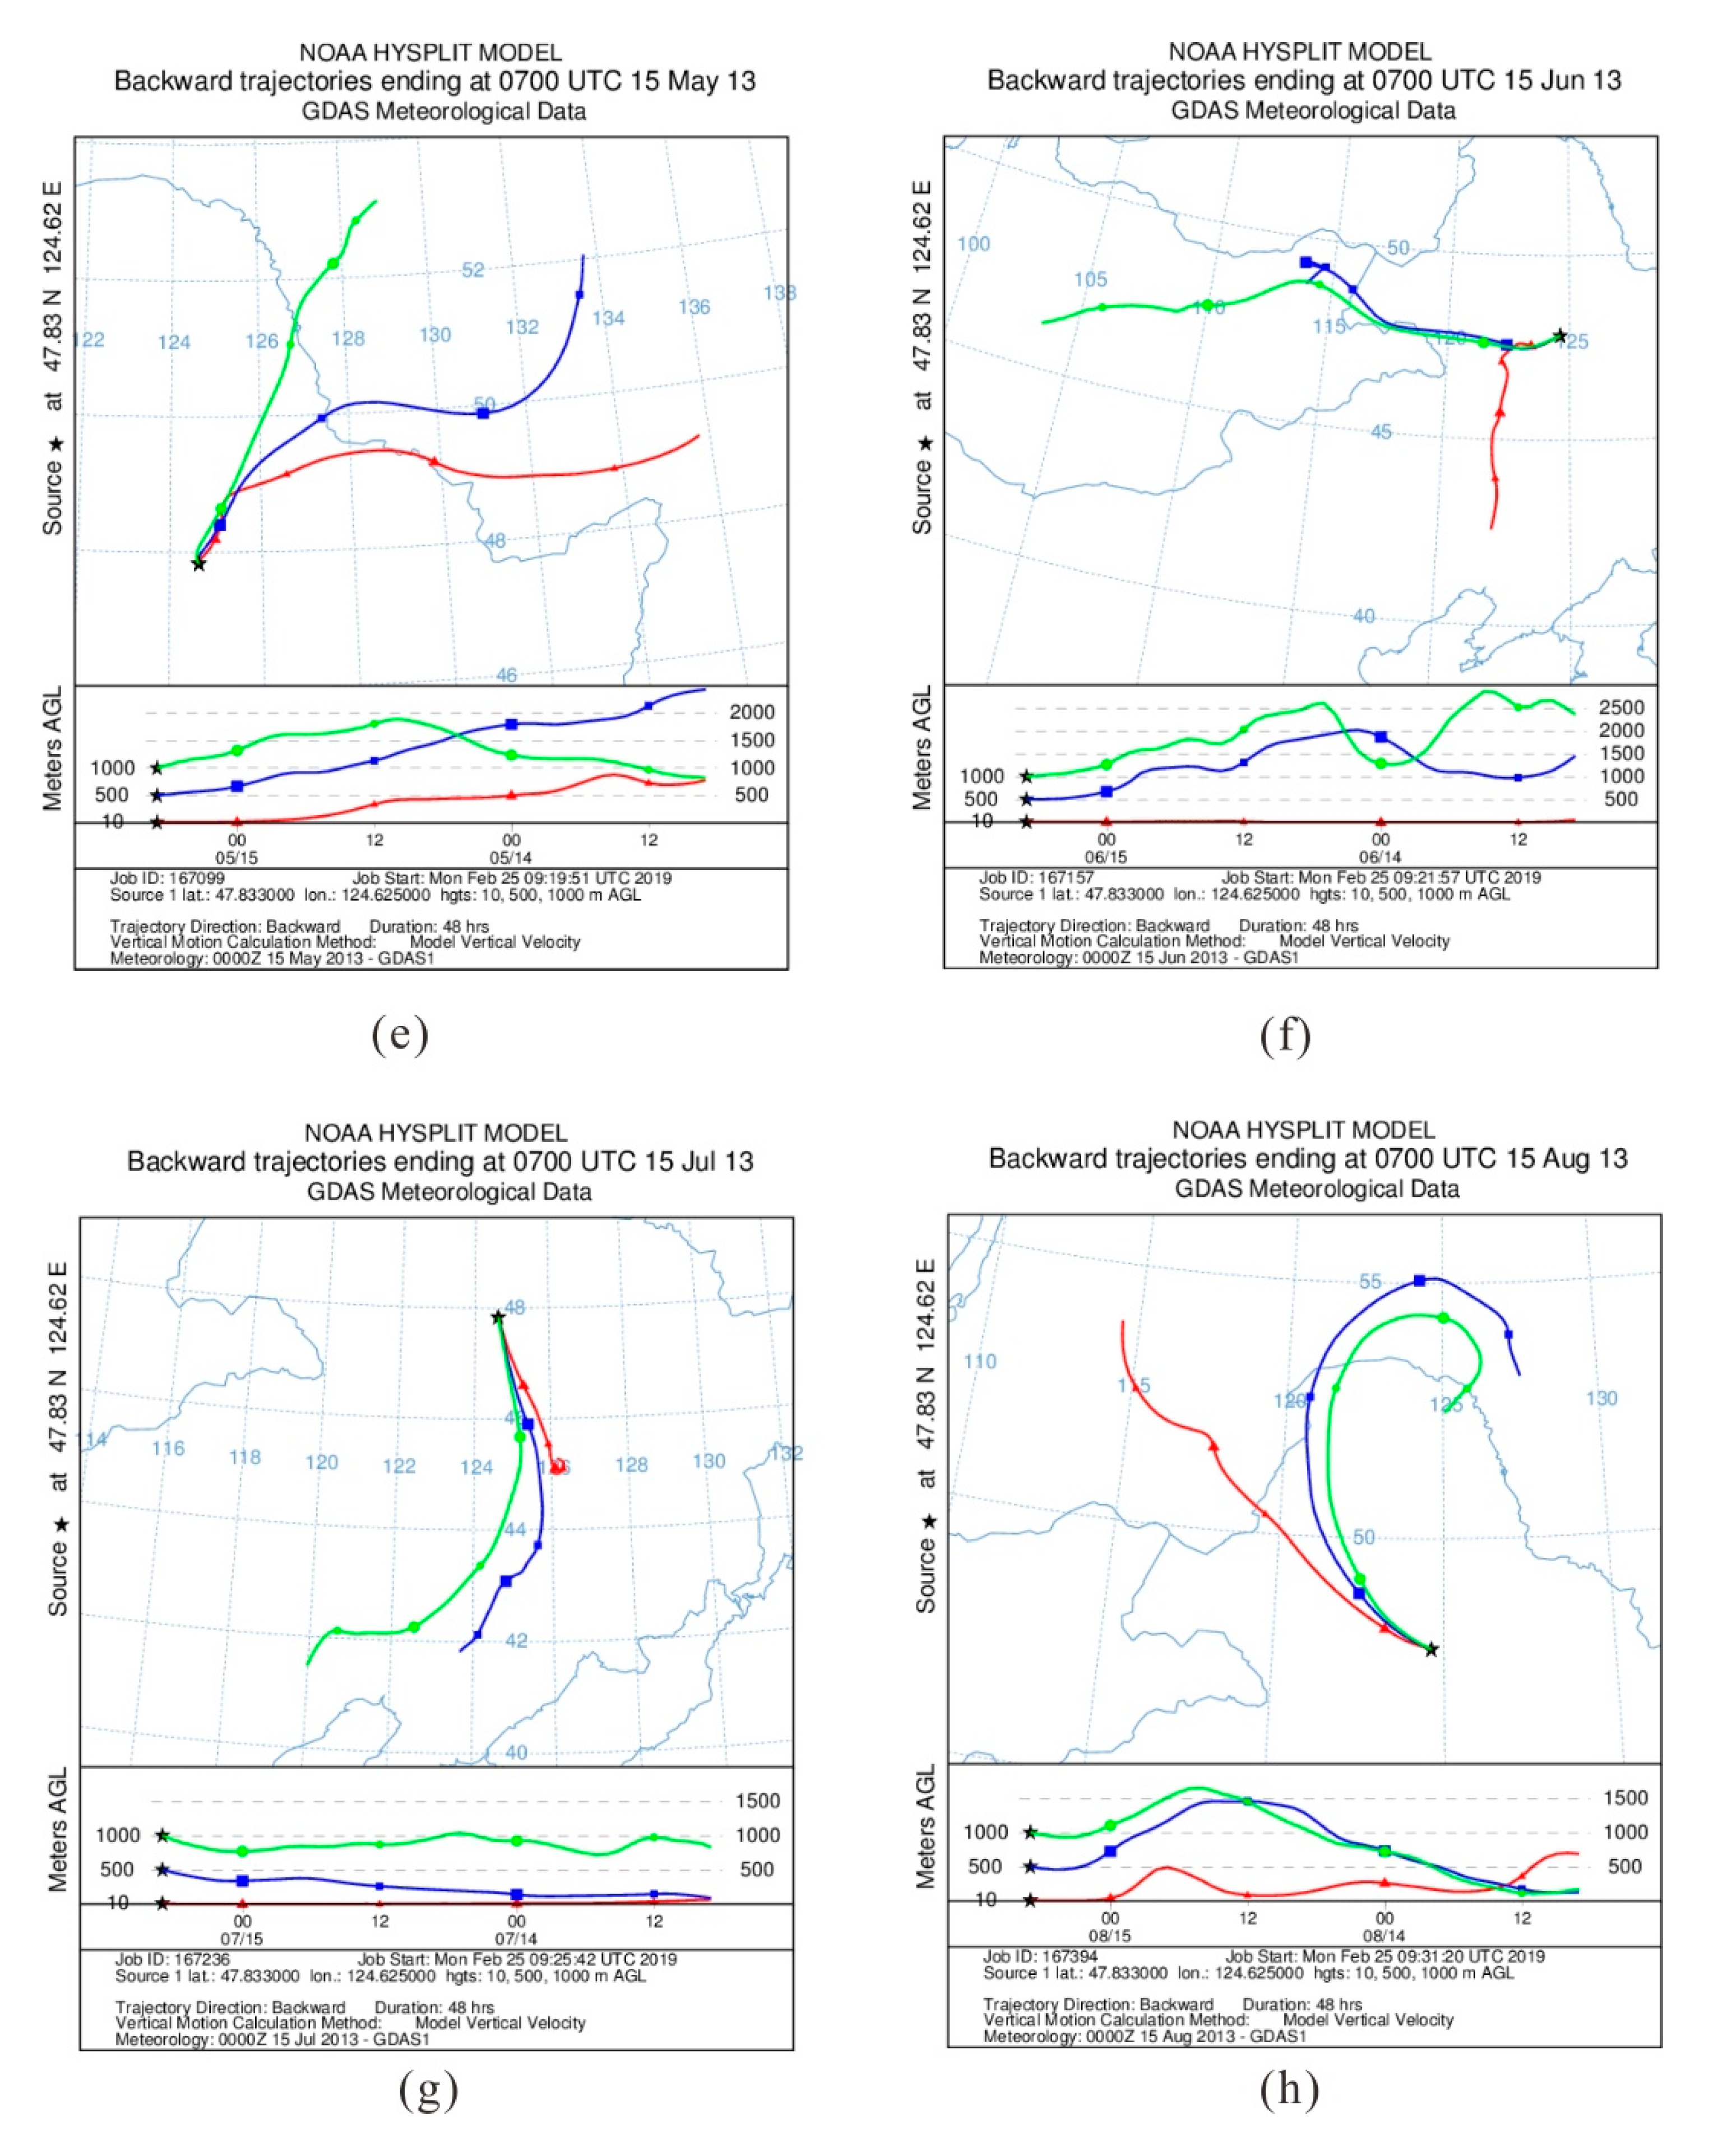
3.3.3. Particle Back-Trajectory Calculation Verification

Geochemical and Lagrangian back-trajectory analyses were used to evaluate the characteristics of trace elements in atmospheric dry deposition in the Gannan County area of Northeast China. According to the dry deposition flux, the degree of atmospheric pollution of Cd, Hg, Cr, Ni, Pb, As, Cu, Mn, and Zn was lower in the study area than in Beijing, Hebei, and the Chengdu Economic Zone [34,63,64]. However, the levels of Ni, Pb, Zn, and other elements were higher than in Northern France, Lake Erie, and other regions [73,74,75,76,77,78,79,80]. Additionally, the Gannan County is a low-density agricultural residential gathering point without direct large industrial sources, so industrial pollution may be primarily attributed to industrial sources in nearby cities. Further calculations using the EF method supported this conclusion.
The HSYPLIT-4 model analysis shows that dry deposition in this area mainly originated from Russia (Figure 4), which is consistent with the fact that the Gannan County area’s climate is mainly controlled by Siberian high pressure for most of the year. The results in winter and spring reveal that the source of dry deposition migrated from Southeastern Siberia or Southwestern Russian Far East to the Songnen Plain, again in agreement with regional weather patterns. However, the transmission path goes through the Hulun Buir Sandy Land, therefore the latter’s contribution to dry settlement in the Gannan County area can be approximately substituted for the contribution of Russian dust sources to this area. In addition, dry deposition in the Gannan County area appeared to come from the central desert of Inner Mongolia and the Horqin Sandy Land, verifying the above estimation results in summer. Generally, the model results support our analysis of the deposition source for the Gannan County area, though the dry deposition from Russian sources cannot be quantified due to a lack of data.

4. Conclusions

The application of a geochemical calculation method with the validation of an atmospheric radiative transfer model (Lagrangian back-trajectory) proved to be an innovative quantitative technique for source identification of dry deposition in this case study. Firstly, the characteristic ratios of Ca/Mg and Na/Al were adopted to robustly prove that the sources of atmospheric particles in the Gannan region are different from typical cities in North China. Then, by combining the Ca/Mg ratio representing natural sources with the Zn/Pb ratio representing anthropogenic sources, an innovative method for tracking atmospheric particulates was developed. The average contributions of deposition are 50.1% from local sources, 36.6% from northeastern sandy land and Russia, and 13.3% from the Chinese Northwest desert. Our results provide detailed information for the evaluation of local and long-distance transport contributions and the establishment of ecological protection measures. The contribution of Northwestern China to dry deposition in Gannan County is small compared with that from North China. This study reveals the effect of Asian dust on China’s northeastern agricultural region, calculated quantitatively for the first time. As Asian dust is known to be transported to the West Pacific, this new information provides a reference for assessing other regions affected by this process and for implementing regional sand control measures.

Author Contributions

Conceptualization, G.S. and L.S.; software, Y.C.; formal analysis, G.S.; investigation, W.Y. and G.S.; writing—original draft preparation, C.Y., C.Z. and G.S.; writing—review and editing, G.S. and L.S.; supervision, G.S.; funding acquisition, G.S.

Funding

This research was funded by National Natural Science Foundation of China, grant number 41773146 and by China Postdoctoral Science Foundation, grant number 2018M640939.

Conflicts of Interest

The authors declare no conflict of interest.

References

  1. Kok, J.F.; Mahowald, N.M.; Fratini, G.; Gillies, J.A.; Ishizuka, M.; Leys, J.F. An improved dust emission model—Part 1: Model description and comparison against measurements. Atmos. Chem. Phys. 2014, 14, 13023–13041. [Google Scholar] [CrossRef]
  2. Creamean, J.M.; Suski, K.J.; Rosenfeld, D.; Cazorla, A.; Prather, K.A. Dust and Biological Aerosols from the Sahara and Asia Influence Precipitation in the Western, U.S. Science 2013, 339, 203–205. [Google Scholar] [CrossRef] [PubMed]
  3. Lafon, S.; Sokolik, I.N.; Rajot, J.L.; Caquineau, S.; Gaudichet, A. Characterization of iron oxides in mineral dust aerosols: Implications for light absorption. J. Geophys. Res. 2006, 111, 21207. [Google Scholar] [CrossRef]
  4. Huang, W.; Duan, D.; Zhang, Y.; Cheng, H.; Ran, Y. Heavy metals in particulate and colloidal matter from atmospheric deposition of urban Guangzhou, South China. Mar. Pollut. Bull. 2014, 85, 720–726. [Google Scholar] [CrossRef] [PubMed]
  5. Twohy, C.H.; Kreidenweis, S.M.; Eidhammer, T.; Browell, E.V.; Heymsfield, A.J.; Bansemer, A.R. Saharan dust particles nucleate droplets in eastern Atlantic clouds. Geophys. Res. Lett. 2009, 36, L01807. [Google Scholar] [CrossRef]
  6. Qiang, L.; Yang, W.; Jingshuang, L.; Quanying, W.; Mingying, Z. Grain-size distribution and heavy metal contamination of road dusts in urban parks and squares in Changchun, China. Environ. Geochem. Health 2015, 37, 71–82. [Google Scholar] [CrossRef] [PubMed]
  7. Callen, M.S.; De la Cruz, M.T.; Lopez, J.M.; Navarro, M.V.; Mastral, A.M. Comparison of receptor models for source apportionment of the PM10 in Zaragoza (Spain). Chemosphere 2009, 76, 1120–1129. [Google Scholar] [CrossRef] [Green Version]
  8. Batjargal, T.; Otgonjargal, E.; Baek, K.; Yang, J.S. Assessment of metals contamination of soils in Ulaanbaatar, Mongolia. J. Hazard. Mater. 2010, 184, 872–876. [Google Scholar] [CrossRef]
  9. Xiang-Dong, L.; Ling, J. Air pollution: A global problem needs local fixes. Nature 2019, 570, 437–439. [Google Scholar]
  10. Zhang, C.; Qiao, Q.; Appel, E.; Huang, B. Discriminating sources of anthropogenic heavy metals in urban street dusts using magnetic and chemical methods. J. Geochem. Explor. 2012, 119–120, 60–75. [Google Scholar] [CrossRef]
  11. Charlesworth, S.; Everett, M.; McCarthy, R.; Ordonez, A.; De Miguel, E. A comparative study of heavy metal concentration and distribution in deposited street dusts in a large and a small urban area: Birmingham and Coventry, West Midlands, UK. Environ. Int. 2003, 29, 563–573. [Google Scholar] [CrossRef]
  12. Kreider, M.L.; Panko, J.M.; McAtee, B.L.; Sweet, L.I.; Finley, B.L. Physical and chemical characterization of tire-related particles: Comparison of particles generated using different methodologies. Sci. Total Environ. 2010, 408, 652–659. [Google Scholar] [CrossRef] [PubMed]
  13. Bilos, C.; Colombo, J.C.; Skorupka, C.N.; Rodriguez Presa, M.J. Sources, distribution and variability of airborne trace metals in La Plata City area, Argentina. Environ. Pollut. 2010, 111, 149–158. [Google Scholar] [CrossRef]
  14. Schleicher, N.J.; Norra, S.; Chai, F.; Chen, Y.; Wang, S.; Cen, K.; Yu, Y.; Stüben, D. Temporal variability of trace metal mobility of urban particulate matter from Beijing ― A contribution to health impact assessments of aerosols. Atmos. Environ. 2011, 45, 7248–7265. [Google Scholar] [CrossRef]
  15. Hofman, J.; Stokkaer, I.; Snauwaert, L.; Samson, R. Spatial distribution assessment of particulate matter in an urban street canyon using biomagnetic leaf monitoring of tree crown deposited particles. Environ. Pollut. 2014, 183, 123–132. [Google Scholar] [CrossRef]
  16. Shah, M.H.; Shaheen, N.; Jaffar, M.; Khalique, A.; Tariq, S.R.; Manzoor, S. Spatial variations in selected heavy metal contents and particle size distribution in an urban and rural atmosphere. J. Environ. Manag. 2006, 78, 128–137. [Google Scholar] [CrossRef]
  17. Shah, M.H.; Shaheen, N. Seasonal behaviors in elemental composition of atmospheric aerosols collected in Islamabad. Pak. Atmos. Res. 2010, 95, 210–223. [Google Scholar] [CrossRef]
  18. Lu, W.; Zhao, W.; Balsam, W.; Lu, H.; Liu, P.; Lu, Z.; Ji, J. Iron mineralogy and speciation in clay-sized fractions of chinese desert sediments. J. Geophys. Res. Atmos. 2017, 339, 1572–1578. [Google Scholar] [CrossRef]
  19. Norouzi, S.; Khademi, H.; Ayoubi, S.; Faz Cano, A.; Acosta, J.A. Seasonal and spatial variations in dust deposition rate and concentrations of dust-borne heavy metals, a case study from isfahan, central iran. Atmos. Pollut. Res. 2017, 8, 686–699. [Google Scholar] [CrossRef]
  20. Lawrence, C.R.; Neff, J.C. The contemporary physical and chemical flux of aeolian dust: A synthesis of direct measurements of dust deposition. Chem. Geol. 2009, 267, 46–63. [Google Scholar] [CrossRef]
  21. Goossens, D. Dry aeolian dust accumulation in rocky deserts: A medium-term field experiment based on short-term wind tunnel simulations. Earth Surf. Proc. Landf. 2000, 25, 41–57. [Google Scholar] [CrossRef]
  22. Motelay-Massei, A.; Ollivon, D.; Tiphagne, K.; Garban, B. Atmospheric bulk deposition of trace metals to the Seine river Basin, France: Concentrations, sources and evolution from 1988 to 2001 in Paris. Water Air Soil Pollut. 2005, 164, 119–135. [Google Scholar] [CrossRef]
  23. Tegen, I.; Fung, I. Modeling of mineral dust in the atmosphere: Sources, transport, and optical thickness. J. Geophys. Res. Atmos. 1994, 99, 22897–22914. [Google Scholar] [CrossRef]
  24. Kaufman, Y.J.; Tanré, D.; Boucher, O. A satellite view of aerosols in the climate system. Nature 2000, 419, 215–223. [Google Scholar] [CrossRef]
  25. Uno, I.; Eguchi, K.; Yumimoto, K.; Takemura, T.; Shimizu, A.; Uematsu, M.; Liu, Z.; Wang, Z. Asian dust transported one full circuit around the globe. Nature Geosci. 2009, 2, 557–560. [Google Scholar] [CrossRef]
  26. Bory, A.J.-M.; Biscaye, P.E.; Grousset, F.E. Two distinct seasonal Asian source regions for mineral dust deposited in Greenland (NorthGRIP). Geophys. Res. Lett. 2003, 30, 1167. [Google Scholar] [CrossRef]
  27. Painter, T.H.; Deems, J.S.; Belnap, J.; Hamlet, A.F.; Landry, C.C.; Udall, B. Response of Colorado River runoff to dust radiative forcing in snow. Proc. Natl. Acad. Sci. USA 2010, 107, 17125–17130. [Google Scholar] [CrossRef] [Green Version]
  28. Chin, M.; Chu, A.; Levy, R.; Remer, L.; Kaufman, Y.; Holben, B.; Eck, T.; Ginoux, P.; Gao, Q. Aerosol distribution in the Northern Hemisphere during ACE-Asia: Results from global model, satellite observations, and Sun photometer measurements. J. Geophys. Res. Atmos. 2004, 109. [Google Scholar] [CrossRef]
  29. Uno, I.; Hiroyasu, A.; Seita, E.; Kisei, K.; Ichiro, M.; Nobuo, S. Trans-Pacific yellow sand transport observed in April 1998: Anumerical simulation. J. Geophys. Res. 2001, 106, 18331–18344. [Google Scholar] [CrossRef]
  30. Takemura, T.; Uno, I.; Nakajima, T.; Higurashi, A.; Sano, J.I. Modeling study of long-range transport of Asian dust and anthropogenic aerosols from East Asia. Geophys. Res. Lett. 2002, 29, 2158. [Google Scholar] [CrossRef]
  31. Ginoux, P.; Chin, M.; Tegen, I.; Prospero, J.M.; Holben, B.; Dubovik, O.; Lin, S.J. Sources and distributions of dust aerosols simulated with the GOCART model. J. Geophys. Res. 2001, 106, 20255. [Google Scholar] [CrossRef]
  32. Lynam, M.M.; Dvonch, J.T.; Hall, N.L.; Morishita, M.; Barres, J.A. Spatial patterns in wet and dry deposition of atmospheric mercury and trace elements in central illinois, USA. Environ. Sci. Pollut. Res. 2013, 21, 4032–4043. [Google Scholar] [CrossRef] [PubMed]
  33. Pan, Y.P.; Wang, Y.S. Atmospheric wet and dry deposition of trace elements at ten sites in Northern China. Atmos. Chem. Phys. Discuss. 2015, 14, 951–972. [Google Scholar] [CrossRef]
  34. Zheng, X.; Guo, X.; Zhao, W.; Shu, T.; Xin, Y.; Yan, X.; Qiulin, X.; Fantao, C.; Ming, L. 2015. Spatial variation and provenance of atmospheric trace elemental deposition in beijing. Atmos. Pollut. Res. 2016, 7, 260–270. [Google Scholar] [CrossRef]
  35. Zhao, W.; Balsam, W.; Williams, E.; Long, X.; Ji, J. Sr-nd-hf isotopic fingerprinting of transatlantic dust derived from north africa. Earth Planet. Sci. Lett. 2018, 486, 23–31. [Google Scholar] [CrossRef]
  36. Shen, X.; Wan, S.; Christian, F.L.; Peter, D.C.; Ryuji, T.; Sidonie, R.; Xuefa, S.; Debo, Z.; Yanguang, L.; Xuebo, Y.; et al. History of Asian eolian input to the Sea of Japan since 15 Ma: Links to Tibetan uplift or global cooling? Earth Planet. Sci. Lett. 2017, 474, 296–308. [Google Scholar] [CrossRef]
  37. Williams, R.H.; Mcgee, D.; Kinsley, C.W.; Ridley, D.A.; Hu, S.; Fedorov, A. Glacial to Holocene changes in trans-Atlantic Saharan dust transport and dust-climate feedbacks. Sci. Adv. 2016, 2, e1600445. [Google Scholar] [CrossRef]
  38. Pabortsava, K.; Lampitt, R.S.; Benson, J.; Crowe, C.; Mclachlan, R.; Le Moigne, F.A.C. Carbon sequestration in the deep Atlantic enhanced by Saharan dust. Nat. Geosci. 2017, 10, 189–194. [Google Scholar] [CrossRef] [Green Version]
  39. Sun, J.; Liu, T.; Lei, Z. Sources of heavy dust fall in Beijing, China on April 16, 1998. Geophys. Res. Lett. 2000, 14, 2105–2108. [Google Scholar] [CrossRef]
  40. Chen, J.; Li, G.J. Geochemical studies on the source region of Asian dust. Sci. China Earth Sci. 2011, 54, 1279–1301. [Google Scholar] [CrossRef]
  41. Xie, Y.Y.; Meng, J.; Guo, L.F. REE geochemistry of modern eolian dust deposits in Harbin city, Heilongjiang province, China: Implications for provenance. Catena 2014, 123, 70–78. [Google Scholar] [CrossRef]
  42. Xie, Y.; Yuan, F.; Zhan, T.; Kang, C.; Chi, Y.; Ma, Y. Geochemistry of loess deposits in northeastern China: Constraint on provenance and implication for disappearance of the large Songliao palaeolake. J. Geol. Soc. 2017, 175, 146–162. [Google Scholar] [CrossRef]
  43. Shannigrahi, A.S.; Fukushima, T.; Ozaki, N. Comparison of different methods for measuring dry deposition fluxes of particulate matter and polycyclic aromatic hydrocarbons (PAHs) in the ambient air. Atmos. Environ. 2004, 39, 653–662. [Google Scholar] [CrossRef]
  44. Pan, Y.P.; Wang, Y.S.; Tang, G.Q.; Wu, D. Wet and dry deposition of atmospheric nitrogen at ten sites in Northern China. Atmos. Chem. Phys. 2012, 12, 6515–6535. [Google Scholar] [CrossRef] [Green Version]
  45. Reimann, C.; Caritat, P.D. Intrinsic Flaws of Element Enrichment Factors (EFs) in Environmental Geochemistry. Environ. Sci. Technol. 2000, 34, 5084–5091. [Google Scholar] [CrossRef]
  46. Buat Menard, P.; Chesselet, R. Variable Influence of Atmospheric Flux on the Trace Metal Chemistry of Oceanic Suspended Matter. Earth Planet. Sci. Lett. 1979, 42, 398–411. [Google Scholar] [CrossRef]
  47. Tam, N.F.Y.; Yao, M.W.Y. Normalisation and heavy metal contamination in mangrove sediments. Sci. Total Environ. 1998, 216, 33–39. [Google Scholar] [CrossRef]
  48. Iqbal, J.; Syed, A.T.; Munir, H.S. Statistical apportionment and risk assessment of selected metals in sediments from Rawal Lake (Pakistan). Environ. Monit. Assess 2013, 185, 729–743. [Google Scholar] [CrossRef]
  49. Sakan, S.M.; Đorđević, D.S.; Manojlović, D.D.; Predrag, P.S. Assessment of heavy metal pollutants accumulation in the Tisza river sediments. J. Environ. Manag. 2009, 90, 3382–3390. [Google Scholar] [CrossRef]
  50. Schiff, K.C.; Weisberg, S.B. Iron as a reference element for determining trace metal enrichment in Southern California coastal shelf sediments. Mar. Environ. Res. 1999, 48, 161–176. [Google Scholar] [CrossRef]
  51. Hernandez, L.; Probst, A.; Probst, J.L.; Ulrich, E. Heavy metal distribution in some French forest soils: Evidence for atmospheric contamination. Sci. Total Environ. 2003, 312, 195–219. [Google Scholar] [CrossRef]
  52. Rudnick, R.L.; Gao, S. Composition of the Continental Crust. Treatise Geochem. 2003, 1–64. [Google Scholar] [CrossRef]
  53. Young, G.M.; Nesbitt, H.W. Processes controlling the distribution of Ti and Al in weathering profiles, siliciclastic sediments and sedimentary rocks. J. Sediment. Res. 1998, 68, 448–455. [Google Scholar] [CrossRef]
  54. Yang, S.; Li, C. Element composition and geological background of sediments along the Yangtze and yellow rivers. Mar. Geol. Quat. Geol. 1998, 19, 19–26. [Google Scholar]
  55. Zhang, X.; Arimoto, R.; An, Z. Glacial and interglacial patterns for Asian dust transport. Quat. Sci. Rev. 1999, 18, 811–819. [Google Scholar] [CrossRef]
  56. Mbengue, S.; Alleman, L.Y.; Flament, P. Size-distributed metallic elements in submicronic and ultrafine atmospheric particles from urban and industrial areas in northern France. Atmos. Res. 2014, 135–136, 35–47. [Google Scholar] [CrossRef]
  57. Gong, S.L.; Zhang, X.Y.; Zhao, T.L.; Zhang, X.B.; Barrie, L.A.; Mckendry, I.G.; Zhou, Z.J. A simulated climatology of asian dust aerosol and its trans-pacific transport. part ii: Interannual variability and climate connections. J. Clim. 2006, 19, 104–122. [Google Scholar] [CrossRef]
  58. Xie, Y.Y.; Chi, Y.P. Geochemical investigation of dry- and wet- deposited dust during the same dust-storm event in Harbin, China: Constraint on provenance and implications for formation of aeolian loess. J. Asian Earth Sci. 2016, 120, 43–61. [Google Scholar] [CrossRef]
  59. Fahu, C.; Weixin, Z. Loess Stratigraphy and Quaternary Glacier in Gansu and Qinghai-Tibet Regions Area, 4th ed.; Science Press: Beijing, China, 1993; pp. 135–137. [Google Scholar]
  60. Nesbitt, H.W.; Young, G.M. Early Proterozoic climates and plate motions inferred from major element chemistry of lutites. Nature 1982, 299, 715–717. [Google Scholar] [CrossRef]
  61. Tao, H.F.; Wang, Q.C.; Yang, X.F.; Jiang, L. Provenance and tectonic setting of Late Carboniferous clastic rocks in West Junggar, Xinjiang, China: A case from the Hala-alat Mountains. J. Asian Earth Sci. 2013, 64, 210–222. [Google Scholar] [CrossRef]
  62. Liu, Z.; Hu, B.; Wang, L.; Wu, F.; Gao, W.; Wang, Y. Seasonal and diurnal variation in particulate matter (PM10 and PM2.5) at an urban site of Beijing: Analyses from a 9-year study. Environ. Sci. Pollut. Res. 2014, 22, 627–642. [Google Scholar] [CrossRef] [PubMed]
  63. Wang, L.C.; Liu, C.L.; Gao, X.; Zhang, H. Provenance and paleogeography of the Late Cretaceous Mengyejing Formation, southeastern Tibetan Plateau: Whole-rock geochemistry, U-Pb geochronology, and Hf isotopic constraints. Sediment. Geol. 2014, 304, 44–58. [Google Scholar] [CrossRef]
  64. Zhang, Z.; Dong, Z.; Zhang, C.; Qian, G.; Lei, C. The geochemical characteristics of dust material and dust sources identification in northwestern China. J. Geochem. Explor. 2017, 175, 148–155. [Google Scholar] [CrossRef]
  65. NOAA Air Resources Laboratory: Silver Spring, MD, USA. Available online: http://www.arl.noaa.gov/ready/hysplit4.html (accessed on 24 September 2019).
  66. Sun, G.; Chen, Y.; Bi, X.; Yang, W.; Chen, X.; Zhang, B.; Cui, Y. Geochemical assessment of agricultural soil: A case study in Songnen-Plain (Northeastern China). Catena 2013, 111, 56–63. [Google Scholar] [CrossRef]
  67. Mengmeng, J.; Yanxia, Z.; Biao, H.; Haidong, Z. Source apportionment of selenium and influence factors on its bioavailability in intensively managed greenhouse soil: A case study in the east bank of the Dianchi Lake, China, 2013. Ecotoxicol. Environ. Saf. 2018, 170, 238–245. [Google Scholar] [CrossRef]
  68. Feng, J.; Zhu, L.; Jianting, J.U. Heavy dust fall in Beijing, on April 16–17, 2006: Geochemical properties and indications of the dust provenance. Geochem. J. 2008, 42, 221–236. [Google Scholar] [CrossRef]
  69. Yongming, H.; Peixuan, D.; Junji, C.; Posmentier, E.S. Multivariate analysis of heavy metal contamination in urban dusts of Xi’an, Central China. Sci. Total Environ. 2006, 355, 176–186. [Google Scholar] [CrossRef]
  70. Ta, W.; Xiao, Z.; Qu, J.; Yang, G.; Wang, T. Characteristics of dust particles from the desert/Gobi area of northwestern China during dust-storm periods. Environ. Geol. 2003, 43, 667–679. [Google Scholar] [CrossRef]
  71. Varrica, D.; Dongarrà, G.; Sabatino, G.; Monna, F. Inorganic geochemistry of roadway dust from the metropolitan area of Palermo, Italy. Environ. Geol. 2003, 44, 222–230. [Google Scholar] [CrossRef]
  72. Yildrim, G.; Tokahoglu, S. Heavy metal speciation in various grain sizes of industrially contaminated street dust using multivariate statistical analysis. Ecotoxicol. Environ. Saf. 2016, 124, 369–376. [Google Scholar] [CrossRef]
  73. Nriagu, J.O.; Pacyna, J.M. Quantitative assessment of worldwide contamination of air, water, and soils by trace metals. Nature 1988, 33, 134–139. [Google Scholar] [CrossRef] [PubMed]
  74. Lin, Y.C.; Hsu, S.C.; Chou, C.C.; Zhang, R.; Wu, Y.; Kao, S.J.; Luo, L.; Huang, C.H.; Lin, S.H.; Huang, Y.T. Wintertime haze deterioration in beijing by industrial pollution deduced from trace metal fingerprints and enhanced health risk by heavy metals. Environ. Pollut. 2018, 208, 284–293. [Google Scholar] [CrossRef] [PubMed]
  75. Rossini, P.; Guerzoni, S.; Molinaroli, E.; Rampazzo, G.; De Lazzari, A.; Zancanaro, A. Atmospheric Bulk Deposition to Lagoon of Venice Part, I. Fluxes of Metals, Nutrients and Organic Contaminants. Environ. Int. 2005, 31, 959–974. [Google Scholar] [CrossRef] [PubMed]
  76. Yuan, C.; Yue-long, C.; Zhong-fang, Y. Dry and wet atmospheric deposition fluxes of elements in the Plain area of Beijing Municipality, China. Geol. Bull. China 2008, 27, 257–264. [Google Scholar]
  77. Qifeng, T.; Zhongfang, Y.; Benren, Z.; Haiyan, F.; Hongcui, W. A study of elements flux and sources from atmospheric bulk deposition in the Chengdu Economic Region. Earth Sci. Front. 2007, 14, 213–222. [Google Scholar]
  78. Zheng, M.; Guo, Z.; Fang, M.; Rahna, K.A.; Kester, D.R. Dry and wet deposition of elements in Hong Kong. Mar. Chem. 2005, 97, 124–139. [Google Scholar] [CrossRef]
  79. Mijić, Z.; Stojić, A.; Perišić, M.; Rajšića, S.; Tasić, M.; Radenković, M.; Joksićb, J. Seasonal variability and source apportionment of metals in the atmospheric deposition in Belgrade. Atmos. Environ. 2010, 44, 3630–3637. [Google Scholar] [CrossRef]
  80. Sharma, R.K.; Agrawal, M.; Marshall, F.M. Atmospheric deposition of heavy metals (Cu, Zn, Cd and Pb) in Varanasi City, India. Environ. Monit. Assess. 2008, 142, 269. [Google Scholar] [CrossRef]
  81. Zhang, R.; Cao, J.; Tang, Y.; Arimoto, R.; Shen, Z.; Wu, F.; Li, G. Elemental profiles and signatures of fugitive dusts from Chinese deserts. Sci. Total Environ. 2014, 472, 1121–1129. [Google Scholar] [CrossRef]
  82. Zarasvandi, A.; Carranza, E.J.M.; Moore, F.; Rastmanesh, F. Spatio-temporal occurrences and mineralogical–geochemical characteristics of airborne dusts in Khuzestan Province (southwestern Iran). J. Geochem. Explor. 2011, 111, 138–151. [Google Scholar] [CrossRef]
  83. Zhang, X.Y.; Zhang, G.Y.; Zhu, G.H.; Zhang, D.E.; An, Z.S.; Chen, T.; Huang, X.P. Elemental Tracers for Chinese Source Dust, 3rd ed.; Science in China Series; Science Press: Beijing, China, 2003; pp. 512–521. [Google Scholar]
  84. Guo, L.; Lyu, Y.; Yang, Y. Concentrations and chemical forms of heavy metals in the bulk atmospheric deposition of Beijing, China. Environ. Sci. Pollut. Res. Int. 2017, 24, 27356–27365. [Google Scholar] [CrossRef] [PubMed]
Figure 1. Sampling sites and the schematic diagram of the different sources of atmospheric deposition in the Gannan County area, Northeastern China (N and E refer to north latitude and east longitude respectively).
Atmosphere 10 00632 g001
Figure 2. Comparison of the discriminate (DF) index of dry deposition in Gannan and Harbin depositions [41], Beijing depositions [68], and Chinese Northwest Desert dust [81].
Atmosphere 10 00632 g002
Figure 3. The correlation between the ratios of Ca/Mg and Na/Al, in comparison with the potential sources. Upper continental crust (UCC) [52], Chinese desert (mean) loess [70,81]; dry deposition of northern urban agglomerations [44]; dry deposition of Horqin Sandy Land and Hulun Buir Sandy Land [42]; Beijing dust [68]; dry deposition of Harbin and Harbin loess [46]. All data are based on the same grain size (<63 μm component).
Atmosphere 10 00632 g003
Figure 4. The 48-h air mass back-trajectories for starting altitudes of 10, 500, and 1000 m above ground level (AGL) calculated from the Global Data Assimilation System (GDAS) Database of the National Ocean and Atmospheric Administration (NOAA) and simulated by using the Hybrid Single-Particle Langrangian Integrated Trajectory (HY-SPLIT) model: (a) January 2013; (b) February 2013; (c) March 2013; (d) April 2013; (e) May 2013; (f) June 2013; (g) July 2013; (h) August 2013; (i) September 2013; (j) October 2013; (k) November 2013; (l) December 2013.
Atmosphere 10 00632 g004aAtmosphere 10 00632 g004bAtmosphere 10 00632 g004c
Table 1. Trace and major element contents in atmospheric deposition in this study and in selected Chinese and overseas cities in the literature (n = 17) (mg/kg).
ElementAl *AsCa *CdCoCrCuFHgK *
Maximum6.8808.85.0601.2611.454.726.110300.2192.250
Minimum2.3804.80.86000.1384.6323.414.45850.0151.600
Mean of depositions5.3956.601.7140.827.5841.9120.09808.80.071.945
Standard deviation1.0431.050.93230.321.478.103.53119.80.050.2008
Variation coefficient0.190.160.540.390.190.190.180.150.690.10
Skewness−1.510.383.17−0.720.77−0.43−0.140.122.18−0.16
Kurtosis3.50−0.2911.58−0.262.480.23−0.89−0.395.83−1.19
Beijing, China [68]7.335NA5.0660.4613.8072.4029.86NANA2.209
Xi‘an, China [69]NA10.62NANANA167.2894.28NA0.640.00
Harbin, China [58]7.449NA1.077NA9.8660.0125.31NANA2.752
Baiyin, Gansu, China [70]4.266NA4.5168.3014.8096.00330.00NANA0.00
Jiayuguan, Gansu, China [70]4.859NA4.7811.7017.10115.0048.00NANA1.925
Palermo, Italy [71]0.78407.33NA1.186.75144.33570.40NANA2.260
Kayseri, Turkey [72]NANANA11.9016.9017.00100.15NANANA
Element (mg kg−1)Mg *MnN *Na *NiPbSSeTiZn
Maximum1.1606553.8781.62024.11130.660.223230312
Minimum0.41003920.52030.790010.618.20.060.111300101
Mean of depositions0.6570494.91.4361.26217.7643.910.380.152715200.9
Standard deviation0.168281.100.84532.2023.4521.170.210.03475.467.87
Variation coefficient0.260.160.590.170.190.480.550.220.180.34
Skewness1.550.751.67−0.21−0.042.30−0.131.25−1.790.13
Kurtosis4.35−0.433.87−0.07−0.087.07−1.441.193.97−1.29
Beijing, China [68]1.8320.10NA1.77040.9417.98NANA0.78110.4
Xi‘an, China [69]NA687.0NANANA230.5NANANA422.0
Harbin, China [58]0.7686475.0NA1.82322.3523.44NANA495469.30
Baiyin, Gansu, China [70]0.00687.0NA0.0044.00312.0NANANA730.0
Jiayuguan, Gansu, China [70]1.791780.0NA0.548951.00145.0NANANA71.00
Palermo, Italy [71]2.878256.2NANA26.80664.4NANA1220390.2
Kayseri, Turkey [72]NA424.5NANA17.90199.5NANANA778.5
Notes: NA, not available; *, expressed in %.
Table 2. Enrichment factor (EF) in atmospheric deposition in the Gannan County area.
AsCaCdCoCrCuHgKMgMnNNaNiPbSSeTiZn
Max3.425.6529.980.991.001.908.292.361.051.731600.721.120.778.750.574.581.267.03
Min1.520.811.820.470.460.610.481.080.370.730.000.630.381.570.001.600.901.90
Mean2.151.8914.670.680.701.132.391.310.691.00304.020.800.584.030.162.561.084.69
SD0.471.106.960.130.140.312.250.310.190.24360.400.120.111.820.140.830.091.64
Table 3. Comparison of atmospheric deposition fluxes in Gannan County area and other areas (g·hm−2·a−1).
LocationPeriodAlAsCaCdCoCrCuFHgK
This study2012–20139164.511.092660.450.151.267.293.52138.210.013125.85
Beijing Plain, China [76]2005–2006NA2.909264.090.24NA11.8614.20NA0.023328.45
Chengdu Economic Area, China [77]2004–2005NA2.7718,073.621.77NANANANA0.102008.73
Pearl River Delta, China [58]2001–2002NANANA0.070.196.4318.60NANANA
Southern Hebei, China [34]2007–2008NA3.1711,982.090.86NA15.651.37NA0.074330.28
Changchun, China [6]2006–2007NA4.79NA0.25NA10.678.22NA0.03NA
Hong Kong, China [78]1998–1999145.70NANANANANA10.17NANA461.36
Lake Erie, North America [75]1993–1994NA0.09NA0.40NA1.003.30NANANA
Belgrade, Serbia [79]2002–2006329.00NANA0.22NA1.6434.50NANANA
Northern France [56]2001–2002NANANA0.05NANA3.90NANANA
Varanasi, India [80]2003–2004NANANA1.38NANA6.68NANANA
LocationPeriodMgMnNNaNiPbSSeTiZn
This study2012–20131107.1677.932257.262096.583.197.86505.600.02462.0036.37
Beijing Plain, China [76]2005–20063236.26111.16NA9264.006.6021.99NANANA54.49
Chengdu Economic Area, China [77]2004–20051016.3164.96NA1125.40NA45.95NANANA147.83
Pearl River Delta, China [58]2001–200275.308.98NANA8.3512.70NANANA104.00
Southern Hebei, China [34]2007–20084936.14126.94NANA7.2430.49NANANA168.97
Changchun, China [6]2006–2007NANANANANA12.31NANANA48.15
Hong Kong, China [78]1998–1999247.9110.44NA1586.24NA118.10NANA4.3661.46
Lake Erie, North America [75]1993–1994NA2.10NANA0.460.78NA0.10NA11.00
Belgrade, Serbia [79]2002–2006NA26.20NANA11.3021.70NANANA41.40
Northern France [56]2001–2002NANANANA1.502.20NANANA15.60
Varanasi, India [80]2003–2004NANANANANA0.98NANANA52.50
Note: NA, not available.

