Article

Rainfall Contribution of Tropical Cyclones in the Bay of Bengal between 1998 and 2016 using TRMM Satellite Data

1
Collaborative Innovation Center on Forecast and Evaluation of Meteorological Disasters, School of Atmospheric Physics, Nanjing University of Information Science & Technology, Nanjing 210044, China
2
Southern Marine Science and Engineering Guangdong Laboratory (Zhuhai), Zhuhai 519082, China
3
Department of Earth and Environmental Sciences, Macquarie University, Sydney, NSW 2109, Australia
4
State Key Laboratory of Atmospheric Boundary Layer Physics and Atmospheric Chemistry, Institute of Atmospheric Physics, Chinese Academy of Sciences, Beijing 100029, China
*
Authors to whom correspondence should be addressed.
Submission received: 26 September 2019 / Revised: 3 November 2019 / Accepted: 7 November 2019 / Published: 12 November 2019
(This article belongs to the Special Issue Severe Storm)

Abstract

:
In the Bay of Bengal (BoB) area, landfalling Tropical Cyclones (TCs) often produce heavy rainfall that results in coastal flooding and causes enormous loss of life and property. However, the rainfall contribution of TCs in this area has not yet been systematically investigated. To fulfil this objective, firstly, this paper used TC best track data from the Indian Meteorological Department (IMD) to analyze TC activity in this area from 1998 to 2016 (January–December). It showed that on average there were 2.47 TCs per year generated in BoB. In 1998, 1999, 2000, 2005, 2008, 2009, 2010, 2013, and 2016 there were 3 or more TCs; while in 2001, 2004, 2011, 2012, and 2015, there was only 1 TC. On a monthly basis, the maximum TC activity was in May, October, and November, and the lowest TC activity was from January to April and in July. Rainfall data from the Tropical Rainfall Measurement Mission (TRMM) were used to estimate TC rainfall contribution (i.e., how much TC contributed to the total rainfall) on an interannual and monthly scale. The result showed that TCs accounted for around 8% of total overland rainfall during 1998–2016, and with a minimum of 1% in 2011 and a maximum of 34% in 1999. On the monthly basis, TCs’ limited rainfall contribution overland was found from January to April and in July (less than 14%), whereas the maximum TC rainfall contribution overland was in November and December (16%), May (15%), and October (14%). The probability density functions showed that, in a stronger TC, heavier rainfall accounted for more percentages. However, there was little correlation between TC rainfall contribution and TC intensity, because the TC rainfall contribution was also influenced by the TC rainfall area and frequency, and as well the occurrence of other rainfall systems.

1. Introduction

Neumann [1] reported that 7% of global Tropical Cyclones (TCs) took place in the North Indian Ocean (NIO). In particular, in the Bay of Bengal (BoB), 5% of global TCs occurred [2]. These TCs created 75% of global causalities [3] and caused an enormous loss of properties in the BoB coastal regions in India, Bangladesh, and Myanmar [4]. Specifically, freshwater flooding that caused by TCs’ heavy rainfall often becomes a major disaster for the coastal populations in the BoB area [5,6,7]. Therefore, further understanding of the TCs’ rainfall contribution in the BoB is essential for the purpose of TC disaster prevention and mitigation.
On a global basis, based on rain gauge observations, studies have been conducted to reveal the landfalling TCs’ rainfall contribution for regions such as Southeastern South America and surrounding islands [8,9,10,11,12], the Northern Australia coasts [13,14], and the Northwestern Pacific areas [15]. Knight and Davis [9] showed that TCs’ contribution was about 5–10% of the total rainfall in the southeastern United States, while Kunkel [10] further limited it down to 6% in the same region. Hernández Ayala and Matyas [12] revealed that 20–30% of TC rainfall in August and September was contributed by the island of Puerto Rico. For Australian rainfall, Lavender and Abbs [13] found that TCs have contributed to extreme rainfall by 40% while Villarini and Denniston [14] displayed a large contribution of about 66% over north-western Australia. Wu et al. [15] reported that TCs accounted for 28% of the total annual rainfall in Hainan Island, China. As rain gauge observations are mainly overland and not spatially homogeneous, studies using the Tropical Rainfall Measurement Mission (TRMM)multi-satellite dataset have also been carried out to evaluate TCs’ contribution at a global or basin-scale [16,17,18,19,20]. Lau et al. [16] found that TCs contributed to the total rainfall by 17% in the North Atlantic and 21% in the western North Pacific. Jiang and Zipser [17] showed that the TC rainfall contribution (i.e., how much TC contributed to the total rainfall) was 8–9%, 7%, 11%, 5%, 7–8%, and 3–4% in the North Atlantic, east-central Pacific, western North Pacific, NIO, south Indian Ocean, and South Pacific, respectively. The difference between Lau et al. [16] and Jiang and Zipser [17] was caused by different area definitions for the North Atlantic and western North Pacific. Prat and Nelson [18] found TCs’ contribution of the yearly rainfall overland around 5.5%, 7.5%, 6%, 9.5%, and 8.9% for the Americas, East Asia, South and West Asia, Oceania, and East Africa, respectively. Prat and Nelson [19] further discovered that TCs contributed on average 3.5% rainy days for land areas that experienced cyclonic activity in the global basin. Bagtasa [20] used both a rain gauge and TRMM satellite data to investigate the TC rainfall contribution in the Philippines. The author showed that out of total TC rainfall in the Philippines, 57% occurred in the northern Philippines and 6% occurred in the southern island of Mindanao. Based on GPCP data, Scoccimarro et al. [21] examined the rainfall contribution of landfalling TCs all over the world during 1997–2006, and values of 2–12% were found for the different locations in the BoB region.
For the NIO basin, few studies have focused on the TCs’ rainfall contribution. However, TC frequency and rainfall asymmetry analysis in the BoB have been intensively investigated [2,22,23,24,25,26,27,28,29,30,31,32]. Thakur et al. [32] used TRMM data to investigate rainfall asymmetry of 17 landfalling TCs in the NIO, and they found that the rainfall distribution was mostly towards West and Southwest from the storm center. There was also research addressing the rainfall climatology and their variability in the NIO basin [33,34]. Kumar and Prasad [33] found that seasonal maximum rainfall over the BoB was 2 to 3 times greater than over the Arabian Sea (AS). A recent study by Sattar and Cheung [35] reported that the El Niño Southern Oscillation and Indian Ocean Dipole influenced the NIO TC activity, and that TC formation conditions were different for the BoB and AS basins. BoB was an active basin for cyclone formation compared to AS because the sea surface temperature (SST), upper ocean heat content (UOHC), total column water vapor (TCWV), relative humidity (RH), and lower tropospheric temperature (LTT) was higher in the BoB than AS. Moreover, vertical wind shear (VWS) was very low in BoB while it was very high in AS [36]. Kumar and Prasad [33] also found significant rainfall variations in the NIO basin from June to August season (summer monsoon) during 1987–1990. Kothawale et al. [34] found a peak correlation coefficient between the Sea Surface Temperature (SST) and summer monsoon rainfall in December, which increased from October and decreased from February to September. Though few studies have focused on TC rainfall analysis, these studies did not focus on TC rainfall contribution in the BoB region [37,38]. Dhar [37] examined the influence of depressions or tropical storms on the rainfall of individual monsoon months. Krishnakumar [38] reported that increasing TC frequency in the BoB during post-monsoon season may be influenced by rising post-monsoon rainfall over Kerala, India.
In the BoB, landfall TCs associated with heavy rainfall frequently caused flooding in the coastal regions of India, Bangladesh, and Myanmar, leaving the local agricultural crops, livestock, houses, and human lives in a vulnerable state. For example, the very severe cyclonic storm Sidr (2007) damaged houses, agricultural crops, roads and infrastructure in Bangladesh through coastal flooding [39]. Cyclone Nisha (2008) displaced from 60,000 to 70,000 people in Vanni and 20,000 people were displaced by heavy rainfall and coastal flooding in Jaffna district, Myanmar [40]. Although the losses along with the TC rainfall are huge, the rainfall contribution to total rainfall in this region from TCs has not been specifically identified. Therefore, in this paper, we use TRMM satellite data over BoB area during 1998–2016 to analyze the TC rainfall contribution in this region. Here, we focused on the BoB basin and omitted the AS basin because there are fourfold more TCs in the BoB than in the AS for that period (figure not shown). This rest of the paper is organized as follows. The data and methods are described in Section 2. TC activity and their rainfall distribution are analyzed in Section 3. Interannual and monthly rainfall variation are investigated in Section 4. The relationship between TCs and heavy rainfall are clarified in Section 5. A summary and conclusions are presented in Section 6.

2. Data and Methods

2.1. Study Domain

The BoB is the largest Bay in the world, and it is 2090 km long and 1610 km wide, bordered on the West by Sri Lanka and India, on the North by Bangladesh, and on the East by Myanmar. Following previous studies [2,27,29,41,42], the latitude and longitude of the BoB are set as 0° N–30° N and 75° E–100° E, respectively. There are large heavily populated port cities along the coasts such as Vishakhapatnam, Paradip, Chennai, and Kolkata of India; Chittagong of Bangladesh; and Sittwe of Myanmar. In the BoB, TCs may occur in any of the months, but in May and post-monsoon months (October–December), monsoon troughs are more active and conducive to TCs formation [24,27,41].

2.2. TCs Dest Track Dataset

In this study, we used the best track data from the Indian Meteorological Department (IMD) because this institution is responsible for monitoring and prediction of TC activities, collection, processing, and archival of TC best track data over the BoB [43]. The best track data with 3 hourly temporal resolution can be downloaded from the IMD official website (http://www.rsmcnewdelhi.imd.gov.in). IMD classified TCs into seven groups according to their maximum sustained surface winds speeds: Depression (De), 17–27 Knots; Deep Depression (DD), 28–33 Knots; Cyclonic Storm (CS), 34–47 Knots; Severe Cyclonic Storm (SCS), 48–63 Knots; Very Severe Cyclonic Storm (VSCS), 64–119 Knots; and Extreme Severe Cyclonic Storm (ESCS), larger than 120 Knots. De and DD were excluded in this study because depressions in the BoB could include monsoon depressions that do not have a warm core.

2.3. Rainfall Data

TRMM 3B42 V7 multi-satellite dataset was used in this study for rainfall analysis. The TRMM was launched in 1997 to provide a service for weather and climate research, and it is a joint mission of NASA and the Japan Aerospace Exploration Agency. Rain gauge modified monthly rainfall data, Advanced Microwave Sounding Unit (AMSU), Special Sensor Microwave Image (SSM/I), Advanced Microwave Scanning Radiometer (AMSR), TRMM Microwave Imager (TMI) are all joint with TRMM 3B42 dataset [44]. TRMM 3B42 supplies 3 hourly, daily, and monthly datasets with a resolution of 0.25° × 0.25°. As this dataset is cooperative with different remote sense products, its algorithms have been modified over the years. Further, the TRMM 3B42 dataset was improved in 2007 [45]. For monthly rain gauge consistency, Yu et al. [46] have reported that TRMM 3B42 performed comparatively better than other satellite precipitation data for investigating TC rainfall as a function of accumulated rainfall distribution. In terms of TC rainfall overland; however, TRMM 3B42 V6 provided negative biases [45], and TRMM 3B42 V7 displays substantive development compared with V6 [19].

3. TCs and The Associated Rainfall Distribution in the BoB

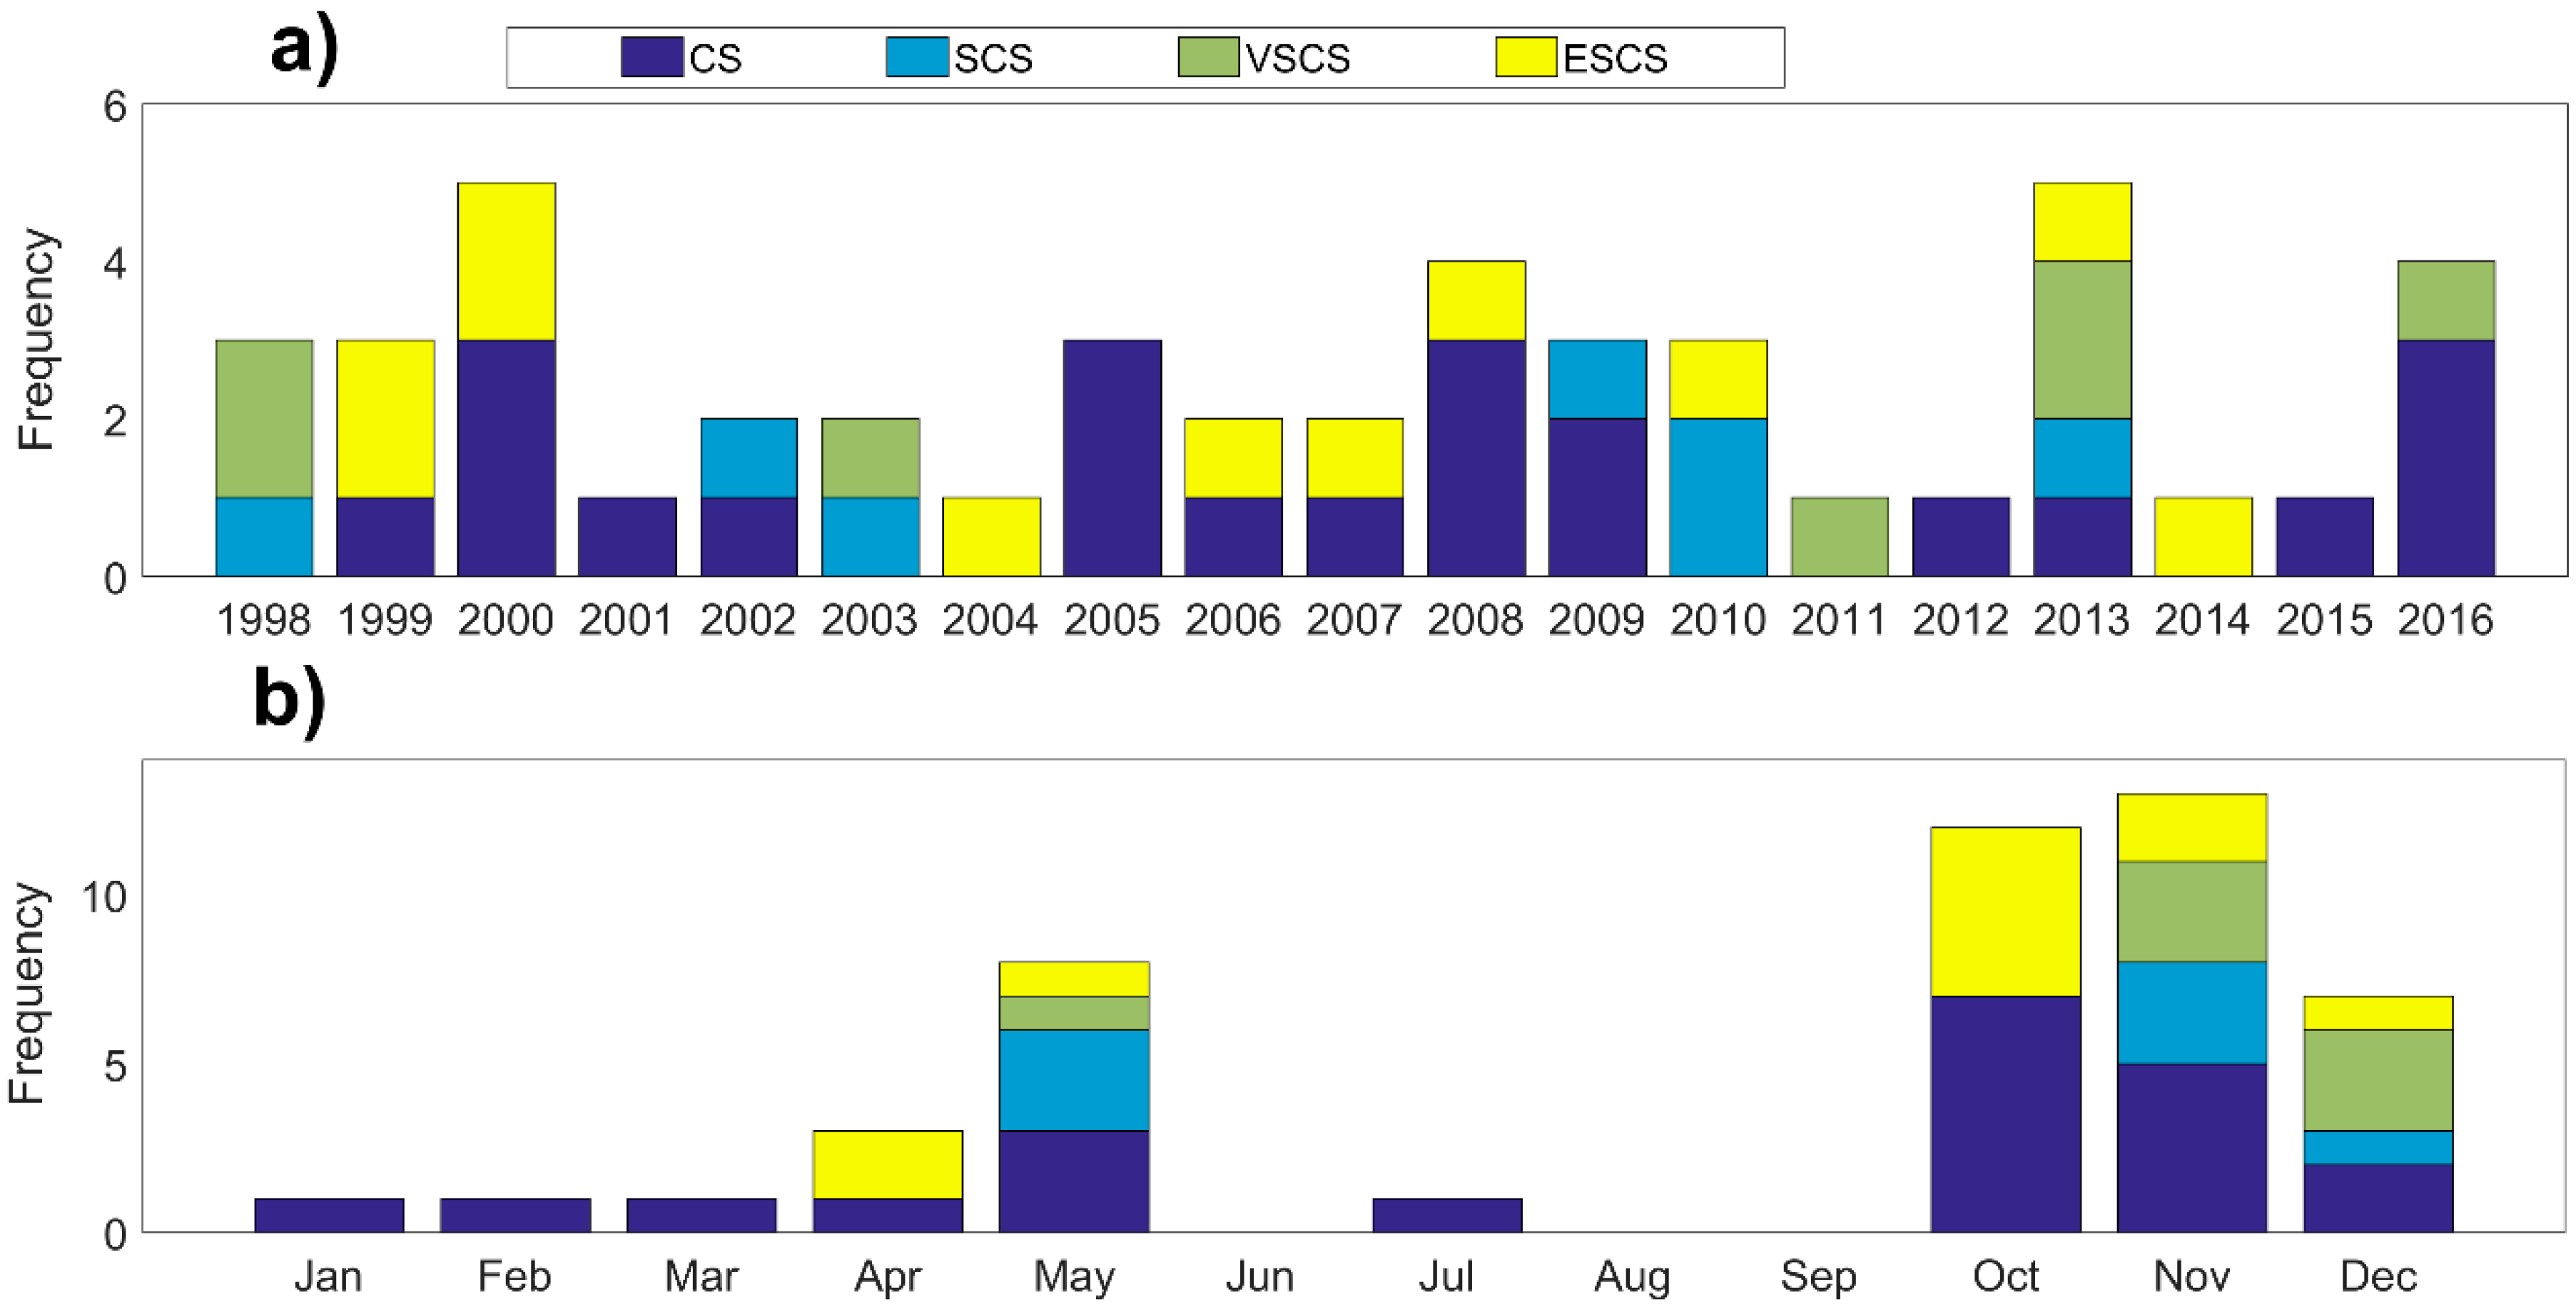
3.1. TC activity in the Bay of Bengal

A total of 47 (a yearly average of 2.47) TCs crossed the BoB from 1998 to 2016 (Figure 1), including 22 CSs, 7 SCSs, 7 VSCSs, and 11 ESCSs. Out of the 47 TCs, 31 made landfall, including 13 CSs, 5 SCSs, 5 VSCSs, and 8 ESCSs. In 1998, 1999, 2000, 2005, 2008, 2009, 2010, 2013, and 2016 there were 3 or more TCs. The years 2000 and 2013 had the strongest TC activity with 5 TCs, including 3 CS and 2 ESCS in 2000, and 1 CS, 1 SCS, 2 VSCSs, and 1 ESCS in 2013 respectively, while 2001 (1 CS), 2004 (1 ESCS), 2011 (1 VSCS), 2012 (1 CS), 2014 (1 ESCS), and 2015 (1 CS) had the weakest TC activity. The TC activity variation is related to SST, UOHC, TCWV, RH, LTT, and VWS. Balaji [36] reported the highest mean amount over the BoB region for these values in 2013 (all seasons) (SST = 29.23°C, UOHC = 69.01 kJ/cm2, TCWV = 44.27 kg ms−2, RH = 59.19%, LTT = 292.58 °C) and the lowest mean amount in 2001 (SST = 27.5 °C, UOHC = 53 kJ/cm2, TCWV = 41 kg ms−2, RH = 51%, LTT = 291 °C). The anticyclonic low-level flow over the BoB in 2001 also suppressed the TC formation in that year [25,28,47]. On a monthly basis, TC activity was strong in November (13 TCs), October (12 TCs), May (8 TCs), and December (7 TCs) (Figure 1b). This suggests that TC activity increases during post-monsoon in the BoB. This finding is in a good agreement with the previous studies [25,27,28,29,30,31]. A similar result was also found by Prat and Nelson [18,19], and they reported that TC activity dominated during October-November (47%) in the NIO. Jiang and Zipser [17] also showed that the maximum amount of TC activity occurred in October and November (1998–2006) in the NIO basin. The weak vertical wind shear, thermodynamically variant atmosphere, absence of dry and hot air moving from north-western India towards the Bay of Bengal, monsoon trough location, and genesis of dense impediment layers which stratify the upper ocean are the main causes for the increasing TC activity from October to November [24,29,30,48,49,50]. Moreover, during post-monsoon, the BoB gets fresh water from the Ganga and Brahmaputra rivers, which leads to a rising SST and is hence favorable for TC formation [25,26,28,50]. The second peak of TC frequency found in May (pre-monsoon) contributes 17% of total TCs during 1998–2016. Prat and Nelson [18] and Jiang and Zipser [17] also identified the secondary peak of TC frequency in May in the NIO. The reasons for high TC activity in this month include high SST and low vertical wind shear [30,49]. During June, August, and September (monsoon), the TC activity was absent (Figure 1b), so we omitted these months from the analysis. The TC activity in the BoB weakened from January to April, and these months showed a low contribution of <7%.

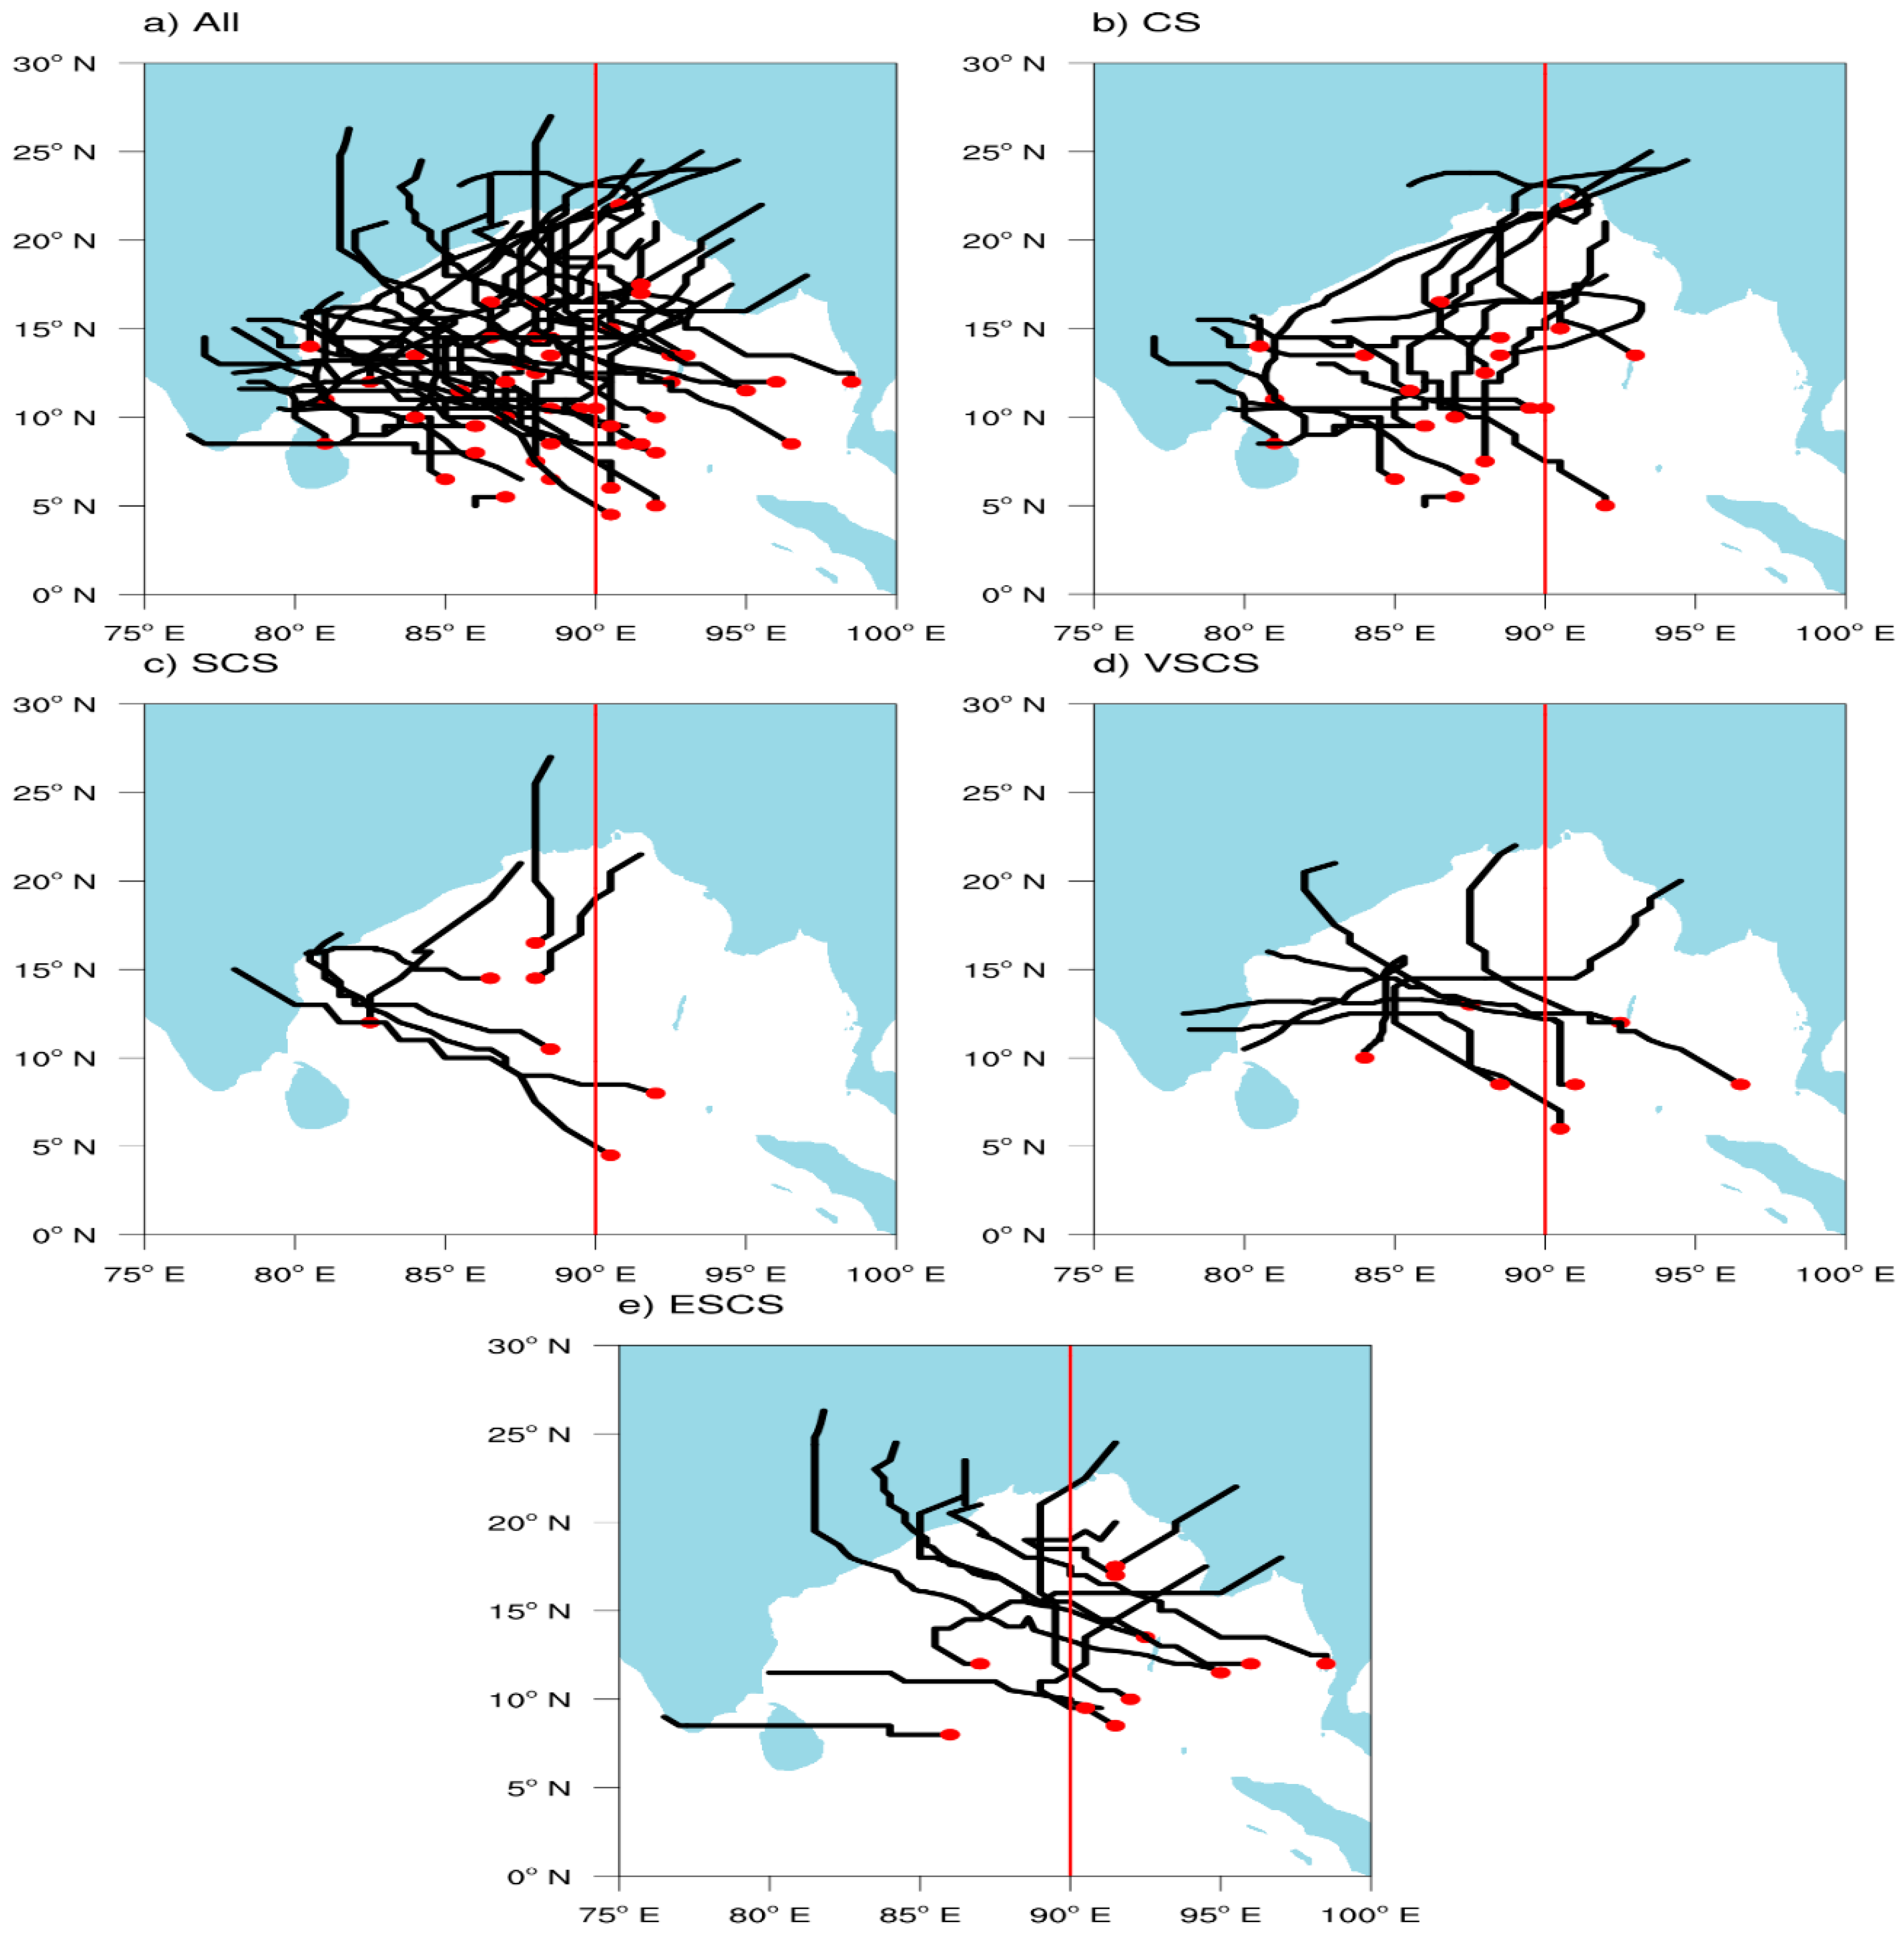
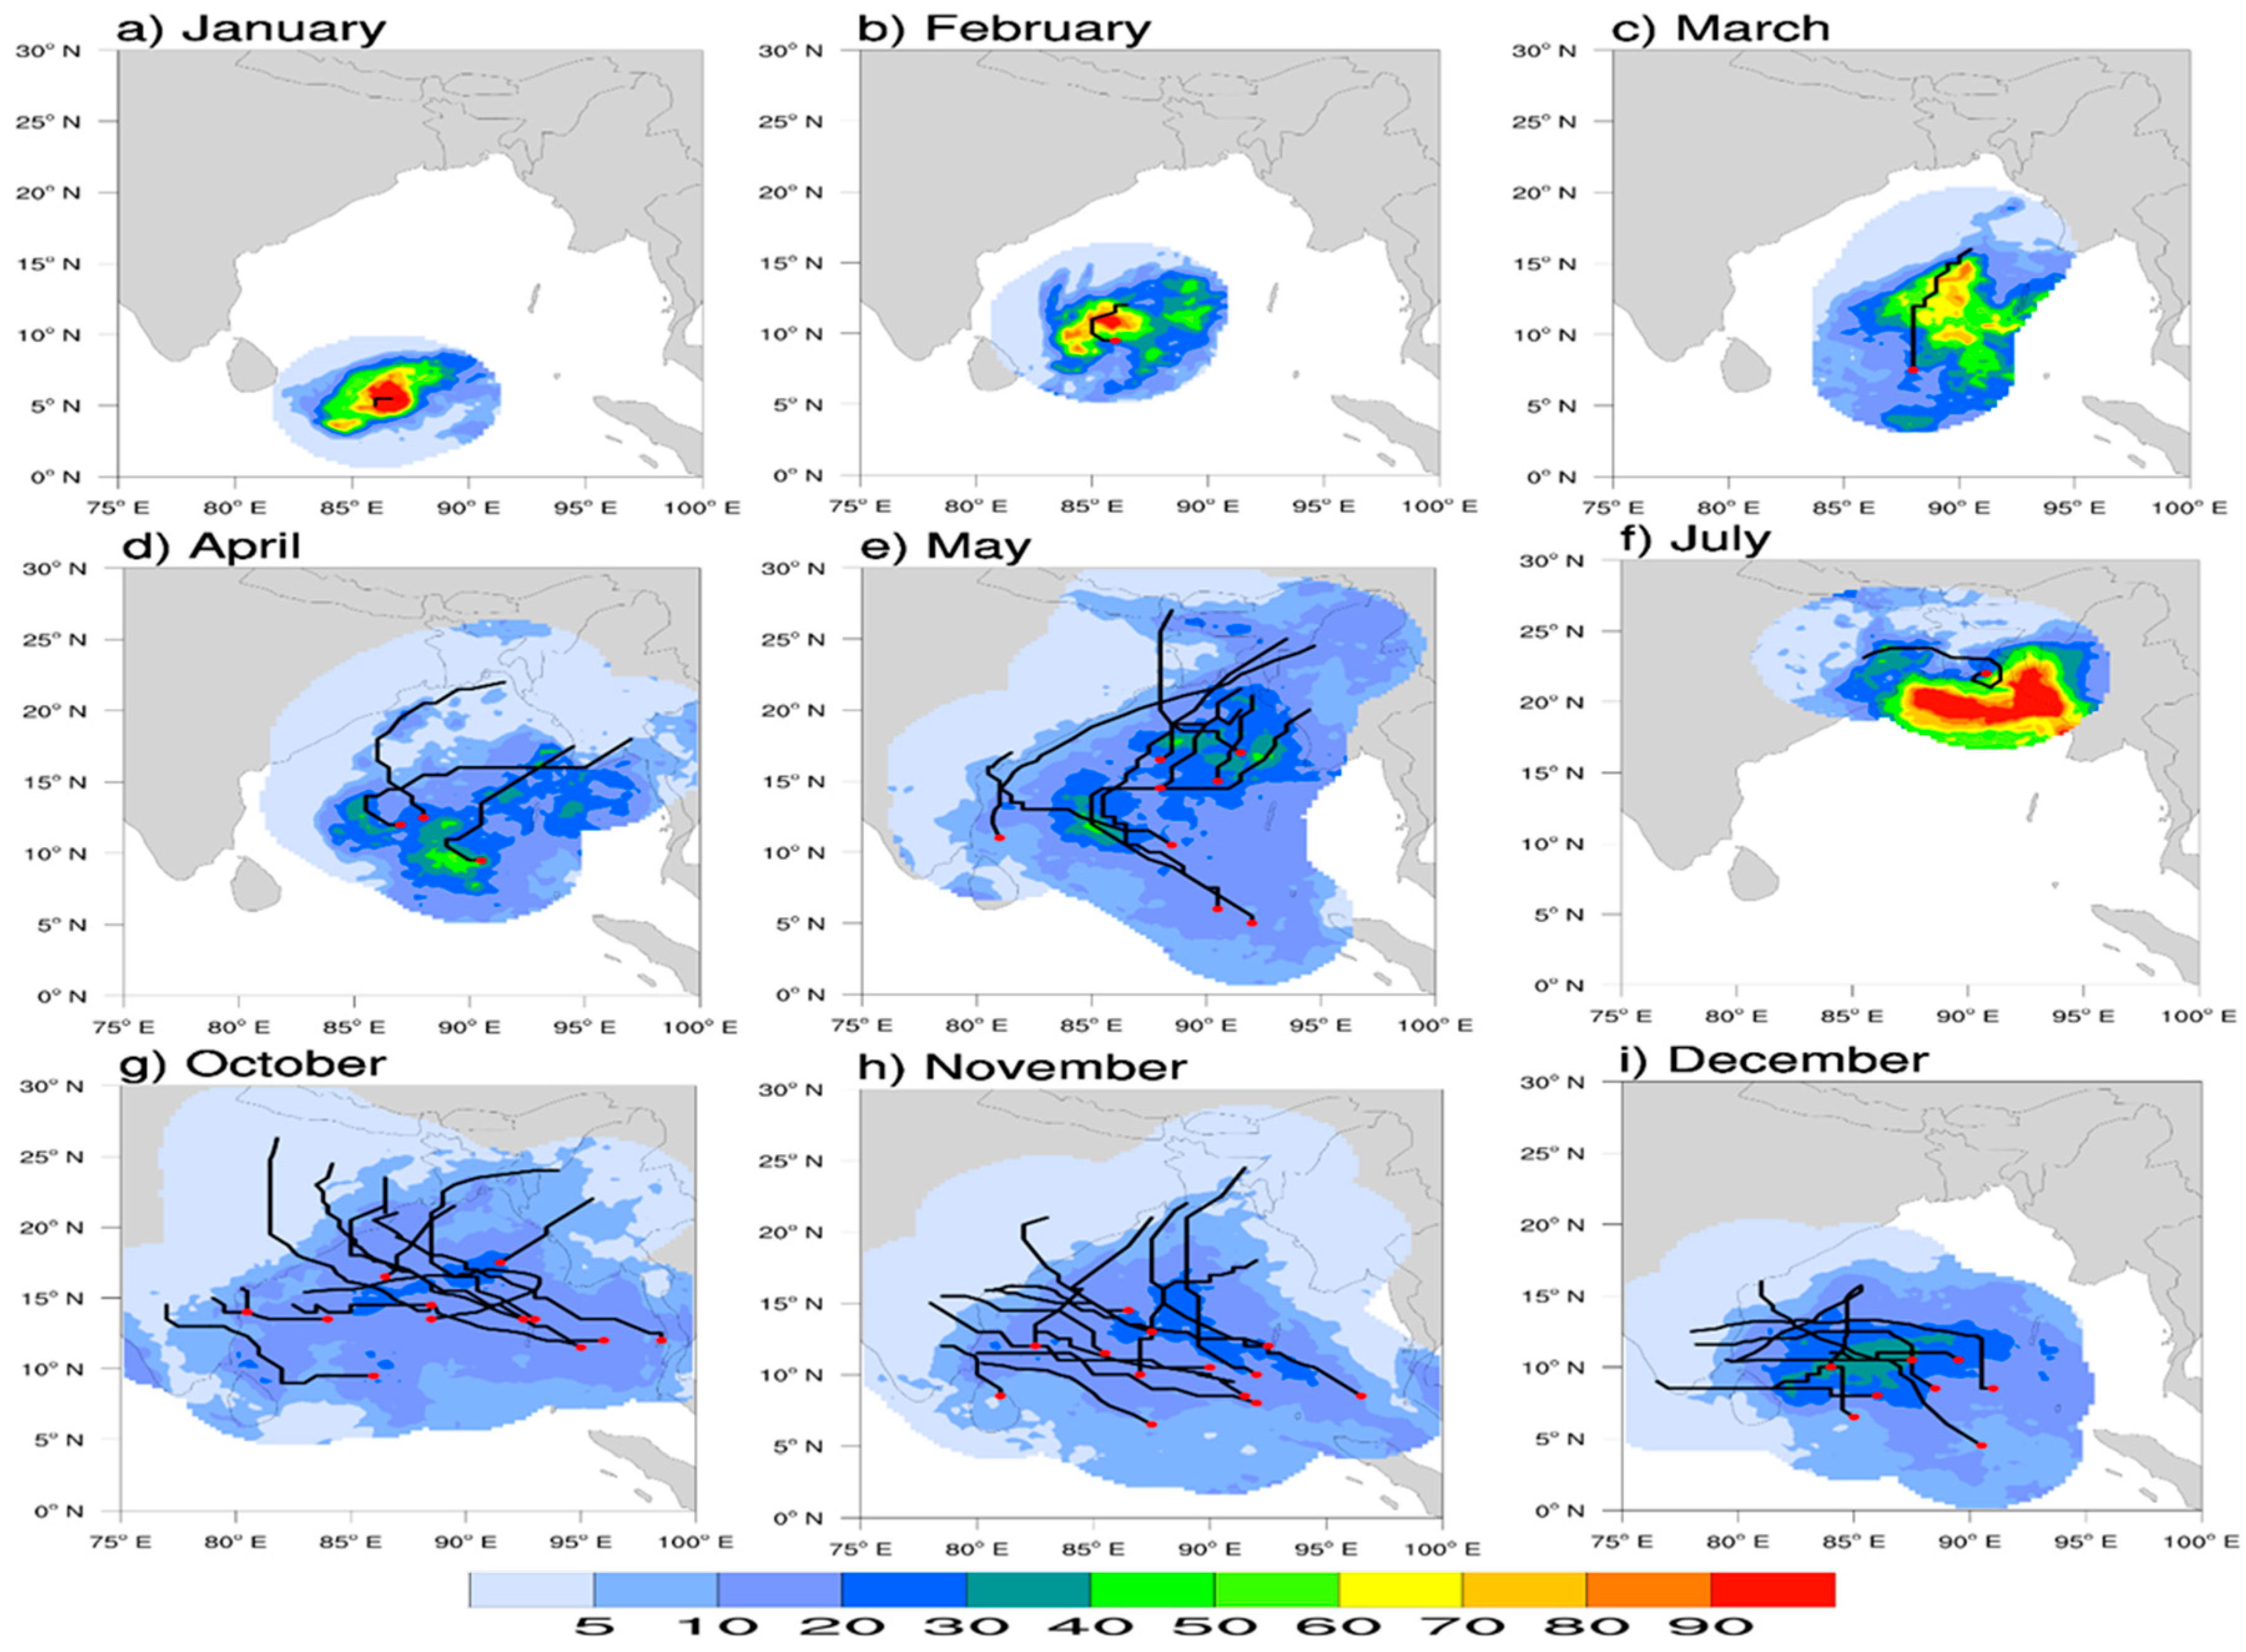
3.2. Spatial Distribution of TCs

Figure 2 shows the spatial distribution of TC tracks during the 19 years examined (1998–2016). The best track data derived from the IMD was 3-hourly in correspondence with the 3-hourly rainfall events. In the BoB, a large number of TCs moved westward and made landfall at the east coast of India, while many others moved in the north or northeast direction and made landfall at the coasts of Bangladesh or Myanmar (Figure 2a). Based on TCs formation, Balaguru et al. [29] divided BoB into an eastern part and a western part through 90° E longitude. Weaker TCs (i.e., CSs and SCSs) were more inclined to generate over the west part of BoB (west of 90° E), and made landfall on the east coast of India and south coast of Bangladesh, while VSCSs were generally equally distributed over the west and east part of the BoB, but mostly tended to move westward or northwestward and made landfall on the west and north coasts of BoB. For the ESCSs, on the other hand, most of them formed in the east part of BoB and tended to move either northwest or northeast and made landfall on the east coast of India, south coast of Bangladesh, and west coast of Myanmar (Figure 2e).

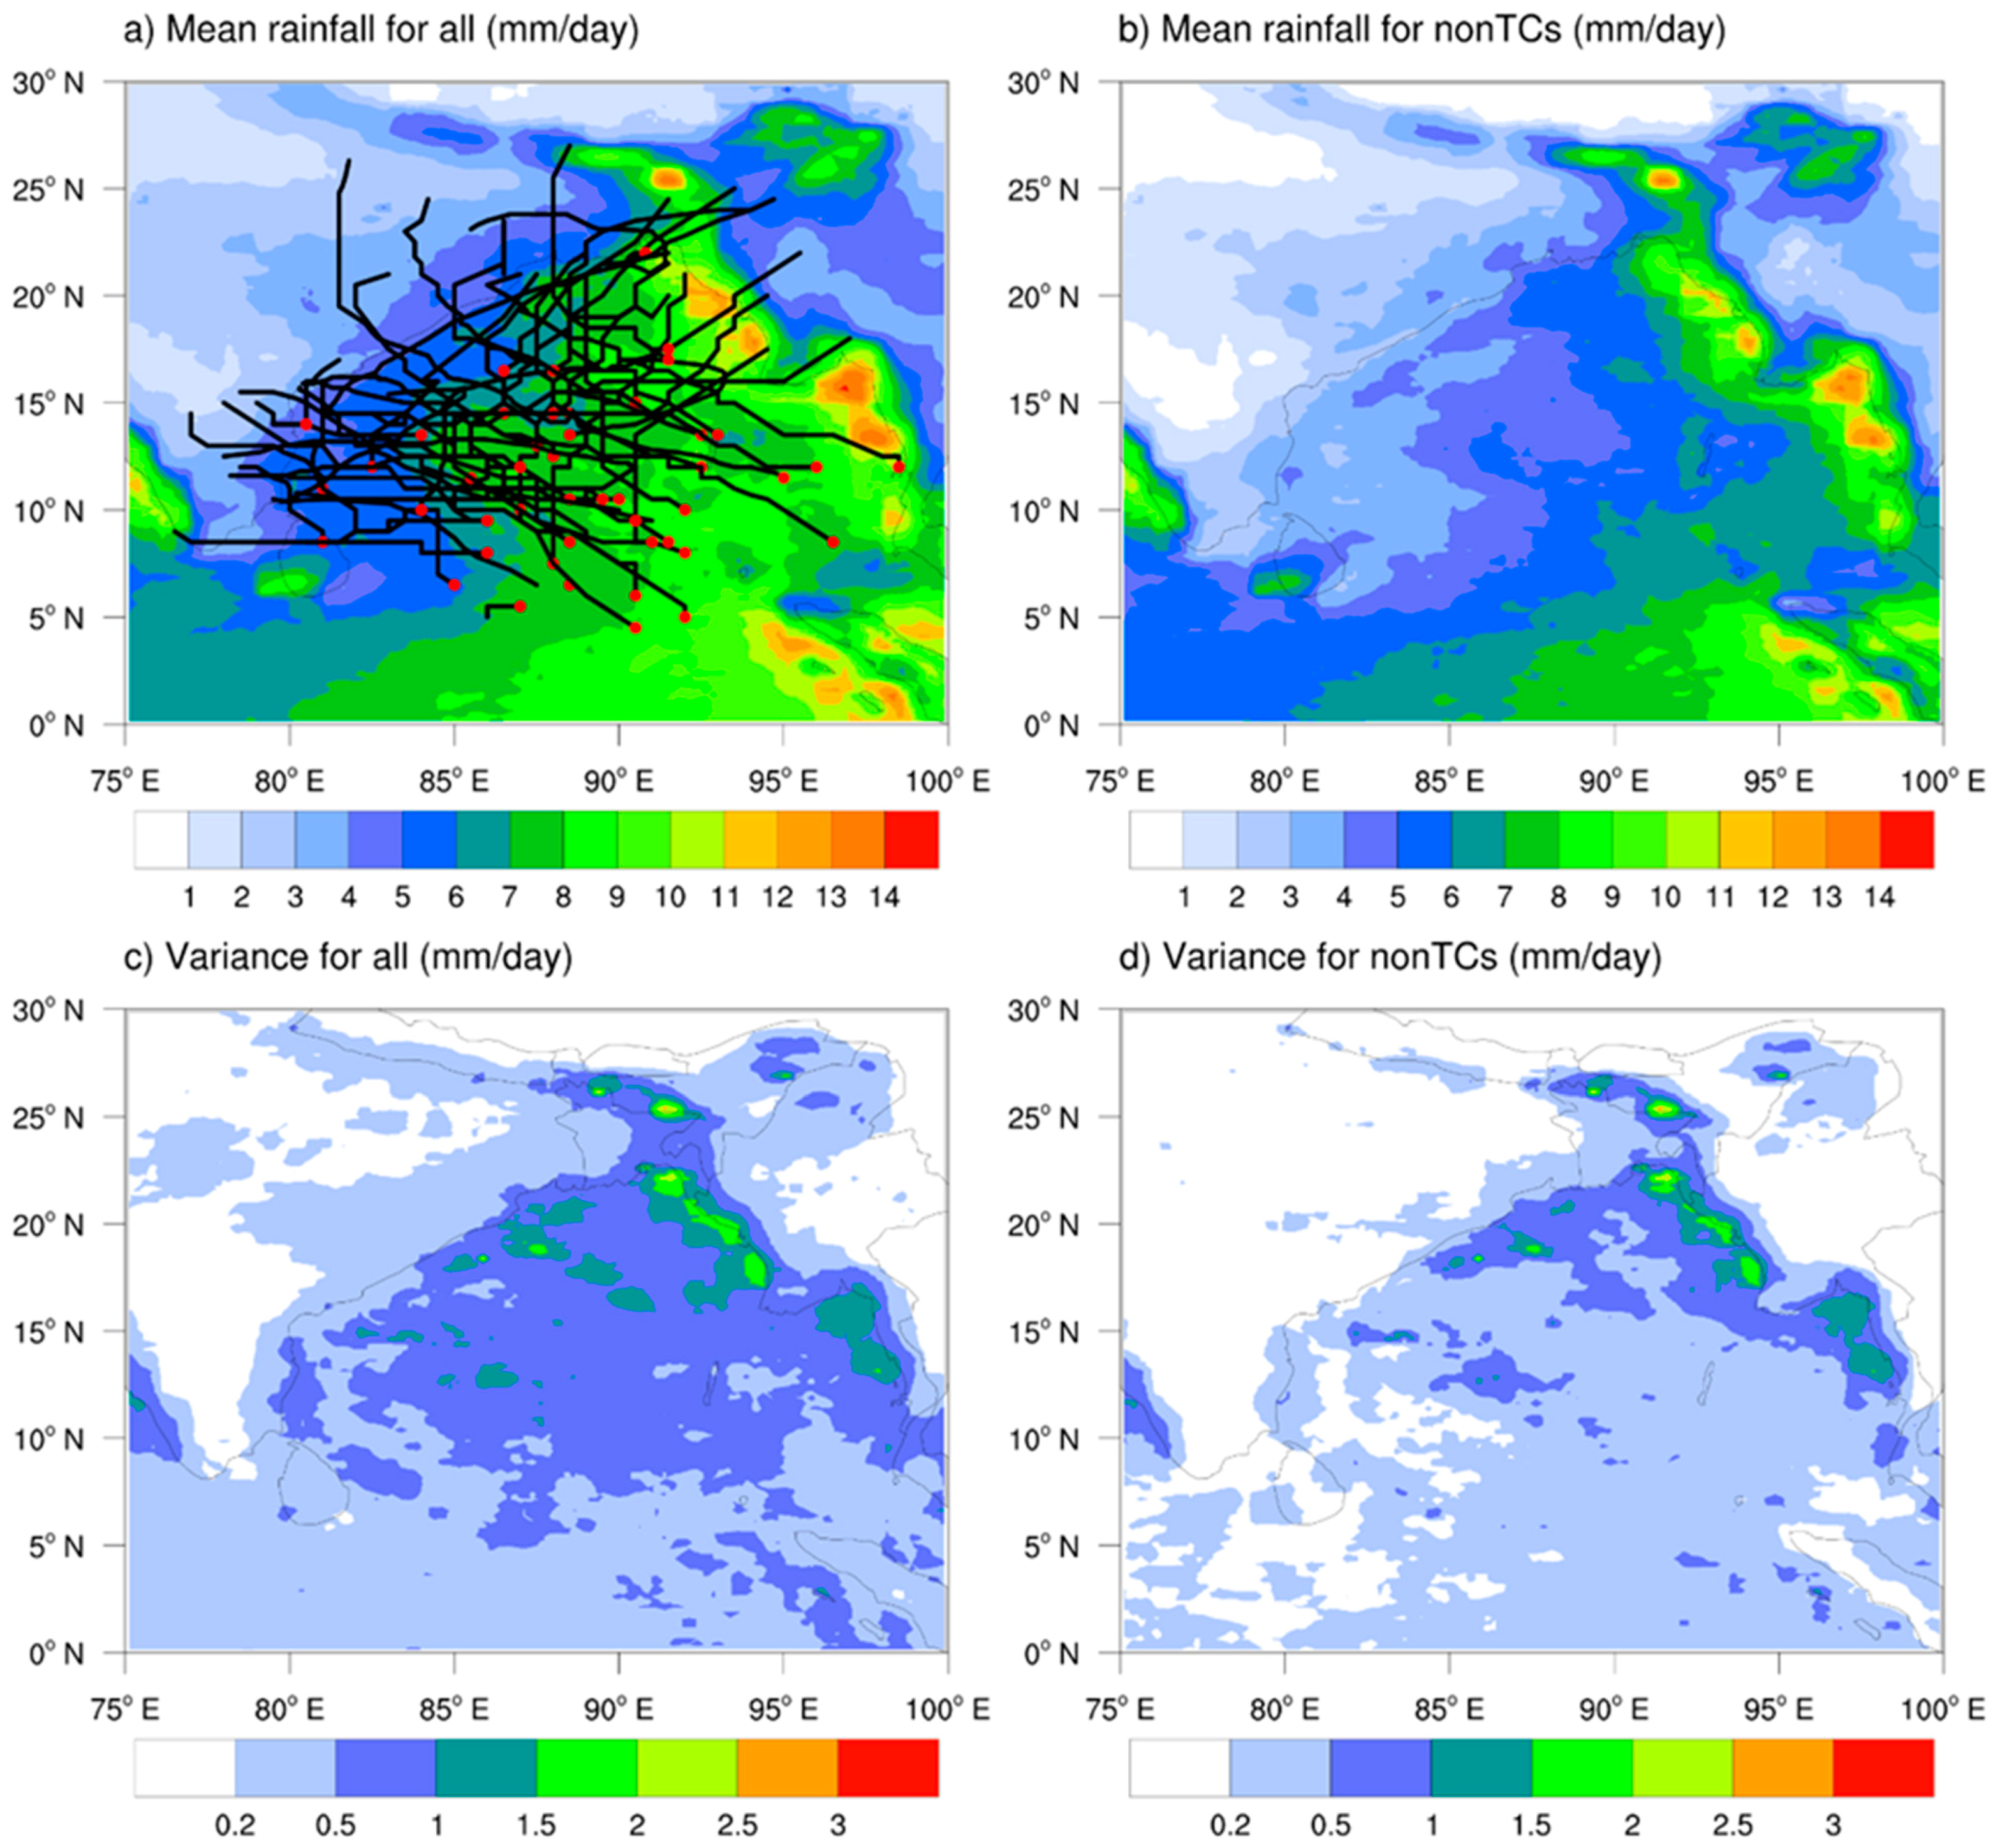
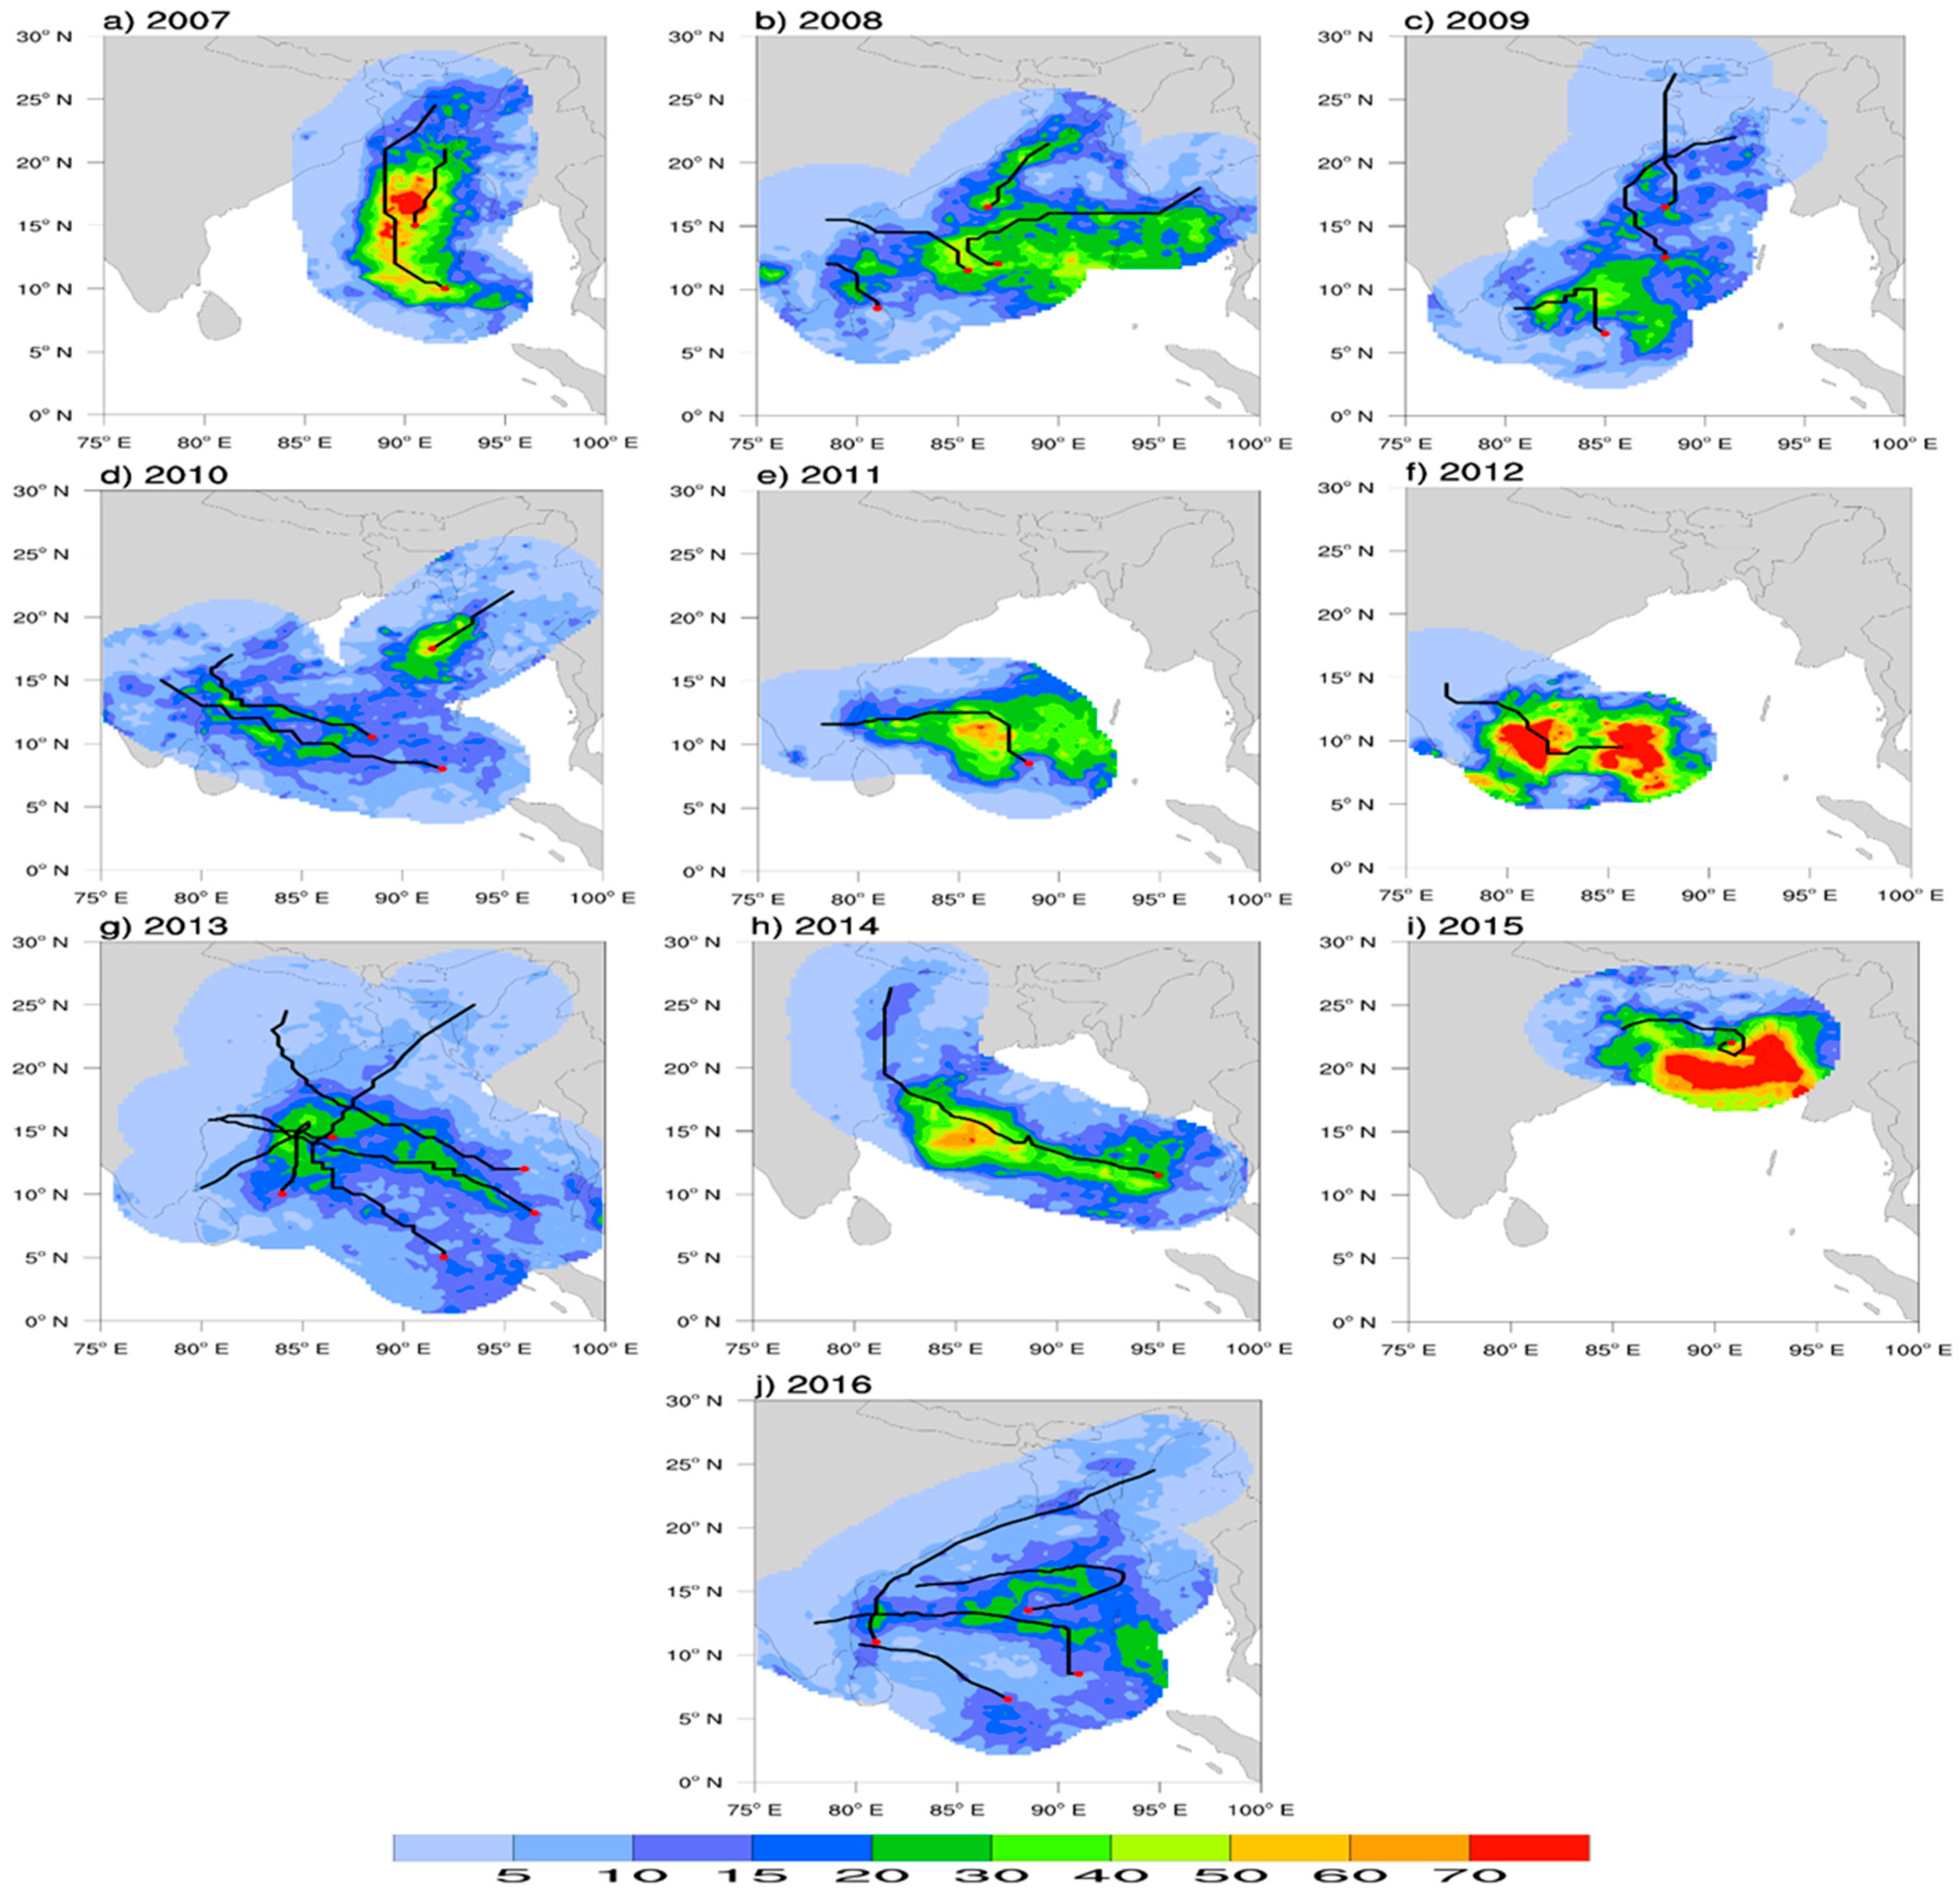
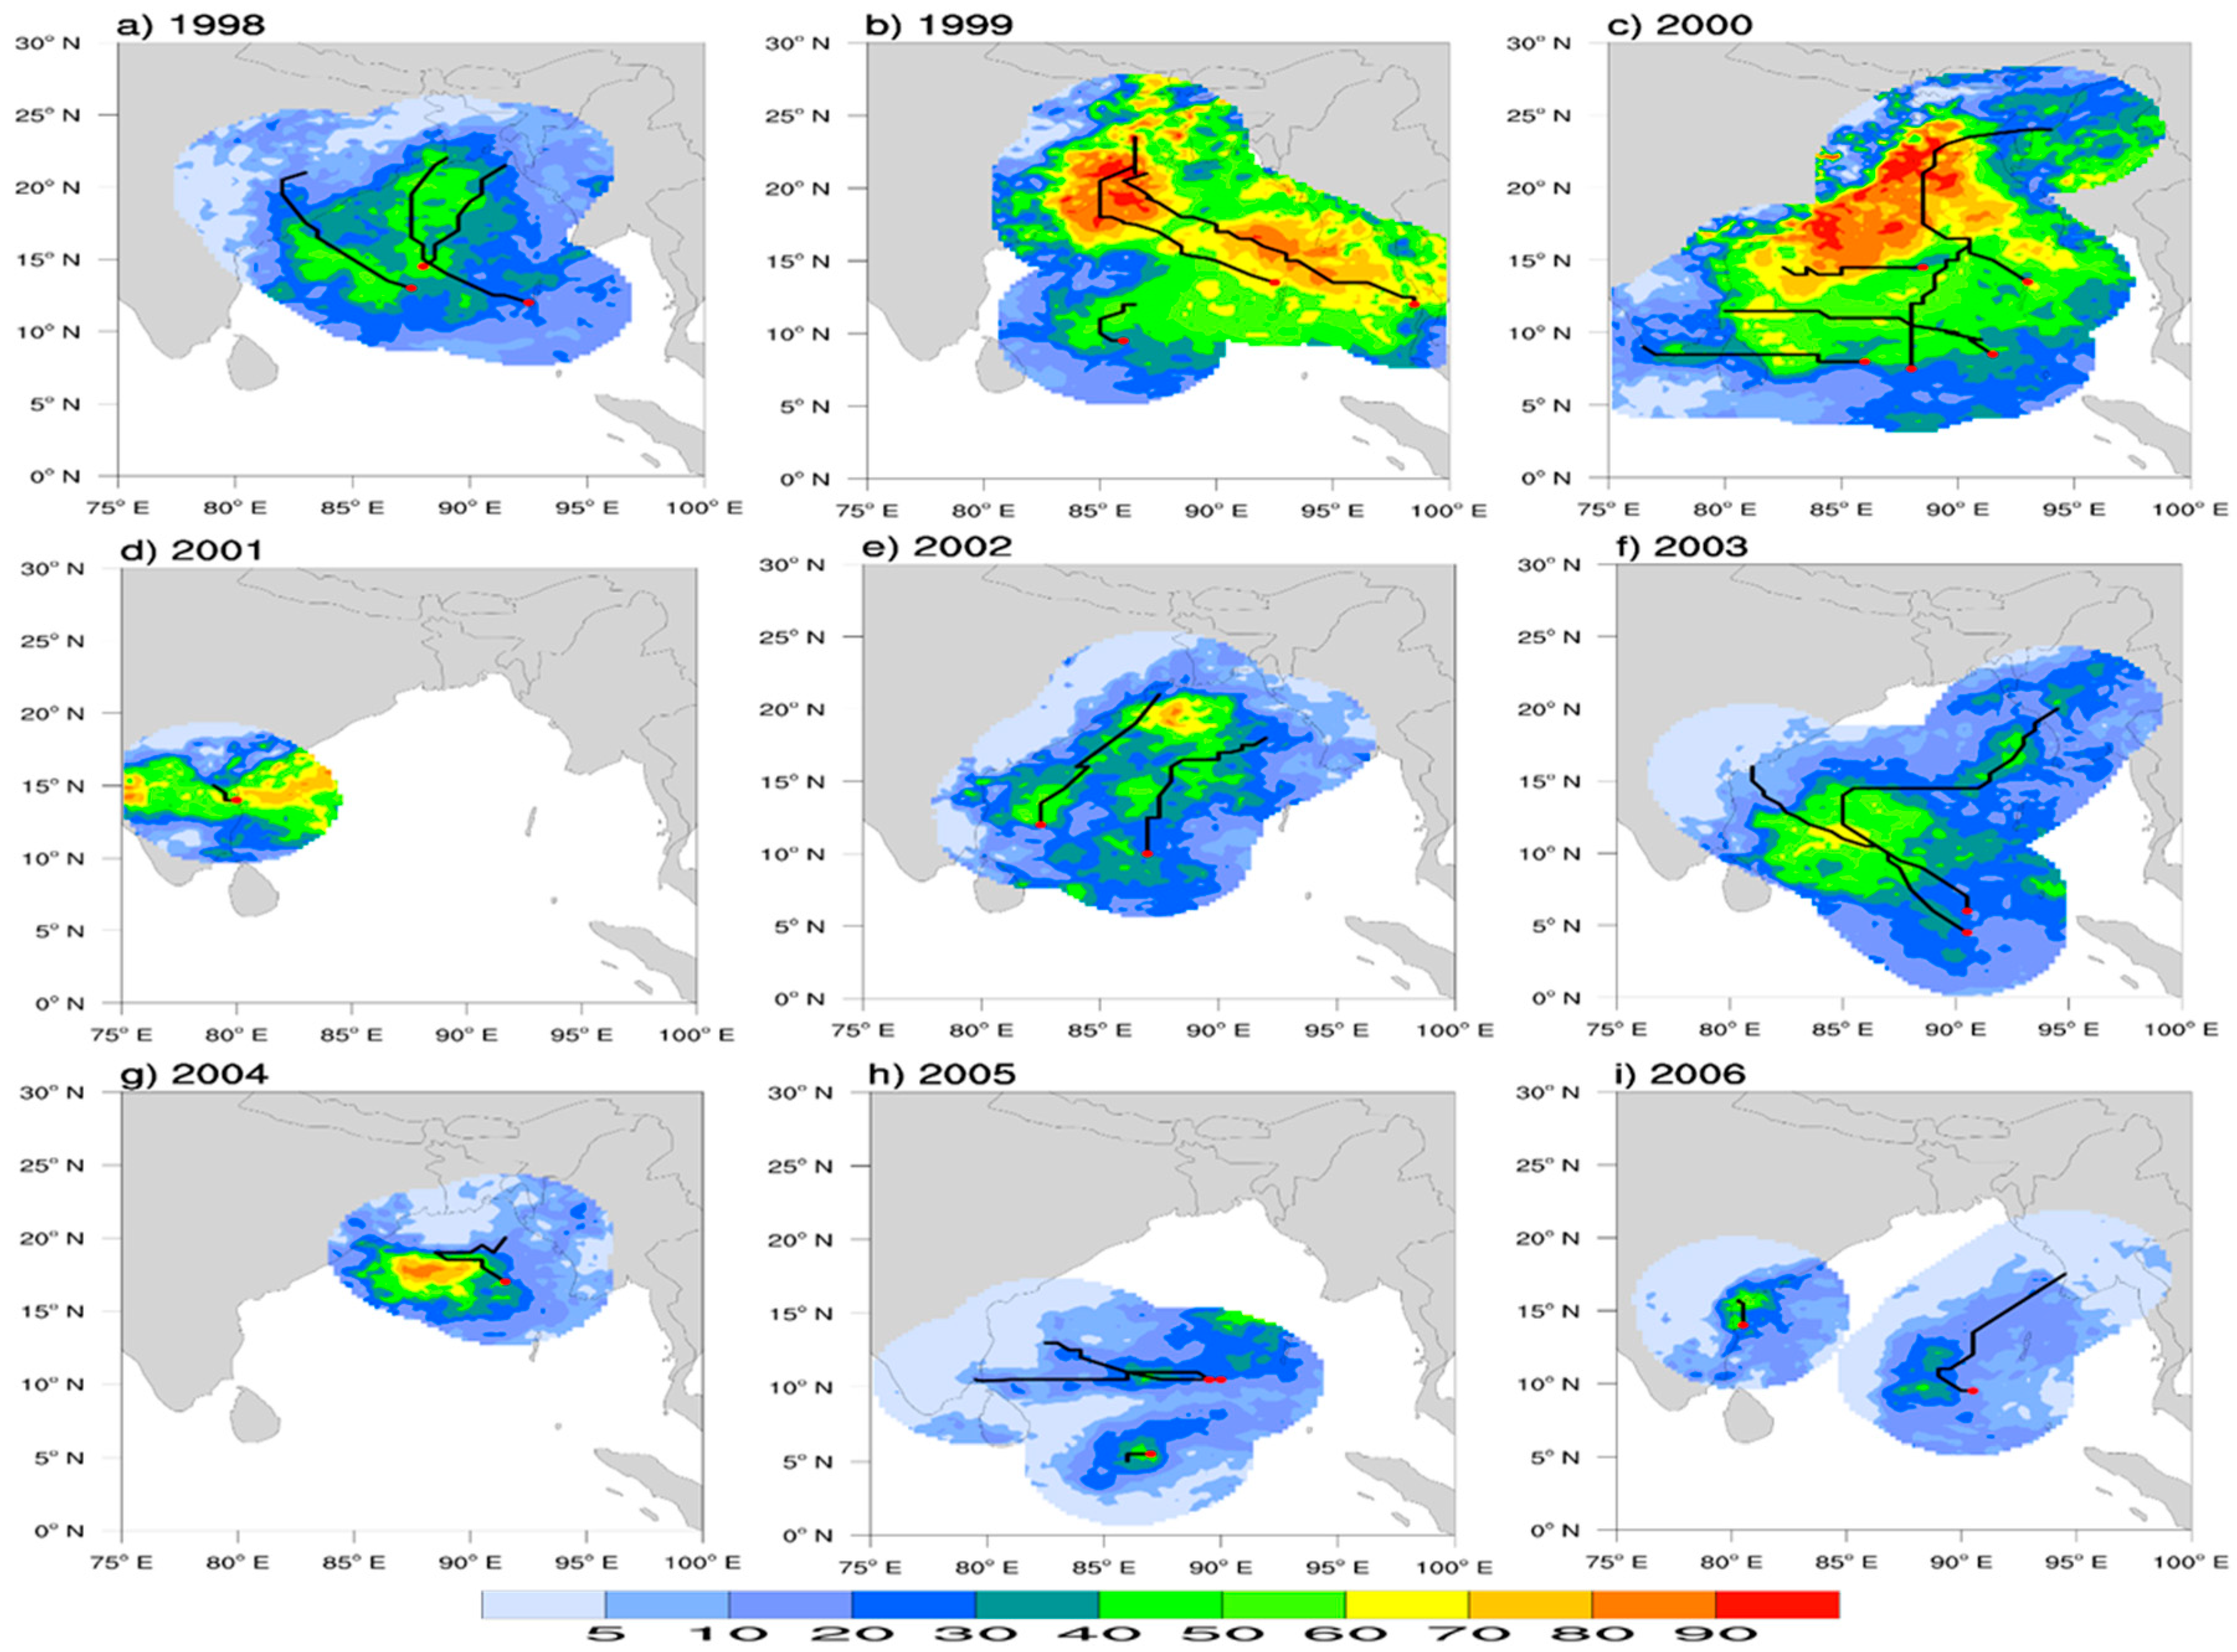
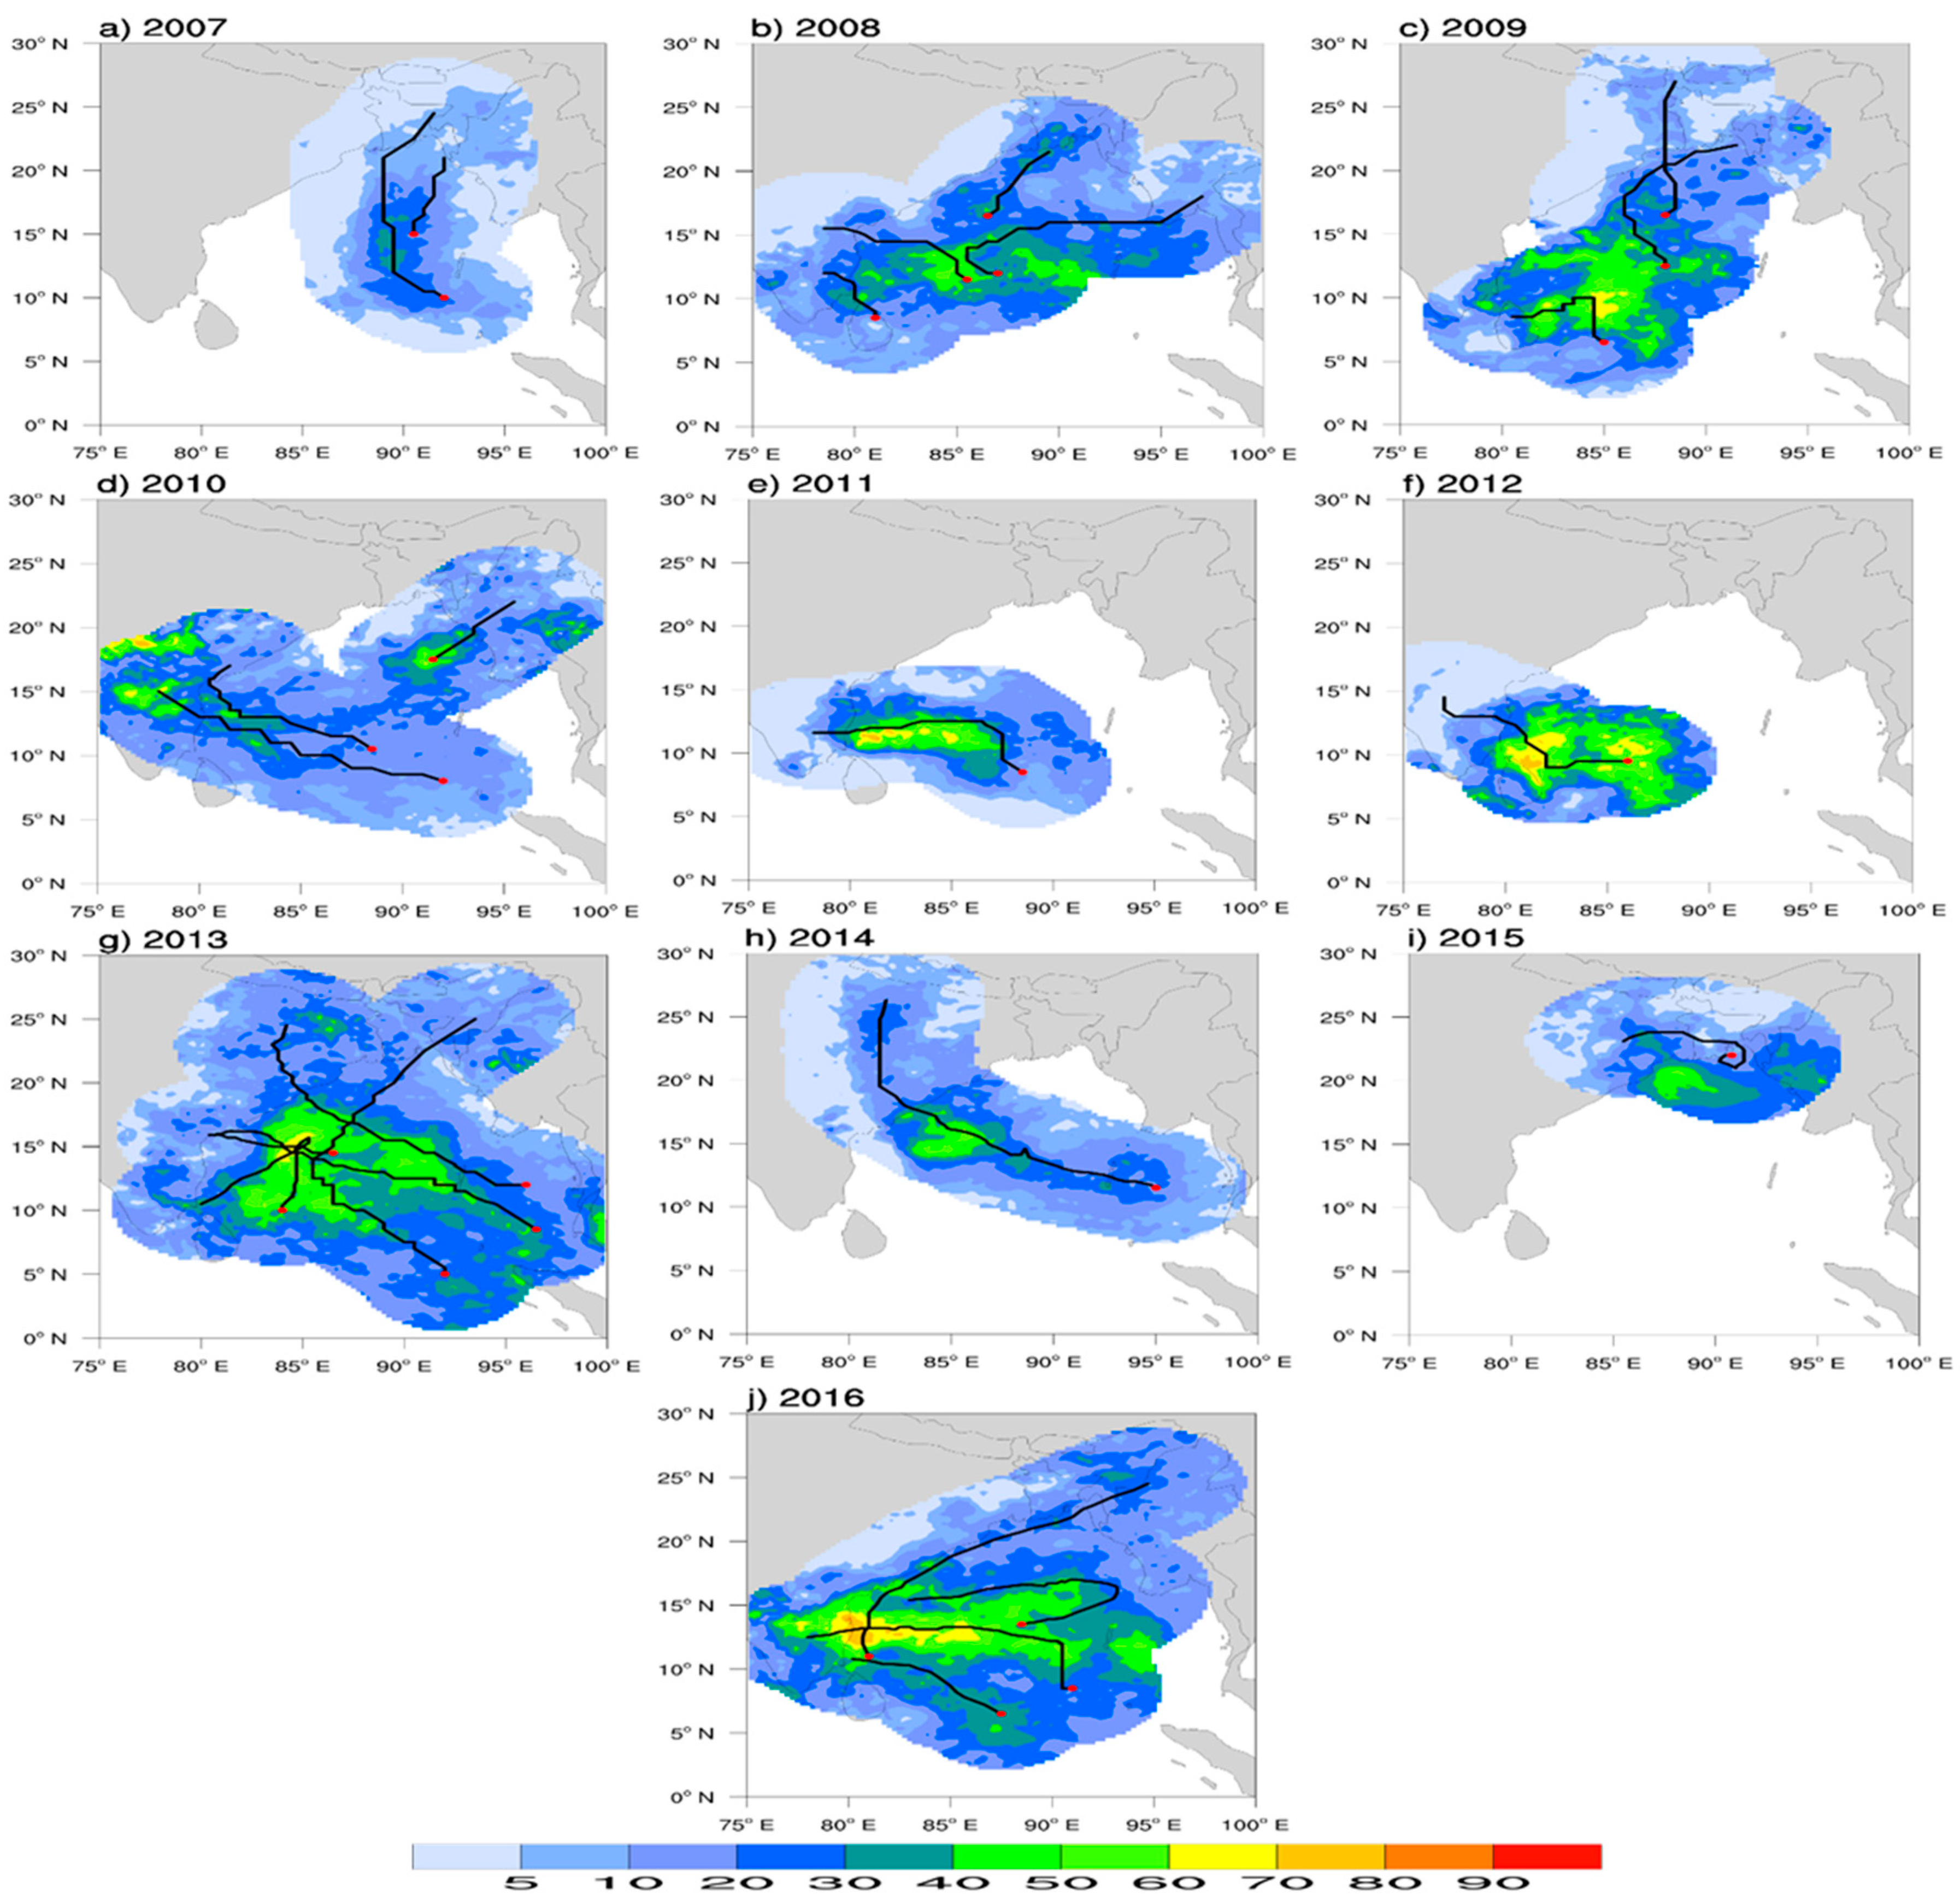
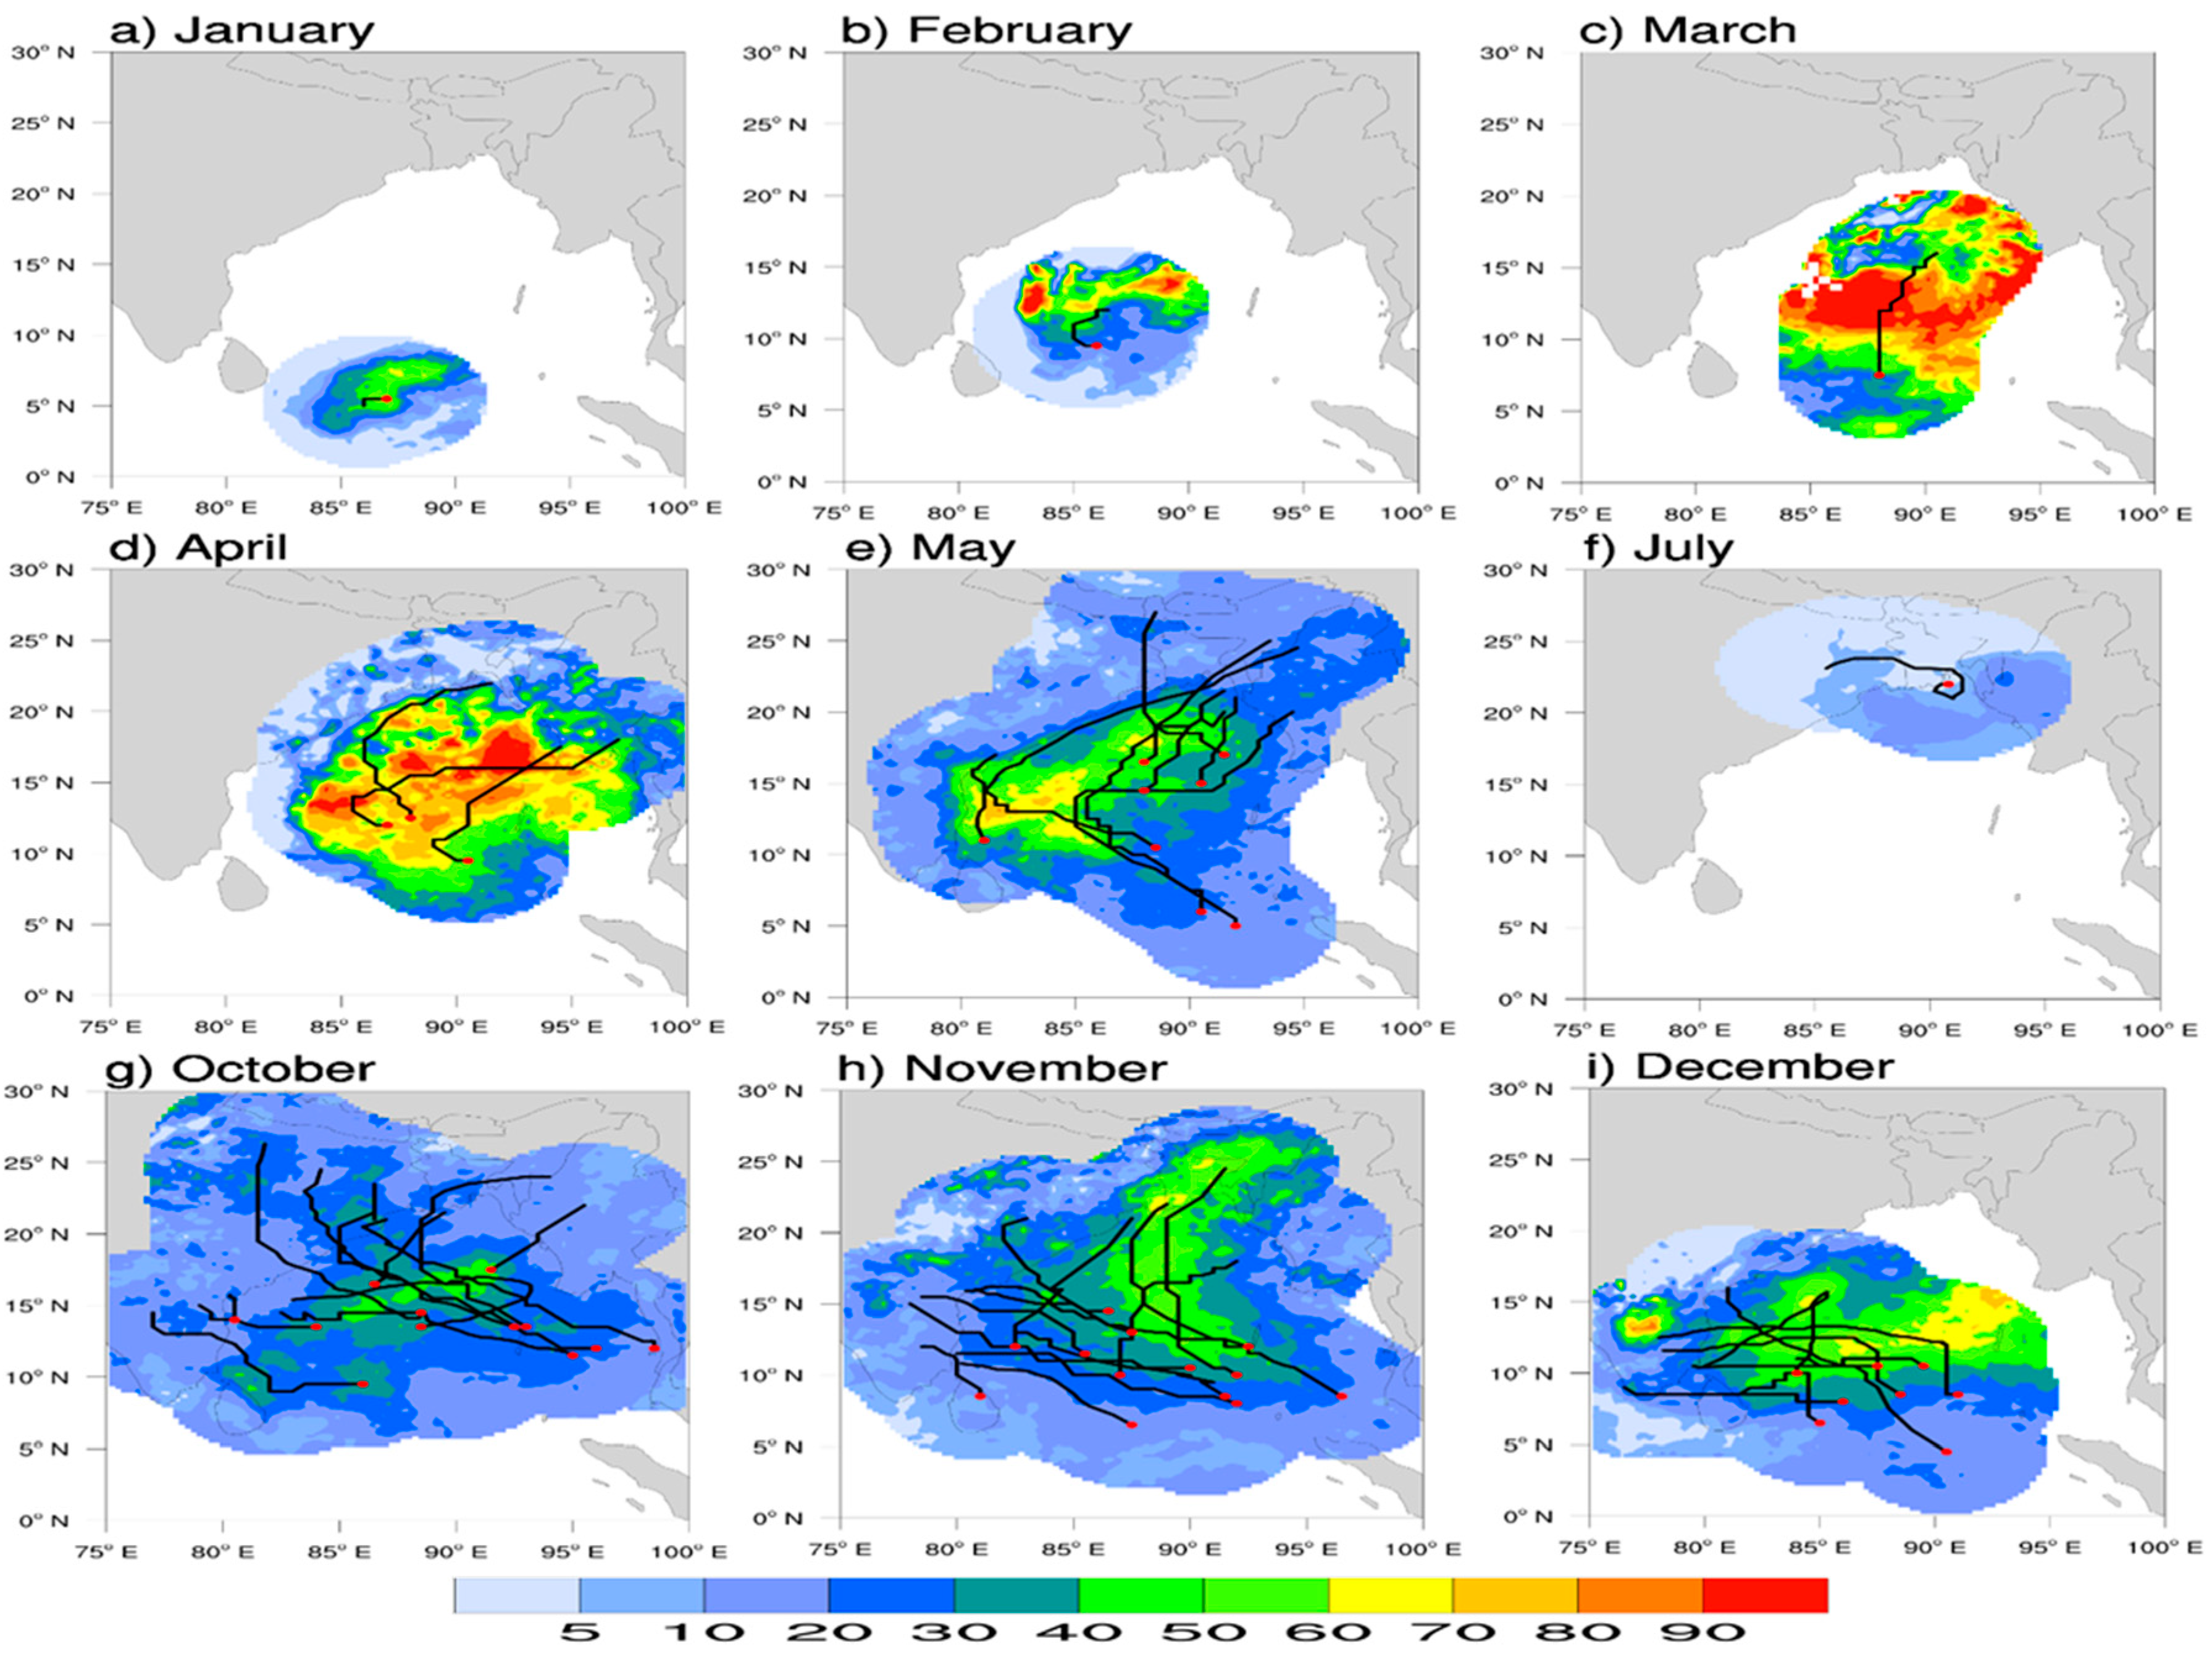
3.3. Spatial Distribution of TC Rainfall

Average TC rainfall and their variability over the BoB during 1998–2016 are shown in Figure 3.
Here, following previous studies [12,13,16,17,18,45,51,52,53,54,55,56], rainfall events that occurred within 500 km radius of the TC center are recognized as TC rainfall. The reason for choosing a 500 km radius from the TCs center is that it is consistent with the range of the TC primary wind circulation region (a 80–400 km radius from the TC center) and with the range of the curved TC cloud shield (a 550–600 km radius) [57]. However, a disadvantage to using a 500 km radius is that rainfall arising with existing troughs/fronts could be included in the totals [45]. A sensitivity test was performed here to justify the method of analyzing TC rainfall contribution using a 500 km radius from the TC center. A sensitivity test showed that TC rainfall changed a little with respect to distance from the TC center for distances larger than 500 km and up to 1000 km (not shown). We used a simple linear interpolation to find the location of the TC center every 3 h for matching the temporal resolution (3 h) of the TRMM 3B42 dataset. Please note that TCs are tracked independently, and the rain-related to every TC is accounted distinctly. For non-TC rainfall, TC rainfall has been subtracted from the total rainfall events. During 1998–2016, the average of total rainfall in the whole area ranged from less than 1 mm day−1 over the inland areas such as the western part of India to above 10 mm day−1 at the east coasts of BoB and over the Meghalaya Plateau (Figure 3a). Such a pattern is consistent with the findings of Prat and Nelson [18]. Similar to the research in other ocean basins [16,45,56], rainfall over the ocean was found to generally be more intense than over land, mostly ranging from 7 to 13 mm day−1. Nevertheless, significant rainfall over land, greater than 5 mm day−1, was also found over the coasts of Bangladesh and Myanmar, and inland areas of Northeast India. TC frequently crossed over the coasts of Bangladesh, Myanmar, and inland areas of Northeast India, and they produced a significant amount of rainfall overland. For the non-TC rainfall, it generally kept the pattern of the total rainfall except that the rainfall over the west portion of BoB was reduced more significantly (Figure 3b). In this area, the rainfall difference of around 2 mm day−1 was found, which is comparable to Prat and Nelson [45] apart from the different area and period. Figure 3c shows the yearly averaged variance for all rainfall events during 1998–2016. There was maximum variance over the ocean along the east coasts of India, and the coasts of Bangladesh and Myanmar, and also over the Meghalaya Plateau area. Overland, the highest variance was over the northeastern part of Bangladesh. After removing the TC rainfall (Figure 3d), the rainfall variance over the whole domain decreased, especially in the west and middle parts of BoB where TCs frequently crossed. Nevertheless, after removing the TCs’ rainfall, the high variance was still found along the west coast of India, almost the whole of Bangladesh, and the west and east coasts of Myanmar.

4. Interannual and Monthly Variability of TC Rainfall

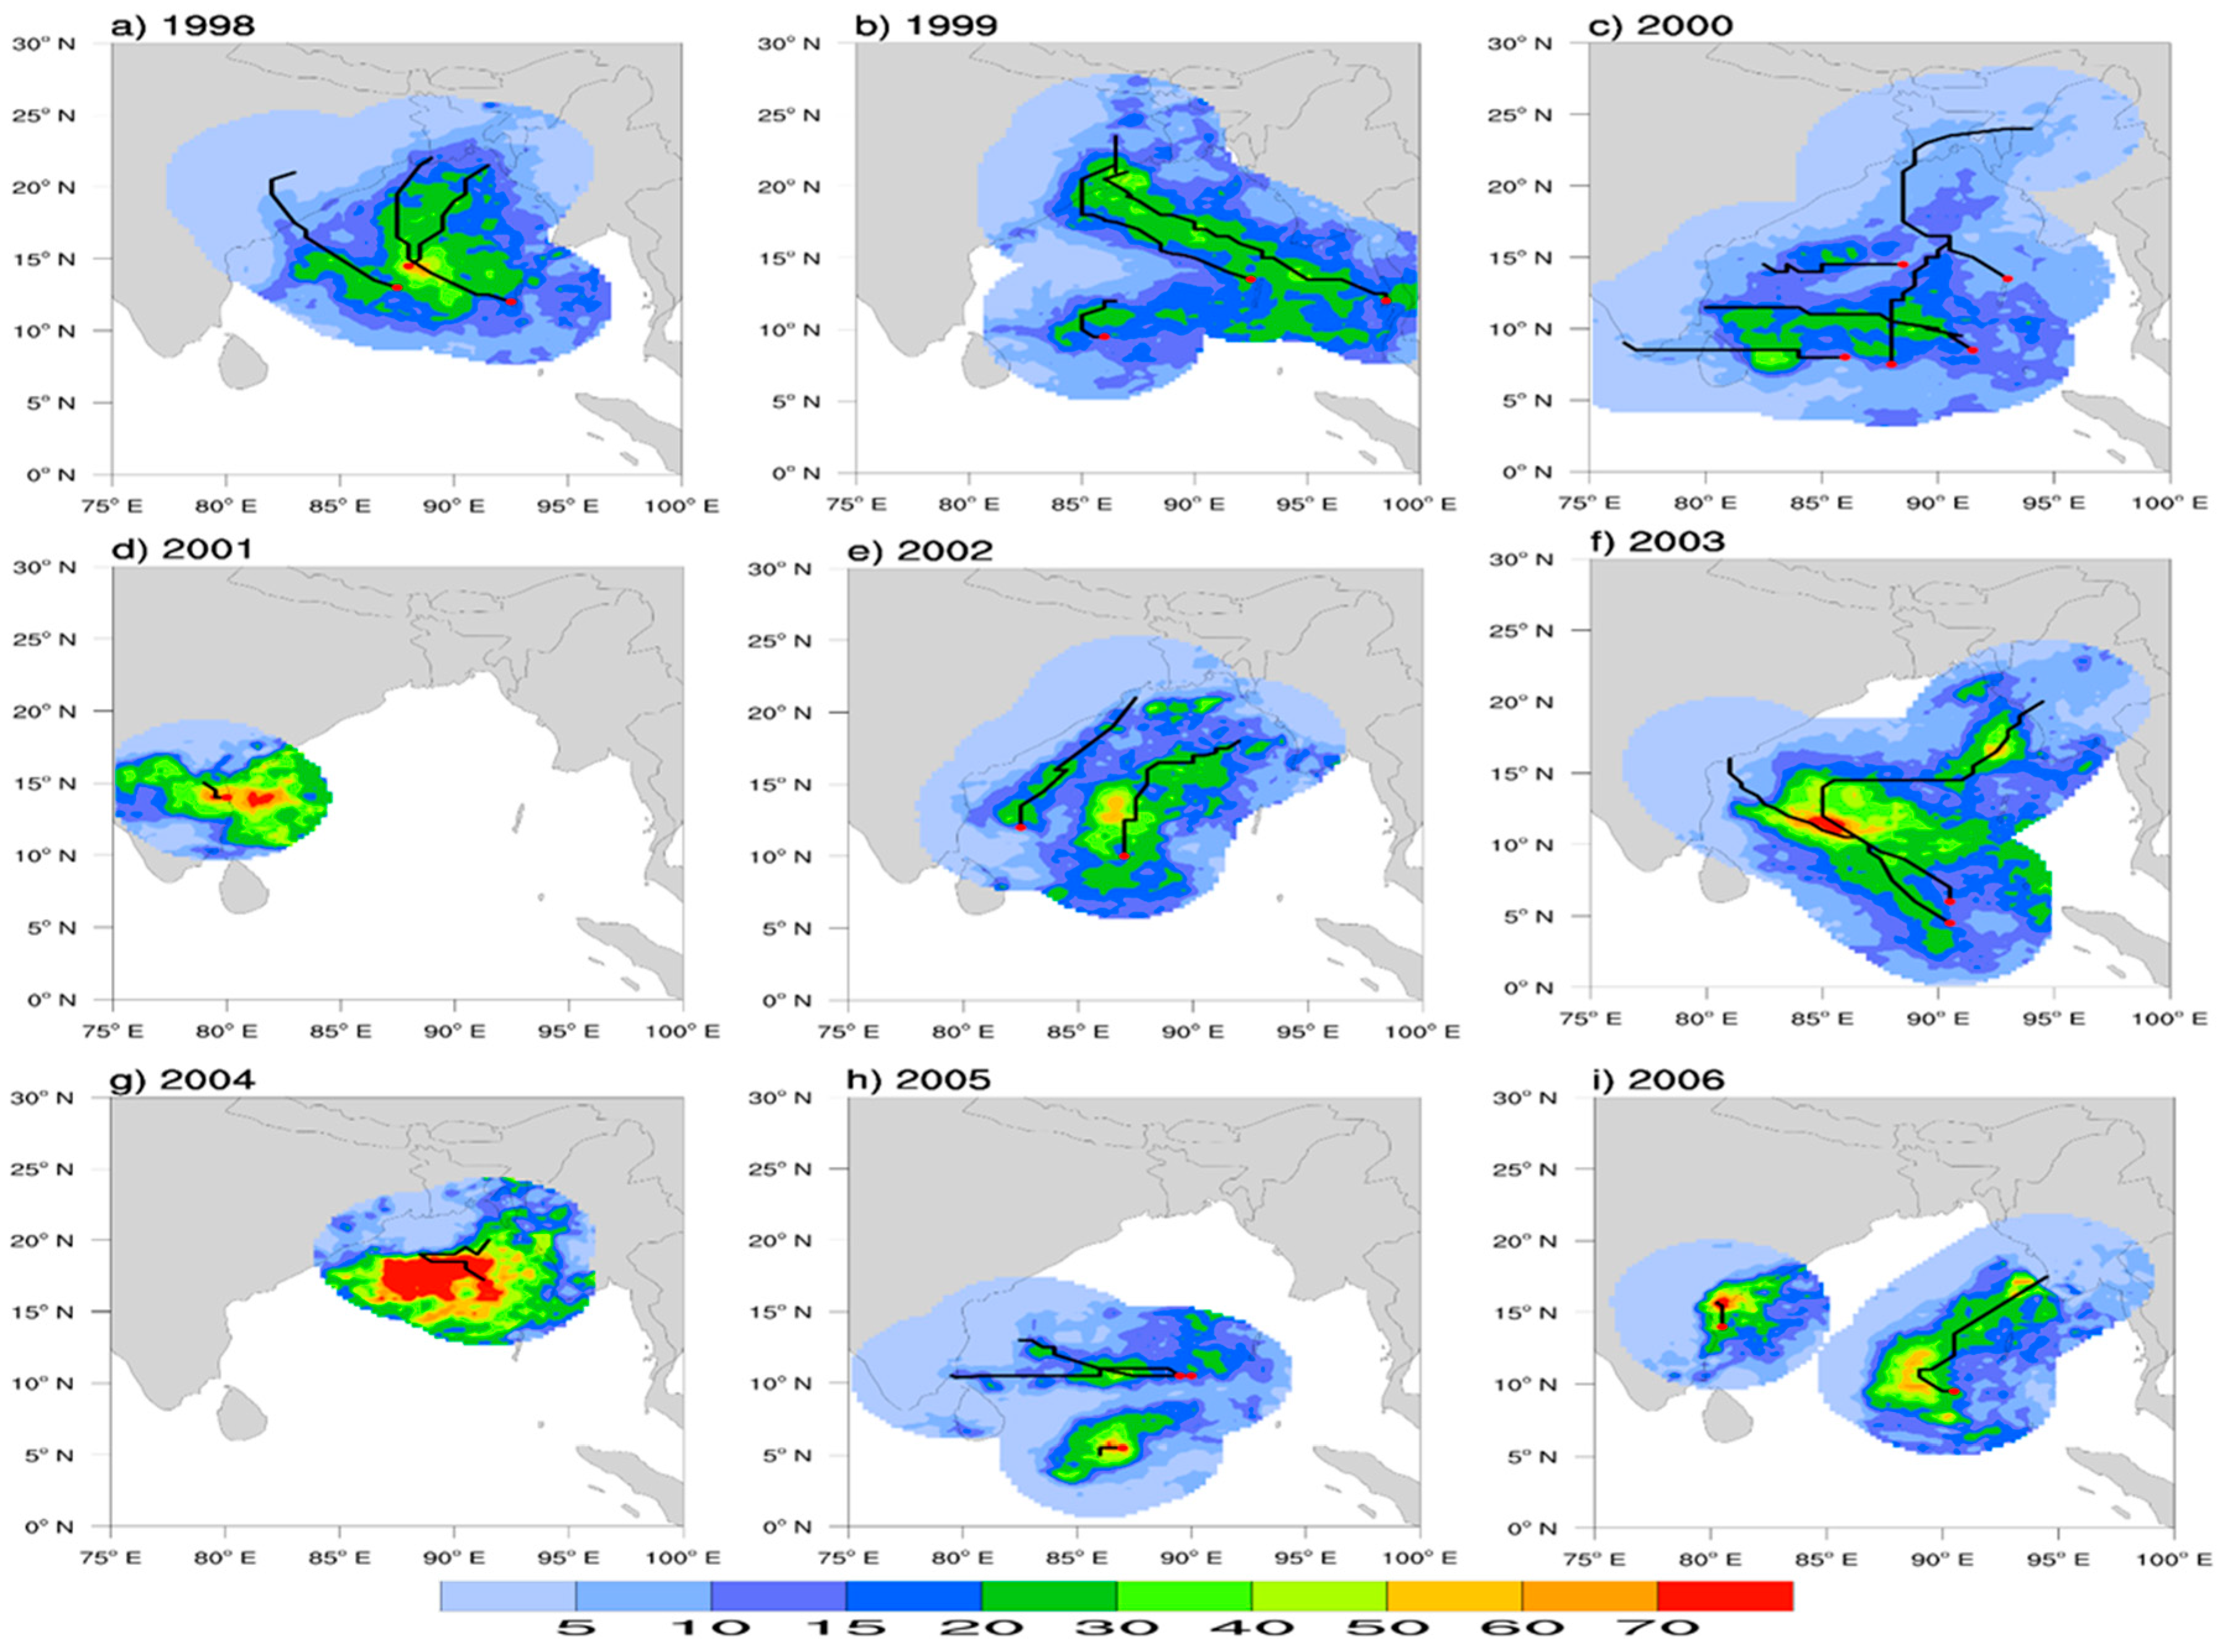
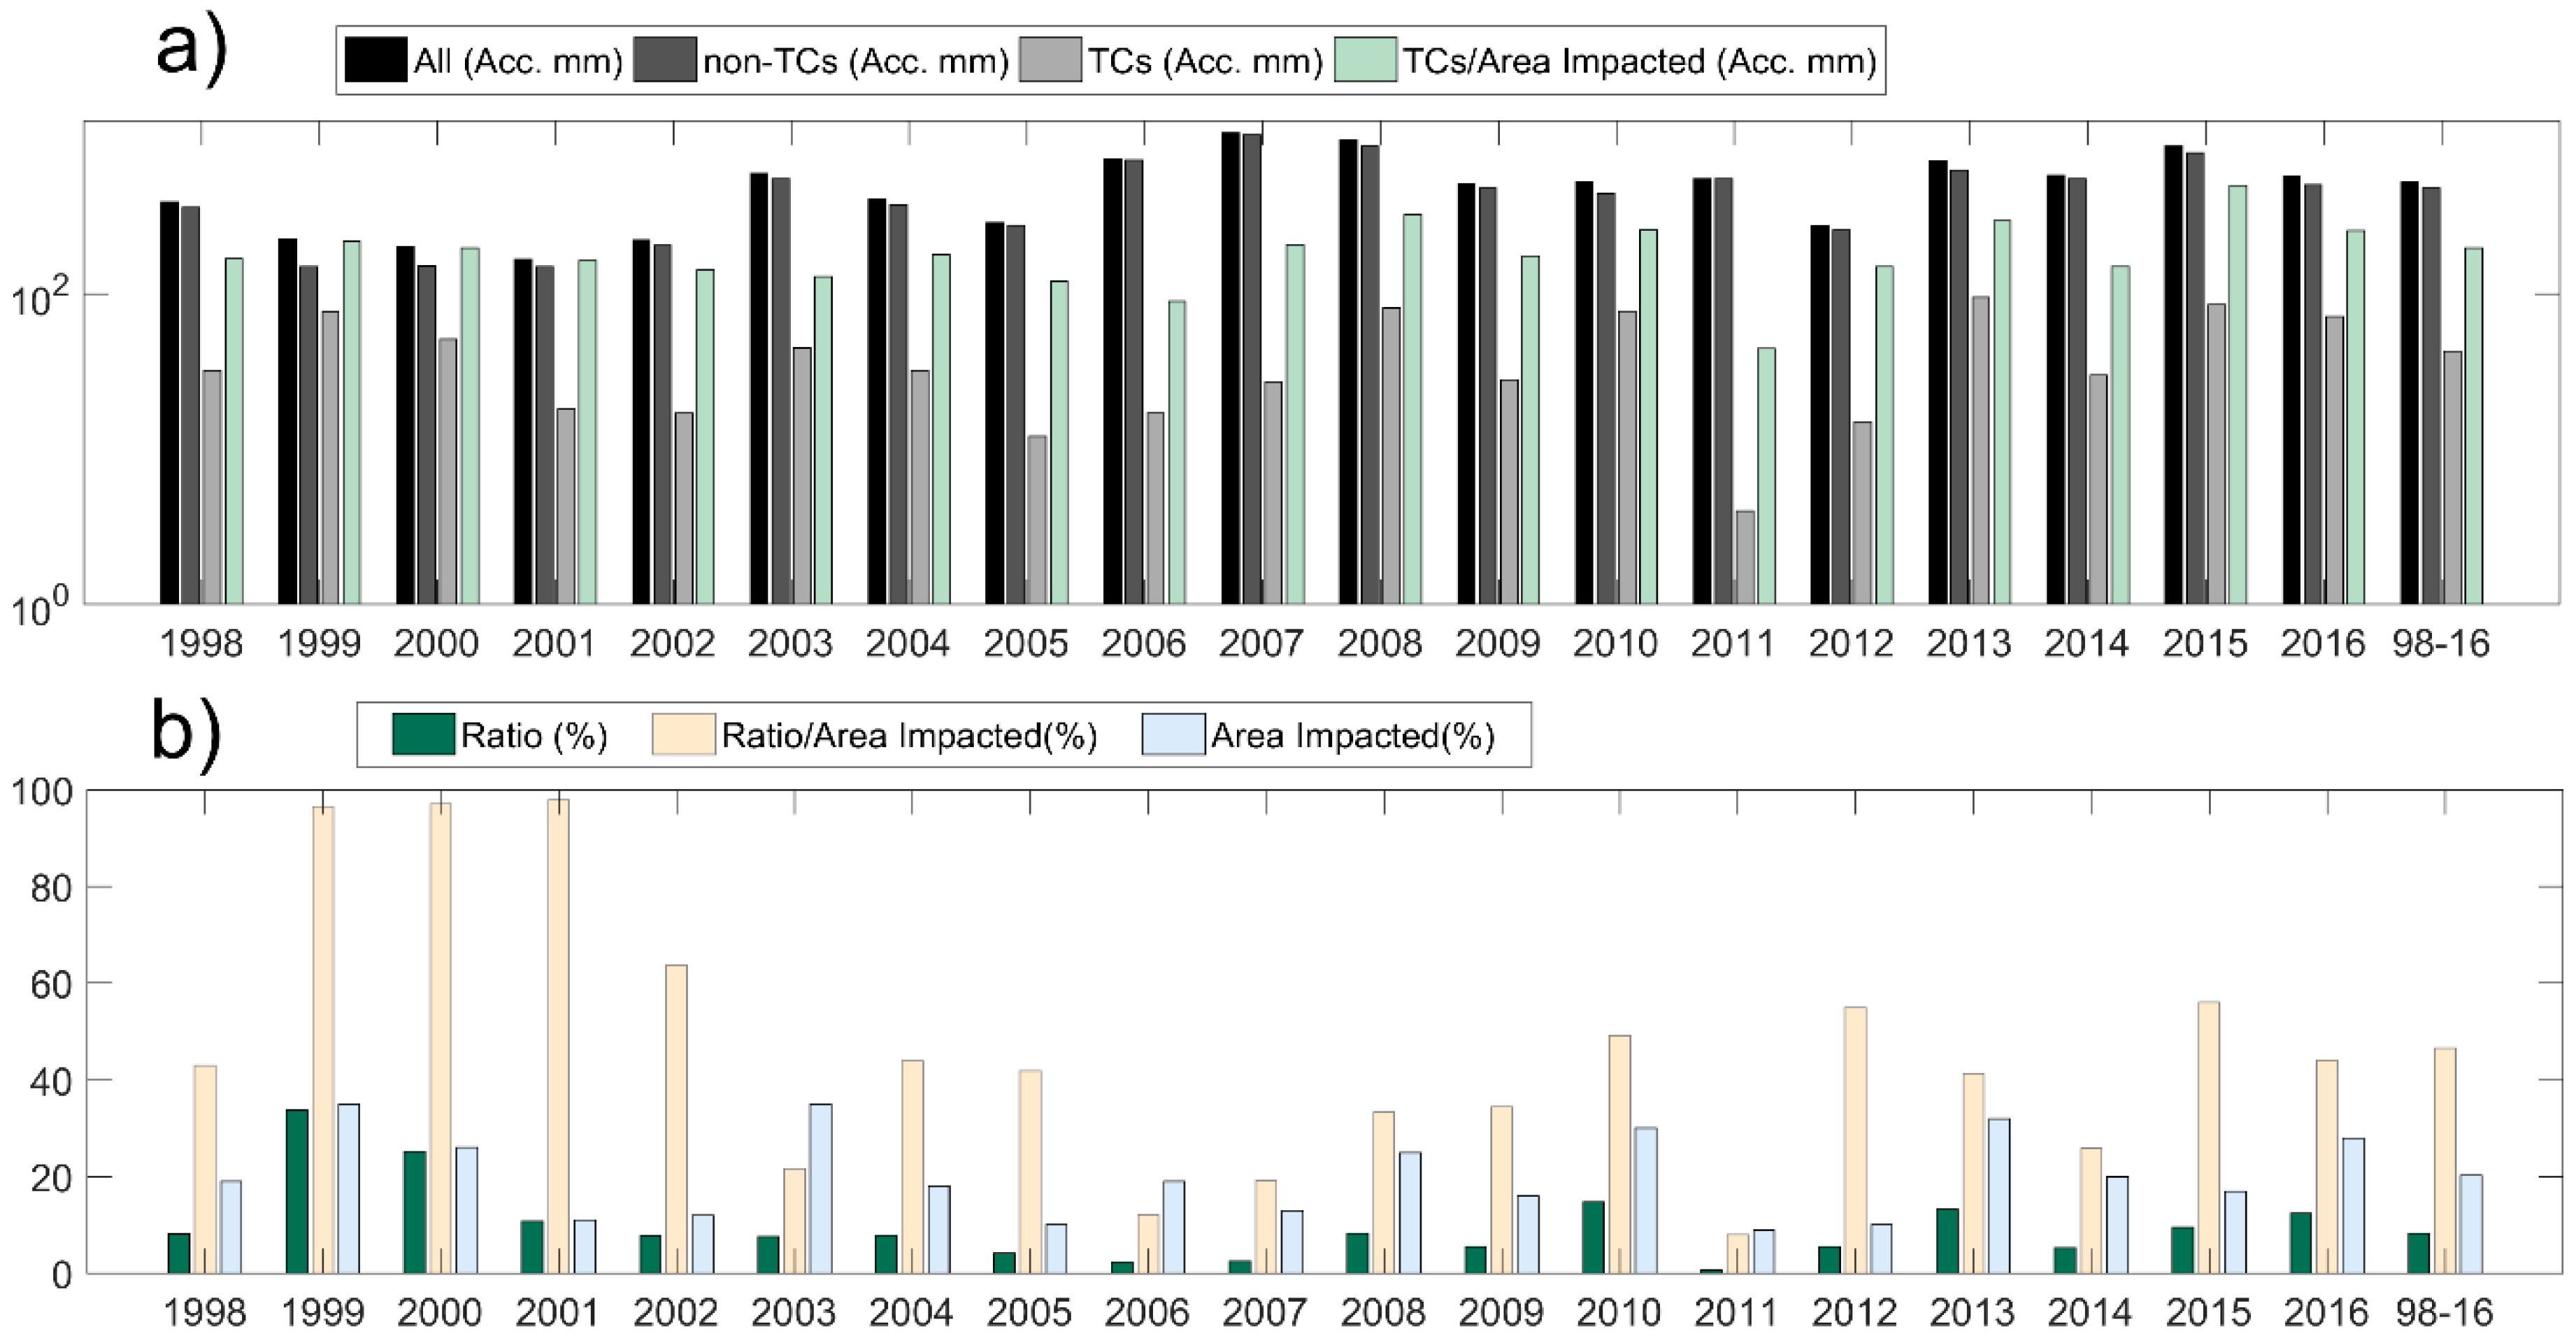
4.1. Interannual Variability of TC Rainfall and Yearly Contribution

Figure 4 and Figure 5 show the interannual variability of TC total rainfall. TC rainfall dominated more over the ocean compared to over the land. Locally, greater than 20 mm TCs’ rainfall frequently observed over the south coast of Bangladesh, east coast of India, and west coast of Myanmar. Insignificant TC rainfall (less than 5 mm) often found over inland areas such as the Meghalaya Plateau and Uttar Pradesh of India. There was strong interannual variation for TC rainfall in regards to the rainfall quantity and location. Specifically, rainfall larger than 30 mm were produced over the Odisha State of India in 1999, 2006, and 2015, Andhra Pradesh of India in 2001, Chittagong of Bangladesh in 2004, the west coast of Myanmar in 2007 and 2015, and the east coast of Sri Lanka in 2012. Figure 6 and Figure 7 reveal yearly TC rainfall contributions from 1998 to 2016. Generally, TC rainfall contribution values larger than 30% and even up to more than 90% were frequently observed, and they were generally higher over ocean than over land, which was caused by the stronger oceanic TC rainfall. Nevertheless, large values were also shown overland, for example, a greater than 50% TC rainfall contribution was observed for the whole of Bangladesh (1999 and 2000), the middle of Myanmar (2000), Andhra Pradesh of India (2001, 2010, and 2016), and Odisha State of India (1999). It is also noted that the maximum TC rainfall contribution is less correlated to the yearly TC number, because a particular TC may contribute a significant amount of rainfall. In 1999, for instance, the ESCS BOB 06, known as the Odisha cyclone, and ESCS BOB 05 both showed greater than 90% local contributions over the Odisha state of India and some parts of Bangladesh. This was also true for the year 2000.
Figure 8 shows yearly rainfall accumulation overland for all rainfall events, non-TCs, and TCs (Figure 8a) in addition to TC rainfall contributions and the percentage of the Area Impacted (AI) (Figure 8b). Here, the AI is defined as the number of grids (TRMM 3B42 rainfall pixels) overland impacted by TCs to all the land grids in the study area. The ratio is calculated by using TC rainfall accumulation divided by total rainfall. During the 19 years, for the yearly rainfall accumulation values of total rainfall, non-TCs and TCs were found to be highly correlated to each other. The highest amounts of total rainfall and non-TCs rainfall were found in 2007 (1083 mm and 1056 mm, respectively) while the lowest amounts were in 2001 (167 mm and 149 mm) (Figure 8a). The maximum amount of TCs rainfall was in 2013 (95 mm), whereas the minimum was in 2011 (4 mm). For the year to year comparison, higher accumulated TC rainfall was found in 1999 (76 mm), 2000 (51 mm), 2008 (81 mm), 2010 (77 mm), 2013 (95 mm), 2015 (85 mm), and 2016 (71 mm), whereas lower TC rainfall was observed in 2001 (18 mm), 2002 (17 mm), 2005 (12 mm), 2006 (17 mm), and 2012 (15 mm). The high TC rainfall in the above-mentioned years was related to the major TCs: BOB 05 (04B) and BOB 06 (05B) (1999), BOB 05 and BOB 06 (2000), Rashmi, Nargis, and Khaimuk (2008), Giri and Jal (2010), Madi, Phailin, Lehar, and Viyaru (2013), and Nada and Roanu (2016). In comparison to the non-TC rainfall, the yearly accumulation of TC rainfall was always smaller. Nonetheless, after being normalized by AI, they were both generally similar to each other. However, strong interannual variation of TC rainfall was still significant after AI normalization, since the value of 2015 (500 mm per AI) was about tenfold of that of 2011 (44 mm per AI).
From 1998 to 2016, an average of 8% of total rainfall overland was contributed by TCs (not shown), while the highest ratio was in 1999 (34%), and the lowest percentage was in 2011 (1%), presenting a thirty-three fold variation (Figure 8b). The reason for the highest ratio overland in 1999 is the comparatively low non-TC rainfall and ESCS BOB 06 and ESCS BOB 05 that produced extreme rainfall, while the lowest ratio in 2011 was caused by the small number of landfall TCs in this year, as only 1 TC was generated and made landfall in 2011 (1 out of total 1 TC). More landfalling TCs were found in 2008 (4 out of 4), 2010 (3 out of 3) and 2013 (5 out of 5), and in these years TCs contributed a higher amount of rainfall overland (Figure 8b). After being normalized by AI, the ratios in these years become large, varying between 30% and 50%, indicating the significant impact of TC rainfall in the TC impacted areas. On average, from 1998 to 2016, 20% of the land area was impacted by TC rainfall in the study domain (not shown), while in the major TC years (1999, 2003, and 2013) more than 30% of the land area was impacted by TC rainfall (Figure 8b). The highest AI has found in 1999 and 2003 (35%) whereas the lowest in 2011 (9%), which was related to the number of landfall TCs and their landward moving distance.

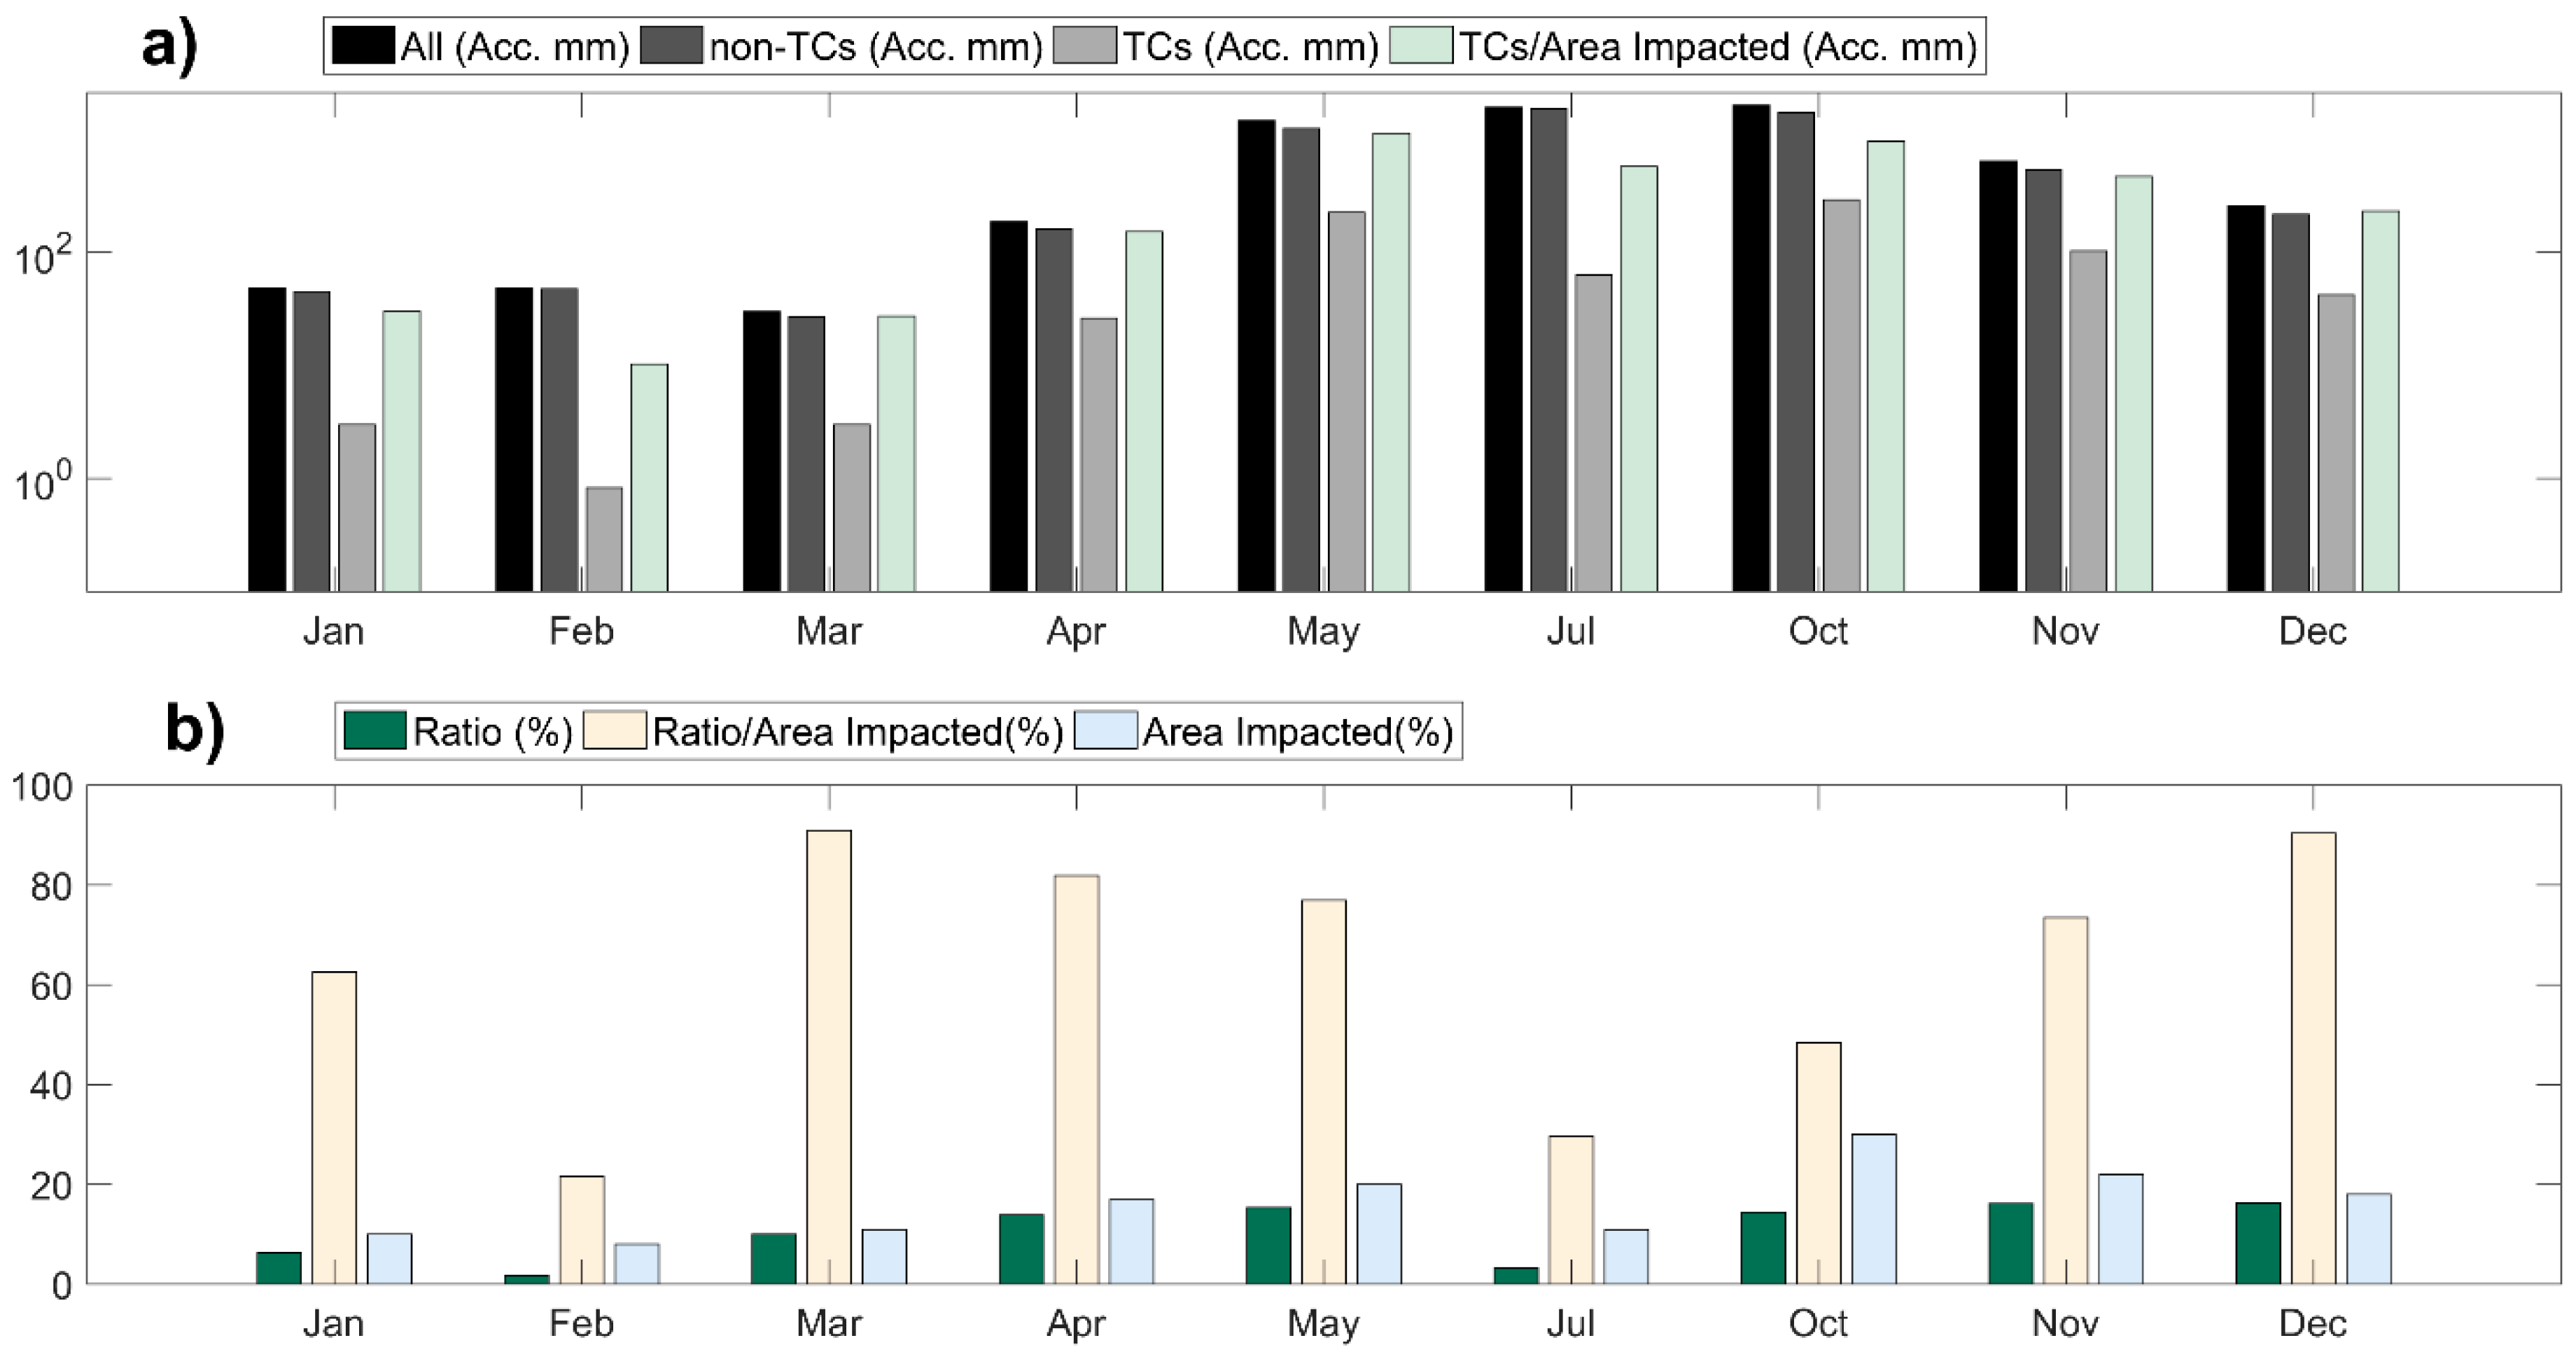
4.2. Monthly TC Rainfall and Their Contribution

Figure 9 shows the monthly average TC rainfall during 1998 to 2016. In this period, the months from January to April showed limited TC activity, and these months provided little rainfall overland (Figure 9). Please note that from January to March, only one TC formed and dissipated over the ocean. In May, more than 10 mm rainfall was found over Bangladesh, Myanmar, Meghalaya Plateau, and the eastern part of India. The months of June, August and September have been excluded from the analysis since the TC activity was absent in these months (Figure 1b). From October to December, although there was a larger number of TCs which made landfall than in other months, the TC rainfall accumulation was relatively small, generally smaller than 20 mm. Figure 10 displays the monthly TC rainfall contribution during the relevant 19 years. From January to April, the maximum contribution was found over the ocean. An insignificant TC rainfall contribution occurred overland during January–March, while land areas with contributions of around 20% were observed in April. In May, the TC rainfall accounted for more than 20% over a large land area of India, Bangladesh, and Myanmar, and values larger than 40% were presented over the eastern part of India. In July, TC rainfall contributions often lower than 5% were observed overland, whereas contributions greater than 10% was found over the Odisha State of India and Myanmar. During October and November, TC rainfall contributions larger than 20% were generally found overland, whereas contributions larger than 40% were found in November over Bangladesh and Meghalaya Plateau. In December, the impact area of TC rainfall over land was smaller compared to the previous two months, but TCs contributed more than 80% rainfall over the Andhra Pradesh region of India due to the specifically dry climate there.
Figure 11 shows monthly accumulated rainfall overland for all events, non-TCs, and TCs (Figure 11a), and the area affected by TC rainfall along with the contribution of TC rainfall overland (Figure 11b). During pre-monsoon (January-April), lower accumulated rainfall was found for all events, non-TCs, and TCs (Figure 11a). TCs’ accumulated rainfall was smaller than 5 mm from January to March while in April it was 26 mm. The month July produced 63 mm TC rainfall. For the maximum TC activity months (May, October, and November), the highest accumulated TC rainfall was in October (291 mm) while the lowest was in November (103 mm). After being normalized by AI, the values of TC rainfall per AI are similar to those of non-TC. TC rainfall per AI was also lower during pre-monsoon months, whereas it was higher in the monsoon and post-monsoon period. It can be seen from Figure 11b that, less than 20% of TC rainfall contribution was found overland in May, October, November, and December. The maximum TC rainfall contribution was in November and December (16%) while the minimum was in February (2%). For the AI, the maximum land area impacted by TC rainfall was in October (30%) whereas the minimum was in February (8%). In total, 11% of the researched areas were impacted during the monsoon months while this was increased during pre-monsoon months. After being normalized by AI, the difference in ratios between pre-monsoon and post-monsoon was small.

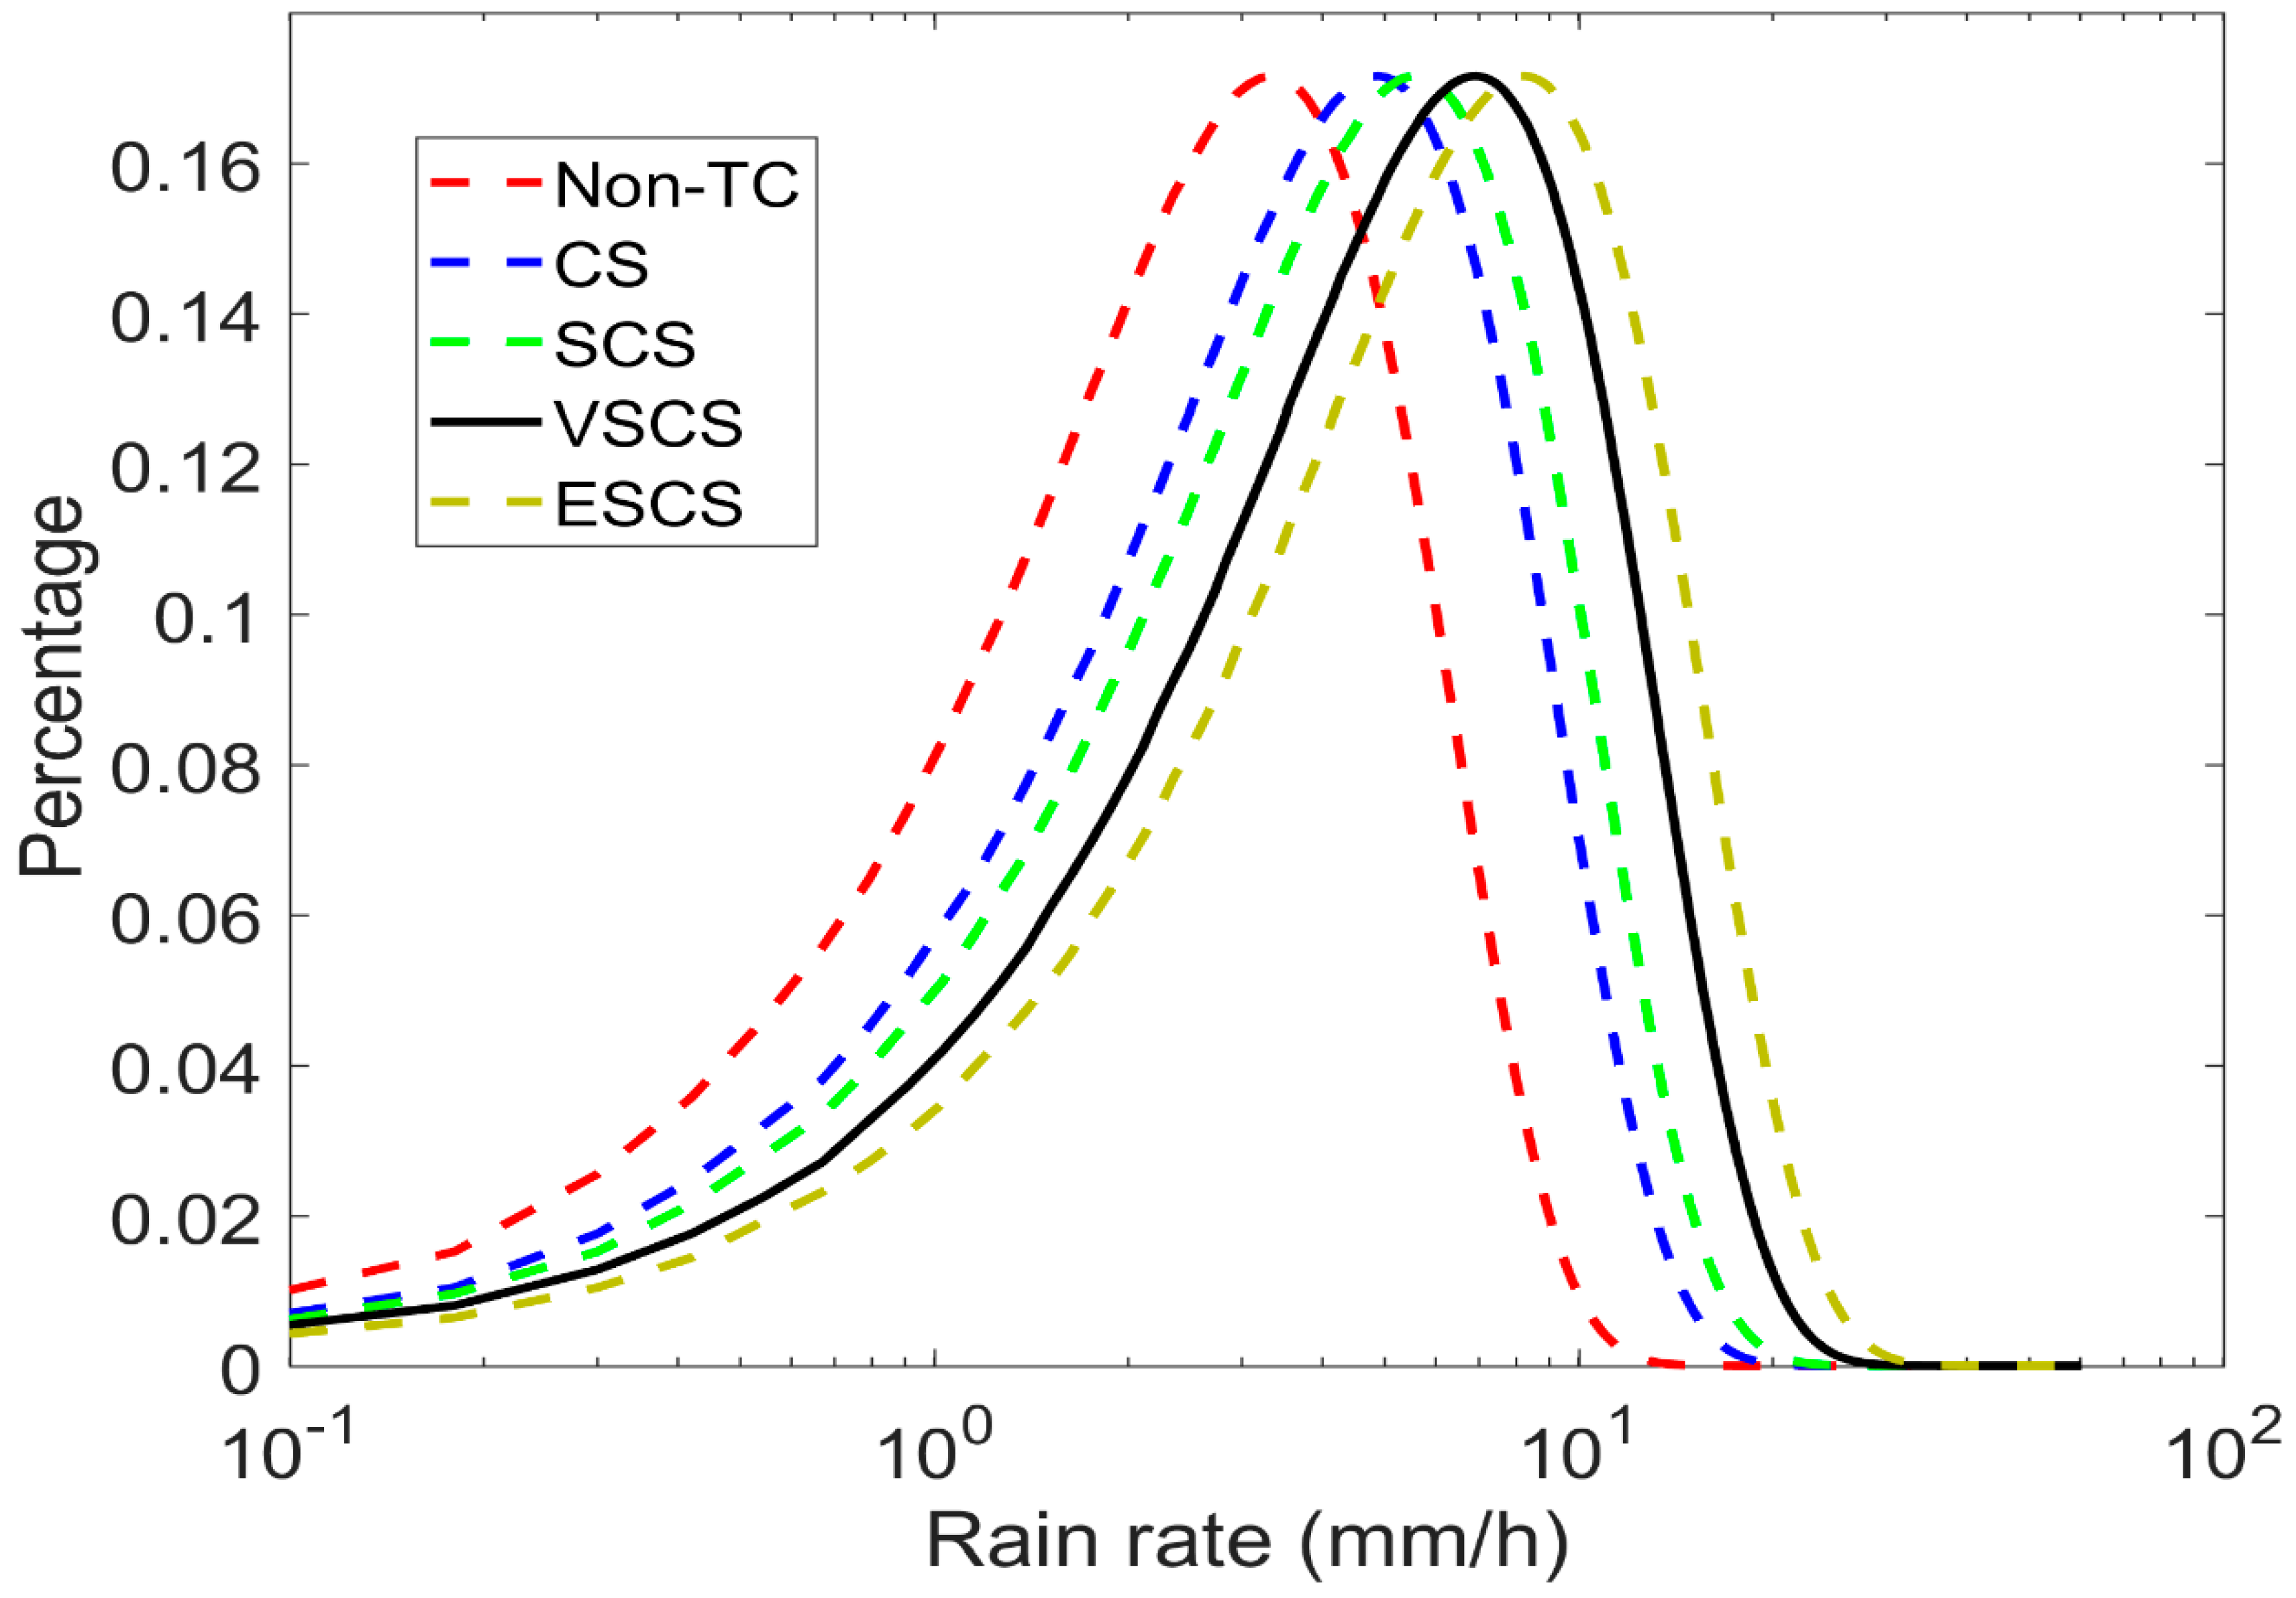
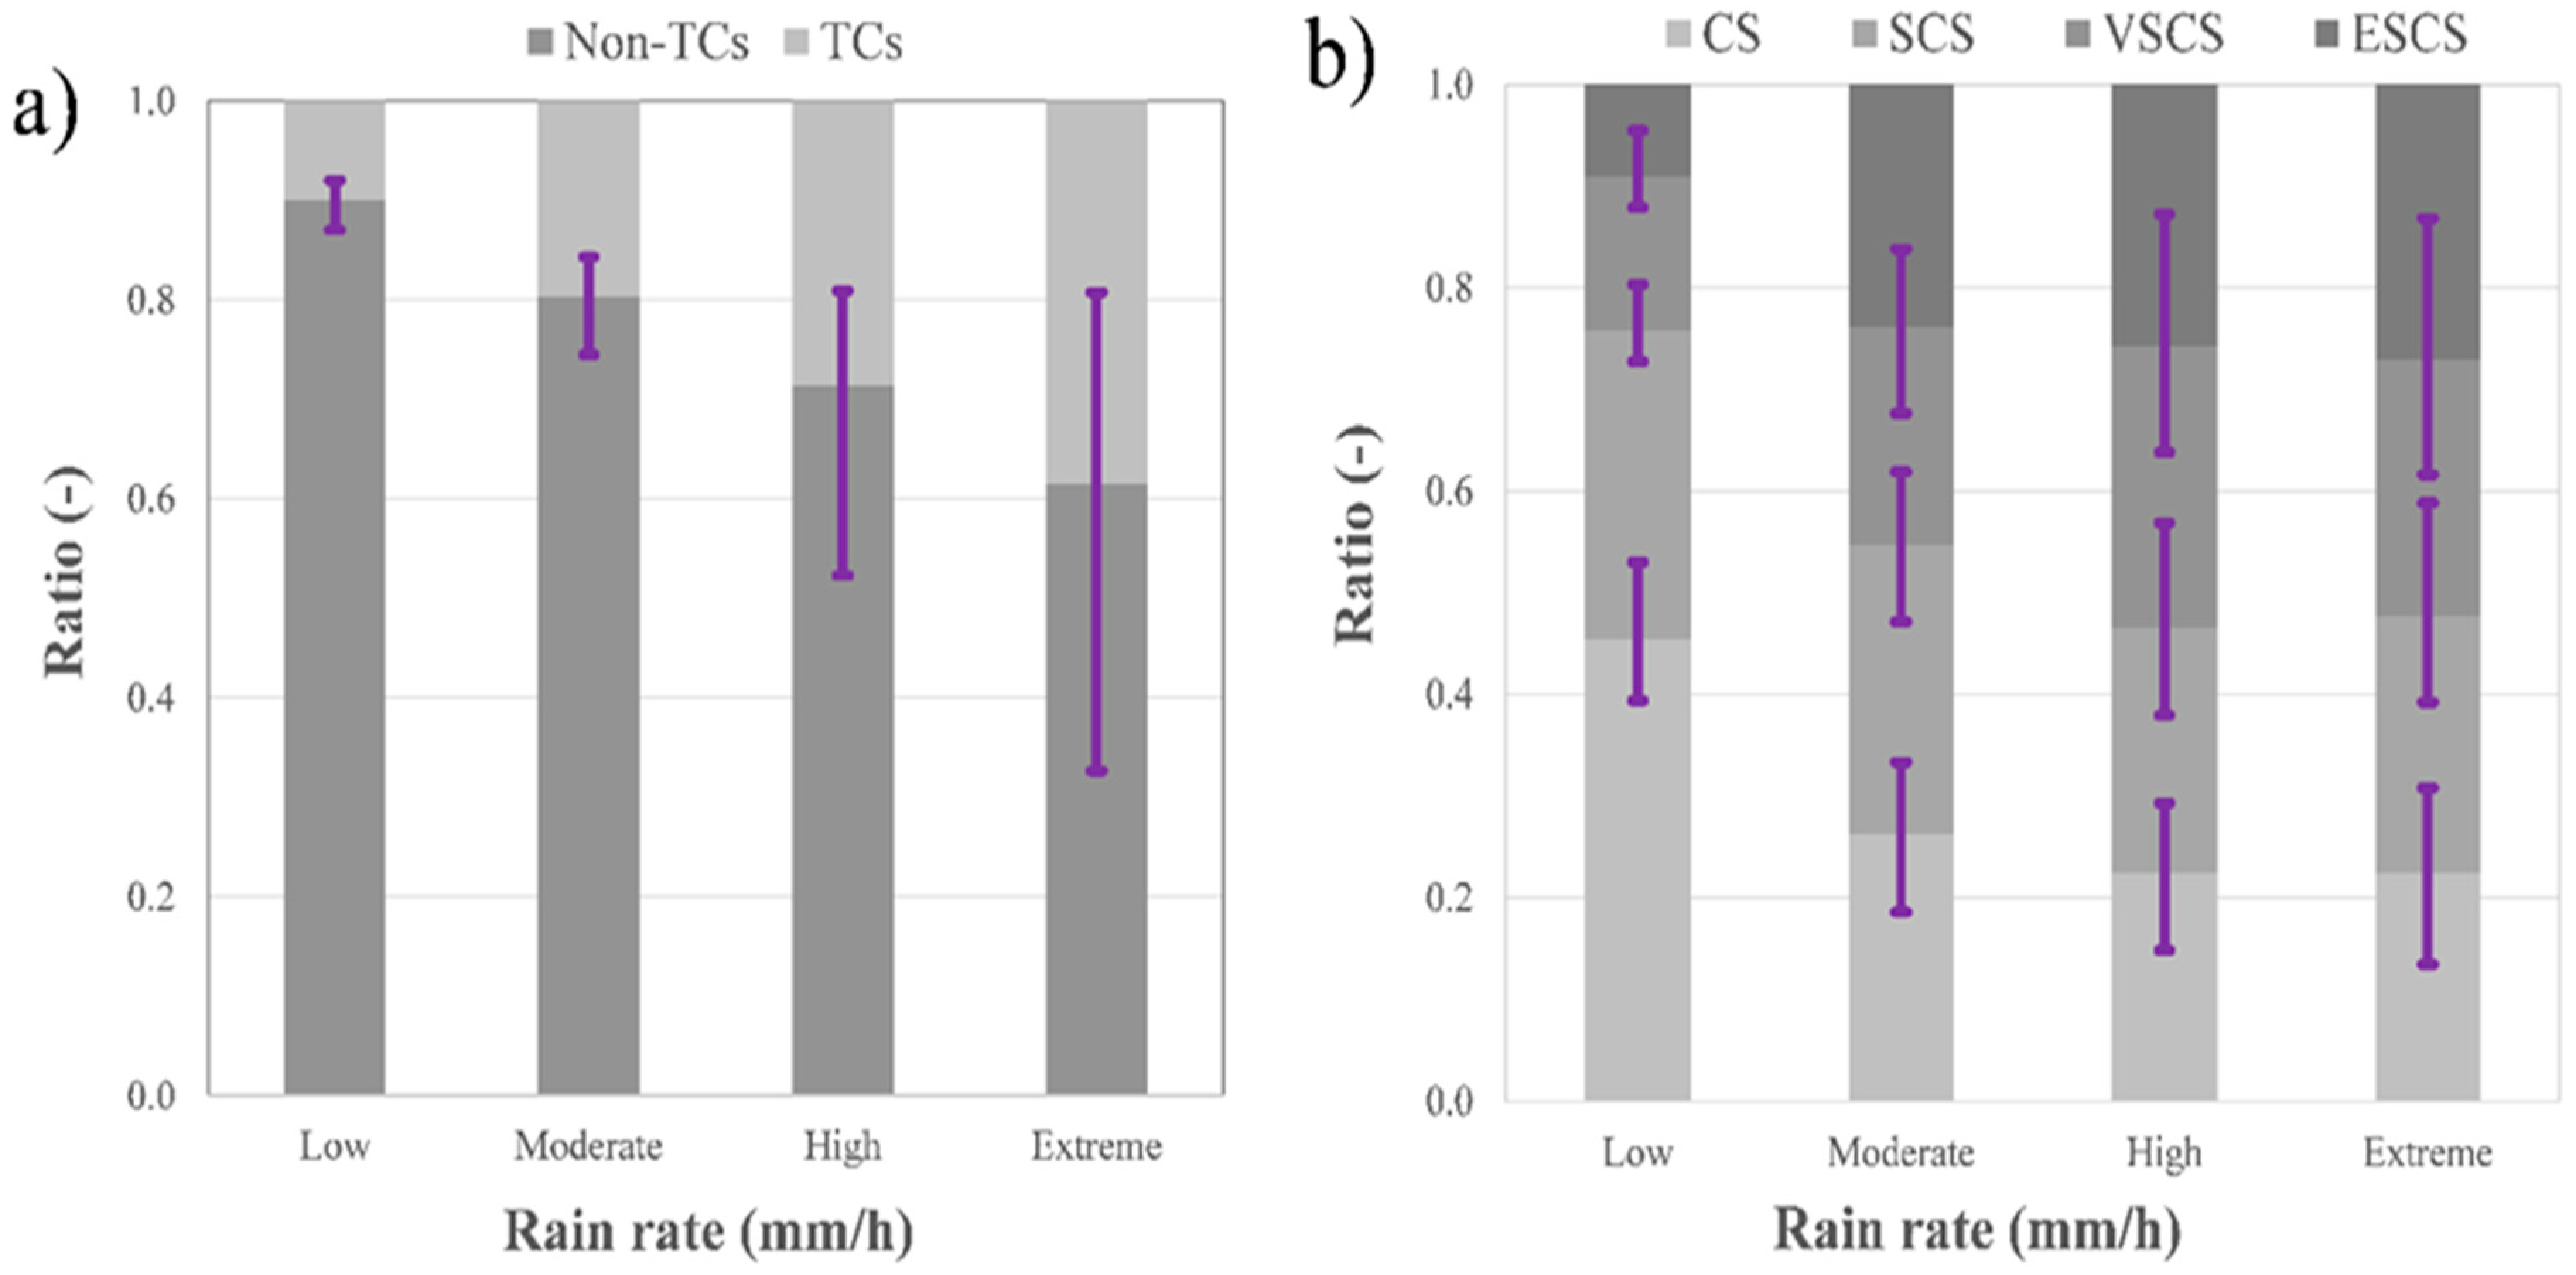
5. The Relation between TCs and Extreme Rainfall

Table 1 describes the annual contribution based on the rainfall category and TCs intensity groups. It was found that TCs contributed 8% of the total rainfall overland in the study area (Table 1). Large differences between the contributions of CSs (3.61%) and ESCSs (2.71%) of the total rainfall were found (Table 1). For an average TC, its annual contribution was not correlated with the TC intensity, and the rainfall contribution of an average ESCS (0.3%) was the largest, followed by the average CS (0.2%), while the contribution of an average SCS and VSCS was the smallest (0.1%). This phenomenon suggested that there was little correlation between TC rainfall contribution and TC intensity; for example, ESCS Nargis (2008) was extremely intense but did not show large TC rainfall. Prat and Nelson [45] also reported that intense TCs was not necessarily related to heavy rainfall, even though they frequently caused torrential rainfall within a short period and over large areas. A similar result was found by Konard et al. [58] as well.
Figure 12 shows the probability density function of different rainfall intensities for various rainfall types (Non-TC, CS, SCS, VSCS, and ESCS) over land. For all the TC categories, the shapes of their probability density function were similar, with the exception that the peak probability value shifts to larger rainfall with an increasing TC intensity. This is to say, if normalized by AI (or, if the impacted areas are the same), stronger TC tends to produce heavier rainfall. However, the rainfall area of a TC is not strictly related to TC intensity, so that TC categories with higher intensity do not provide higher rainfall contribution (Table 1). Lin et al. [59] also showed that the TC rainfall rate increases markedly with TC intensity, but the rainfall area changes little with TC intensity.
Figure 13a shows land-ocean variability and indicates the ratio of TC rainfall overland /ocean in terms of 4 rainfall categories. The ratio of TC rainfall was 10% for low rain rates (0–1 mm h−1), 20% for moderate rain rates (1–10 mm h−1), 28% for high rain rates (10–20 mm h−1), and 38% for extreme rain rates (larger than 20 mm h−1), showing that TCs were a major source of extreme rainfall. Figure 13b further shows the rainfall ratio of different TC categories for the 4 rainfall categories, and it can be seen that TCs with higher intensity tend to produce stronger rainfall, consistent with the probability density function distribution. For example, CS TCs produce 55% rainfall of low rain rates but only 10% of extreme rain rates, while ESCS produce 3% of low rain rates but 24% of extreme rain rates. These results are comparable with a previous study in the southeastern United States [45]. They showed that the rainfall ratio of major hurricanes (CAT12 and CAT35) kept increasing from low rain rates to high rain rates, while the rainfall ratio of the tropical storms/depressions (TD/TS) kept decreasing.

6. Summary and Conclusions

In this study, TC rainfall contribution in the Bay of Bengal during 1998–2016 was examined using the rainfall data of TRMM. In this period, a total of 47 (a yearly average of 2.47) TCs crossed the BoB, and 31 of them made landfall. The years 2001, 2004, 2011, 2012, 2014, and 2015 had the weakest TC activity with only 1 TC, while the years 2000 and 2013 showed the most TCs with a number of 5, indicating a significant interannual variation. On a monthly scale, TC activity was strong in pre-monsoon (8 TCs in May) and post-monsoon months (12 TCs in October, and 13 TCs in November), and the weakest in the period of January–April with only 1–3 TCs per month. TCs with weak intensity were more inclined to generate over the west part of BoB and made landfall on the east coast of India and south coast of Bangladesh, while most of the ESCSs formed in the east part of BoB and tended to move either northwest or northeast and made landfall on the east coast of India, south coast of Bangladesh, and west coast of Myanmar.
During 1998–2016, the average of total rainfall in the whole area ranged from smaller than 1 mm day−1 over the inland areas such as the western part of India to above 12 mm day−1 at the east coasts of BoB and over the Meghalaya Plateau. The non-TC rainfall generally kept the pattern of the total rainfall except that the rainfall over the west portion of BoB was reduced more significantly, due to the fact that this was the place where TCs frequently crossed. Similarly, the rainfall variance in the west parts of BoB decreased largely after removing the TC rainfall.
Similar to the yearly number of TCs, there was also a strong interannual and monthly variation for TC rainfall in regards to the rainfall quantity and contribution. A TC’s maximum rainfall quantity and contribution were generally found over the ocean and along the TC’s track area. When TCs moved inland and made landfall, their rainfall quantity and contribution reduced significantly.
On average, TC rainfall contributed 8% of the total overland precipitation in the studied domain. This result can be compared with references [9,10,17,45] who found 5–10%, 6%, 7–8%, and 7% rainfall contribution from TCs in the Southeastern United States and NIO, respectively.
For the entire period of study, TC’s interannual rainfall contribution varied from 1% (2011) to 34% (1999). It is noted that a particular TC might contribute a significant amount of rainfall, which means that the maximum TC rainfall contribution is less correlated to the yearly TC number. For example, two TCs (BOB 05 and BOB 06) in 1999 showed greater than 90% local contributions over the Odisha state of India and some parts of Bangladesh. On a monthly basis, January–March showed an insignificant TC rainfall contribution overland, whereas land areas with contribution around 20% were observed in April. In May, the TC rainfall accounted for more than 20% over a large land area of India, Bangladesh, and Myanmar, and values larger than 40% were presented over the eastern part of India. In July, generally, TC rainfall contribution lower than 5% was observed overland, while contributions greater than 10% was found over the Odisha State of India and Myanmar. From October to November TC rainfall contribution was frequently greater than 20% overland, while contributions larger than 40% were found in November over Bangladesh and Meghalaya Plateau. In December, TCs contributed more than 80% rainfall over the Andhra Pradesh of India due to the local dry climate. During the 19 years, for the entire domain overland, the highest TC rainfall contribution was in November and December (16%), while the lowest was in February (2%).
According to the rain rates’ PDF distribution, stronger TC tended to produce a higher percentage of heavier rainfall, and strong TCs were a major source of extreme rainfall. For instance, cyclonic storms produced 55% of rainfall with low rain rates but only 10% of extreme rain rates, whereas ESCS produced 3% of low rain rates but 24% of extreme rain rates. Nevertheless, little correlation was found between TC rainfall contribution and TC intensity, because the TC rainfall contribution was also influenced by the TC rainfall area and frequency, and as well as by the occurrence of other rainfall systems.
In this study, although the study period was extended to 19 years, the long-term trend of TC’s rainfall contribution was hardly discerned. Moreover, using a constant 500 km radius to identify TC rainfall regardless of tracking the rain shield separately for every single TC is arguably a biased measure. This is especially so when the rainfall systems are not tropical or combined with remaining troughs and fronts, meaning the TC’s total rainfall was possibly overestimated. The use of a larger dataset and more detailed analysis will be carried out in future study to further identify TC rainfall characteristics in the BoB region.

Author Contributions

Conceptualization, Y.L. and K.K.C.; methodology, Y.L. and K.K.C.; software, M.J.U.; formal analysis, M.J.U., Y.L., K.K.C., Z.M.N., H.W., L.W., and Z.G.; investigation, M.J.U., Y.L., K.K.C., Z.M.N., H.W., L.W., and Z.G.; resources, M.J.U., Y.L. and K.K.C.; writing— M.J.U., Y.L. and K.K.C.; writing—review and editing, M.J.U., Y.L., K.K.C., Z.M.N., H.W., L.W., and Z.G.; visualization, M.J.U.; supervision, Y.L. and K.K.C.

Funding

This study was supported by the National Key Projects of Ministry of Science and Technology of China (2018YFC1506405), National Natural Science Foundation of China (41675009).

Acknowledgments

We are grateful to the Indian Meteorological Department for the TCs best track data. U.J. is thankful to Dennis Shea, Mary Haley and Adam Phillips in NCAR, and Rashed Mahmood in Barcelona Supercomputing Center for their help during data analysis.

Conflicts of Interest

The authors declare no conflict of interest.

References

  1. Neumann, C.J. Global Guide to Tropical Cyclone Forecasting; World Meteorological Organization: Geneva, Switzerland, 1993; Available online: https://library.wmo.int/doc_num.php?explnumid=9598 (accessed on 2 November 2019).
  2. Alam, E.; Dominey-Howes, D. A new catalogue of tropical cyclones of the northern Bay of Bengal and the distribution and effects of selected landfalling events in Bangladesh. Int. J. Climatol. 2015, 35, 801–835. [Google Scholar] [CrossRef]
  3. Chowdhury, A.M. Cyclones in Bangladesh. In Disaster in Bangladesh: Selected Readings; Nizamuddin, K., Ed.; Department of Geography and Environment, University of Dhaka: Dhaka, Bangladesh, 2001; pp. 61–76. [Google Scholar]
  4. Prakash, S.; Mahesh, C.; Gairola, R.M.; Pal, P.K. Comparison of high-resolution TRMM-based precipitation products during tropical cyclones in the North Indian Ocean. Nat. Hazards. 2012, 61, 689–701. [Google Scholar] [CrossRef]
  5. Das, S.K.; Gupta, R.K.; Varma, H.K. Flood and drought management through water resources development in India. WMO Bull. 2007, 56, 179–188. [Google Scholar]
  6. Peduzzi, P.; Chatenoux, B.; Dao, H.; De Bono, A.; Herold, C.; Kossin, J.; Mouton, F.; Nordbeck, O. Global trends in tropical cyclone risk. Nat. Clim. Chang. 2012, 2, 289–294. [Google Scholar] [CrossRef]
  7. Woodruff, J.D.; Irish, J.L.; Camargo, S.J. Coastal flooding by tropical cyclones and sea-level rise. Nature 2013, 504, 44–52. [Google Scholar] [CrossRef] [PubMed]
  8. Knight, D.B.; Davis, R.E. Climatology of tropical cyclone rainfall in the southeastern United States. Phys. Geogr. 2007, 28, 126–147. [Google Scholar] [CrossRef]
  9. Knight, D.B.; Davis, R.E. Contribution of tropical cyclones to extreme rainfall events in the southeastern United States. J. Geophys. Res. Atmos. 2009, 114, 1–17. [Google Scholar] [CrossRef]
  10. Kunkel, K.E.; Easterling, D.R.; Kristovich, D.A.R.; Gleason, B.; Stoecker, L.; Smith, R. Recent increases in U.S. heavy precipitation associated with tropical cyclones. Geophys. Res. Lett. 2010, 37, 2–5. [Google Scholar] [CrossRef]
  11. Villarini, G.; Smith, J.A. Flood peak distributions for the eastern United States. Water Resour. Res. 2010, 46. [Google Scholar] [CrossRef]
  12. Hernández Ayala, J.J.; Matyas, C.J. Spatial distribution of tropical cyclone rainfall and its contribution to the climatology of Puerto Rico. Phys. Geogr. 2018, 39, 1–20. [Google Scholar] [CrossRef]
  13. Lavender, S.L.; Abbs, D.J. Trends in Australian rainfall: Contribution of tropical cyclones and closed lows. Clim. Dyn. 2013, 40, 317–326. [Google Scholar] [CrossRef]
  14. Villarini, G.; Denniston, R.F. Contribution of tropical cyclones to extreme rainfall in Australia. Int. J. Climatol. 2016, 36, 1019–1025. [Google Scholar] [CrossRef]
  15. Wu, Y.; Wu, S.; Zhai, P. The impact of tropical cyclones on Hainan Island’s extreme and total precipitation. Int. J. Climatol. 2007, 27, 1059–1064. [Google Scholar] [CrossRef]
  16. Lau, K.M.; Zhou, Y.P.; Wu, H.T. Have tropical cyclones been feeding more extreme rainfall? J. Geophys. Res. Atmos. 2008, 113. [Google Scholar] [CrossRef]
  17. Jiang, H.; Zipser, E.J. Contribution of Tropical Cyclones to the Global Precipitation from Eight Seasons of TRMM Data: Regional, Seasonal, and Interannual Variations. J. Clim. 2010, 23, 1526–1543. [Google Scholar] [CrossRef]
  18. Prat, O.P.; Nelson, B.R. Mapping the world’s tropical cyclone rainfall contribution over land using the TRMM Multi-satellite Precipitation Analysis. Water Resour. Res. 2013, 49, 7236–7254. [Google Scholar] [CrossRef]
  19. Prat, O.P.; Nelson, B.R. On the link between tropical cyclones and daily rainfall extremes derived from global satellite observations. J. Clim. 2016, 29, 6127–6135. [Google Scholar] [CrossRef]
  20. Bagtasa, G. Contribution of tropical cyclones to rainfall in the Philippines. J. Clim. 2017, 30, 3621–3633. [Google Scholar] [CrossRef]
  21. Scoccimarro, E.; Gualdi, S.; Villarini, G.; Vecchi, G.A.; Zhao, M.; Walsh, K.; Navarra, A. Intense precipitation events associated with landfalling tropical cyclones in response to a warmer climate and increased CO2. J. Clim. 2014, 27, 4642–4654. [Google Scholar] [CrossRef]
  22. Singh, O.P.; Ali Khan, T.M.; Rahman, M.S. Changes in the frequency of tropical cyclones over the North Indian Ocean. Meteorol. Atmos. Phys. 2000, 75, 11–20. [Google Scholar] [CrossRef]
  23. Singh, O.P.; Ali Khan, T.M.; Rahman, M.S. Has the frequency of intense tropical cyclones increased in the north Indian Ocean? Curr. Sci. 2001, 80, 575–580. [Google Scholar]
  24. Alam, M.M.; Hossain, M.A.; Shafee, S. Frequency of Bay of Bengal cyclonic storms and depressions crossing different coastal zones. Int. J. Climatol. 2003, 23, 1119–1125. [Google Scholar] [CrossRef]
  25. Pattanaik, D.R. Variability of oceanic and atmospheric conditions during active and inactive periods of storms over the Indian region. Int. J. Climatol. 2005, 25, 1523–1530. [Google Scholar] [CrossRef]
  26. Islam, T.; Peterson, R.E. Climatology of landfalling tropical cyclones in Bangladesh 1877–2003. Nat. Hazards 2009, 48, 115–135. [Google Scholar] [CrossRef]
  27. Kikuchi, K.; Wang, B. Formation of Tropical Cyclones in the Northern Indian Ocean Associated with Two Types of Tropical Intraseasonal Oscillation Modes. J. Meteorol. Soc. Jpn. 2010, 88, 475–496. [Google Scholar] [CrossRef] [Green Version]
  28. Hoarau, K.; Bernard, J.; Chalonge, L. Intense tropical cyclone activities in the northern Indian Ocean. Int. J. Climatol. 2012, 32, 1935–1945. [Google Scholar] [CrossRef]
  29. Balaguru, K.S.; Taraphdar, L.; Leung, R.; Foltz, G.R. Increase in the intensity of postmonsoon Bay of Bengal tropical cyclones. Geophys. Res. Lett. 2014, 41, 3594–3601. [Google Scholar] [CrossRef]
  30. Mohapatra, M.; Geetha, B.; Balachandran, S.; Rathore, L.S. On the Tropical Cyclone Activity and Associated Environmental Features over North Indian Ocean in the Context of Climate Change. J. Clim. Chang. 2015, 1, 1–26. [Google Scholar] [CrossRef]
  31. Wahiduzzaman, M.; Oliver, E.C.J.; Wotherspoon, S.J.; Holbrook, N.J. A climatological model of North Indian Ocean tropical cyclone genesis, tracks and landfall. Clim. Dyn. 2017, 49, 2585–2603. [Google Scholar] [CrossRef]
  32. Thakur, M.K.; Kumar, T.V.L.; Dwivedi, S. On the rainfall asymmetry and distribution in tropical cyclones over Bay of Bengal using TMPA and GPM rainfall products. Nat. Hazards 2018, 94, 819–832. [Google Scholar] [CrossRef]
  33. Kumar, M.R.R.; Prasad, T.G. Annual and interannual variation of precipitation over the tropical Indian Ocean. Geophys. Res. 1997, 18, 519–527. [Google Scholar]
  34. Kothawale, D.R.; Munot, A.A.; Borgaonkar, H.P. Temperature variability over the Indian Ocean and its relationship with Indian summer monsoon rainfall. Theor. Appl. Climatol. 2008, 92, 31–45. [Google Scholar] [CrossRef]
  35. Sattar, A.M.; Cheung, K.K.W. Comparison between the active tropical cyclone seasons over the Arabian Sea and Bay of Bengal. Int. J. Climatol. 2019, 39, 5486–5502. [Google Scholar] [CrossRef]
  36. Balaji, M.; Chakraborty, A.; Mandal, M. Changes in tropical cyclone activity in north Indian Ocean during satellite era (1981–2014). Int. J. Climatol. 2018, 38, 2819–2837. [Google Scholar] [CrossRef]
  37. Dhar, O.N.; Rakhecha, P.R.; Mandal, B.N. Influence of tropical disturbances on monthly monsoon rainfall of India. Mon. Weather Rev. 1980, 109, 188–190. [Google Scholar] [CrossRef] [Green Version]
  38. Krishnakumar, K.N.; Prasada Rao, G.S.L.H.V.; Gopakumar, C.S. Rainfall trends in twentieth century over Kerala, India. Atmos. Environ. 2009, 43, 1940–1944. [Google Scholar] [CrossRef]
  39. Report from Government of Bangladesh. Cyclone Sidr in Bangladesh: Damage, Loss, and Needs Assessment for Disaster Recovery and Reconstruction. Available online: https://reliefweb.int/report/bangladesh/cyclone-sidr-bangladesh-damage-loss-and-needs-assessment-disaster-recovery-and (accessed on 25 April 2019).
  40. Report from Human Rights Watch. Sri Lanka: Allow Aid Groups to Help Cyclone Victims. Available online: https://reliefweb.int/report/sri-lanka/sri-lanka-allow-aid-groups-help-cyclone-victims (accessed on 8 April 2019).
  41. Yokoi, S.; Takayabu, Y.N. Environmental and external factors in the genesis of tropical cyclone nargis in April 2008 over the Bay of Bengal. J. Meteorol. Soc. Jpn. 2010, 88, 425–435. [Google Scholar] [CrossRef] [Green Version]
  42. Sahoo, B.; Bhaskaran, P.K. Assessment on historical cyclone tracks in the Bay of Bengal, east coast of India. Int. J. Climatol. 2016, 36, 95–109. [Google Scholar] [CrossRef]
  43. RSMC. Best Track Data of Tropical Cyclonic Disturbances over the North Indian Ocean. Available online: http://citeseerx.ist.psu.edu/viewdoc/download?doi=10.1.1.176.8143&rep=rep1&type=pdf (accessed on 2 November 2019).
  44. Huffman, G.J.; Bolvin, D.T.; Nelkin, E.J.; Wolff, D.B.; Adler, R.F.; Gu, G.; Hong, Y.; Bowman, K.P.; Stocker, E.F. The TRMM Multisatellite Precipitation Analysis (TMPA): Quasi-Global, Multiyear, Combined-Sensor Precipitation Estimates at Fine Scales. J. Hydrometeorol. 2007, 8, 38–55. [Google Scholar] [CrossRef]
  45. Prat, O.P.; Nelson, B.R. Precipitation contribution of tropical cyclones in the southeastern united states from 1998 to 2009 using TRMM satellite data. J. Clim. 2013, 26, 1047–1062. [Google Scholar] [CrossRef]
  46. Yu, Z.; Yu, H.; Chen, P.; Qian, C.; Yue, C. Verification of tropical cyclone-related satellite precipitation estimates in mainland China. J. Appl. Meteorol. Climatol. 2009, 48, 2227–2241. [Google Scholar] [CrossRef] [Green Version]
  47. Bhardwaj, P.; Pattanaik, D.R.; Singh, O. Tropical cyclone activity over Bay of Bengal in relation to El Niño-Southern Oscillation. Int. J. Climatol. 2019, 39, 5452–5469. [Google Scholar] [CrossRef]
  48. Sengupta, D.; Goddalehundi, B.R.; Anitha, D. Cyclone-induced mixing does not cool SST in the post-monsoon North Bay of Bengal. Atmos. Sci. Lett. 2008, 9, 1–6. [Google Scholar] [CrossRef]
  49. Muni Krishna, K. Intensifying tropical cyclones over the North Indian Ocean during summer monsoon-Global warming. Glob. Planet. Chang. 2009, 65, 12–16. [Google Scholar] [CrossRef]
  50. McPhaden, M.J.; Foltz, G.R.; Lee, T.; Murty, V.; Ravichandran, M.; Vecchi, G.A.; Vialard, J.; Wiggert, J.D.; Yu, L. Ocean-atmosphere interactions during cyclone nargis. Eos Trans. AGU 2009, 90, 53–54. [Google Scholar] [CrossRef]
  51. Larson, J.; Zhou, Y.; Higgins, R.W. Characteristics of landfalling tropical cyclones in the United States and Mexico: Climatology and interannual variability. J. Clim. 2005, 18, 1247–1262. [Google Scholar] [CrossRef]
  52. Lee, M.-H.; Ho, C.-H.; Kim, J.-H. Influence of tropical cyclone landfalls on spatiotemporal variations in typhoon season rainfall over South China. Adv. Atmos. Sci. 2010, 27, 443–454. [Google Scholar] [CrossRef]
  53. Nogueira, R.C.; Keim, B.D. Contributions of Atlantic tropical cyclones to monthly and seasonal rainfall in the eastern United States 1960–2007. Theor. Appl. Climatol. 2011, 103, 213–227. [Google Scholar] [CrossRef]
  54. Schreck, C.J.; Molinari, J.; Mohr, K.I. Attributing Tropical Cyclogenesis to Equatorial Waves in the Western North Pacific. J. Atmos. Sci. 2010, 68, 195–209. [Google Scholar] [CrossRef]
  55. Dare, R.A.; Davidson, N.E.; McBride, J.L. Tropical Cyclone Contribution to Rainfall over Australia. Mon. Weather Rev. 2012, 140, 3606–3619. [Google Scholar] [CrossRef]
  56. Chen, F.J.; Fu, Y.F. Contribution of tropical cyclone rainfall at categories to total precipitation over the Western North Pacific from 1998 to 2007. Sci. China Earth Sci. 2015, 58, 2015–2025. [Google Scholar] [CrossRef]
  57. Englehart, P.J.; Douglas, A.V. The role of Eastern North Pacific tropical storms in the rainfall climatology of Western Mexico. Int. J. Climatol. 2001, 21, 1357–1370. [Google Scholar] [CrossRef]
  58. Konrad, C.E.; Meaux, M.F.; Meaux, D.A. Relationships between tropical cyclone attributes and precipitation totals: Considerations of scale. Int. J. Climatol. 2002, 22, 237–247. [Google Scholar] [CrossRef]
  59. Lin, Y.; Zhao, M.; Zhang, M. Tropical cyclone rainfall area controlled by relative sea surface temperature. Nat. Commun. 2015, 6, 6591. [Google Scholar] [CrossRef] [PubMed]
Figure 1. (a) Yearly, (b) monthly distribution of Tropical Cyclones (TCs) in the Bay of Bengal (BoB) during 1998–2016.
Atmosphere 10 00699 g001
Figure 2. Tracks for (a) all TCs, (b) CSs, (c) SCSs, (d) VSCSs, and (e) ESCSs in BoB from 1998 to 2016. The red dots indicate the genesis point while the red lines denote the dividing line of BoB.
Atmosphere 10 00699 g002
Figure 3. Yearly mean precipitation in BoB during 1998–2016 (a) for all events (TCs and non-TCs), (b) for non-TC, and precipitation variance (c) for all, (d) for non-TCs. The red dots in (a) indicate TC genesis points.
Atmosphere 10 00699 g003
Figure 4. Accumulated TC rainfall (mm) during 1998–2006. The red circle indicates the genesis point of TCs. (a) 1998, (b) 1999, (c) 2000, (d) 2001, (e) 2002, (f) 2003, (g) 2004, (h) 2005, (i) 2006.
Atmosphere 10 00699 g004
Figure 5. Same as Figure 4 but for 2007–2016. (a) 2007, (b) 2008, (c) 2009, (d) 2010, (e) 2011, (f) 2012, (g) 2013, (h) 2014, (i) 2015, (j) 2016.
Atmosphere 10 00699 g005
Figure 6. Yearly TC rainfall contribution (%) from 1998 to 2006. (a) 1998, (b) 1999, (c) 2000, (d) 2001, (e) 2002, (f) 2003, (g) 2004, (h) 2005, (i) 2006.
Atmosphere 10 00699 g006
Figure 7. Same as Figure 6 but for 2007–2016. (a) 2007, (b) 2008, (c) 2009, (d) 2010, (e) 2011, (f) 2012, (g) 2013, (h) 2014, (i) 2015, (j) 2016.
Atmosphere 10 00699 g007
Figure 8. Yearly rainfall accumulation overland (a) for all rainfall events, TCs, and non-TCs (b) TC rainfall contribution to annual precipitation budget and the proportion of area impacted by TCs. The y-axis (a) represents a log scale for rainfall accumulation (mm).
Atmosphere 10 00699 g008
Figure 9. Monthly accumulated TC rainfall (mm) from January to December. The months June, August, and September were omitted because there was no TC activity in these months. The red circle indicates the genesis point of TCs. (a) January, (b) February, (c) March, (d) April, (e) May, (f) July, (g) October, (h) November, (i) December.
Atmosphere 10 00699 g009
Figure 10. Monthly TC rainfall contribution (%) from January to December. The months June, August, and September were omitted because there was no TC activity in these months. The red circle indicates the genesis point of TCs. (a) January, (b) February, (c) March, (d) April, (e) May, (f) July, (g) October, (h) November, (i) December.
Atmosphere 10 00699 g010
Figure 11. (a) Monthly rainfall accumulation over land for all rainfall events, TCs, non-TCs, and TCs/Area Impacted, (b) rainfall contribution and the proportion of area impacted by TCs. The y-axis (a) represents a log scale for rainfall accumulation (mm).
Atmosphere 10 00699 g011
Figure 12. The probability density function of different rainfall intensities for various rainfall types (Non-TC, CS, SCS, VSCS, and ESCS) over land.
Atmosphere 10 00699 g012
Figure 13. Land-Ocean variability for (a) Non-TC and TC, (b) TCs intensity groups. Rain rate has been categorized into low (0–1 mm/h), moderate (1–10 mm/h), high (10–20 mm/h), and extreme (>20 mm/h) for the entire domain (land/ocean). The vertical bar denotes the land (upper value) /ocean (lower value) variability.
Atmosphere 10 00699 g013
Table 1. January-December (1998–2016) rainfall characteristics overland for all rainfall events, non-TC rainfall, TC rainfall, and TCs intensity groups’ rainfall. Rainfall characteristics are divided into 4 categories: annual accumulation overland (mm), area impacted (%), accumulation/area impacted (mm), and the annual contribution (%).
Precipitation CategoryAnnual Accumulation (mm/0.25° × 0.25°)Area Impacted (AI) (%)Accumulation/AI (mm/AI)Annual Contribution (%)Annual Contribution per TC (%)
All events99081009908100/
Non-TC8104100810491.7/
Only TC8137910298.20.1
CS358408953.60.2
SCS94283360.90.1
VSCS84283000.80.1
ESCS269703842.70.3

