Improving Air Quality for Operators of Mobile Machines in Underground Mines

1
Faculty of Environmental Engineering, Wroclaw University of Science and Technology, Wybrzeże Wyspiańskiego 27, 50-370 Wrocław, Poland
2
Centrum Badań Jakości sp. zo. o., ul. M. Skłodowskiej-Curie 62, 59-301 Lubin, Poland
*
Author to whom correspondence should be addressed.
Atmosphere 2020, 11(12), 1372; https://0-doi-org.brum.beds.ac.uk/10.3390/atmos11121372
Submission received: 12 November 2020
/
Revised: 7 December 2020
/
Accepted: 9 December 2020
/
Published: 18 December 2020
(This article belongs to the Special Issue Exposure Assessment of Air Pollution)
Abstract
:In underground mines, mobile mining equipment is critical for the production system. The microenvironment inside the mobile machine may cause exposure to strongly polluted mine air, which adversely affects the health and working performance of the operator. Harmful pollutants may access the cabin together with the ventilation air delivered from the machine’s surroundings. This work proposes a solution that is able to ensure that the air for the machine operator is of proper quality. The proposal emerged from an analysis of the compliance of cabins of mobile machines working underground in mines with occupational health and safety (H&S) standards. An analytical model of air quality in a well-mixed zone was utilized for this purpose. The cabin atmosphere was investigated with regard to the concentration of gaseous species in the surrounding air, the cabin ventilation rate, and human breathing parameters. The analysis showed that if currently available ventilation approaches are used, compliance with multiple H&S standards cannot be attained inside the cabin if standards are exceeded in the surroundings of the machine. The proposed solution overcomes this problem by combining elements that are already in place, i.e., ventilation, air-conditioning, and filtration with a personal supply of clean air. The concept is generic and may be adapted to various specific requirements.
1. Introduction
Mining is one of the oldest industries in the world, and it lies at the foundation of human civilization [1]. However, the underground mining sector faces a number of environmental and health hazards [2,3,4]. Recently, for example, there has been an increase in the awareness of the exposure of operators of the mobile machines that are used in mines [5].
In underground mines, mobile mining equipment is critical for the production system [6]. Currently, this industry is heavily and extensively mechanized by self-propelled, mobile, diesel-powered or electric equipment that is designed to operate underground, produce and transport coal, ore, and personnel, for lifting or loading materials, and to work with the attached equipment [7]. The flexibility and totally independent operational capabilities of this equipment have resulted in substantial productivity gains compared to early mining methods.
The quality of air in the cabins of mobile machines is affected by many factors [8,9]. In underground mobile machines, pollutants come from the outside environment or they are emitted directly inside the vehicles. The main external sources of air pollution are the underground mining operations themselves (exploitation of resources) and diesel engine exhaust; oftentimes, the mine ventilation system is insufficient to remove this pollution [10]. Harmful pollutants from these sources may enter the cabin by infiltration, or they may be carried in by the cabin ventilation system. The most hazardous pollutants originate from the combustion of diesel fuel, which is commonly used to power underground vehicles and mining equipment [11]. Diesel engine exhaust is a complex mixture of combustion products [11,12,13]. Its exact composition depends on the kind of engine, the operating conditions, lubricating oil, additives, the emission control system, and fuel composition. The mixture mainly includes particulate matter (both coarse and fine particles), soot, carbon dioxide, carbon monoxide (a toxic component that interferes with the blood’s ability to transport oxygen), nitrogen oxides (NOx), volatile organic compounds, e.g., benzene, toluene, formaldehyde, acetaldehyde, and naphthalene (known or suspected carcinogens). The particulate fraction of diesel exhaust fumes consists of elemental and organic carbon components as well as unburnt hydrocarbons and other solid materials. The potential effects of exposure to diesel exhaust on human health are well documented. Diesel exhaust can induce respiratory and cardiovascular diseases, as well as increasing the risk of cancer. In 2012, the International Agency for Research on Cancer (IARC) classified diesel exhaust emissions as carcinogenic to humans. Due to the complexity of the content of exhaust fumes, indicator substances such as CO and NOx have commonly been used to quantify the exposure of mine workers to pollutants emitted from engines. Additionally, the problem is not limited to this specific environment [14,15].
One approach to reducing the exposure to air pollution inside the cabins of underground mobile machines is to isolate the cabin interior from the surrounding atmosphere. Enclosing the cabin can be an effective means of preventing or reducing exposure to harmful components in the surrounding air. However, this strategy is not always fully efficient and substances may accumulate in the cabin air. These can originate from interior materials as well as from the evaporation and leakage of chemicals such as gasoline, transmission fluid, radiator fluid, or hydraulic fluid. Volatile compounds that are released through the breathing process of the machine operator also play an important role in cabin air pollution. One of the main indicators of indoor air quality is the content of carbon dioxide (CO2). In a confined space, such as the vehicle cabin, a CO2 concentration can build up due to human exhalation at the expense of oxygen (O2) availability [16]. The concentration of CO2 inside the vehicle cabin can increase rapidly [17,18,19,20]. The rate of increase is dependent on the vehicle volume, ventilation rate, and a number of other vehicle-specific parameters [21]. CO2 is generally not considered hazardous to humans at low concentrations. However, high levels of this gas can cause unpleasant feelings, dizziness, headaches, fatigue, sleepiness, impaired vision and coordination, impaired decision-making, and can slow down reactions. The American Society of Heating, Refrigeration and Air-Conditioning Engineers (ASHRAE) recommends a comfort limit of a CO2 concentration of 700 ppm over the ambient level of approximately 400 ppm. Subtle cognitive effects have been identified at exposure levels of 1000 ppm and lower, but are not considered to be relevant in the case of machine operators. Exposure to high CO2 concentrations of 2500 ppm can significantly reduce decision-making performance. Other adverse effects including fatigue, headaches, and visual disturbances have been reported at CO2 levels above 0.3% (3000 ppm). The National Institute of Occupational Safety and Health (NIOSH) recommends exposure limits of 5000 ppm CO2 for an 8-h time-weighted average.
Keeping the air clean inside the cabin of a mobile machine that operates in a polluted environment poses several challenges. In the case of mines, these challenges include the limited methods available to improve cabin air quality, the wide spectrum of air pollutants, high pollution levels, the numerous and various sources of pollutants, and specific requirements with regard to vehicle interiors. Effective tools and guidelines are needed to optimize air hygiene in this kind of microenvironment. This work aims to discuss ways to improve the quality of the air inhaled by underground mobile machine operators. These improvements are based on both the ventilation and the supply of clean air into the vehicle cabin. In our opinion, the proposed approach offers an innovative perspective, which is not limited to this particular application.
2. Methods
2.1. Assumptions
In this work, it was assumed that the air quality inside the cabin of the mobile machine in an underground mine may be examined under the assumption of spatial homogeneity of the concentration of gaseous species. This assumption is justified because the free volume of the cabin is relatively small compared with the typical air exchange rate between the cabin and its surroundings. In addition, the air inside the cabin is strongly mixed due to circulation realized by the air-conditioning system. Therefore, in our analysis, the concept of a well-mixed zone was utilized, which allowed the development of relatively simple analytical models which offered a great insight [22].
The models were proposed for two groups of gaseous species. The first group includes substances that are generated outside cabins, but excludes emission sources inside them. The exemplary, important pollutants in this group are CO, NO, and NO2. Measurements of mine air quality revealed considerable and long-lasting exceedance of CO, NO, and NO2 limit values, particularly in the vicinity of machines. The second group includes substances that have their sources outside cabins as well as inside them. The main representative of this group is CO2. Measurements of cabin air quality in mobile machines operating underground revealed long-lasting elevated CO2 concentration levels in this microenvironment.
In the analysis we assumed that no gas filters were used. Their availability for the substances in question is currently very limited.
2.2. Indoor Air Quality Model for a Substance That Is Generated Only Outside the Cabin
The cabin air mass balance equation for a gaseous substance that has its sources only outside the cabin of the mobile machine is
where: is the total mass of the substance in the air inside the cabin, is the incoming mass flow of this substance, and is the outgoing mass flow. Additionally, (1) , where: is the substance concentration in the cabin air, and is the free volume of the cabin; (2) , where: is the ventilation air flow between the cabin and its surroundings, and is the substance concentration in the ambient air; (3) . The differential equation (Equation (1)) is solved under the following assumptions: , and , and the solution is given by
This describes the temporal variation of the substance concentration in the cabin air, , provided initial conditions . Based on Equation (2), one may derive the time, needed to attain the particular concentration of the substance, in the cabin air. This time is given by
In further analysis, we used the following substitutions: ( represents a multiple of the predefined threshold concentration) and ( is expressed using the air exchange rate, ).
2.3. Indoor Air Quality Model for CO2 in Vehicle Cabin
The cabin air mass balance equation for CO2 is
where: is the total mass of CO2 in the air inside the cabin; is the CO2 mass flow coming into the cabin air due to human exhalation; is the CO2 mass flow going out from the cabin air due to human inhalation; is the CO2 mass flow coming into the cabin due to ventilation, and is the CO2 mass flow going out from the cabin because of ventilation. Additionally, (1), where is human ventilation per minute, and is the CO2 concentration in the exhaled air; (2) , where is the CO2 concentration in the cabin air; (3) for and (see Equation (1)).
The differential equation (Equation (4)) is solved under the following assumptions: , , , , and . The solution is given by
which describes the temporal variation of the CO2 concentration in the cabin air, , provided the initial conditions are . Based on Equation (5), one may derive the time, needed to attain the particular concentration of CO2, in the cabin air. The time is given by
In further analysis, we used the following substitutions: ( represents a multiple of the threshold concentration) and ( is expressed using the air exchange rate, ).
2.4. Time-Weighted Average Concentration in Cabin Air
Occupational health and safety standards regarding gaseous pollutants are usually based on the notion of the time-weighted average concentration, within the predefined period of time, :
Assuming that is derived from indoor air quality models (Equations (2) and (5)), the following analytical description of is attained:
where: (1) For substances generated exclusively outside the cabin (Equation (2)): , , ; (2) for substances generated outside the cabin as well as inside it and due to the human metabolism, e.g., CO2 (Equation (5)): , , . Using Equation (8), it is possible to determine the combinations of and that allow for compliance with the health and safety (H&S) standard. In further analysis, we used the following substitution: ( represents a multiple of the threshold concentration).
2.5. Acceptable Time of Threshold Concentration Exceedance in Mobile Machine Cabin Air
It is possible to adjust the time of threshold concentration exceedance in the cabin air to ensure that the concentration averaged in the predefined, longer period of time complies with the H&S standard. In order to perform the analysis that demonstrates this possibility, the following assumptions were made: (1) is the value of air quality standard for the particular substance (considered as the momentary concentration); (2) is the concentration smaller than (, where ); (3) is the concentration greater than (, where ); (4) is the time when is observed in the cabin air, while is the time when is observed in the cabin air, and ; (5) is the fraction of time when the threshold concentration is exceeded in the cabin air. The following relationship ensures that the concentration averaged in the time period does not exceed
Hence, the fraction of time when it is permitted to exceed the threshold concentration has to comply with the following criterion:
Using Equation (10), it is possible to determine the combinations of and that allow for compliance with the H&S standard.
2.6. Required Contribution of Clean Air Delivered to the Stream of Air Inhaled by Machine Operator
The high quality of air inhaled by the mobile machine operators is essential for their health and working performance. It is possible to determine the contribution of clean air, which has to be delivered directly to the operator, so that in the inhaled air, the concentration of the particular substance remains below the predefined level. In order to perform the respective analysis, the following assumptions were made: (1) is the desired concentration of the particular substance in the air inhaled by the machine operator (, where ); (2) is the substance concentration in the cabin air (, where ); (3) is the substance concentration in the clean air; (4) is the volume flow of air inhaled by the operator; (5) , where is the volume flow of cabin air inhaled by a human and is the volume flow of clean air inhaled by a human; (6) is the contribution of the clean air in the inhaled air. The following relationship ensures that the particular concentration is not exceeded in the air inhaled by the cabin occupant:
Hence, the fraction of the clean air in the inhaled air has to comply with the following criterion:
2.7. Input Data for Models and Calculations
The clean air concentrations of the gaseous substances considered in this work are given in Table 1 [23]. The limit values for these substances in the mine air are quoted in Table 2 [24].
The ventilation rate per minute of the machine operator was assumed, L/min, which is the upper limit of the range 5–8 L/min, representing the normal ventilation rate per minute of an average human being. The CO2 concentration in the exhaled air was assumed to be 5.3%, which is the upper limit of the range of the CO2 content in the air exhaled by humans, 4.0–5.3%. The cabin of a loader machine chosen for our analysis is shown in Figure 1.
It is generally representative of the pool of cabins of the mobile machines operating underground in mines. In the analysis, we considered an air exchange rate in the range from = 10 h−1 to = 70 h−1 (with reference to the free volume of the cabin). Based on the workplace measurements, the volume flow of cabin ventilation air for an exemplary loader was 22 m3/h, approximately. The free volume of the cabin was estimated as 0.4255 m3, using information obtained from the loader producer.
3. Results and Discussion
3.1. Air Quality Inside Cabin with Respect to Substances That Have Sources Outside It
Multiple contaminants are generated exclusively outside the cabins of mobile machines operating underground. Exemplary substances of this kind, which currently cause the risk of non-compliance with H&S standards in mines, are NO, NO2, and partially CO. The analysis presented further in this section refers to them.
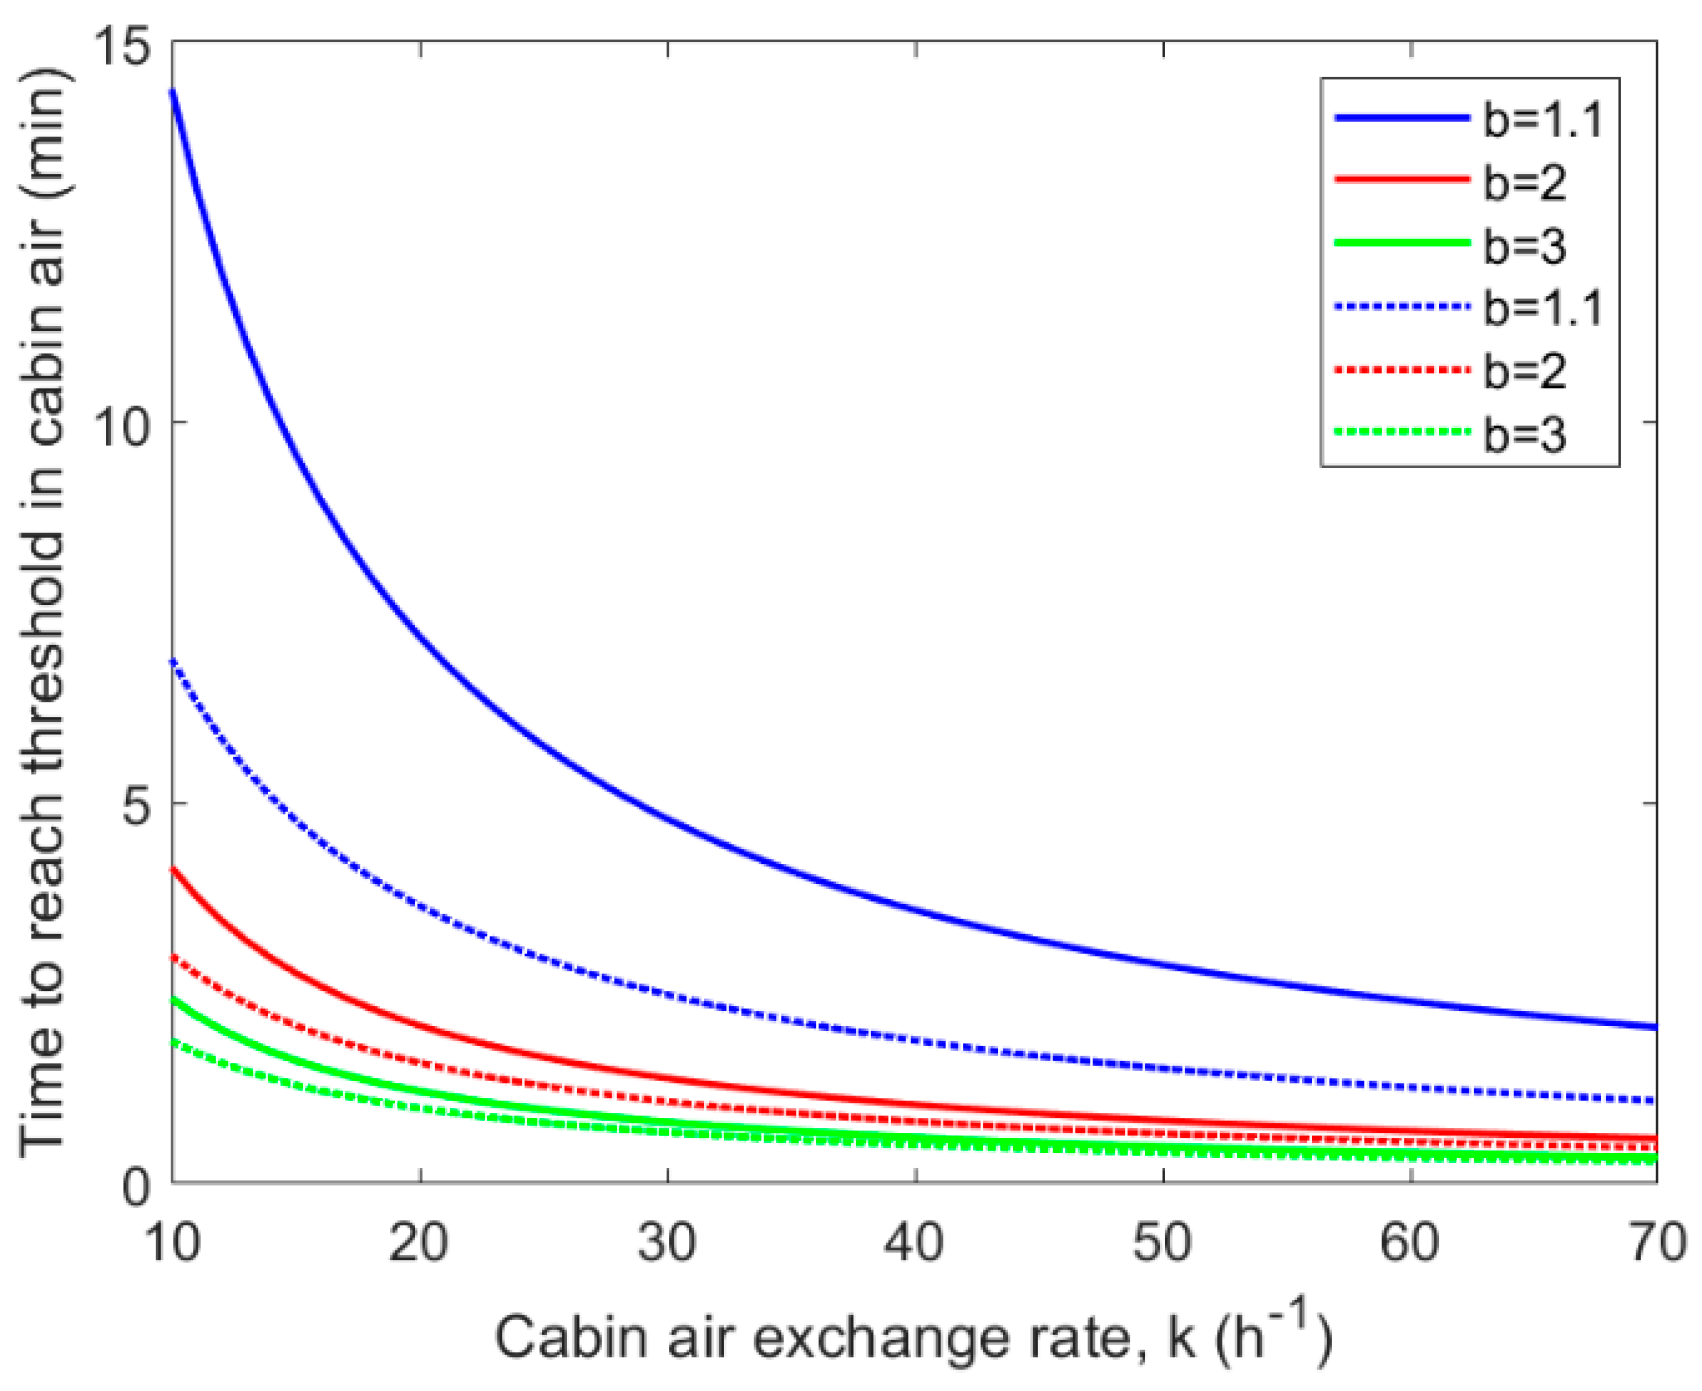
Based on Equation (2), for substances released exclusively outside the well-mixed zone, the equilibrium concentration inside the zone approaches exponentially the surrounding air concentration, . Hence, if the ambient air remains contaminated, the indoor air pollution will ultimately reach the same level. Figure 2 (solid lines) displays the time needed to reach the predefined threshold concentration of the substance in the cabin air, when this value is constantly exceeded in the ambient air. Calculations were based on Equation (3). The initial concentration of the substance in the cabin air was assumed as in clean air (Table 1).
As shown in Figure 2 (solid lines), several minutes are sufficient to reach the limit concentration in the cabin air, when the ambient concentration of NO, NO2, or CO remains above this level. The time-to-threshold depends on the ambient concentration of the substance and the air exchange rate between the cabin and its surroundings. Figure 2 (solid lines) shows that in the case of a 10% limit value exceedance outside the cabin, the same level is reached inside the cabin within 14 min. For greater concentrations of pollutants in the air around the machine, their content in the cabin air reaches the limit value in a shorter time. By increasing the air exchange rate, this process is accelerated.
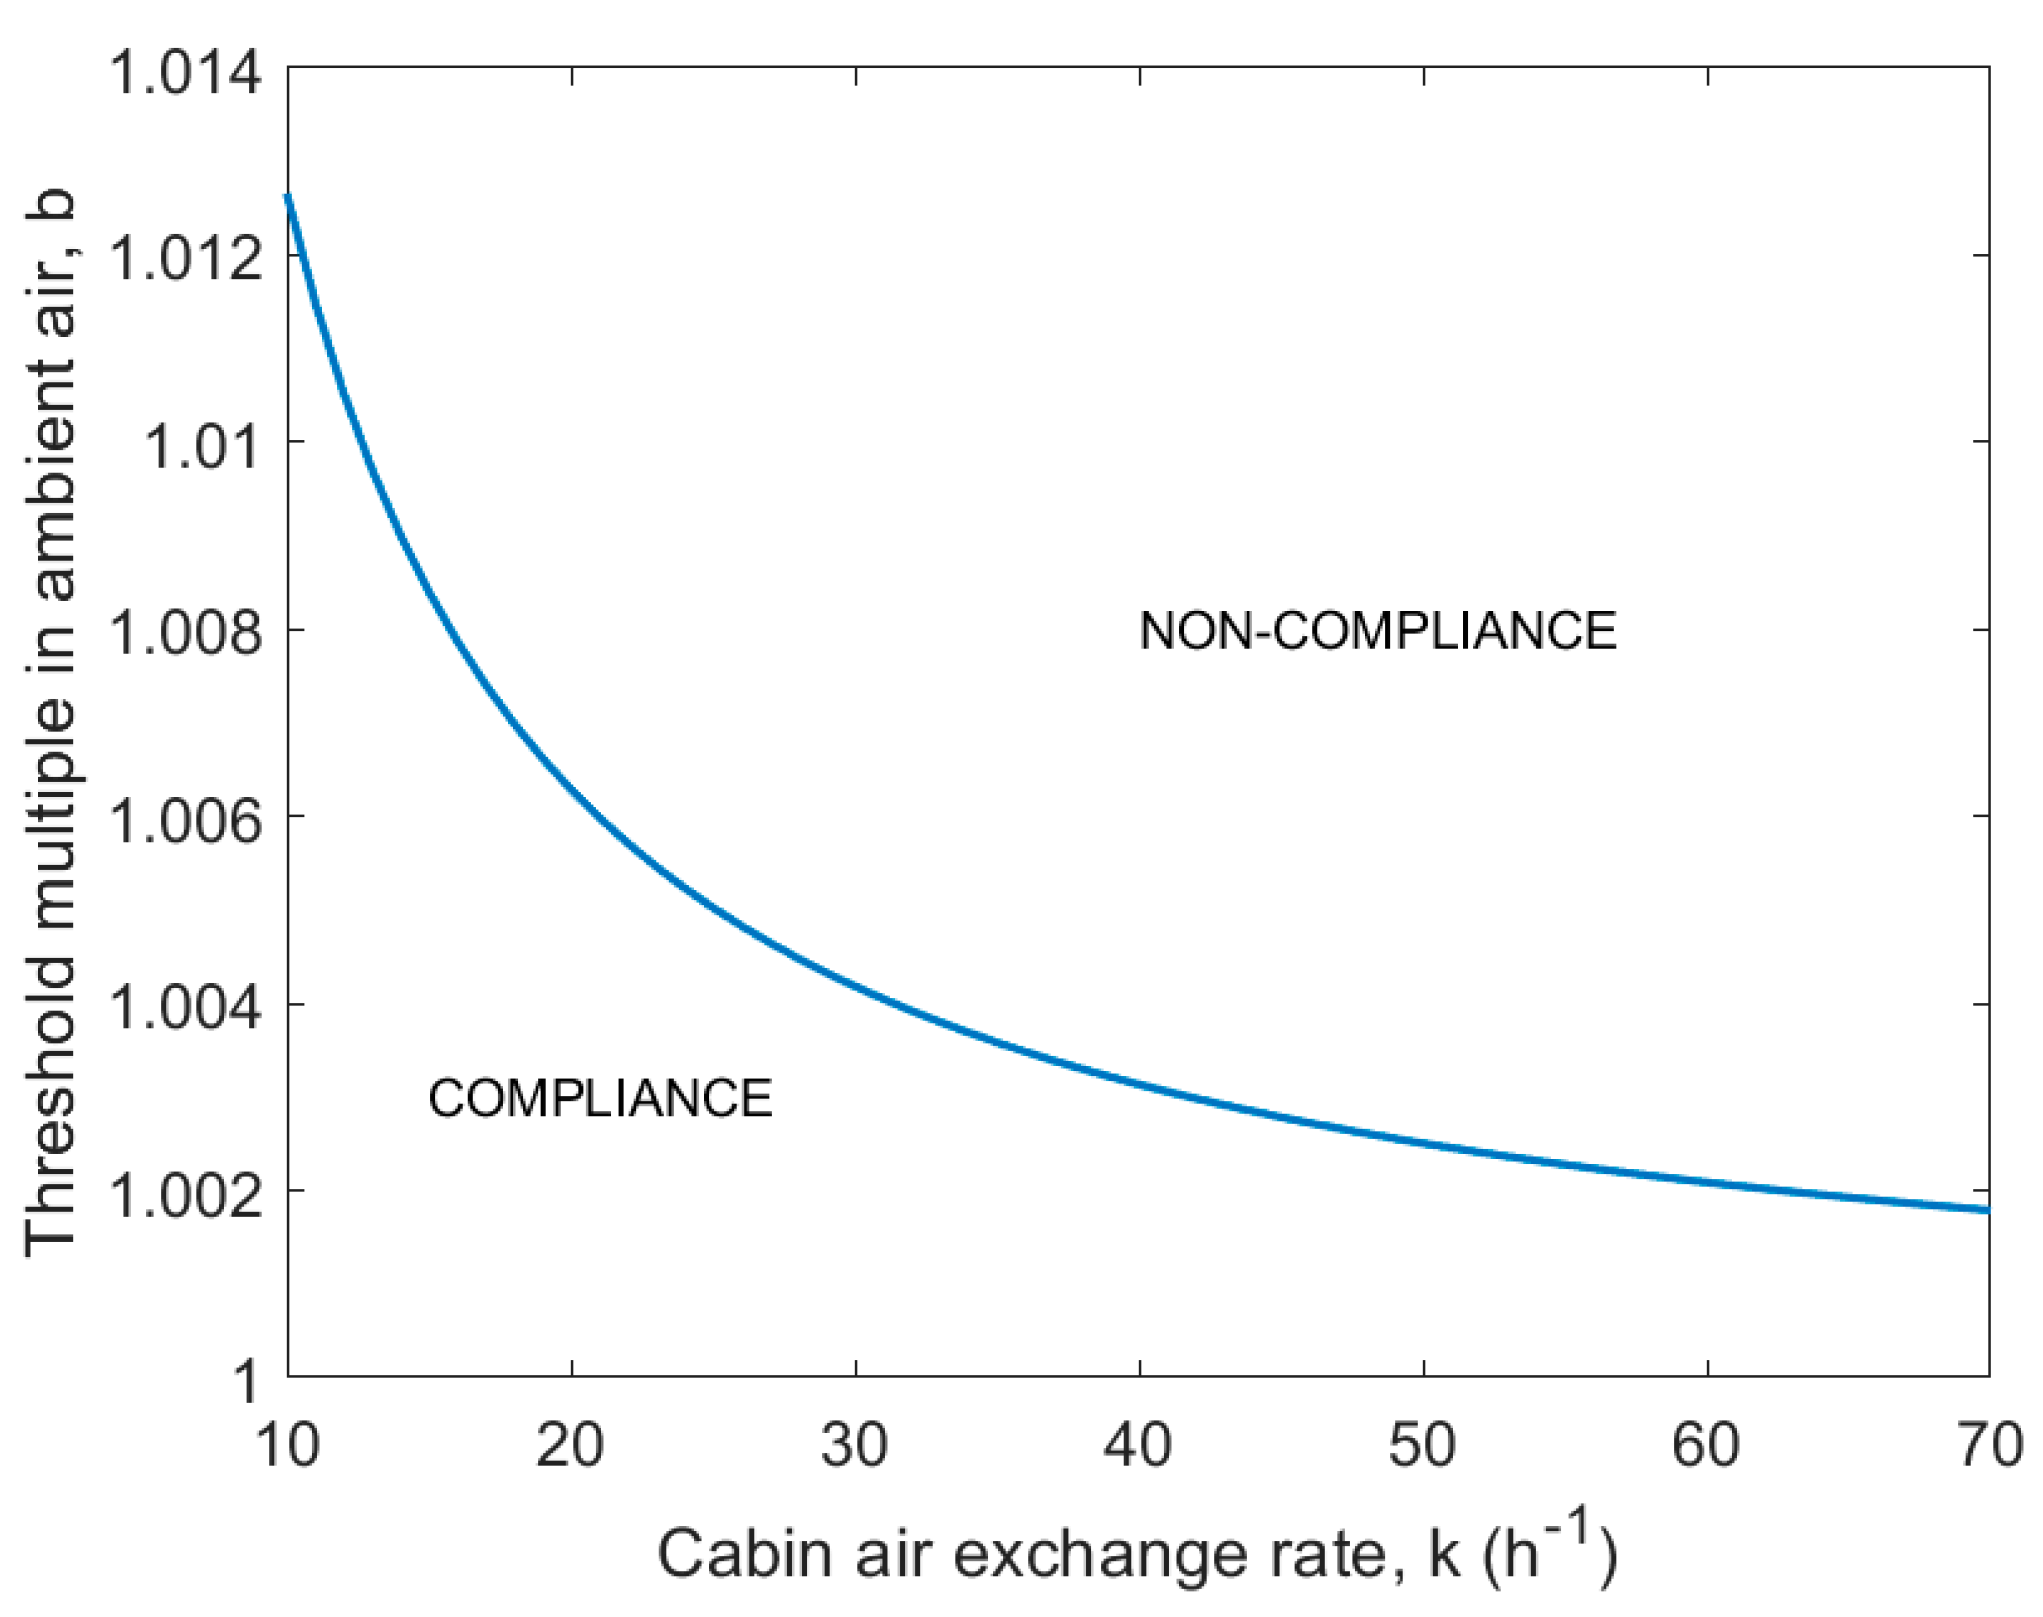
However, in the case when the concentration of NO, NO2, or CO changes in the cabin air (Equation (2)), it is conceivable that the time-weighted average concentration remains below the limit prescribed by law. Figure 3 displays the results of the respective analysis, which is based on Equation (8) (case 1). The blue line separates the regions of standard compliance and non-compliance depending on the ambient concentrations of the substances and the air exchange rates between the cabin and its surroundings.
Based on Figure 3, a very small exceedance of the limit value outside the cabin, such as several parts per thousand, is sufficient to cause non-compliance with the air quality standard inside the cabin. A very limited improvement is possible by reducing the air exchange rate. For the smallest considered air exchange rate = 10 h−1, the threshold exceedance in the ambient air by 1.3% already results in non-compliance with the standard.
3.2. Air Quality Inside the Cabin with Respect to CO2
Carbon dioxide is generated inside as well as outside the cabins of mobile machines operating underground. In the case of CO2, the equilibrium concentration inside the well-mixed zone approaches exponentially the concentration, (see Equation (5)). Based on this formula, the momentary CO2 concentration inside the cabin may exceed the predefined limit value, although the limit is not exceeded in the ambient air. This is different from the substances emitted only outside the cabin.
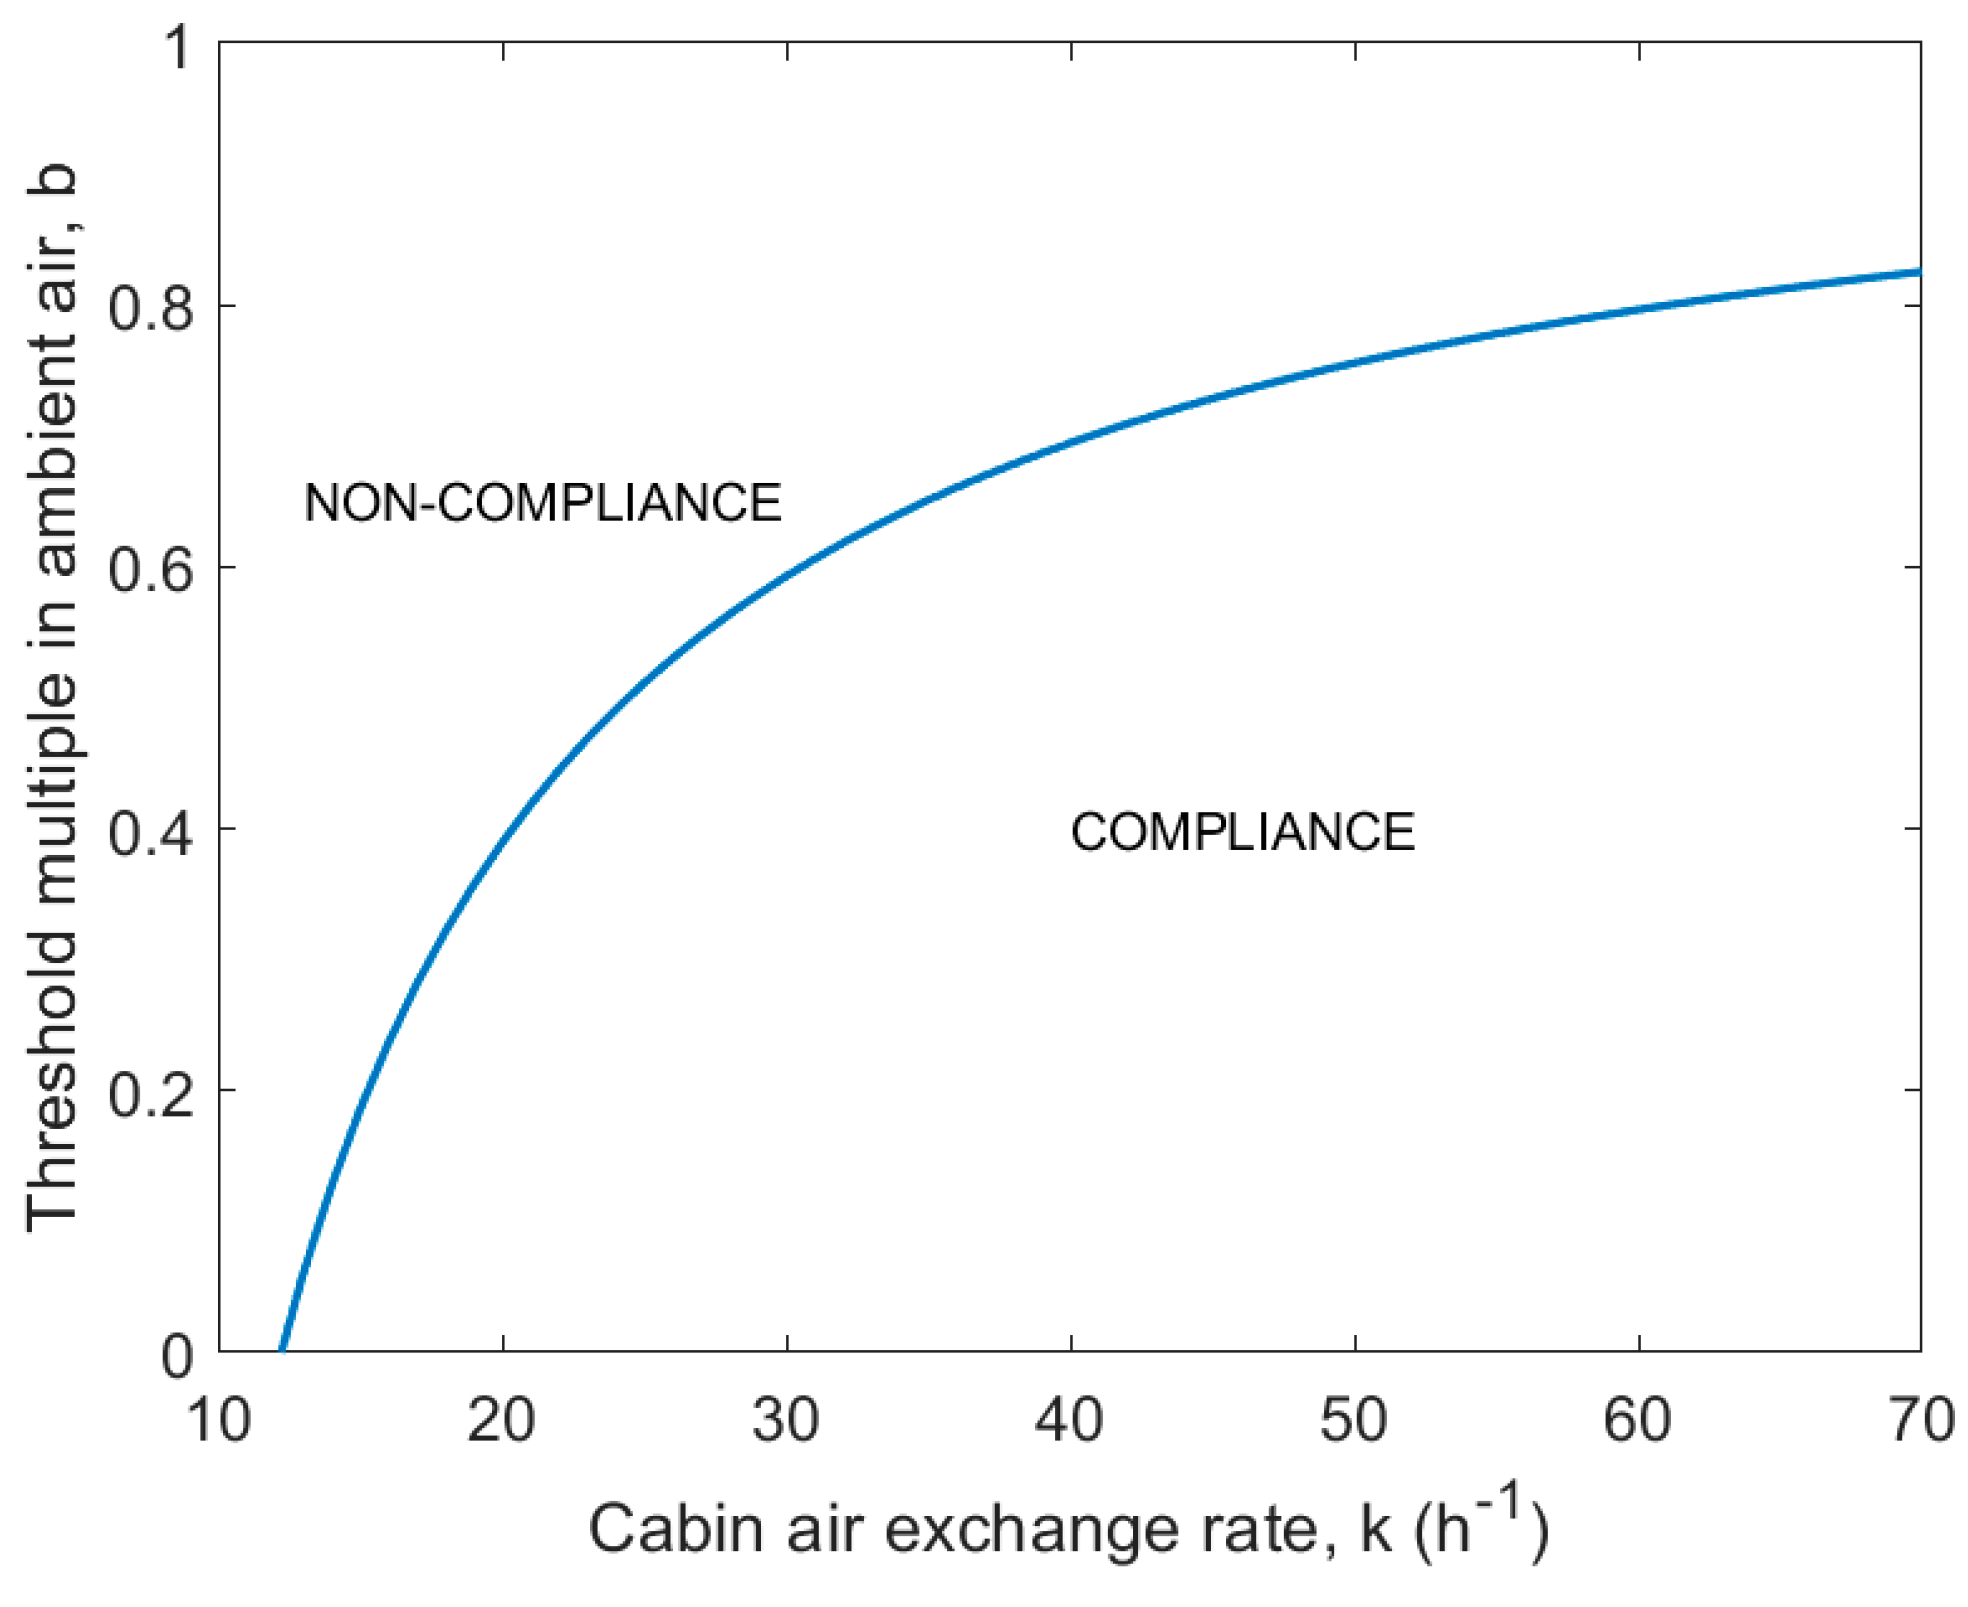
Figure 2 (dotted lines) displays the time when the CO2 concentration in the cabin air increases from the initial concentration, as in the clean air (Table 1), up to the limit value, while the ambient concentration stays above the limit. This time is displayed as a function of the CO2 concentration in the cabin surroundings and the air exchange rate for the cabin, based on Equation (6). We did not consider the variation of parameters associated with human breathing. As shown in Figure 2 (dotted lines), for CO2, the time to reach the limit concentration inside the cabin is shorter compared with substances generated exclusively outside the cabin, when the ambient concentrations are the same multiples of the limit values. Considering this result, and the findings from Section 3.1, it is worth analyzing the indoor air quality standard compliance for CO2 only in the case when its concentration outside the cabin is less than the limit. Figure 4 displays the results of the respective analysis, which is based on Equation (8) (case 2).
As shown in Figure 4, maintaining proper air quality inside the cabin, with respect to CO2, is ensured by the adequately high air exchange rate between the cabin and its surroundings, provided that the ambient concentration remains below the limit value. The rate has to be adjusted according to the ambient CO2 concentration. For the cabin microenvironment, human breathing constitutes the dominant source of CO2, as compared with the intake from the cabin surroundings. In this situation, the delivery of the ventilating air, which contains less CO2 than the cabin air, has a dilution effect. Limited air exchange with the surroundings causes CO2 to build up inside the cabin.
3.3. Acceptable Time of Threshold Concentration Exceedance in Cabin Air
The air quality standard, which is defined as the time-weighted average concentration of a substance, may be attained by adjusting the fraction of time when the limit value is exceeded (see Equation (10)). For substances emitted only outside the cabin, the conditions inside it reach equilibrium with the ambient air within several minutes (see Section 3.1 and Section 3.2). This has two implications: (1) The fraction of time when the limit value is exceeded inside the cabin is basically the time of the cabin air exposure to the excessively contaminated surroundings; (2) the analysis is equally valid for those substances that have their sources outside as well as inside the cabin of the machine.
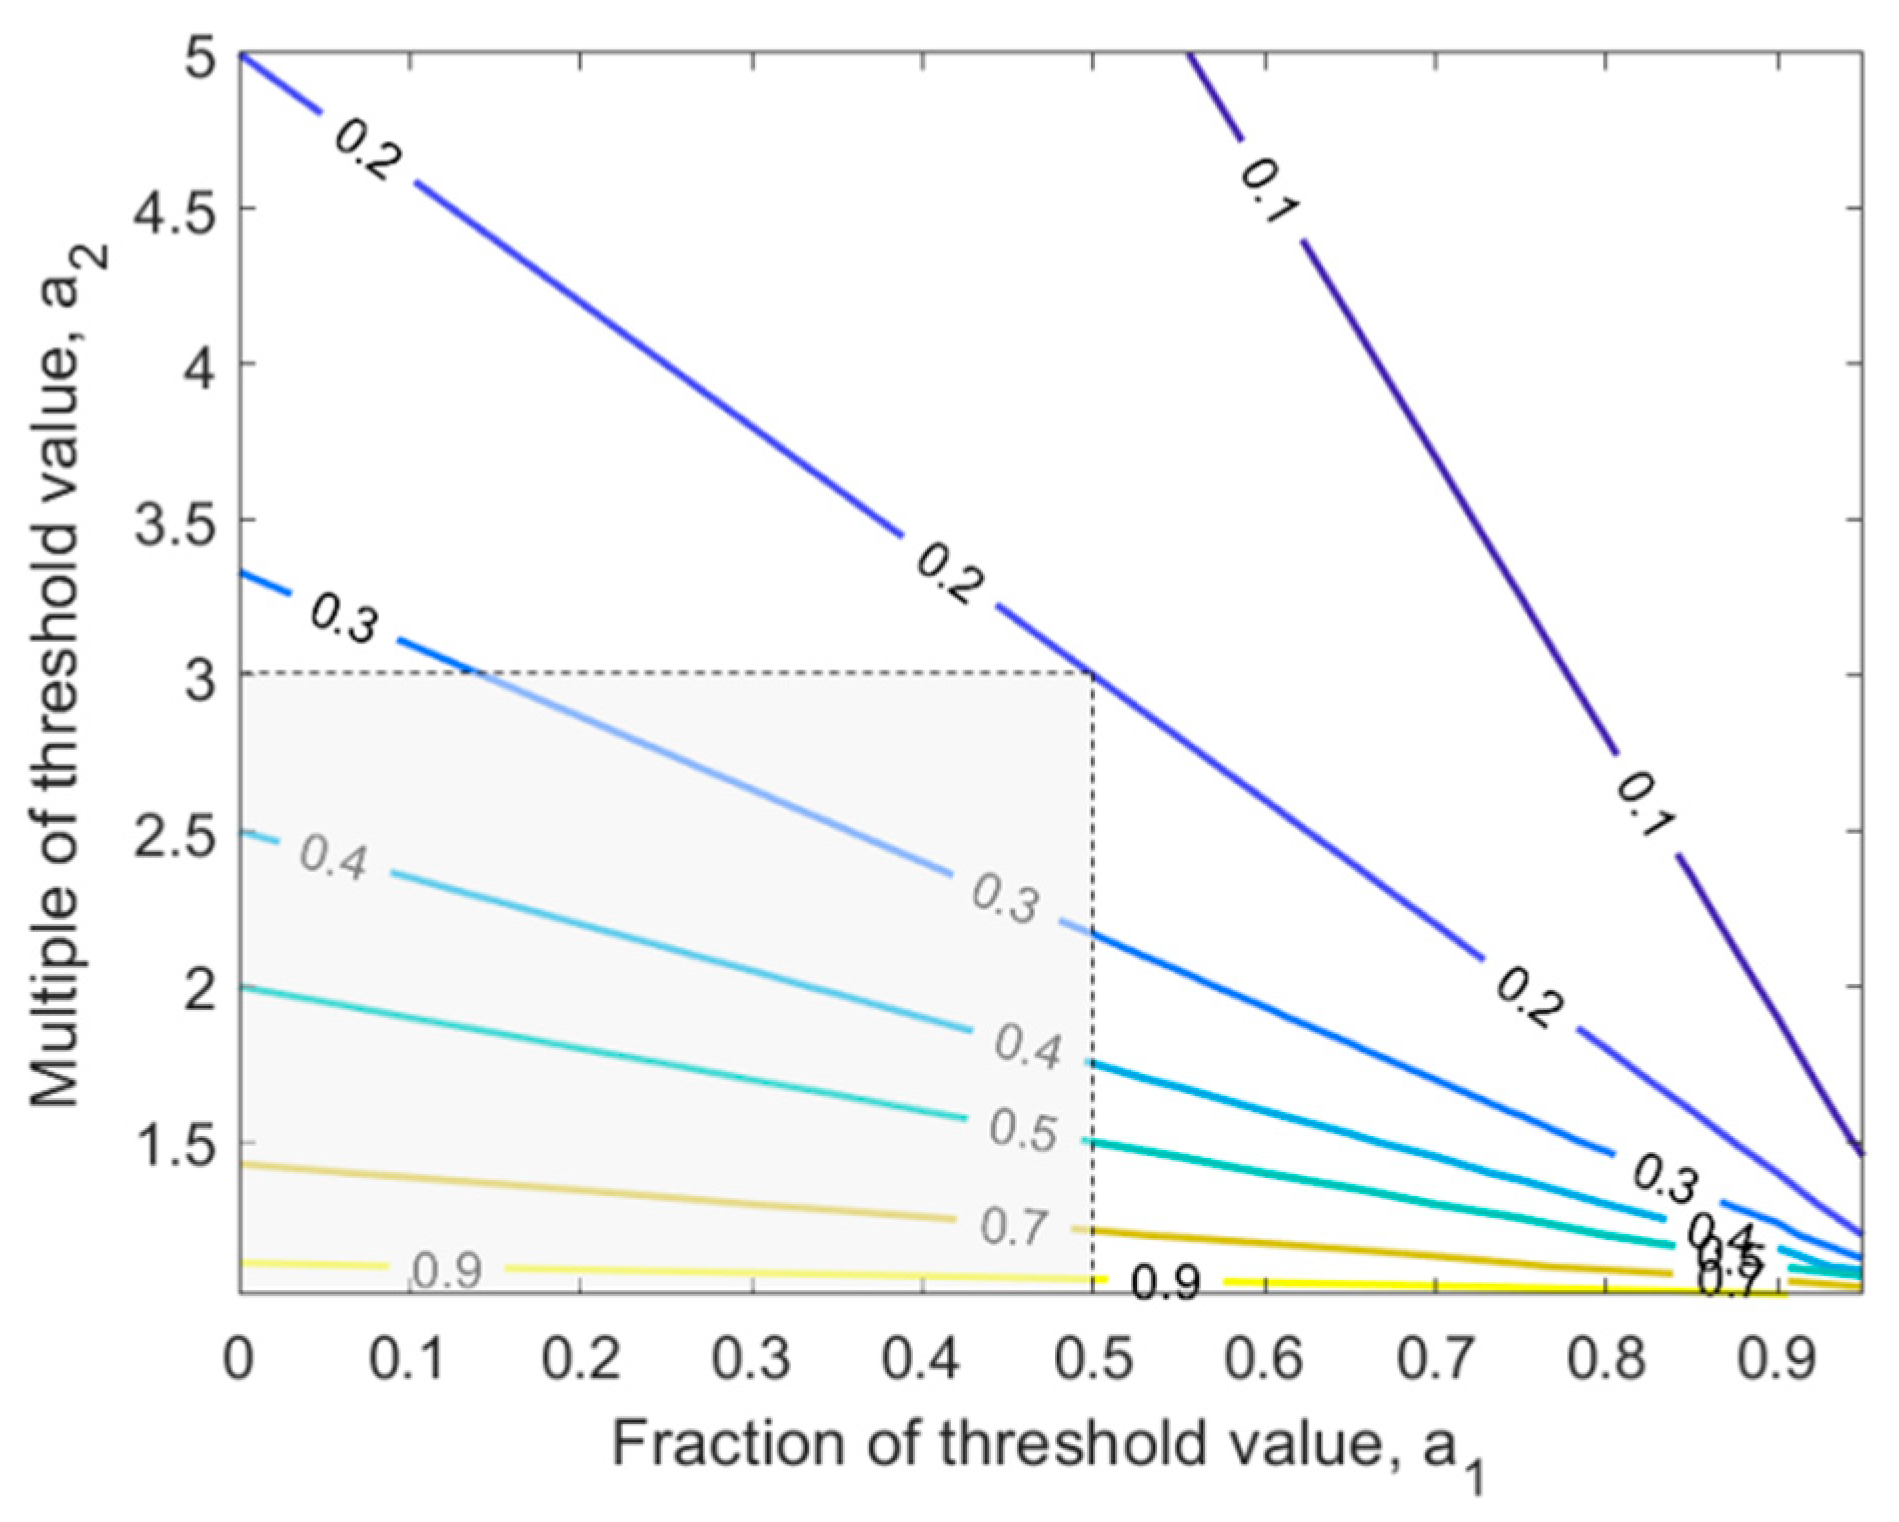
Figure 5 shows the isolines of the fraction of time (concentration averaging time) when exceedance of the limit value in the cabin air is allowed. The chart was prepared based on Equation (10). It was assumed that in the period when the limit concentration is not exceeded, the concentration in the cabin air may be greater than in the clean air. The biggest value of this concentration can be determined from the chart. For example, as shown by the grey field in Figure 5, if it is expected that the concentration of a substance will be three times greater than the limit value (and not higher) during 20% of the working shift, and for the rest of the time (80%), the concentration would have to stay below half of the threshold.
The chart shown in Figure 5 may be applied for planning the duration of periods when the threshold concentration exceedance is allowed in the cabin air, as well as the exceedance magnitude. However, controlling compliance with H&S standards by means of balancing the times when the substance concentration remains below and above the threshold may be realized in practice when certain requirements are fulfilled. The principal issue is the availability of technical measures that allow for adjustment of the concentration in the air inside the cabin. For example, this may be achieved by modifying the composition of the air delivered to the cabin using dedicated filters or by periodically moving the vehicle to a less polluted zone of the mine. Additionally, a dedicated air pollution monitoring system would be necessary to provide the information needed to adjust the periods when the concentration is exceeded and not exceeded, on a continuous basis. The potential delivery of clean air to achieve a reduction of the pollutants concentration in the whole cabin is not technically feasible due to the amounts of clean air required.
3.4. Personal Ventilation of Machine Operators Inside Cabin
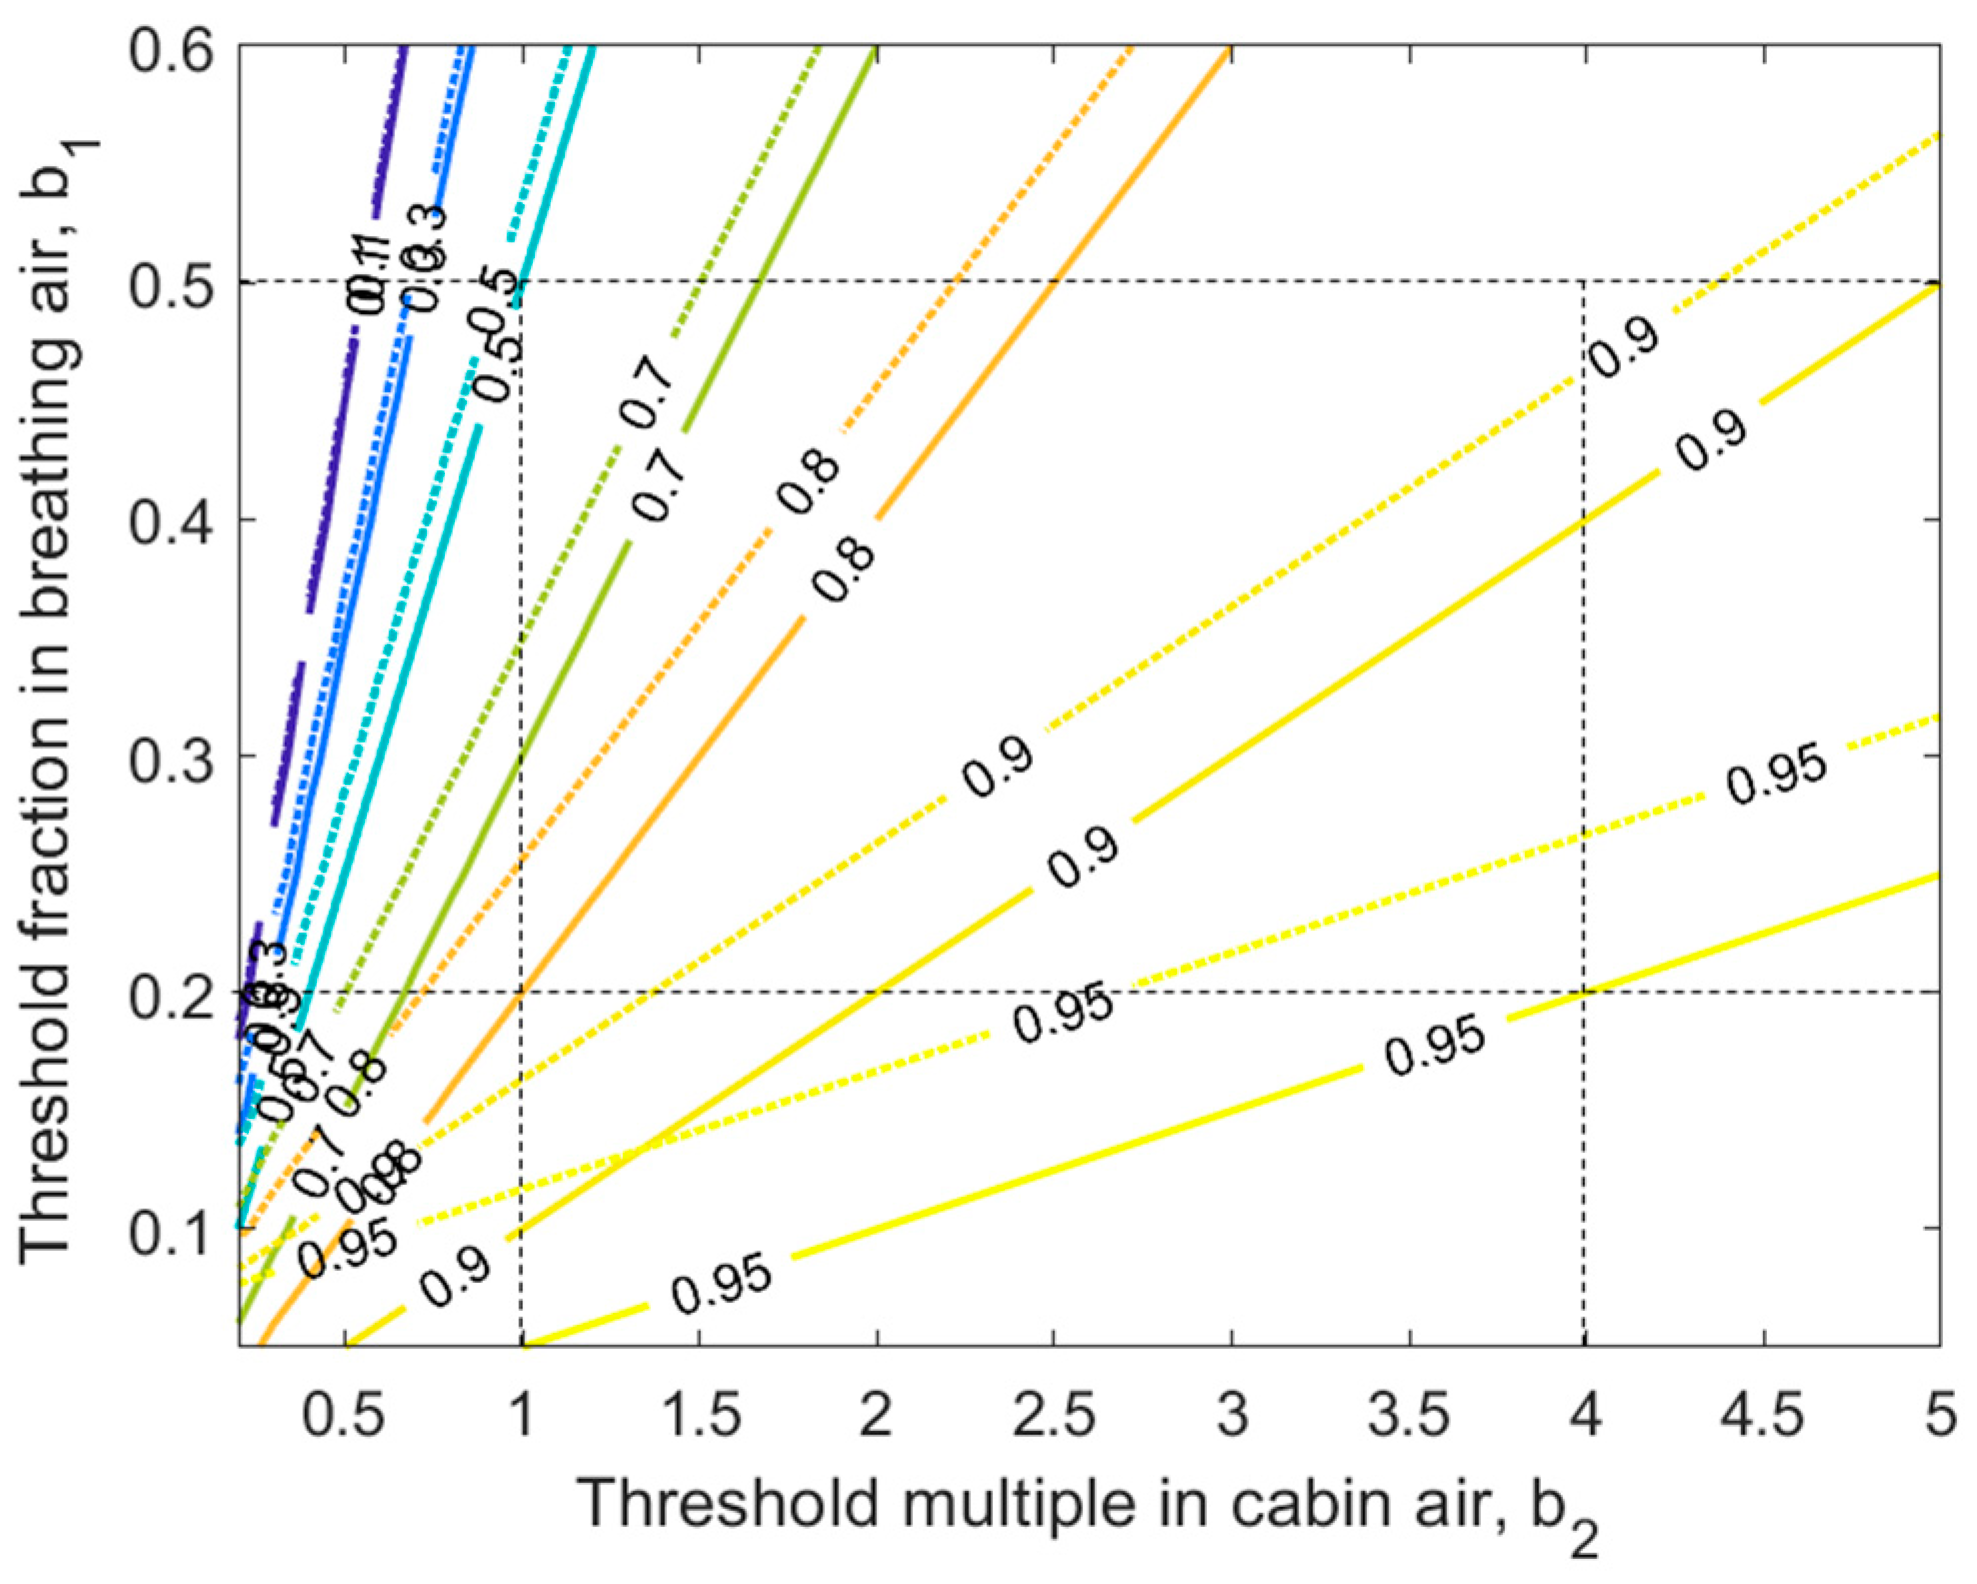
The other possibility to achieve H&S standards compliance is by personal ventilation of the mobile machine operator, which focuses on the air being breathed instead of the entire cabin. In order to ensure the proper quality of the breathing air, using personal ventilation, the adequate contribution of the clean air in the air inhaled by the operator has to be ensured (see Equation (12)). This contribution depends on the concentration of harmful substances in the cabin air, and their required concentration in the inhaled air, . Figure 6 displays the isolines of the clean air contribution limits in the breathing air (based on Equation (12), two-sided equal).
As shown in Figure 6, given the required quality of the breathing air, the minimum contribution of the clean air increases with the increasing contamination of the cabin air. If the concentration required in the breathing air is no greater than 20% of the limit value while its cabin air concentration is around the limit , the contribution of the clean air should be at least 80% in the case of NO, NO2, or CO (Figure 6, solid lines), and 85% in the case of CO2 (Figure 6, dotted lines). If the threshold in the cabin air is exceeded four times , the clean air contribution would have to increase to 95% in the case of NO, NO2, or CO (Figure 6, solid lines) and to about 97% for CO2 (Figure 6, dotted lines). On the other hand, the acceptance of breathing air of a poorer composition, e.g., at the level of 50% of the threshold would result in a much lower required contribution of the clean air (see Figure 6).
4. The Concept of the Method for Improving Air Quality Inside Machines Operating Underground
The analysis presented in Section 3 was the inspiration to propose a system which makes it possible to achieve an acceptable quality of air inhaled by the human operators of mobile machines operating underground. The system is the combination of ventilation, air-conditioning, filtration, and personal air supply. The concept is based on several assumptions.
- An operator can be exposed to many harmful species originating from different sources, including pollutants emitted by himself, mainly CO2. In most cases, it is impossible to accurately describe the air quality inside the vehicle cabin by a single indicator, as it combines the influences of various pollutants. Hence, improving the indoor air quality cannot focus on individual substances, and a comprehensive approach is recommended.
- The quality of the air inhaled by the machine operator depends on the pollution level around and inside the cabin of the mobile machine as well as the technical measures designed to remove harmful substances from the indoor air.
- The assurance of the appropriate air quality in the whole cabin can be ineffective, difficult from the technical point of view, economically unjustified, and/or unnecessary.
- The quality of the air inhaled by the operator depends mainly on the characteristics of the air in the breathing zone, i.e., a semi-spherical space around the mouth and nose. Therefore, the air in this space should be under particular control.
- Currently, the temperature and humidity inside cabins are easy to control. Filtration techniques allow the concentration of particulate matter to be reduced. However, easy removal of gaseous pollutants from the inhaled air is still an unresolved issue.
In response to these assumptions, a system was proposed that performs several functions: Heating and air-conditioning, ventilation, filtration, and the delivery of clean air directly to the inhalation region of the machine operator. The heating and air-conditioning are dedicated to maintaining the temperature and humidity of the indoor air at a comfortable level. Ventilation is responsible for the air exchange between the outdoor environment and the cabin, proper distribution of gas inside the cabin, and the dilution and removal of gaseous pollutants (especially CO2) from the indoor environment, but only in the situation when the concentration of these substances at the gas intake is lower than inside the cabin. Filtration allows the removal of particulate matter from the ventilation air and keeps its concentration inside the cabin below the required limits. The delivery of clean air directly to the strictly defined area of the cabin is aimed at obtaining acceptable air quality in the breathing zone of the operator.
In the proposed concept, the primary issues are the source of clean air, its delivery rate, and some technical aspects of air supply. We propose to use clean air from reusable, pressurized, onboard cylinders. Currently, compressed air cylinders are available with a filling pressure of 200 to 300 bar. They are made of steel, aluminum, or carbon fiber composites. The latter is the lightest and offers the greatest comfort. The compressed air tank may be fitted with a shut-off valve and a pressure regulator connected to this valve. The number and size of cylinders is determined by the required delivery rate of clean air. In traditional ventilation, 20 to 30 air changes per hour are required to vent the confined space. Such an amount cannot be delivered to the cabin using gas cylinders. We propose the direct supply of clean air into the inhalation region of the machine operator. In this way, an unpolluted microenvironment is created to serve as the source of breathing air for this person. The appropriate quality of the inhaled air is attained at much lower delivery rates of clean air. Assuming a human breathing rate of L/min, the duration of working period—8 h, and the limiting case when the operator’s breathing is completely covered by the clean air, the volume of clean air consumed is estimated as V = 3.84 m3. This demand may certainly be secured. There are commercially available compressed air cylinders providing 9.0 L/300 bar made of carbon composite [24] and with a free air volume of 2454 L. Roughly, two cylinders would be sufficient for the delivery of breathing air during the working shift of the mobile machine operator. If the actual breathing rate is higher, three cylinders would be recommended. It should be underlined that the presented solution is feasible regarding the consumption of clean air also in the case that all the breathing air of the machine operator is clean air.
5. Conclusions
The problem of ensuring proper air quality inside the cabins of mobile machines operating in underground mines has not been addressed successfully so far. The currently available cabin ventilation systems are insufficient when air pollution is high in the vicinity of the machines.
Based on the analytical models of indoor air quality, it was demonstrated that, upon normal ventilation, without gas filters involved, the vehicle cabin attains equilibrium with the surrounding air within minutes. Therefore, in the case of elevated concentrations of pollutants in the mine atmosphere, air quality standards will not be respected inside cabins. The isolation of this environment by lowering air exchange rates is ineffective, because it causes the build-up of CO2 and O2 depletion.
Calculations were presented showing that it is possible to ensure compliance with air quality standards in machine cabins by balancing the time periods when limit values are exceeded and not exceeded. However, for the implementation of this solution, it is crucial to recognize clearly the means of ensuring exceedance and non-exceedance conditions. Moreover, an air pollution monitoring system is needed.
Based on the overall analysis presented in this work, we proposed a comprehensive solution that allows acceptable air quality for the mobile machine operator to be achieved in almost every condition. The system is based on ventilation, air-conditioning, filtration, and a personal supply of clean air to the breathing zone of the operator. We demonstrated that this kind of clean air delivery is technically feasible, and the other components of the system are already in place. In our opinion, this concept offers an innovative perspective, and its range of applications is not limited to the mine environment.
Author Contributions
Conceptualization, A.S. and M.M.; methodology, A.S. and M.M.; software, M.M.; validation, M.M. and M.P.; formal analysis, M.M. and A.S.; investigation, M.M. and M.P.; resources, A.S. and W.S.; data curation, M.M. and M.P.; writing—original draft preparation, A.S., M.M., M.P., W.S.; writing—review and editing, A.S., M.M., M.P., W.S.; visualization, M.M.; supervision, A.S., W.S. All authors have read and agreed to the published version of the manuscript.
Funding
This research received no external funding.
Conflicts of Interest
The authors declare no conflict of interest.
References
- Mining. English Wikipedia. Available online: https://en.wikipedia.org/wiki/Mining (accessed on 20 October 2020).
- Donoghue, A.M. Occupational health hazards in mining: An overview. Occup. Med. 2004, 54, 283–289. [Google Scholar] [CrossRef] [PubMed] [Green Version]
- Elgstrand, K.; Sherson, D.L.; Jørs, E.; Nogueira, C.; Thomsen, J.F.; Fingerhut, M.; Burström, L.; Rintamäki, H.; Apud, E.; Oñate, E.; et al. Safety and Health in Mining: Part 1. Occup. Health S. Afr. 2017, 23, 10–20. [Google Scholar]
- Stephens, C.; Ahern, M. Worker and Community Health Impacts Related to Mining Operations Internationally. A Rapid Review of the Literature; Report of Mining, Minerals and Sustainable Development Project: London, UK, 25 November 2001. [Google Scholar]
- Belle, B. How relevant are engineering samples in the management of personal dust exposure? Int. J. Min. Sci Technol. 2018, 28, 707–713. [Google Scholar] [CrossRef]
- Haviland, D.; Marshall, J. Fundamental behaviours of production traffic in underground mine haulage ramps. Int. J. Min. Sci. Technol. 2015, 25, 7–14. [Google Scholar] [CrossRef]
- ISO 19296:2018, Mining—Mobile Machines Working Underground—Machine Safety; ISO: Geneva, Switzerland, 2018.
- Xu, B.; Chen, X.; Xiong, J. Air quality inside motor vehicles’cabins: A review. Indoor Built Environ. 2018, 27, 452–465. [Google Scholar] [CrossRef]
- Zulauf, N.; Dröge, J.; Klingelhöfer, D.; Braun, M.; Oremek, G.M.; Groneberg, D.A. Indoor Air Pollution in Cars: An Update on Novel Insights. Int. J. Environ. Res. Public Health 2019, 16, 2441. [Google Scholar] [CrossRef] [PubMed] [Green Version]
- Cheng, J.; Yang, S. Data mining applications in evaluating mine ventilation system. Saf. Sci. 2012, 50, 918–922. [Google Scholar] [CrossRef]
- Debia, M.; Couture, C.; Njanga, P.E.; Neesham-Grenon, E.; Lachapelle, G.; Coulombe, H.; Hallé, S.; Aubin, S. Diesel engine exhaust exposures in two underground mines. Int. J. Min. Sci. Technol. 2017, 27, 641–645. [Google Scholar] [CrossRef]
- Bugarski, A.D.; Cauda, E.G.; Janisko, S.J.; Mischler, S.E.; Noll, J.D. Diesel Aerosols and Gases in Underground Mines: Guide to Exposure Assessment and Control; Report of Investigations 9687: Pittsburg, PA, USA, October 2011. [Google Scholar]
- IARC Monographs on the Evaluation of the Carcinogenic Risks to Humans. Diesel and Gasoline Engine Exhausts and Some Nitroarenes; IARC: Lyon, France, April 2014. [Google Scholar]
- Marinello, S.; Lolli, F.; Gamberini, R. Roadway tunnels: A critical review of air pollutant concentrations and vehicular emissions. Transp. Res. Part D 2020, 86, 102478. [Google Scholar] [CrossRef]
- Langer, S.; Österman, C.; Strandberg, B.; Moldanová, J.; Fridén, H. Impacts of fuel quality on indoor environment onboard a ship: From policy to practice. Transp. Res. Part D 2020, 83, 102352. [Google Scholar] [CrossRef]
- Scott, J.L.; Kraemer, D.G.; Keller, R.J. Occupational hazards of carbon dioxide exposure. J. Chem. Health Saf. 2009, 16, 18–22. [Google Scholar] [CrossRef]
- Mathur, G. Field Monitoring of Carbon Dioxide in Vehicle Cabin to Monitor Indoor Air Quality and Safety in Foot and Defrost Modes; SAE Technical Paper 2009-01-3080: Warrendale, PA, USA, October 2009. [Google Scholar] [CrossRef]
- Grady, M.L.; Jung, H.; Kim, Y.C.; Park, J.K.; Lee, B.C. Vehicle Cabin Air Quality with Fractional Air Recirculation; SAE Technical Paper 2013-01-1494: Warrendale, PA, USA, April 2013. [Google Scholar] [CrossRef] [Green Version]
- Jung, H. Modelling CO2 Concentrations in Vehicle Cabin; SAE Technical Paper 2013-01-1497: Warrendale, PA, USA, April 2013. [Google Scholar] [CrossRef]
- Tartakovsky, L.; Baibikov, V.; Czerwinski, J.; Gutman, M.; Kasper, M.; Popescu, D.; Veinblat, M.; Zvirin, Y. In-vehicle particle air pollution and its mitigation. Atmos. Environ. 2013, 64, 320–328. [Google Scholar] [CrossRef]
- Chang, T.B.; Sheu, J.J.; Huang, J.W.; Lin, Y.S.; Chang, C.C. Development of a CFD model for simulating vehicle cabin indoor air quality. Transp. Res. Part D 2018, 62, 433–440. [Google Scholar] [CrossRef]
- Pepper, D.W.; Carrington, D. Modeling Indoor Air Pollution; Imperial College Press: London, UK, 2009. [Google Scholar]
- Mackenzie, F.T. Our Changing Planet: An Introduction to Earth System Science and Global Environmental Change, 4th ed.; Prentice Hall: Boston, MA, USA, 2011. [Google Scholar]
- Regulation of the Minister of Family, Labor and Social Policy of 12th June 2018 on the Maximum Allowable Concentrations and Intensities of Factors Harmful to Health in the Work Environment; Minister of Family, Labor and Social Policy: Warsaw, Poland, 3 July 2018; item 1286.
Figure 1.
Cabin of a loader—autonomous mobile machine operating in underground mines. Internal dimensions: A—1275 mm, C—1335 mm, D—800 mm.
Figure 1.
Cabin of a loader—autonomous mobile machine operating in underground mines. Internal dimensions: A—1275 mm, C—1335 mm, D—800 mm.

Figure 2.
Time when the concentration of a substance in cabin air increases from the clean air level to the predefined threshold value. The time is displayed as a function of the air exchange rate between the cabin and its surroundings, for various concentrations of a substance in the mine air. The concentration in the mine air refers to the threshold level multiple, using . Solid lines refer to substances emitted only outside the cabin, such as NO, NO2, and CO. Dotted lines refer to CO2.

Figure 3.
H&S standard compliance in cabin air with respect to substances emitted exclusively outside cabin, such as NO, NO2, and CO.
Figure 3.
H&S standard compliance in cabin air with respect to substances emitted exclusively outside cabin, such as NO, NO2, and CO.

Figure 4.
H&S standard compliance in cabin air with respect to CO2.

Figure 5.
Isolines display the fraction of time when the threshold concentration may be exceeded in the cabin air (no more than threshold multiple), while in the remaining time the concentration remains below the threshold (no more than the threshold fraction). This ensures H&S standard compliance.
Figure 5.
Isolines display the fraction of time when the threshold concentration may be exceeded in the cabin air (no more than threshold multiple), while in the remaining time the concentration remains below the threshold (no more than the threshold fraction). This ensures H&S standard compliance.

Figure 6.
Isolines display the fraction of the clean air, that has to be delivered to the breathing zone of the mobile machine operator, to ensure the required quality of the breathing air (threshold fraction) for the particular composition of the cabin air (threshold multiple). Solid lines refer to the substances emitted only outside the cabin such as NO, NO2, and CO. Dotted lines refer to CO2.


Table 1.
Concentrations of the selected substances in clean air [23].
Table 1.
Concentrations of the selected substances in clean air [23].
| Substance | Concentration (% mole) |
|---|---|
| CO2 | 0.035 |
| CO | 0.000025 |
| NO | 0 |
| NO2 | 0.000002 |
Table 2.
Threshold concentrations for the selected gaseous substances in the mine air [24]. The health and safety (H&S) standard is defined as the 8-h time-weighted average concentration of the substance.
Table 2.
Threshold concentrations for the selected gaseous substances in the mine air [24]. The health and safety (H&S) standard is defined as the 8-h time-weighted average concentration of the substance.
| Substance | Concentration (mg/m3) | Concentration 1 (ppm) |
|---|---|---|
| CO2 | 9000 | 4977 |
| CO | 23 | 20 |
| NO | 3.5 *, 2.5 ** | 2.8 *, 2.0 ** |
| NO2 | 0.7 | 0.4 |
1 Conditions: T = 293 K, p = 101.2 kPa; * Currently valid standard value; ** Standard value, valid from 2023.
Publisher’s Note: MDPI stays neutral with regard to jurisdictional claims in published maps and institutional affiliations. |
© 2020 by the authors. Licensee MDPI, Basel, Switzerland. This article is an open access article distributed under the terms and conditions of the Creative Commons Attribution (CC BY) license (http://creativecommons.org/licenses/by/4.0/).
Share and Cite
MDPI and ACS Style
Szczurek, A.; Maciejewska, M.; Przybyła, M.; Szetelnicki, W. Improving Air Quality for Operators of Mobile Machines in Underground Mines. Atmosphere 2020, 11, 1372. https://0-doi-org.brum.beds.ac.uk/10.3390/atmos11121372
AMA Style
Szczurek A, Maciejewska M, Przybyła M, Szetelnicki W. Improving Air Quality for Operators of Mobile Machines in Underground Mines. Atmosphere. 2020; 11(12):1372. https://0-doi-org.brum.beds.ac.uk/10.3390/atmos11121372
Chicago/Turabian StyleSzczurek, Andrzej, Monika Maciejewska, Marcin Przybyła, and Wacław Szetelnicki. 2020. "Improving Air Quality for Operators of Mobile Machines in Underground Mines" Atmosphere 11, no. 12: 1372. https://0-doi-org.brum.beds.ac.uk/10.3390/atmos11121372
Note that from the first issue of 2016, this journal uses article numbers instead of page numbers. See further details here.