Article

Comparison of Methodologies for Assessing Desert Dust Contribution to Regional PM10 and PM2.5 Levels: A One-Year Study Over Portugal

1
Department of Environment and Planning, CESAM, University of Aveiro, 3810-193 Aveiro, Portugal
2
Environmental Modeling Laboratory, Technical University of Catalonia, 08034 Barcelona, Spain
3
Department of Civil Engineering, CITTA, University of Coimbra, 3030-788 Coimbra, Portugal
*
Author to whom correspondence should be addressed.
Submission received: 15 November 2019 / Revised: 5 January 2020 / Accepted: 21 January 2020 / Published: 24 January 2020
(This article belongs to the Special Issue Studying the Effects of Dust on Weather, Climate, and Air Pollution)

Abstract

:
Desert dust outbreaks may affect air quality. This study estimates the importance of African dust contribution to the PM10 and PM2.5 concentrations observed in rural regional background sites in Portugal. Desert dust contribution is evaluated by two different approaches: A measurement-approach methodology based on the monthly moving 40th percentile, and a model-approach methodology based on WRF-CHIMERE simulations, whose performance is also assessed within this work. Several desert dust episodes affected atmospheric aerosols in the planetary boundary layer over Portugal during 2016. Their intensity was variable, with at least two events (21–22 February and 27–28 October) contributing to exceedances to the PM10 daily limit value defined in the European Air Quality Directive. African dust contributions obtained for the year 2016 with the measurement-approach methodology are higher than the ones simulated by WRF-CHIMERE. Contributions to PM10 and to PM2.5 concentrations range from 0 to 90 µg m−3 and from 0 to 30 µg m−3, respectively, in most of the regions and days. Caution must be employed when using measurement-approach methodologies to quantify dust contributions to PM levels when forest fires occur simultaneously with the long-range transport of desert dust, as happened in August 2016.

1. Introduction

Particulate matter (PM) concentrations in the atmosphere are influenced by several natural and anthropogenic sources. Amongst the natural processes, long-range transport of dust emitted from deserts and other arid areas may affect air quality, severely (e.g., References [1,2]). Those contributions from natural sources to PM levels can be assessed, but not controlled.
Despite a reduction, over the last years, of PM concentrations over Europe [3] and Portugal [4], PM10 and PM2.5 (particles with aerodynamic diameters smaller than 10 µm and 2.5 µm, respectively) continue to be pollutants of particular concern, exceeding the limit values defined by the European Air Quality Directive (Directive 2008/50/EC) for the protection of human health, every year in different monitoring sites. Where natural contributions to pollutants in ambient air can be determined with sufficient certainty and when exceedances are due in whole or in part to natural contributions, the Directive allows their subtraction when assessing compliance with air quality limit values. This subtraction is particularly important when penalties (due to exceedances of the legislated limit values) can be avoided.
The most accurate method to quantify dust contribution to PM concentrations is by sampling and performing a chemical characterization of the aerosol. However, such analyses are usually performed during specific campaigns and not as routine measurements of the atmosphere. Thus, other methods are required to estimate the contribution of dust to PM concentrations.
Currently, one of the official methods [5] adopted by the European Commission for evaluating the occurrence of African dust outbreaks and quantifying their contributions, and the one adopted by the Portuguese Environment Agency, is a statistical approach based on the variability at rural background sites [6] (hereafter referred to as P40). It is based on the application of a 30-day moving 40th percentile to the PM data series in rural background stations, after excluding those days impacted by African dust, which must be previously identified based on satellite observations, model back-trajectories and/or dust forecast models. The feasibility of this method was demonstrated by comparing experimentally measured concentrations of the mineral matter determined at three Spanish rural background sites (Monagrega and Montseny, both located in the Eastern part of the Iberian Peninsula, and Bellver, located in the Balearic Islands) versus the estimated African dust contributions obtained by this procedure.
Other measurement-based methodologies to detect and quantify African dust contributions to PM levels are found in the literature. The Tel Aviv University, in Israel, developed a method which uses only PM10 and PM2.5 measurements from automatic stations [7]. This method employs an automatic algorithm with three thresholds and does not require any other inputs, such as satellite observations, model back-trajectories, dust forecast models, or mineralogical analyses. Viana et al. [8] compared this method with the one described above, and found that the P40 method is more conservative in the detection of African dust episodes, as it is less affected by interferences from local dust sources.
Another procedure for quantifying the wind-blown desert contributions to daily average PM10 concentrations from monitoring sites was proposed by Gómez-Losada et al. [9]. This measurement-based methodology is based on the use of Hidden Markov Models. In that study, the annual average Saharan PM10 contribution in the Canary Islands, Spain, was estimated and compared to the one estimated by the P40 method. The annual contribution of North African episodes to the PM10 mean value in the Canarias Archipelago coincides markedly with the same estimation made with the P40 method.
Recently, some modifications to the P40 methodology were suggested and translated into an automatic tool by Barnaba et al. [10]. This P40-revised methodology was successfully implemented over Italy and showed better performances in predicting timing and absolute values of the desert-dust contribution to the daily PM10 concentrations with respect to the official P40 approach. Moreover, in the scope of the inDUST COST Action (https://cost-indust.eu, CA16202), a workgroup is testing and comparing the different methods available to quantify desert dust contribution to PM concentrations, identifying their advantages and limitations, with the purpose of harmonizing this assessment among the European Union.
In addition to atmospheric monitoring, modelling is an important tool to understand the behavior of species and pollutants in the atmosphere. Several numerical models are able to estimate dust sources and sinks in the atmosphere, to simulate transport and ultimately contributions to PM concentrations, such as the BSC-DREAM8b [11], SKIRON [12], CHIMERE [13] and NMMB/BSC-Dust [14] models, among many others. Moreover, dust is now included in many operational forecast systems, and several dust-related products are available for Northern Africa and Europe, for example, due to the work of the Sand and Dust Storm Warning Advisory and Assessment System (SDS-WAS), established by the World Meteorological Organization (WMO).
In this study, we aim to assess desert dust contribution to PM10 and PM2.5 concentrations over Portugal for the year 2016. We will apply Escudero’s statistical approach (P40) to one year of particulate matter concentrations over Portugal and compare the results to model estimates performed using the Portuguese operational air quality forecast system (based on WRF-CHIMERE simulations). Moreover, the calculation of the number of days of exceedance to the PM10 daily limit value, before and after the subtraction of the African dust contributions, will be performed for the different estimates.

2. Methodology

In this study, the P40 method, officially method adopted by the Portuguese Environment Agency, is applied to air quality data over Portugal considering a one-year period (2016). In addition to the P40 method, a model-based methodology is applied, and the results of both approaches are compared. In the model-based methodology, the influence of African dust outbreaks on PM levels is quantified using mineral dust concentrations simulated by the WRF-CHIMERE modelling system, which results are also assessed.

2.1. The Measurement-Based P40 Method

The measurement-based P40 method is a statistical methodology applied to PM data series to calculate daily African dust contributions to PM10 and PM2.5. It is based on the application of a 30-day moving 40th percentile to the PM10 or PM2.5 data series in rural background stations, after excluding those days impacted by African dust. The days impacted by African dust should be identified based on various data and information, including satellite observations, model back-trajectories and dust forecast models. In days affected by African dust, the 30-day moving 40th percentile is assumed to be the theoretical background concentration of PM without African dust input. Therefore, the African dust contribution is obtained by the difference between the experimental PM10 or PM2.5 concentration and the calculated 40th percentile value. This methodology was initially published considering the 30th percentile [6]. For conservative reasons, the 40th percentile was later adopted instead of the 30th one [5].
This calculation, done for rural background sites, permits to estimate the daily contribution of African dust for the whole region. The estimated value may then be subtracted from the daily PM levels observed at other monitoring stations in the same region. Over Portugal, six rural background sites are usually considered for the assessment of African dust contribution to PM levels, which are identified in Table 1.
The impact of mineral dust outbreaks on PM10 and PM2.5 ambient concentrations is calculated for the five sites Fundão (FUN), Montemor-o-Velho (MOV), Chamusca (CHA), Terena (TER) and Cerro (CER). Although all those sites are classified as rural regional background, they are located in different regions; thus, they may exhibit the influence of different landscapes, land uses, local climate and topography. Douro Norte (DRN) data has not been used, due to the low quantity of available observations (see Table 1) during the year in the analysis.

2.2. The WRF-CHIMERE Modelling System

In this work, the numerical simulations of atmospheric physical and chemical properties are based on the Weather Research and Forecasting (WRF) meteorological model [15], whose outputs drive the CHIMERE chemistry-transport model [16], developed in France at the Dynamic Meteorology Laboratory from the Institute Pierre Simon Laplace (IPSL/LMD), French National Institute for Industrial Environment and Risks (INERIS) and Inter-University Laboratory of Atmospheric Systems (IPSL/LISA). Since the WRF-CHIMERE is the modelling system used in the Portuguese operational air quality forecast system, it has been extensively tested and validated. Those exercises confirmed the reasonably good skills of the CHIMERE model for ozone and other gaseous pollutants concentrations [17]. Particulate matter presents a higher complexity than ozone. Many studies have recognized the difficulty of models to simulate the mass of PM over Europe (e.g., References [18,19]). As summarized by Basart et al. [20], the underestimation of PM10 may be related with the lack of dust and resuspended matter emissions, a possible underestimation of primary carbonaceous particles, the inaccuracy of secondary organic aerosol formation, the difficulty in representing primary PM emission from wood burning and other sources not considered in the emission inventory, such as pollutant sources over North Africa and a more general lack of knowledge on aerosol removal, dispersion and transport processes.
The WRF-CHIMERE modelling system is applied for the whole of 2016 considering three nested domains, depicted in Figure 1. High-resolution simulations were performed, using a coarse domain covering Southern Europe and Sahara Desert with a horizontal resolution of 27 × 27 km2 (CONT27); a second domain covering the Iberian Peninsula with 9 × 9 km2 of horizontal resolution (IP09); and the inner-most domain covering mainland Portugal, with 3 × 3 km2 (PT03). The vertical resolution in CHIMERE varies upward in a geometric progression. The lowest atmospheric layers are more refined, since these layers are critical for the modelling of boundary layer contamination, particularly in urban areas, but also in marine areas, in order to model the sea-salt emissions correctly, and in arid areas, for mineral dust emissions [21]. Although the most frequently used vertical discretization consists of eight vertical levels [16], in present simulations, a better representation of the free troposphere is employed, using 24 levels up to the 200hPa pressure level. The first model layer, which is closer to the surface, has a thickness of 3 hPa, about 30m. With this vertical discretization, we aim to reproduce the long-range transport of dust from North Africa better, as suggested by Menut et al. [16].
At the boundaries of the outermost domain, climatologies from global model simulations are used. The outputs from LMDz-INCA (INteraction with Chemistry and Aerosols model coupled to the Laboratoire de Météorologie Dynamique General Circulation Model) [22] are used for all gaseous and aerosol species, except for mineral dust. For this species, simulations from the GOCART (Goddard Chemistry Aerosol Radiation and Transport) model are used [23]. For the nested domains, the boundary conditions are updated every hour using the previously performed coarse CHIMERE simulation. For the year 2016, 366 daily runs have been performed. In each run, the initial conditions are defined by the last hour from the previous-day model run.
In addition to the meteorological fields (from WRF) and to the chemical boundary conditions, the air quality modelling system must be fed with primary pollutant emissions. The main human activities emissions (traffic, industries and agriculture, among others) are derived based on data from the annual UNECE/EMEP emission database (European Monitoring and Evaluation Program, directed by the United Nations Economic Commission for Europe) [24], following a procedure of spatial and temporal downscaling. The spatial allocation of surface emissions on the CHIMERE grid is based on a classification with four landuse types: Urban, crop, water or forest. Then, for each grid cell, hourly estimates are derived, assuming seasonal factors and 24-h profiles for each country and SNAP (Selected Nomenclature for sources of Air Pollution) sector. In addition, EMEP pollutants are split into model species, according to the chemical mechanism selected in these simulations: The seven inventory pollutants (CO, NOx, SOx, NMVOC, NH3, PM10 and PM2.5) are split into the 42 reduced Melchior species and eight chemical operators.
Natural emissions estimates are also taken into account by the model, namely, biogenic emissions, sea salt and dust. Forest fire emissions are not included in the simulations. The emissions related to the vegetation are computed online using the MEGAN model (Model of Emissions of Gases and Aerosols from Nature) [25]. Sea salt fluxes are calculated, according to Monahan et al. [26]. Dust emission fluxes are calculated using the parametrization of Marticorena and Bergametti [27] for saltation and the dust production model proposed by Alfaro and Gomes [28] for sandblasting. This calculation requires land-use data, which is used to provide a desert mask specifying what surface is potentially erodible. In these simulations, the USGS (United States Geological Survey) database, STATSGO-FAO, is employed, and the erodible land-use type applied as a desert mask for dust fluxes calculation is barren soil (white sand).

3. Results

3.1. How is the Modelling System Performing?

The ability of the WRF-CHIMERE system to simulate ground-level PM10 and PM2.5 concentrations is assessed through comparison of model outputs with concentrations routinely observed within the Portuguese air quality monitoring network. This comparison is performed for the five rural regional background sites previously selected.
The comparison between model results and observations, in terms of PM10 and PM2.5 annual means, is presented in Figure 2. The background levels are reasonably captured by the model in all monitoring stations, but TER. Mean differences (or bias) between modelled and observed concentrations are approximately 5 µg·m−3 for PM10 and 2 µg·m−3 for PM2.5, in CER, CHA, FUN and MOV. TER exhibits differences of 13 µg·m−3 for PM10 and 8 µg·m−3 for PM2.5. Among the five rural background monitoring stations included in this study, TER has the highest observed PM10 and PM2.5 mean concentrations. Its PM10 and PM2.5 mean concentrations are more than 5 µg·m−3 higher than the ones measured in FUN, CHA or CER. The TER monitoring station is located in Alentejo Interior, a predominantly arid region, with land use and land cover which may contribute to particulate resuspension and increase PM concentrations in the region.
To assess model agreement with observations on a daily basis, Taylor diagrams [29] relative to the mean background concentrations (e.g., daily average concentrations among the five monitoring stations) are presented in Figure 3. The Taylor diagram is one of the more useful methods for evaluating model performance, since it provides a way of showing simultaneously how three complementary model performance statistics vary: The correlation coefficient (r), the standard deviation (sigma) and the root-mean-square (RMS) error. Correlation between modelled concentrations and observations is 0.6 for PM10 and 0.4 for PM2.5. This means that on a yearly basis, CHIMERE reproduces better the temporal variability across Portugal of PM10 than PM2.5. Standard deviation and root mean square error are, in absolute values, higher for PM10 than PM2.5, which is related to the higher PM10 daily values in comparison to PM2.5.
The results obtained for the model performance regarding PM10 concentrations in this study are moderately better than what was previously achieved by this modelling setup. A previous study by Russo et al. [30] shows a correlation coefficient of 0.4 for rural sites.

3.2. Assessment of Dust Contribution to PM10 and PM2.5 in Portugal, During 2016

3.2.1. Using the Measurement-Based Methodology

During 2016, the Portuguese Environment Agency identified in mainland Portugal 93 days (more details in Figure A1) as days impacted by African dust [31]. This identification was based on the dust forecast models BSC-DREAM8b [11] and SKIRON [12], and on the HYSPLIT (Hybrid Single-Particle Lagrangian Integrated Trajectory) model [32] For each day, we applied the P40 methodology in order to calculate the regional African dust contributions to PM10 and PM2.5 concentrations (AD10 and AD2.5, respectively) over Portugal. Results are presented in Figure 4 and Figure 5, for PM10 and PM2.5, respectively.
African dust contribution to PM levels is evident during a specific episode in February, during several episodes from mid-June to mid-August, and also during October and November. According to the P40 method, the highest daily contribution to PM10 occur during the February episode (on 22 February in TER (AD10 = 161 µg·m−3) and CHA (AD10 = 76 µg·m−3); on 21 February in CER, which has no measurements available during the 22nd) or on 13 August in the Centre region (FUN (AD10 = 82 µg·m−3) and MOV (AD10 = 77 µg·m−3) monitoring stations). Note that during these days, the contribution of African dust (AD10), only, is already sufficient to surpass the PM10 daily limit value defined by the European Air Quality Directive for the protection of human health (50 µg·m−3).
For each station, the days when the African dust contribution is higher than a certain threshold (2 µg·m−3 for PM10 and 1 µg·m−3 for PM2.5) were filtered, and a daily mean contribution was estimated, taking into account those days only. Results are presented in Table 2 for PM10 and in Table 3 for PM2.5.
The highest daily mean contribution of African dust to PM10 concentrations occurs in TER, which also has the highest number of days classified as impacted by African dust with a contribution higher than 2 µg·m−3. In this station, located in inland Alentejo, according to the P40 methodology, African dust contributes, on average, with nearly 19 µg·m−3 of particles with an aerodynamic diameter smaller than 10 µm, during the most affected 79 days by desert dust. The fact that the daily mean contribution is lower in CER (located in Algarve) than in TER should be interpreted carefully, since CER has no valid measurements during 22 February.
TER monitoring station also has the highest number of days classified as days impacted by African dust when the fraction below 2.5 µm is considered and a contribution higher than 1 µg·m−3 is imposed. However, it registers the lowest maximum daily contribution (about 22 µg·m−3), which occurs on 23 June. During 22 February, although a contribution of 161 µg·m−3 is estimated at this station for the particles with an aerodynamic diameter smaller than 10 µm, a contribution of 16 µg·m−3 only is estimated for the fraction below 2.5 µm. For this fraction (AD2.5), CER monitoring station has the highest maximum daily contribution (AD2.5 = 100 µg·m−3), which is registered during 22 February. There is no PM10 available data during this day at CER. However, AD2.5 estimated for this day is higher than the maximum daily contribution to PM10 estimated at this station during the whole year (AD10 = 54 µg·m−3, estimated for 21 February).
In terms of mean values of African dust contribution to PM2.5 (taking into account days with a contribution higher than 1 µg·m−3 only), FUN has the highest mean value (about 11 µg·m−3). However, this fact must be taken carefully, since FUN has the lowest number of days with AD2.5 ≥ 1 µg·m−3, and mean values are calculated for those days only. This happens because, as illustrated in Figure 5, FUN only has PM2.5 data until September (although there are valid observations for PM10 during the rest of the year). However, according to Reference [31], and as seen in Figure A1, there are still 31 potential days from October to December that could add to the 48 days identified for AD2.5.
Table 4 analyses the daily and annual parameters defined in the Directive 2008/50/EC for PM10 and PM2.5 concentrations, before and after the subtraction of the African dust contributions calculated according to the P40 method. Limit values established for the protection of human health are 50 (daily) and 40 µg·m−3 (annual) for PM10 and 25 µg·m−3 (annual) for PM2.5 concentrations. In terms of annual values, the average contribution of desert dust to the PM10 and PM2.5 concentrations is about to 3 µg·m−3 (4 µg·m−3 in TER) and 2 µg·m−3, respectively, roughly in the five regions in the analysis. Regarding the number of exceedances to the PM10 daily limit value, TER station registers the highest number of days of exceedances attributable to African dust (11 days). This value seems to decrease from South to North, as is expected, with CHA presenting seven days of exceedances, and the monitoring stations in the Centre presenting between three and five days of exceedances attributable to African dust. The exception to this behavior is CER monitoring station, located in the southernmost region of continental Portugal, which has only one day of exceedance attributable to African dust.

3.2.2. Using a Model-Based Methodology

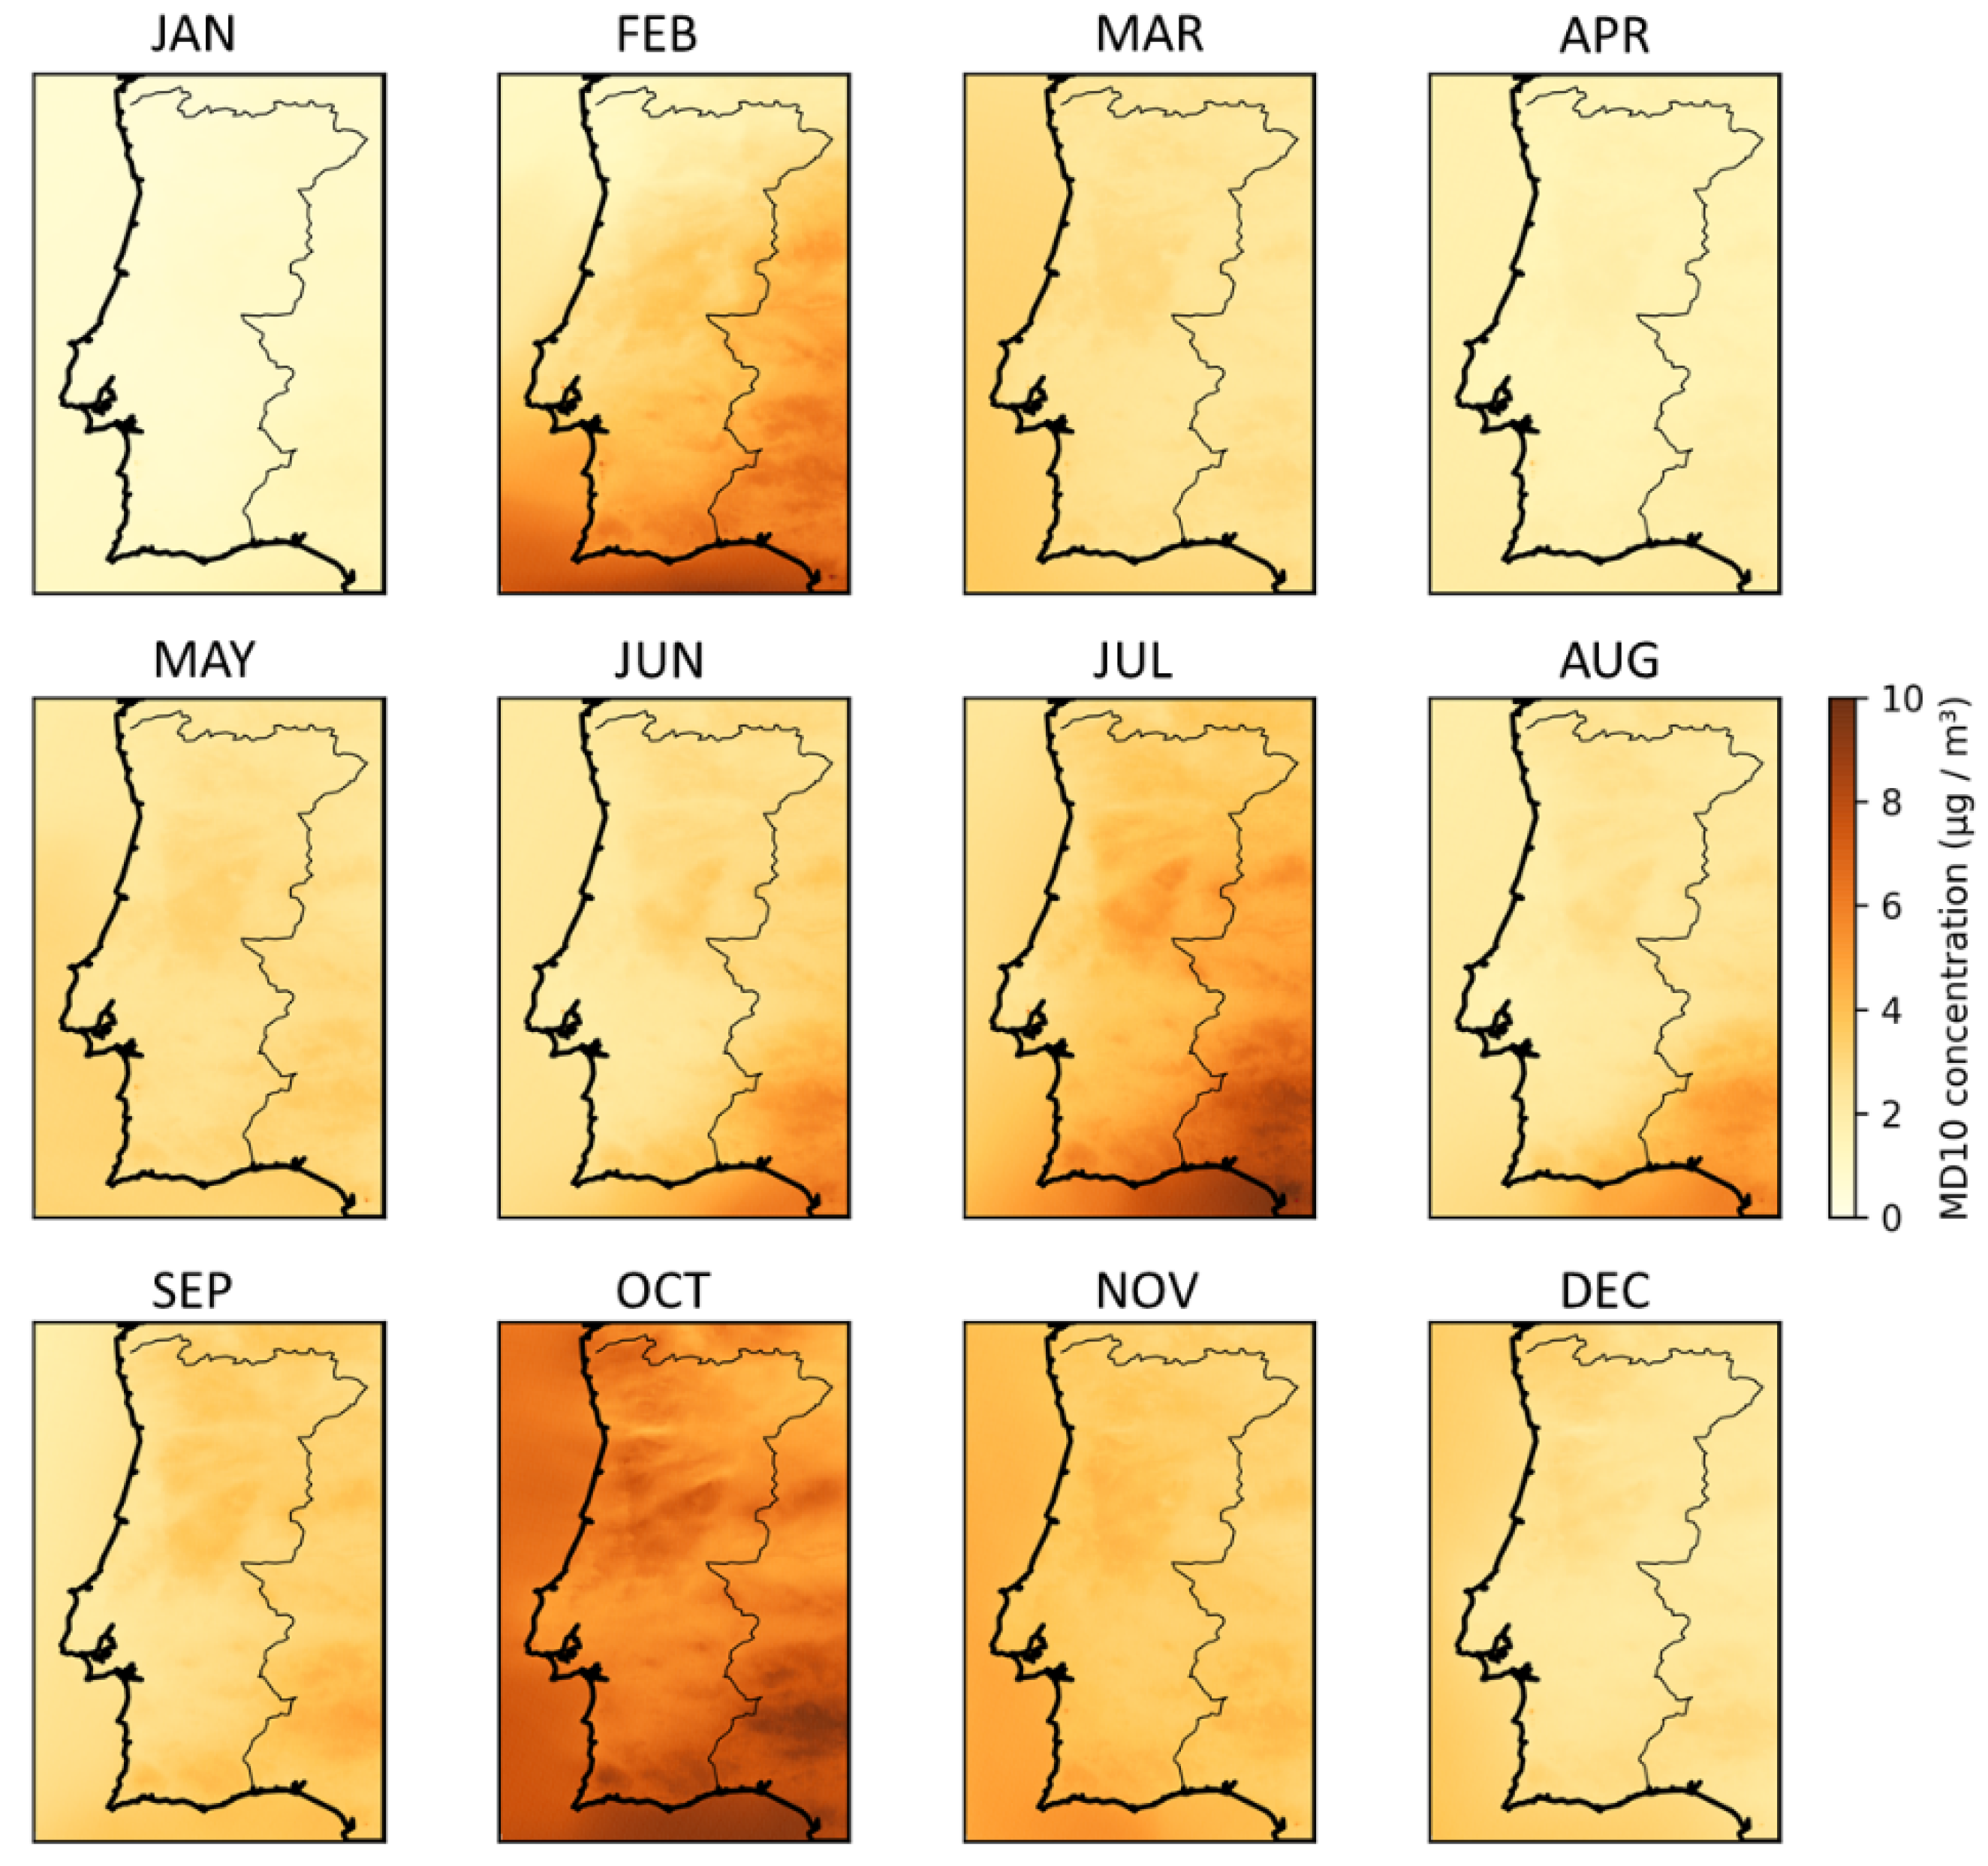
Model results point to an important contribution of natural sources to PM10 and PM2.5 concentrations over Portugal. Figure 6 and Figure 7 show the monthly mean mineral dust concentrations, modelled with WRF-CHIMERE, for the fractions with aerodynamic diameters below 10 µm and 2.5 µm, respectively. During 2016, WRF-CHIMERE results indicate October, February and July as the months with the highest contributions of desert dust to the PM10 levels over Portugal. During October, African dust contributes, on average, with between 4 and 9 µg·m−3 to PM10 concentrations. On the contrary, January and April have the lowest contribution, with mean contributions lower than 2 µg·m−3 through the whole country. Specific events during October have been investigated. A strong dust episode took place at the end of the month, from day 25 to day 29, contributing to exceedances to the PM10 daily limit value on 27–28 October over Portugal. This episode is identified both with the P40 methodology (see Figure 4) and with the model results. Moreover, other smaller events are identified during the month: From 4 to 6 October, and also on 20 October. According to Rodríguez et al. [33], who analyzed data observed in Spain for a 4-year period, during September and October Saharan intrusions over the Iberian Peninsula are mostly induced by low-pressure systems or by the simultaneous occurrence of a western/southwestern depression and eastern anticyclone. The analysis of the geopotential height at 500 hPa from 24 to 29 October 2016 (not shown) shows that this event was initiated by a cut-off low off the coast of Portugal, which drifted south and western-wards, and a high-pressure system over North Africa. The simultaneous occurrence of these two systems induced a strong meridional transport of dust loaded air from Algeria straight towards the Iberian Peninsula, affecting the PM surface concentrations in Portugal. Similar synoptic conditions were registered during the event of 21–22 February [34].
For PM2.5, during October, the contribution estimated by the model, is also higher than during the other months. African dust contributes, on average, during this month, with between 2 and 4 µg·m−3 to PM2.5 concentrations. During January, the contribution is the lowest, with mean values lower than 1 µg·m−3 throughout Portugal.
Modelled mineral dust surface concentrations over Portugal were previously explored by Monteiro et al. [35], focusing on the year 2011. In that previous study, BSC-DREAM8b model results indicated a high contribution of dust to the aerosol over Portugal during April and May. However, Basart et al. [11] point out a model overestimation of dust activity in Northern Algeria when compared to satellite estimates, mainly in spring, affecting, thus, the dust transported in the atmosphere. Moreover, spring events are mostly linked to depressions off Portugal, then advecting dust over Eastern Spain and Western Mediterranean [36], thus, high loads of African dust are not expected in Portugal in spring. This supports our results for 2016, which do not highlight April and May as months with stronger desert dust influence over Portugal.
To allow a comparison with the P40 estimates, modelled dust contributions to PM10 and PM2.5 (AD10 and AD2.5, respectively) are analyzed for each of the rural regional background monitoring stations. Time-series are presented in Figure 8 and Figure 9, for PM10 and PM2.5, respectively. According to model results, the episodes of African dust that mostly influence PM levels over Portugal occur in February, October and November. Unlike estimations with the P40 methodology (see Figure 4 and Figure 5), the model does not show evidence of dust episodes which affect air quality (PM10 and PM2.5) during August. The highest daily contributions to PM10 concentrations (see Table 5) occur during the February episode (22 February) in all stations, but MOV, where the maximum contribution is obtained on 28 October. Maximum values are estimated in CER (AD10 = 81 µg·m−3), followed by TER (AD10 = 56 µg·m−3), which are the two monitoring stations located in the southernmost region of continental Portugal. The same two episodes register the highest daily contribution of African dust to PM2.5 concentrations (see Table 6).
Table 7 analyses the daily and annual parameters defined in the Directive 2008/50/EC for PM10 and PM2.5 concentrations, before and after the subtraction of the African dust contributions, calculated according to the model estimates. In terms of annual values, the average contribution of desert dust to the PM10 and PM2.5 concentrations are about to 3 µg·m−3 and 1.5 µg·m−3, respectively, in the five regions in the analysis. Regarding the number of exceedances to the PM10 daily limit value, TER station registers the highest number of days of exceedances attributable to African dust (9 days).
Differently from the P40 methodology results (see Table 4), the number of exceedances registered in the monitoring stations located in the Centre (FUN and MOV) is almost the same before and after the subtraction of the African dust contribution estimated by the model (see Table 7). The differences in the number of exceedances after subtraction of the African dust rely on the classification of the event 9–15 August. Four days during this period, in FUN, and three days, in MOV, registered daily PM10 concentrations higher than 50 µg·m−3. The P40 methodology attributes these exceedances to African dust, while according to model simulations there was no significant influence of long-range transport of desert dust on air quality over the Centre of Portugal during those days.
For each monitoring station, a comparison between the desert dust contribution to PM10 and PM2.5 concentrations, calculated according to the P40 and the WRF-CHIMERE methods, are shown as scatter plots in Figure 10 and Figure 11, respectively. The data points that correspond to the period 8–15 August are plotted in red.
For PM10, excluding red points, the estimates from both methodologies are quite in accordance for the African dust fraction (Figure 10), especially for TER (Pearson’s r = 0.87), CHA (Pearson’s r = 0.81) and CER (Pearson’s r = 0.72). Nevertheless, the model-base methodology estimates are, in general, lower than the P40 ones, especially for TER (bias = 11.1 µg·m−3) and CHA (bias = 6.8 µg·m−3), for which the bias values calculated excluded the red points. During specific episodes, large differences may be found between estimates: For example, for TER, on 22 February, a contribution 161 µg·m−3 of dust to PM10 concentrations is obtained with the P40 method, against a contribution of 56 µg·m−3 according to the model results. Both estimates imply, however, the surpass of the daily limit value for the protection of human health. From the analysis of the scatter plots, CER appears to have the best agreement between the two methodologies. Note, however, that this station has no available data during 22 February, when PM10 concentrations were very high (a daily mean concentration value of 104 µg·m−3 was observed in this station for PM2.5, and a contribution of nearly 100 µg·m−3 of African dust was attributed to desert dust, for the fraction of particles below 2.5 µm only). When PM2.5 is considered (Figure 11), model estimates for African dust contribution are much lower than P40 ones, especially for FUN (bias = 4.9 µg·m−3) and CER (bias = 4.8 µg·m−3) remote regions. Part of the reason why the P40 method is higher could be due to other pollutants that are regularly mixed with Saharan dust in North Africa and contribute (typically within the range 2 to 4 µg·m−3) to the dust load estimated with this method [37].
PM obtained from model results corresponds to the PM concentration of the first model layer, which is closer to the surface and has a thickness of about 30 m. Although this height is much higher than what is typically employed in measurements, this is how the model setup is recommended when performing these simulations. Additionally, although the model vertical resolution (and the first model level height) can have a strong impact on surface concentrations, our tests show the variability and subsequent uncertainty of the results introduced with this discrepancy between height levels is not the main cause of the differences between the measured and modelled results.
The main differences in the results obtained with the two methodologies happen in the first half of August. During this period, a high contribution of African dust to the particulate matter over Portugal is estimated by the P40 methodology. In the monitoring stations FUN and MOV, in the Centre of Portugal, the maximum daily contribution of African dust to PM10 levels over the whole year 2016, is estimated during this period (AD10 = 82 and 77 µg·m−3 during 13 August, see Table 2). The same happens regarding the contribution of desert dust to PM2.5 concentrations, with a contribution of 56 and 44 µg·m−3 estimated by the P40 method (see Table 3). During these days, model results indicate, however, a small influence of long-range transport from North African deserts to the PM10 levels in the south of Portugal only (CER monitoring station, where a contribution of about 10 µg·m−3 of dust was calculated by the model on 15 August). In the remaining regions and days, the contribution of African dust to PM levels over Portugal is almost negligible.
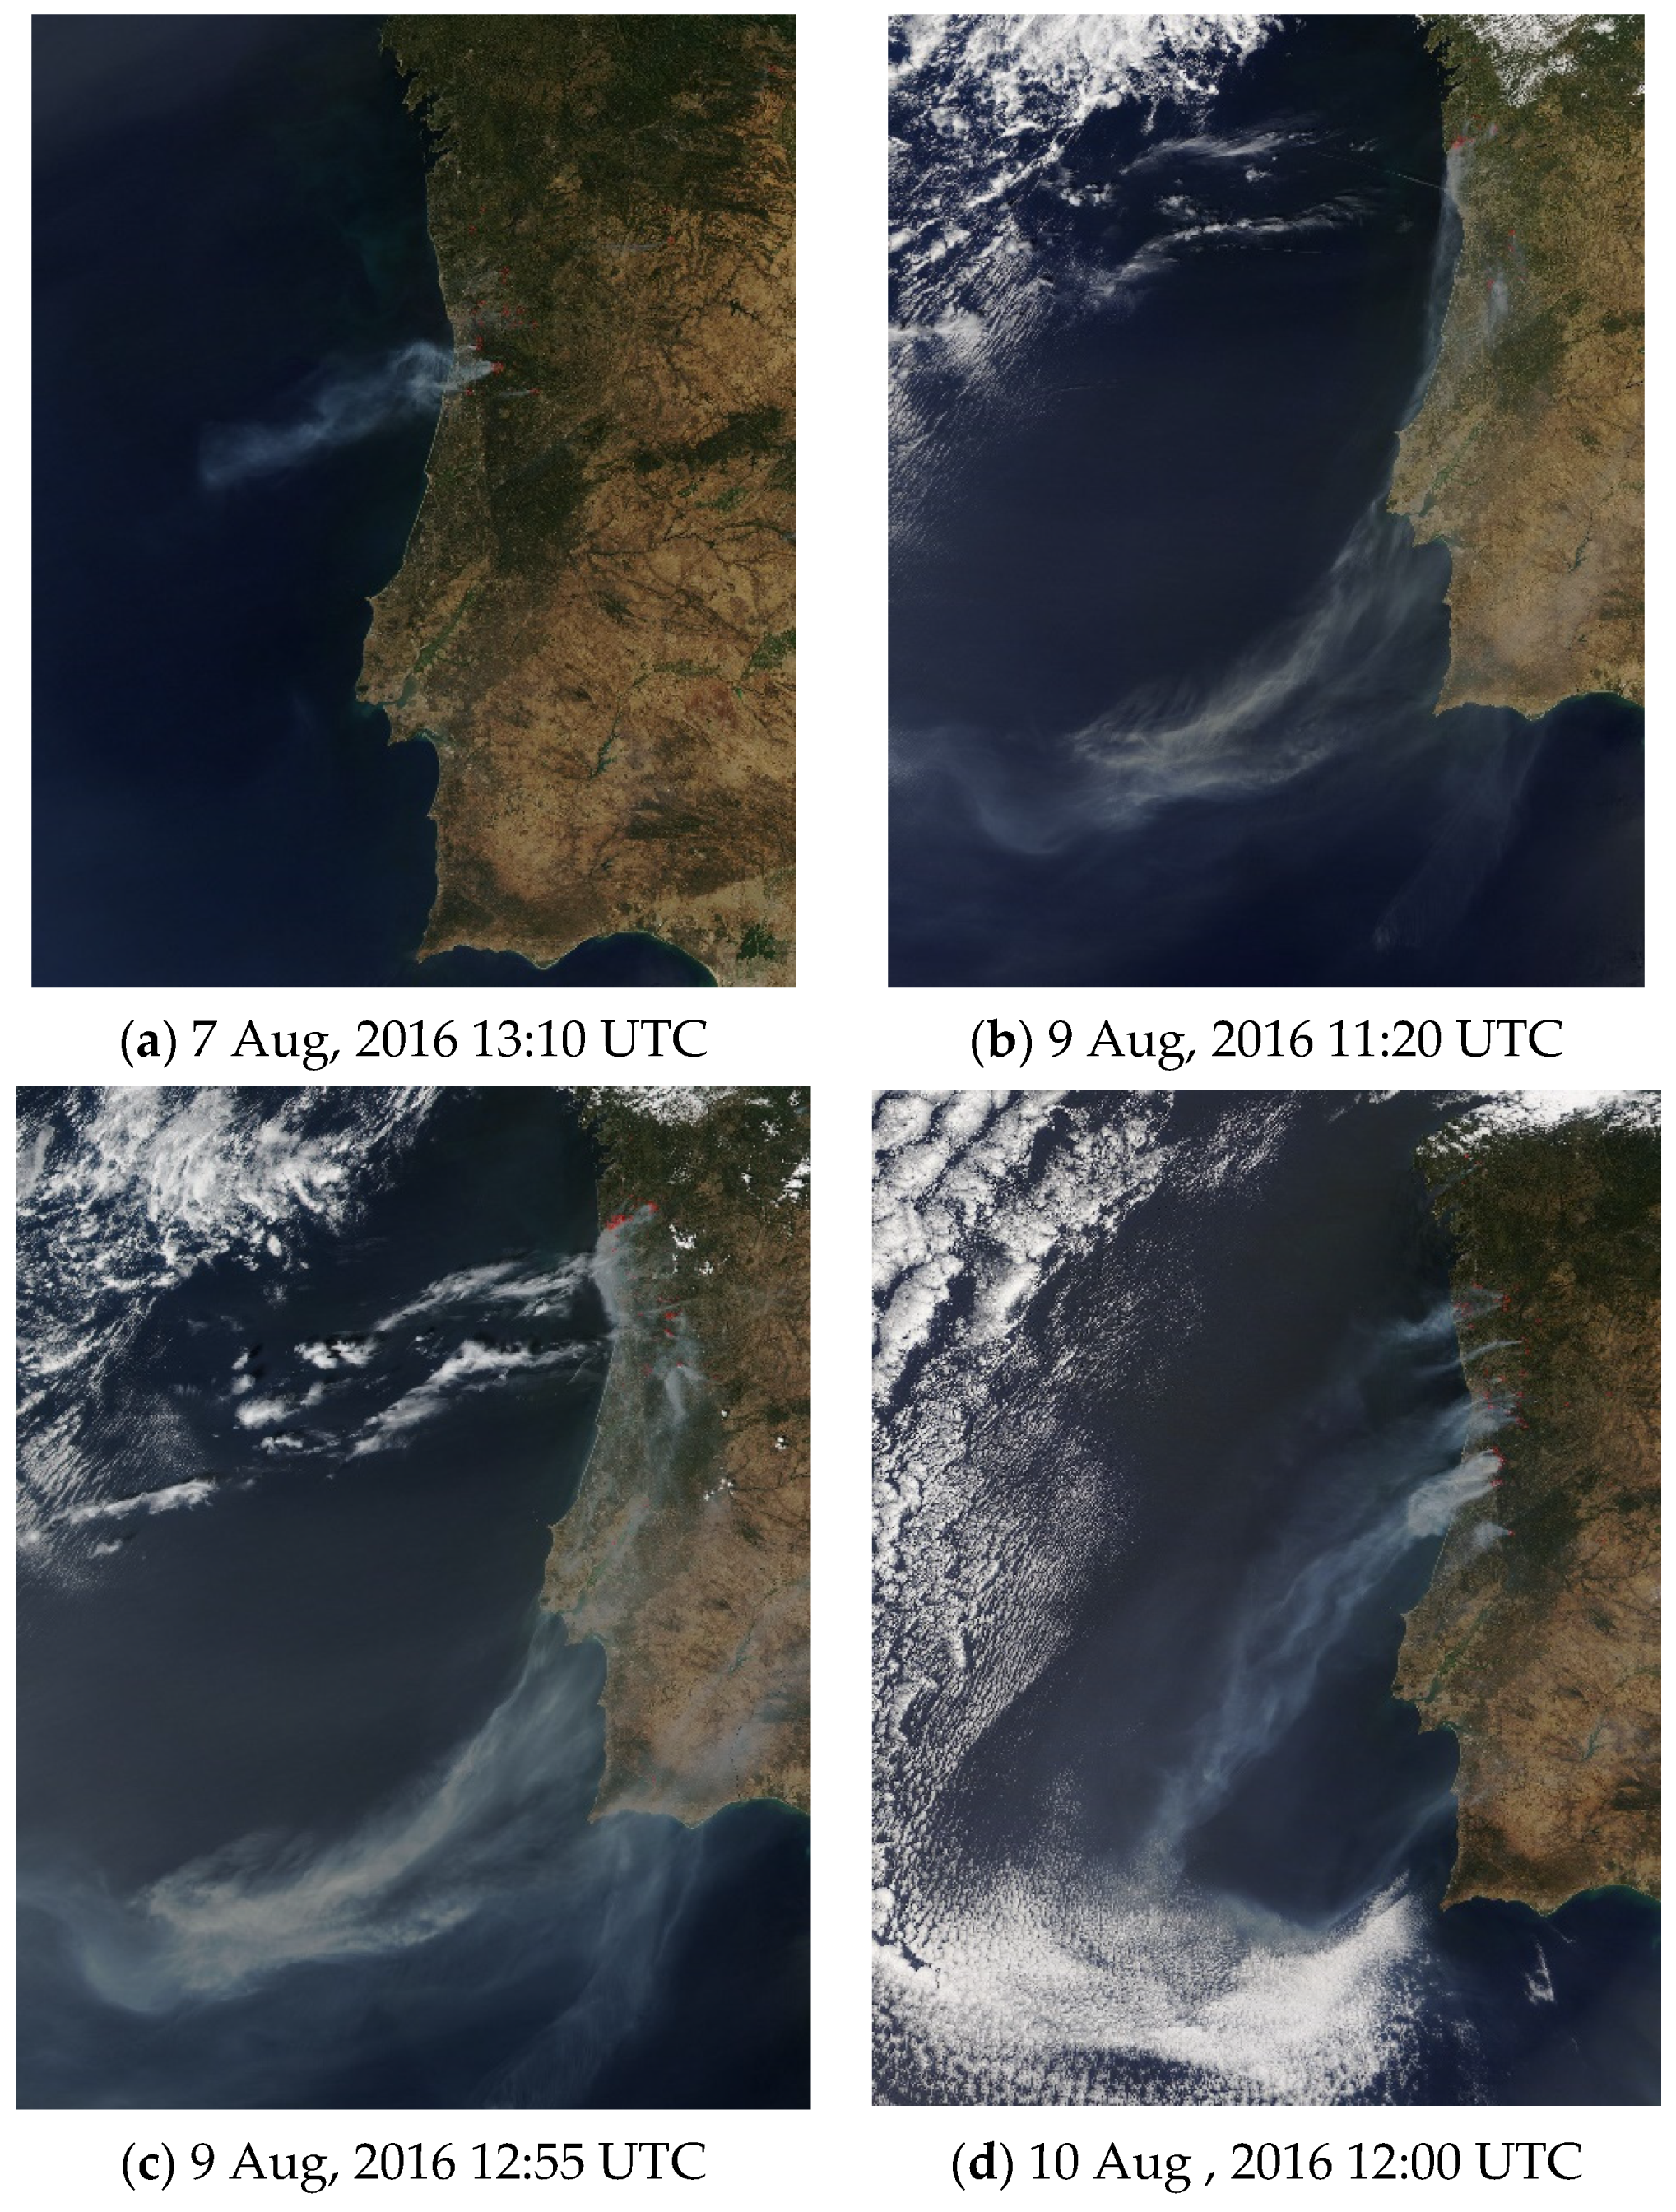
During the first half of August, Portugal battled numerous wildfires, mostly in the Centre and North of the country. Satellites began to detect those large numbers of fires on 6 August. In the following days, the fires grew more numerous, and the amount of smoke increased dramatically (Figure 12), affecting severely air quality. Observations from the AErosol RObotic NETwork (AERONET) (not included in this publication) show that on 13 August the aerosol loading was dominated by particles less than 1 micron—which supports the claim that a significant proportion of the aerosols on that day were from forest fires. Conversely, the data from the 21st and 22nd February show the opposite.
When extreme events, such as forest fires, occur simultaneously with the long-range transport of desert dust, the P40 methodology may lead to an overestimation of the contribution of African dust to PM levels. Moreover, the combination of desert dust episodes and forest fires is quite common during the summer in Portugal. During desert dust episodes, warm and dry air masses are transported over Portugal, which favor the occurrence and growth of wildfires. That situation occurred during August 2016 and in October 2017 during the severe forest fires in the Centre and North of Portugal linked with the Hurricane Ophelia [38].
According to the European guidelines, wildfires should also be considered a natural cause whose contribution to PM10 and PM2.5 atmospheric levels may be subtracted when assessing compliance with air quality limit values. In this sense, the usage of the P40 methodology is not problematic. However, for assessment purposes, it is important to identify the cause of the event. For that, the current method does not allow to distinguish between natural causes (or extraordinary anthropogenic events). The authors recommend complementing the current method with other sources of data, including the best available model simulations. The inclusion of additional routinely recorded observations, including AERONET and lidar data, could also assist with the identification of natural sources contributing the most to the aerosol load.

4. Summary and Conclusions

The importance of mineral dust contribution for the total aerosol mass observed in Portugal during 2016 was estimated by two different approaches: The official method adopted by the Portuguese Environment Agency (the P40 method) and a model-based methodology based on WRF-CHIMERE simulations. The results obtained by both methods for remote areas of Portugal were compared.
Although the P40 method is based on moving average of measurements, it relies on dust models for the selection of days identified as impacted by African dust. In Portugal, the Portuguese Environment Agency bases this selection in two dust models: The BSC-DREAM8b and the SKIRON. Then, the quantification of the desert dust contribution in terms of particles with aerodynamic diameters smaller than 10 and 2.5 µm is based on measured data only.
In general, African dust contributions obtained with the P40 methodology are higher than the ones simulated by WRF-CHIMERE. Contributions to PM10 concentrations range from 0 to 90 µg·m−3 in most of the regions and days (TER is an exception, as a contribution higher than 150 µg·m−3 is estimated for 22 February. During this day, the largest difference between estimates occur, of more than 100 µg·m−3—both implying, however, the surpass of the legislation. CER, located in the southernmost region of Portugal, has no measurements available during this day). Excluding 22 February (in CER), African dust contributions up to 30 µg·m−3 are found for PM2.5 levels.
When other extreme events, such as forest fires, occur simultaneously with long-range transport of desert dust, this methodology may classify the event as a desert dust event when that is not the main factor affecting PM concentrations (e.g., the contribution of African dust to PM levels is overestimated). Moreover, the combination of desert dust episodes and forest fires is quite common during the summer in Portugal, as happened in August 2016. Therefore, we recommend complementing the P40 methodology with other sources of data, including the best available model simulations, in order to allow the identification of the cause of the event.
The results presented in this study confirm that dust is an abundant type of natural atmospheric aerosol in the planetary boundary layer over Portugal. According to our results, desert dust episodes were quite frequent during 2016. Their intensity was variable, with at least two events contributing to exceedances to the PM10 daily limit value defined in the Air Quality Directive. Those severe episodes took place during 21–22 February and 27–28 October 2016, and have affected the air quality in all the regions studied in this work.

Author Contributions

Conceptualization, C.G. and O.T.; Data curation, C.G.; Formal analysis, C.G.; Funding acquisition, C.G. and O.T.; Methodology, C.G. and A.M.; Project administration, O.T.; Resources, C.B.; Software, C.G. and A.M.; Supervision, C.P., J.M.B. and O.T.; Visualization, C.G.; Writing—original draft, C.G.; Writing—review and editing, C.P., A.M., M.R., A.P.F. and O.T. All authors have read and agreed to the published version of the manuscript.

Funding

This research was funded by FCT – Portuguese Foundation for Science and Technology and FEDER (within the PT2020 Partnership Agreement and Compete 2020), grant numbers UID/AMB/50017 - POCI- 01-0145-FEDER-007638 (CESAM associated laboratory), MIT-EXPL/IRA/0023/2017 (ISY-AIR research project) and POCI-01-0145-FEDER-029374 (ARTUR research project).

Acknowledgments

The authors acknowledge the Portuguese Environment Agency (APA) and the Regional Coordination and Development Commissions (CCDRs) for their effort in establishing and maintaining the air quality monitoring sites used in this investigation.

Conflicts of Interest

The authors declare no conflict of interest.

Appendix A

Figure A1. Days identified as impacted by African dust by the Portuguese Environment Agency, during 2016.
Atmosphere 11 00134 g0a1

References

  1. Chatoutsidou, S.E.; Kopanakis, I.; Lagouvardos, K.; Mihalopoulos, N.; Tørseth, K.; Lazaridis, M. PM10 levels at urban, suburban, and background locations in the eastern Mediterranean: Local versus regional sources with emphasis on African dust. Air Qual. Atmos. Health 2019, 12, 1359–1371. [Google Scholar] [CrossRef]
  2. Gama, C.; Tchepel, O.; Baldasano, J.M.; Basart, S.; Ferreira, J.; Pio, C.; Cardoso, J.; Borrego, C. Seasonal patterns of Saharan dust over Cape Verde-a combined approach using observations and modelling. Tellus B 2015, 67. [Google Scholar] [CrossRef] [Green Version]
  3. Barmpadimos, I.; Keller, J.; Oderbolz, D.; Hueglin, C.; Prévôt, A.S.H. One decade of parallel fine (PM2.5) and coarse (PM10–PM2.5) particulate matter measurements in Europe: Trends and variability. Atmos. Chem. Phys. 2012, 12, 3189–3203. [Google Scholar] [CrossRef] [Green Version]
  4. Gama, C.; Monteiro, A.; Pio, C.; Miranda, A.I.; Baldasano, J.M.; Tchepel, O. Temporal patterns and trends of particulate matter over Portugal: A long-term analysis of background concentrations. Air Qual. Atmos. Health 2018, 11, 397–407. [Google Scholar] [CrossRef] [Green Version]
  5. European Union. Establishing Guidelines for Demonstration and Substraction of Exceedances Attributable to Natural Sources Under the Directive 2008/50/EC on Ambient Air Quality and Cleaner Air for Europe. In European Comission Comission Staff Working Paper; European Union: Brussels, Belgium, 2011. [Google Scholar]
  6. Escudero, M.; Querol, X.; Pey, J.; Alastuey, A.; Pérez, N.; Ferreira, F.; Alonso, S.; Rodríguez, S.; Cuevas, E. A methodology for the quantification of the net African dust load in air quality monitoring networks. Atmos. Environ. 2007, 41, 5516–5524. [Google Scholar] [CrossRef]
  7. Ganor, E.; Stupp, A.; Alpert, P. A method to determine the effect of mineral dust aerosols on air quality. Atmos. Environ. 2009, 43, 5463–5468. [Google Scholar] [CrossRef]
  8. Viana, M.; Salvador, P.; Artíñano, B.; Querol, X.; Alastuey, A.; Pey, J.; Latz, A.J.; Cabañas, M.; Moreno, T.; García Dos Santos, S.; et al. Assessing the performance of methods to detect and quantify african dust in airborne particulates. Environ. Sci. Technol. 2010, 44, 8814–8820. [Google Scholar] [CrossRef]
  9. Gómez-Losada, A.; Pires, J.C.M.; Pino-Mejías, R. Time series clustering for estimating particulate matter contributions and its use in quantifying impacts from deserts. Atmos. Environ. 2015, 117, 271–281. [Google Scholar] [CrossRef] [Green Version]
  10. Barnaba, F.; Bolignano, A.; Di Liberto, L.; Morelli, M.; Lucarelli, F.; Nava, S.; Perrino, C.; Canepari, S.; Basart, S.; Costabile, F.; et al. Desert dust contribution to PM10 loads in Italy: Methods and recommendations addressing the relevant European Commission Guidelines in support to the Air Quality Directive 2008/50. Atmos. Environ. 2017, 161, 288–305. [Google Scholar] [CrossRef]
  11. Basart, S.; Pérez, C.; Nickovic, S.; Cuevas, E.; Baldasano, J.M. Development and evaluation of the BSC- DREAM8b dust regional model over Northern Africa, the Mediterranean and the Middle East. Tellus B 2012, 64. [Google Scholar] [CrossRef] [Green Version]
  12. Kallos, G.; Nickovic, S.; Papadopoulos, A.; Jovic, D.; Kakaliagou, O.; Misirlis, N.; Boukas, L.; Mimikou, N.; Sakellaridis, G.; Papageorgiou, J.; et al. The regional weatherforecasting system SKIRON: An overview. In Proceedings of the International Symposium on Regional Weather Prediction on Parallel Computer Environments, Athens, Greece, 15–17 October 1997; pp. 109–122. [Google Scholar]
  13. Schmechtig, C.; Marticorena, B.; Chatenet, B.; Bergametti, G.; Rajot, J.L.; Coman, A. Simulation of the mineral dust content over Western Africa from the event to the annual scale with the CHIMERE-DUST model. Atmos. Chem. Phys. 2011, 11, 7185–7207. [Google Scholar] [CrossRef] [Green Version]
  14. Pérez, C.; Haustein, K.; Janjic, Z.; Jorba, O.; Huneeus, N.; Baldasano, J.M.; Black, T.; Basart, S.; Nickovic, S.; Miller, R.L.; et al. An online mineral dust aerosol model for meso to global scales: Model description, annual simulations and evaluation. Atmos. Chem. Phys. 2011, 11, 13001–13027. [Google Scholar] [CrossRef] [Green Version]
  15. Skamarock, W.C.; Klemp, J.B.; Dudhia, J.; Gill, D.O.; Barker, M.; Duda, K.G.; Huang, X.Y.; Wang, W.; Powers, J.G. A Description of the Advanced Research WRF Version 3; Technical Report; National Center for Atmospheric Research: Boulder, CO, USA, 2008. [Google Scholar]
  16. Menut, L.; Bessagnet, B.; Khvorostyanov, D.; Beekmann, M.; Blond, N.; Colette, A.; Coll, I.; Curci, G.; Foret, G.; Hodzic, A.; et al. CHIMERE 2013: A model for regional atmospheric composition modelling. Geosci. Model. Dev. 2013, 6, 981–1028. [Google Scholar] [CrossRef] [Green Version]
  17. Monteiro, A.; Miranda, A.I.; Borrego, C.; Vautard, R. Air quality assessment for Portugal. Sci. Total Environ. 2007, 373, 22–31. [Google Scholar] [CrossRef] [PubMed] [Green Version]
  18. Matthias, V. The aerosol distribution in Europe derived with the Community Multiscale Air Quality (CMAQ) model: Comparison to near surface in situ and sunphotometer measurements. Atmos. Chem. Phys. 2008, 8, 5077–5097. [Google Scholar] [CrossRef] [Green Version]
  19. Pay, M.T.; Piot, M.; Jorba, O.; Gassó, S.; Gonçalves, M.; Basart, S.; Dabdub, D.; Jiménez-Guerrero, P.; Baldasano, J.M. A full year evaluation of the CALIOPE-EU air quality modeling system over Europe for 2004. Atmos. Environ. 2010, 44, 3322–3342. [Google Scholar] [CrossRef]
  20. Basart, S.; Pay, M.T.; Jorba, O.; Pérez, C.; Jiménez-Guerrero, P.; Schulz, M.; Baldasano, J.M. Aerosols in the CALIOPE air quality modelling system: Evaluation and analysis of PM levels, optical depths and chemical composition over Europe. Atmos. Chem. Phys. 2012, 12, 3363–3392. [Google Scholar] [CrossRef] [Green Version]
  21. Mailler, S.; Menut, L.; Khvorostyanov, D.; Valari, M.; Couvidat, F.; Siour, G.; Turquety, S.; Briant, R.; Tuccella, P.; Bessagnet, B.; et al. Chimere-2017: From urban to hemispheric chemistry-transport modeling. Geosci. Model. Dev. 2017, 10, 2397–2423. [Google Scholar] [CrossRef] [Green Version]
  22. Szopa, S.; Foret, G.; Menut, L.; Cozic, A. Impact of large scale circulation on european summer surface ozone and consequences for modelling forecast. Atmos. Environ. 2009, 43, 1189–1195. [Google Scholar] [CrossRef]
  23. Ginoux, P.; Chin, M.; Tegen, I.; Prospero, J.; Holben, B.; Dubovik, O.; Lin, S. Sources and distributions of dust aerosols simulated with the GOCART model. J. Geophys. Res. Atmos. 2001, 106, 20255–20273. [Google Scholar] [CrossRef]
  24. EMEP/CEIP 2019. Emissions as Used in EMEP Models. Available online: https://www.ceip.at/ms/ceip_home1/ceip_home/webdab_emepdatabase/emissions_emepmodels/ (accessed on 15 November 2019).
  25. Guenther, A.; Karl, T.; Harley, P.; Wiedinmyer, C.; Palmer, P.I.; Geron, C. Estimates of global terrestrial isoprene emissions using MEGAN (Model of Emissions of Gases and Aerosols from Nature). Atmos. Chem. Phys. 2006, 6, 3181–3210. [Google Scholar] [CrossRef] [Green Version]
  26. Monahan, E.C.; Spiel, D.E.; Davidson, K.L. A Model of Marine Aerosol Generation Via Whitecaps and Wave Disruption. In Oceanic Whitecaps; Monahan, E.C., Niocaill, G.M., Eds.; Springer: Dordrecht, The Netherlands, 1986. [Google Scholar]
  27. Marticorena, B.; Bergametti, G. Modeling the atmospheric dust cycle. 1. Design of a soil-derived dust emission scheme. J. Geophys. Res. Atmos. 1995, 100, 16415–16430. [Google Scholar] [CrossRef] [Green Version]
  28. Alfaro, S.C.; Gomes, L. Modeling mineral aerosol production by wind erosion: Emission intensities and aerosol size distributions in source areas. J. Geophys. Res. Atmos. 2001, 106, 18075–18084. [Google Scholar] [CrossRef]
  29. Taylor, K. Summarizing multiple aspects of model performance in a single diagram. J. Geophys. Res. Atmos. 2001, 106, 7183–7192. [Google Scholar] [CrossRef]
  30. Russo, M.A.; Gama, C.; Monteiro, A. How does upgrading an emissions inventory affect air quality simulations? Air Qual. Atmos. Health 2019, 12, 731–741. [Google Scholar] [CrossRef]
  31. Agência Portuguesa do Ambiente. Identificação e Avaliação da Ocorrência de Eventos de Âmbito Natural em Portugal em 2016, Relatório Anual; Portuguese Environment Agency: Lisboa, Portugal, 2017; Available online: https://apambiente.pt/_zdata/DAR/Ar/Relatorio_Eventos%20Naturais_2016_v20170914.pdf (accessed on 15 November 2019).
  32. Draxler, R.; Hess, G. An overview of the HYSPLIT_4 modelling system for trajectories, dispersion and deposition. Aust. Meteorol. Mag. 1998, 47, 295–308. [Google Scholar]
  33. Rodríguez, S.; Querol, X.; Alastuey, A.; Kallos, G.; Kakaliagou, O. Saharan dust contribution to PM10 and TSP levels in Southern and Eastern Spain. Atmos. Environ. 2001, 35, 2433–2447. [Google Scholar] [CrossRef]
  34. Gama, C.; Ribeiro, I.; Lange, A.C.; Vogel, A.; Ascenso, A.; Seixas, V.; Elbern, H.; Borrego, C.; Friese, E.; Monteiro, A. Performance assessment of CHIMERE and EURAD-IM’ dust modules. Atmos. Pol. Res. 2019, 10, 1336–1346. [Google Scholar] [CrossRef]
  35. Monteiro, A.; Fernandes, A.P.; Gama, C.; Borrego, C.; Tchepel, O. Assessing the mineral dust from North Africa over Portugal region using BSC-DREAM8b model. Atmos. Pol. Res. 2015, 6, 70–81. [Google Scholar] [CrossRef] [Green Version]
  36. Escudero, M.; Castillo, S.; Querol, X.; Avila, A.; Alarcón, M.; Viana, M.M.; Alastuey, A.; Cuevas, E.; Rodríguez, S. Wet and dry African dust episodes over eastern Spain. J. Geophys. Res. 2005, 110, D18S08. [Google Scholar] [CrossRef] [Green Version]
  37. Rodríguez, S.; Alastuey, A.; Alonso-Pérez, S.; Querol, X.; Cuevas, E.; Abreu-Afonso, J.; Viana, M.; Pérez, N.; Pandolfi, M.; de la Rosa, J. Transport of desert dust mixed with North African industrial pollutants in the subtropical Saharan Air Layer. Atmos. Chem. Phys. 2011, 13, 6663–6685. [Google Scholar] [CrossRef] [Green Version]
  38. Osborne, M.; Malavelle, F.F.; Adam, M.; Buxmann, J.; Sugier, J.; Marenco, F.; Haywood, J. Saharan dust and biomass burning aerosols during ex-hurricane Ophelia: Observations from the new UK lidar and sun-photometer network. Atmos. Chem. Phys. 2019, 19, 3557–3578. [Google Scholar] [CrossRef] [Green Version]
Figure 1. WRF-CHIMERE domains.
Atmosphere 11 00134 g001
Figure 2. Maps of (a) PM10 and (b) PM2.5 annual mean concentrations during 2016, as modelled by WRF-CHIMERE. Observed mean concentrations are included within circles.
Atmosphere 11 00134 g002
Figure 3. Taylor diagrams relative to the WRF-CHIMERE performance simulating ground-level (a) PM10 and (b) PM2.5 concentrations. Concentric dashed lines emanating from the ‘observed’ point show the value of the RMS error. Variability in the observations and model results is represented by the standard deviation, which is measured as the radial distance from the origin of the plot. The correlation coefficient is shown on the arc and points that lie closest to the x-axis have the highest correlation.
Atmosphere 11 00134 g003
Figure 4. PM10 daily concentrations (black line) and natural contribution as estimated by the official method adopted by the Portuguese Environment Agency (green bars).
Atmosphere 11 00134 g004
Figure 5. PM2.5 daily concentrations (black line) and natural contribution as estimated by the official method adopted by the Portuguese Environment Agency (green bars).
Atmosphere 11 00134 g005
Figure 6. Spatial distribution of monthly mean concentrations of mineral dust particles with an aerodynamic diameter smaller than 10 µm, modelled by WRF-CHIMERE, for the year 2016.
Atmosphere 11 00134 g006
Figure 7. Spatial distribution of monthly mean concentrations of mineral dust particles with an aerodynamic diameter smaller than 2.5 µm, modelled by WRF-CHIMERE, for the year 2016.
Atmosphere 11 00134 g007
Figure 8. PM10 daily concentrations (black line) and contribution from desert dust as estimated by WRF-CHIMERE (brown line).
Atmosphere 11 00134 g008
Figure 9. PM2.5 daily concentrations (black line) and contribution from desert dust as estimated by WRF-CHIMERE (brown line).
Atmosphere 11 00134 g009
Figure 10. Comparison between the African dust contributions to PM10 obtained by the two different methodologies during 2016. Red points correspond to the period 8–15 August. Pearson correlation values are presented, and were calculated excluding the red points.
Atmosphere 11 00134 g010
Figure 11. Comparison between the African dust contributions to PM2.5 obtained by the two different methodologies during 2016. Red points correspond to the period 8–15 August. Pearson correlation values are presented, and were calculated excluding the red points.
Atmosphere 11 00134 g011
Figure 12. Satellite images captured from 6 to 13 August 2016 by Terra/MODIS and SNPP/VIIRS, showing actively burning areas (outlined in red) and associated smoke plumes.
Atmosphere 11 00134 g012aAtmosphere 11 00134 g012b
Table 1. List of rural background air quality monitoring stations selected as representative by the Portuguese Environment Agency (ordered by latitude). PM10 and PM2.5 data completeness are included for the year 2016.
CodeNameLONLATHeight (m)PM10 DataPM2.5 Data
DRNDouro Norte−7.78941.370108619.1%20.8%
FUNFundão−7.30040.23247392.1%69.7%
MOVMontemor-o-Velho−8.67740.1839679.2%-
CHAChamusca−8.46839.35314398.1%96.7%
TERTerena−7.39838.61618798.4%87.7%
CERCerro−7.68037.31230085.5%88.5%
Table 2. The number of days when the African dust contribution of particles with an aerodynamic diameter smaller than 10 µm (AD10) is higher than 2 µg·m−3 and their mean African dust concentrations (calculated according to the P40 method). The day of the year 2016 with the maximum African dust contribution is also identified, as well as the contribution itself.
Monitoring StationNo. Days AD10 ≥ 2 µg·m−3Daily Mean Contribution (µg·m−3)Max Daily Contribution (µg·m−3)Day of Occurrence
FUN7115.681.813 August
MOV4815.577.013 August
CHA7016.376.122 February
TER7918.9160.922 February
CER6812.254.021 February
Table 3. The number of days when the African dust contribution of particles with an aerodynamic diameter smaller than 2.5 µm (AD2.5) is higher than 1 µg·m−3 and their mean African dust concentrations (calculated according to the P40 method). The day of the year 2016 with the maximum African dust contribution is also identified, as well as the contribution itself.
Monitoring StationNo. Days AD2.5 ≥ 1 µg·m−3Daily Mean Contribution (µg·m−3)Max Daily Contribution (µg·m−3)Day of Occurrence
FUN4810.756.213 August
CHA728.844.413 August
TER768.521.723 June
CER638.399.722 February
Table 4. PM10 and PM2.5 annual mean concentrations, and a number of days of exceedance to the PM10 daily limit value, before and after the subtraction of the African dust contributions (calculated according to the P40 method).
Monitoring StationPM10 Annual Mean (µg·m−3)Exceedances PM10PM2.5 Annual Mean (µg·m−3)
Bulk PM10PM10-DustBulk PM10PM10-DustBulk PM10PM10-Dust
FUN13.510.2506.64.6
MOV17.314.752
CHA14.511.3707.25.4
TER20.716.511012.710.7
CER14.311.7107.05.4
Table 5. The number of days when the African dust contribution AD10 is higher than certain thresholds (2 and 4 µg·m−3) and their mean African dust concentrations (calculated according to the model-based methodology). The day of the year 2016 with the maximum African dust contribution is also identified, as well as the contribution itself.
Monitoring StationNo. Days AD10 ≥ 2 µg·m−3 (Mean Conc)No. Days AD10 ≥ 4 µg·m−3 (Mean Conc)Max Daily Contribution (µg·m−3)Day of Occurrence
FUN155 (5.0 µg·m−3)39 (11.9 µg·m−3)40.522 February
MOV115 (5.0 µg·m−3)41 (9.3 µg·m−3)31.428 October
CHA139 (4.9 µg·m−3)39 (10.5 µg·m−3)49.922 February
TER141 (5.4 µg·m−3)47 (10.7 µg·m−3)55.822 February
CER188 (6.2 µg·m−3)74 (11.5 µg·m−3)81.322 February
Table 6. The number of days when the African dust contribution AD2.5 is higher than certain thresholds (1 and 2 µg·m−3) and their mean African dust concentrations (calculated according to the model-based methodology). The day of the year 2016 with the maximum African dust contribution is also identified, as well as the contribution itself.
Monitoring StationNo. Days AD2.5 ≥ 1 µg·m−3 (Mean Conc)No. Days AD2.5 ≥ 2 µg·m−3 (Mean Conc)Max Daily Contribution (µg·m−3)Day of Occurrence
FUN213 (2.1 µg·m−3)53 (4.3 µg·m−3)15.827 October
CHA191 (2.0 µg·m−3)52 (3.9 µg·m−3)14.227 October
TER209 (2.2 µg·m−3)57 (4.3 µg·m−3)16.622 February
CER242 (2.3 µg·m−3)74 (4.3 µg·m−3)18.422 February
Table 7. PM10 and PM2.5 annual mean concentrations, and a number of days of exceedance to the PM10 daily limit value, before and after the subtraction of the African dust contributions (calculated according to the model-based methodology).
Monitoring StationPM10 Annual Mean (µg·m−3)Exceedances PM10PM2.5 Annual Mean (µg·m−3)
Bulk PM10PM10-DustBulk PM10PM10-DustBulk PM10PM10-Dust
FUN13.510.8546.65.3
MOV17.315.155
CHA14.511.9747.25.9
TER20.717.811212.711.2
CER14.311.2107.05.5

