Stable Isotopes Reveal Climate Signal Hidden in Tree Rings of Endemic Balkan Pines


Department of Yield and Silviculture, Slovenian Forestry Institute, Večna pot 2, SI-1000 Ljubljana, Slovenia
*
Author to whom correspondence should be addressed.
Atmosphere 2020, 11(2), 135; https://0-doi-org.brum.beds.ac.uk/10.3390/atmos11020135
Submission received: 31 December 2019
/
Revised: 22 January 2020
/
Accepted: 23 January 2020
/
Published: 24 January 2020
(This article belongs to the Special Issue Forest Adaptation to Climate Change: From Individual Trees to Whole Stand)
Abstract
:Studies report the good potential of Pinus heldreichii (PIHE) and Pinus peuce (PIPE) for developing long chronologies from living trees and warn that the climate signal is weak in tree-ring widths of PIHE, and particularly PIPE. The goals of the study were to develop long chronologies, and to analyze the climate–growth relationship and potential for long climate reconstructions using tree-ring widths (TRW) and stable carbon isotopes ratios (δ13C) in tree rings at the northern edge of species distribution in the eastern part of Montenegro. The PIHE TRW chronology covers the period 1571–2013 (443 years) and the PIPE TRW chronology 1521–2013 (493 years). The temperature signal in PIHE TRW is weak and the precipitation signal is non-existent. PIPE has no climate signal in TRW. Both studied species have very similar δ13C chronologies, which allows us to merge isotope chronologies into a single composite δ13C Pinus chronology. The composite chronology has a strong signal related to average monthly temperature in June, July, and August and monthly values for cloudiness in July and August, with r > 0.6 and r < −0.6 for individual months, respectively. The climate signal was enhanced when June, July, and August values were merged into seasonal variables. The temporal stability of temperature, precipitation and cloudiness signals is consistent. The spatial extent of the δ13C chronology extends over a very large region, including all surrounding countries.
1. Introduction
In the Mediterranean region of limited water resources, reliable climate predictions on seasonal to decadal timescales are essential in developing effective strategies for mitigating the environmental and socioeconomic impacts of climate change. The increase in temperature and decrease in precipitation, as forecast by climate change scenarios for the Eastern Mediterranean region, pose one of the main challenges for the sustainable management of natural resources in countries of the Adriatic and Aegean regions [1,2].
The Balkan Peninsula is known for its relict tree species, due to late glacial refugia and some more or less untouched forest sites [3,4,5]. Two Balkan tree species, Pinus heldreichii H. Christ. (synonym: Pinus leucodermis Ant.; Bosnian pine) and Pinus peuce Grisb. (Macedonian pine), are particularly interesting in terms of dendroclimatology because they can get very old and grow on extreme sites. Pinus heldreichii and Pinus peuce are long-lived, relict Balkan species growing close to the alpine timberline, where climatic conditions are harsh and limiting for tree growth. Trees growing at a high elevation are valuable for dendroclimatological research and this has been clearly demonstrated in a large number of reconstructions available for the upper timber line. Opala-Owczarek [6] studied Juniperus tree rings in Pamir and found May–September minimum temperatures to be highly correlated with juniper growth. Corona et al. [7] studied the climate–growth relationship in Larix decidua and Pinus cembra at the upper timber line in the Alps and were able to reconstruct the climate for the past 1000 years. Cerrato et al. [8] made a May–September mean temperature reconstruction for the Rhaetian Alps based on the maximum density of Pinus cembra tree-rings. Maximum latewood densities correlate better with climate than tree-ring widths [8]. Saulnier et al. [9] studied the climate–growth response in Larix decidua in the French Alps and found that, for high-elevation sites, current summer temperatures significantly correlate with tree growth. All of the above, and many other climate reconstructions at the upper timber line, demonstrate climate sensitivity and a close connection between the climate at the upper timber line and growth of trees.
There have been a limited number of studies focused on the tree-ring characteristics of P. heldreichii and P. peuce. Most of these studies have focused on the Pirin mountains in southwestern Bulgaria. Panayotov et al. [10] analyzed the climate signal in tree-ring chronologies of Pinus peuce and Pinus heldreichii in the same region and concluded that a climate signal exists but is weak. Trouet et al. [11] presented a summer temperature reconstruction (1768–2008) based on maximum latewood density measurements of P. heldreichii from the Pirin mountains. Panayotov et al. [12] studied the variation of anatomical leaf parameters of P. heldreichii. A more recent study by Scheithauer et al. on P. heldreichii from the northern Pirin mountains suggests that width growth is humidity limited and more sensitive to high summer temperatures on the southern flanks [13,14]. Other published studies include an analysis of the climate–growth relationship using tree-ring widths of P. heldreichii in Kosovo [15,16] and Albania [17,18], in which a relatively weak but stable climate signal was reported. A similarly strong climate signal was found on Mt. Smolikas in Greece [19] and in the Pindus mountains, Greece, where they also found the oldest living Pinus heldreichii to date [20].
Stable carbon isotope (δ13C) chronologies for endemic P. heldreichii and P. peuce, to the best of our knowledge, do not exist at all. However, there are δ13C chronologies for other tree species in the wider region, although the number of δ13C chronologies is smaller than in Western Europe, Fennoscandia, or parts of the Mediterranean region. Nagavciuc et al. [21] developed a stable carbon and oxygen isotope chronology for Pinus cembra for the eastern Carpathian timberline and found that δ13C was negatively correlated with summer precipitation and three-month SPEI (Standardized Precipitation-Evapotranspiration Index) index. Szymczak et al. [22,23] developed a 560-year summer temperature reconstruction for Corsica (France) based on a stable carbon isotope from Pinus nigra tree-rings. They found a statistically significant, positive correlation for temperature in August and September. Hafner et al. [24] developed a 520-year long stable carbon isotope chronology for Larix decidua for the south-eastern European Alps and found significant positive correlations with July–August temperature. Kern et al. [25] analyzed δ13C in tree rings of Quercus robur in Hungary and found a strong negative correlation between δ13C in tree-rings and June precipitation.
In our study, we focused on extracting and assessing the climate signal of tree-ring widths (TRW) and stable carbon isotope ratios (δ13C) in cellulose extracted from P. peuce and P. heldreichii tree rings, growing at the upper timber line in Montenegro, at the northern edge of the species distribution range. Previously developed TRW chronologies of P. peuce and P. heldreichii typically possess a weak climate signal in TRW [19]. In our study, in addition to the TRW chronology, we developed a δ13C chronology to test it as a potential proxy for the reconstruction of climate in the Balkan Peninsula.
2. Material and Methods
2.1. Sampling Locations
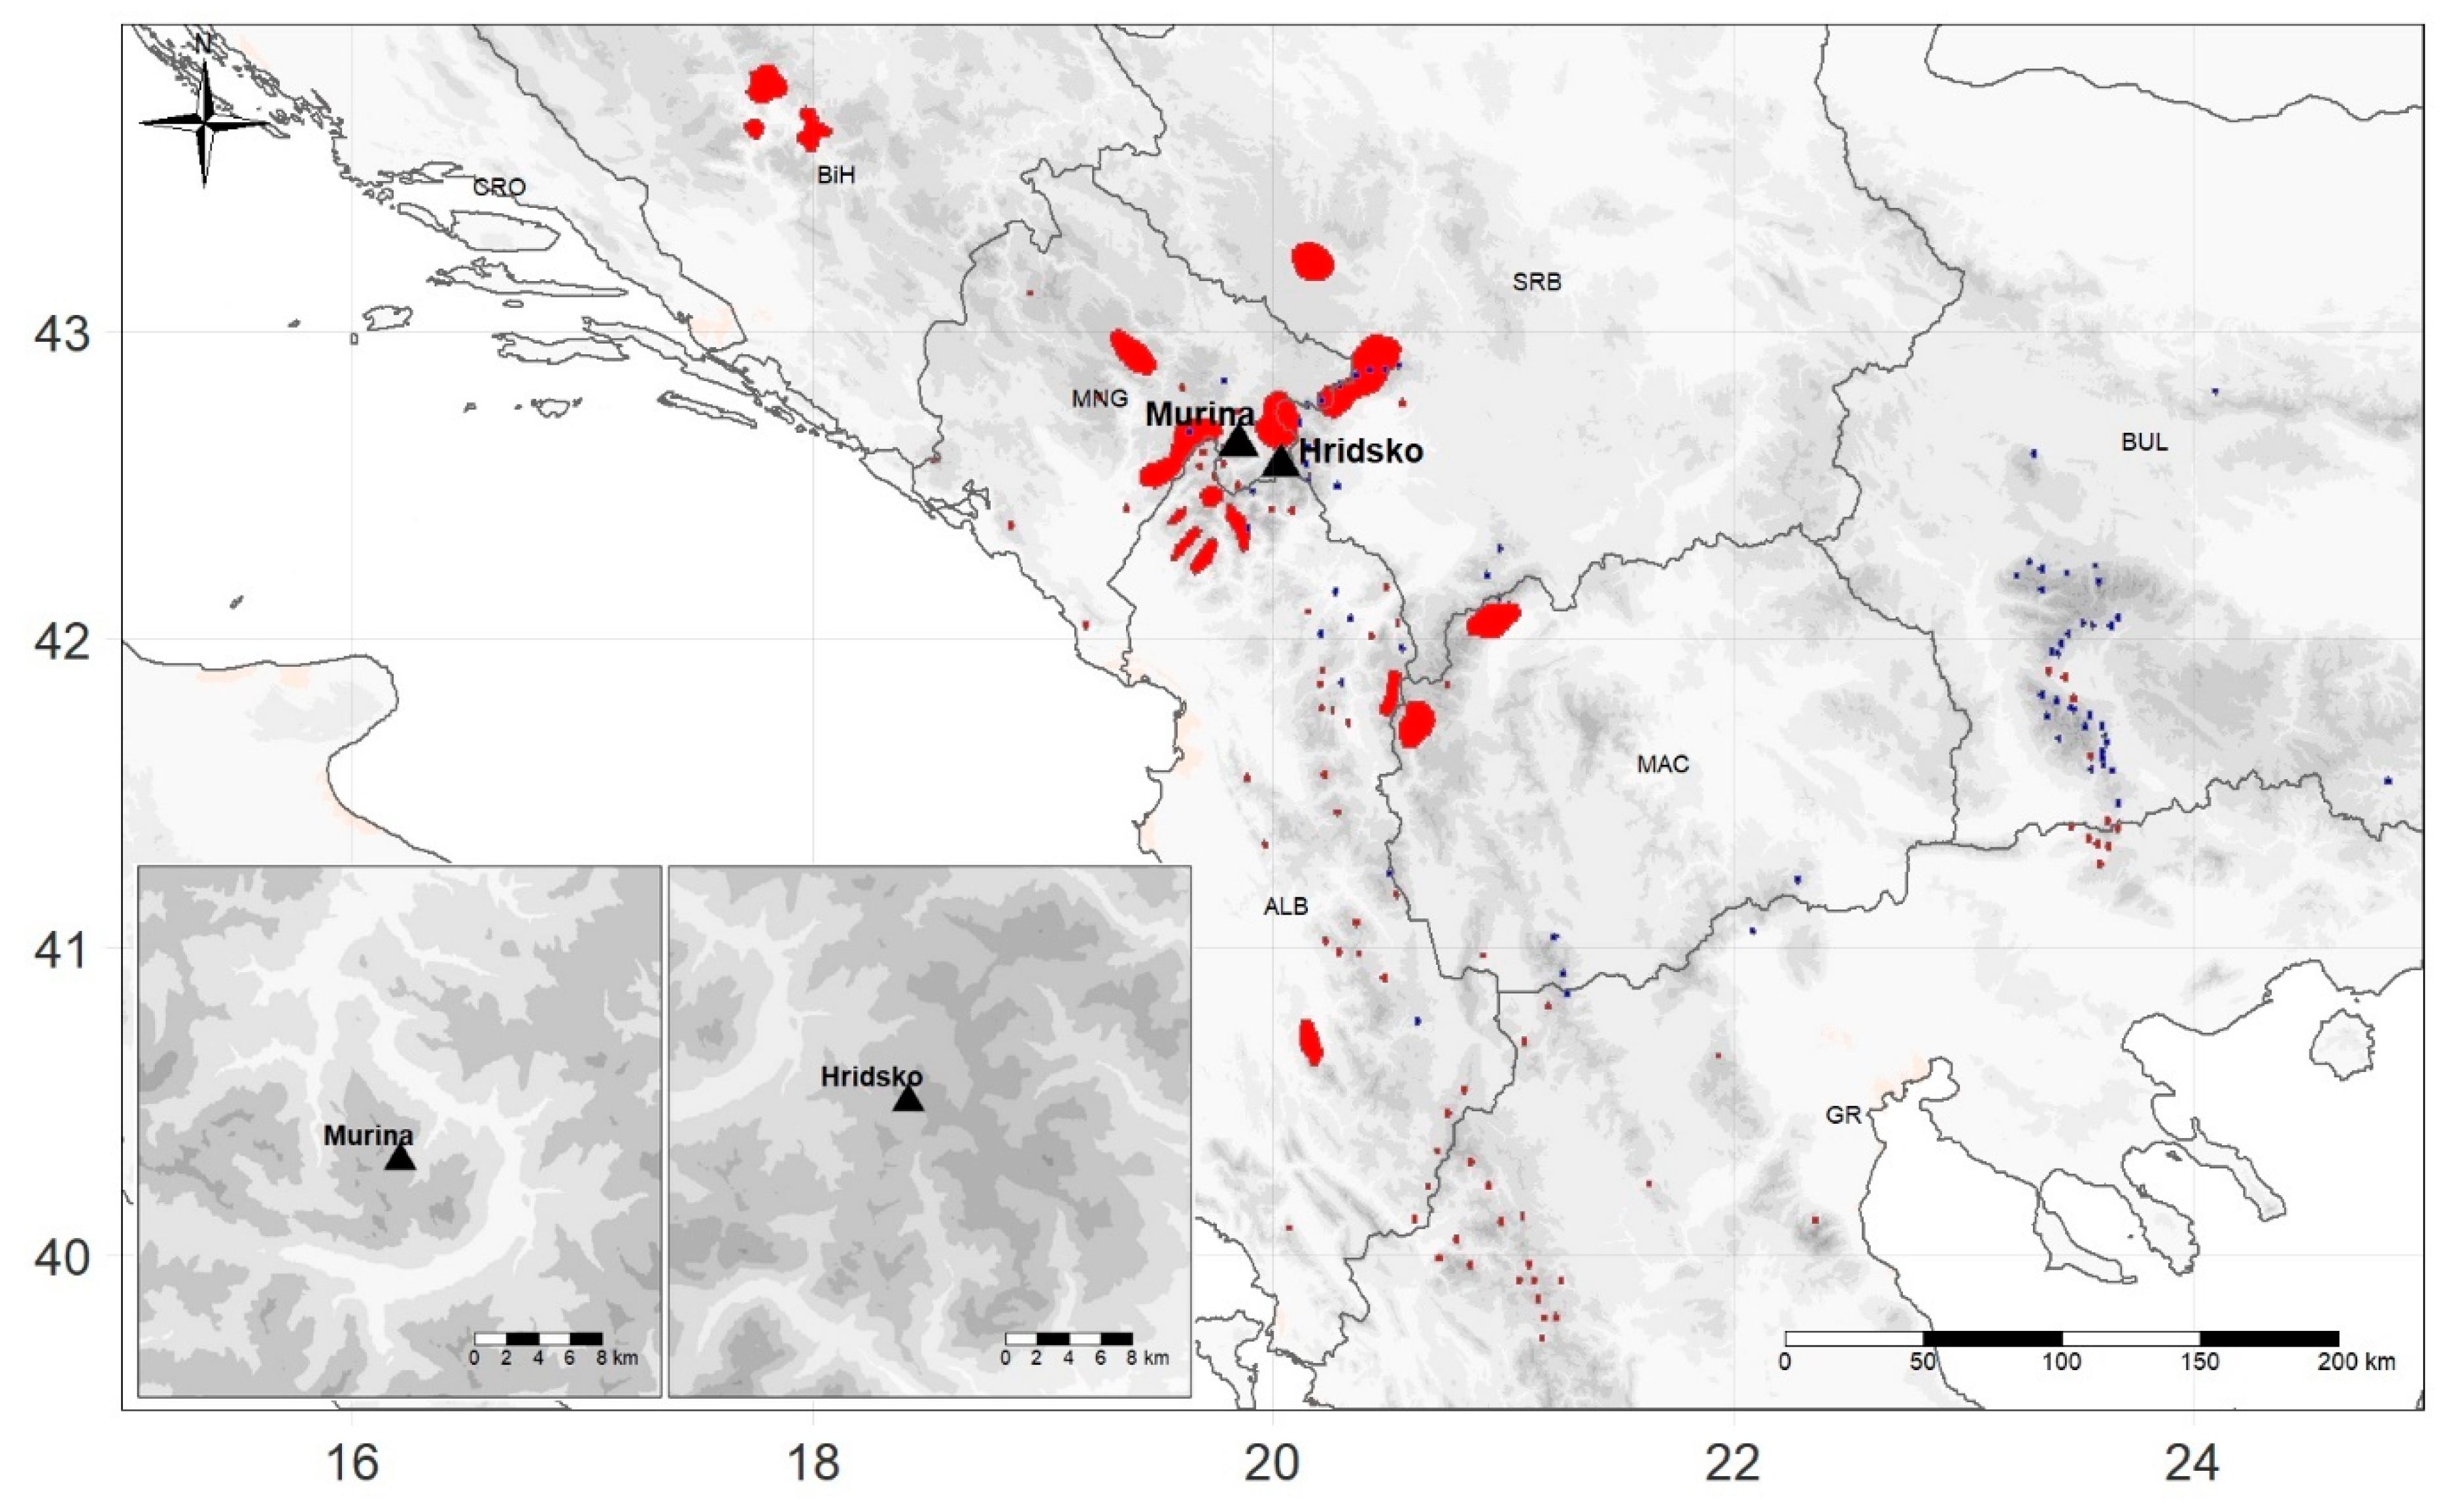
In June 2014, we sampled Pinus heldreichii H. Christ. (synonym: Pinus leucodermis Ant.; Bosnian pine), P. heldreichii, and Pinus peuce Grisb. (Macedonian pine). P. peuce was sampled at the upper timber line in Montenegro. Sampling was done at two locations, namely north (P. heldreichii) and south (P. peuce) of the city of Plav, not far from the Albanian border.
P. heldreichii is a 2-needle endemic of the Balkan and Apennine Peninsulas that prefers alkaline soils on limestone on steep and dry rocky slopes at elevations close to the upper timberline, between 1000 and 2500 m. Nowadays, it is naturally present in Bosnia and Herzegovina, Montenegro, Macedonia, Albania, Kosovo, Greece, Bulgaria and southern Italy. At lower elevations, it coexists with silver fir (Abies alba) and European beech (Fagus sylvatica) [26]. P. peuce is a rare 5-needle pine. A cold mountain climate and high air humidity are the most suitable conditions for Pinus peuce. Though it occurs naturally from 800–900 m up to 2300–2400 m, its optimum is most often from 1600–1900 m. Pinus peuce often occurs on acidic soils on silicate terrains and, less often, on carbonate ones [27]. Nowadays, it grows in Montenegro, Macedonia, Albania, Kosovo, Greece, and Bulgaria [28]. P. heldreichii and P. peuce have a relatively small distribution range in the Balkan Peninsula. While P. heldreichii grows also in central Bosnia and Herzegovina and sites in Montenegro are not at the edge of the distribution range, the northern edge of the P. peuce distribution range only starts with the ultrabasic rock formations in the mountains south of Plav towards the border with Albania.
P. heldreichii trees were sampled on Želina mountain near the village of Murina, at an elevation of approximately 1700 m above sea level (site name Murina), while P. peuce trees were sampled in the vicinity of Hridsko lake approximately 1900 m above sea level (site name Hridsko). Despite the different sampling elevations, both sites are located at the upper timber line, as shown in Figure 1 and Table 1.
2.2. Meteorological Data
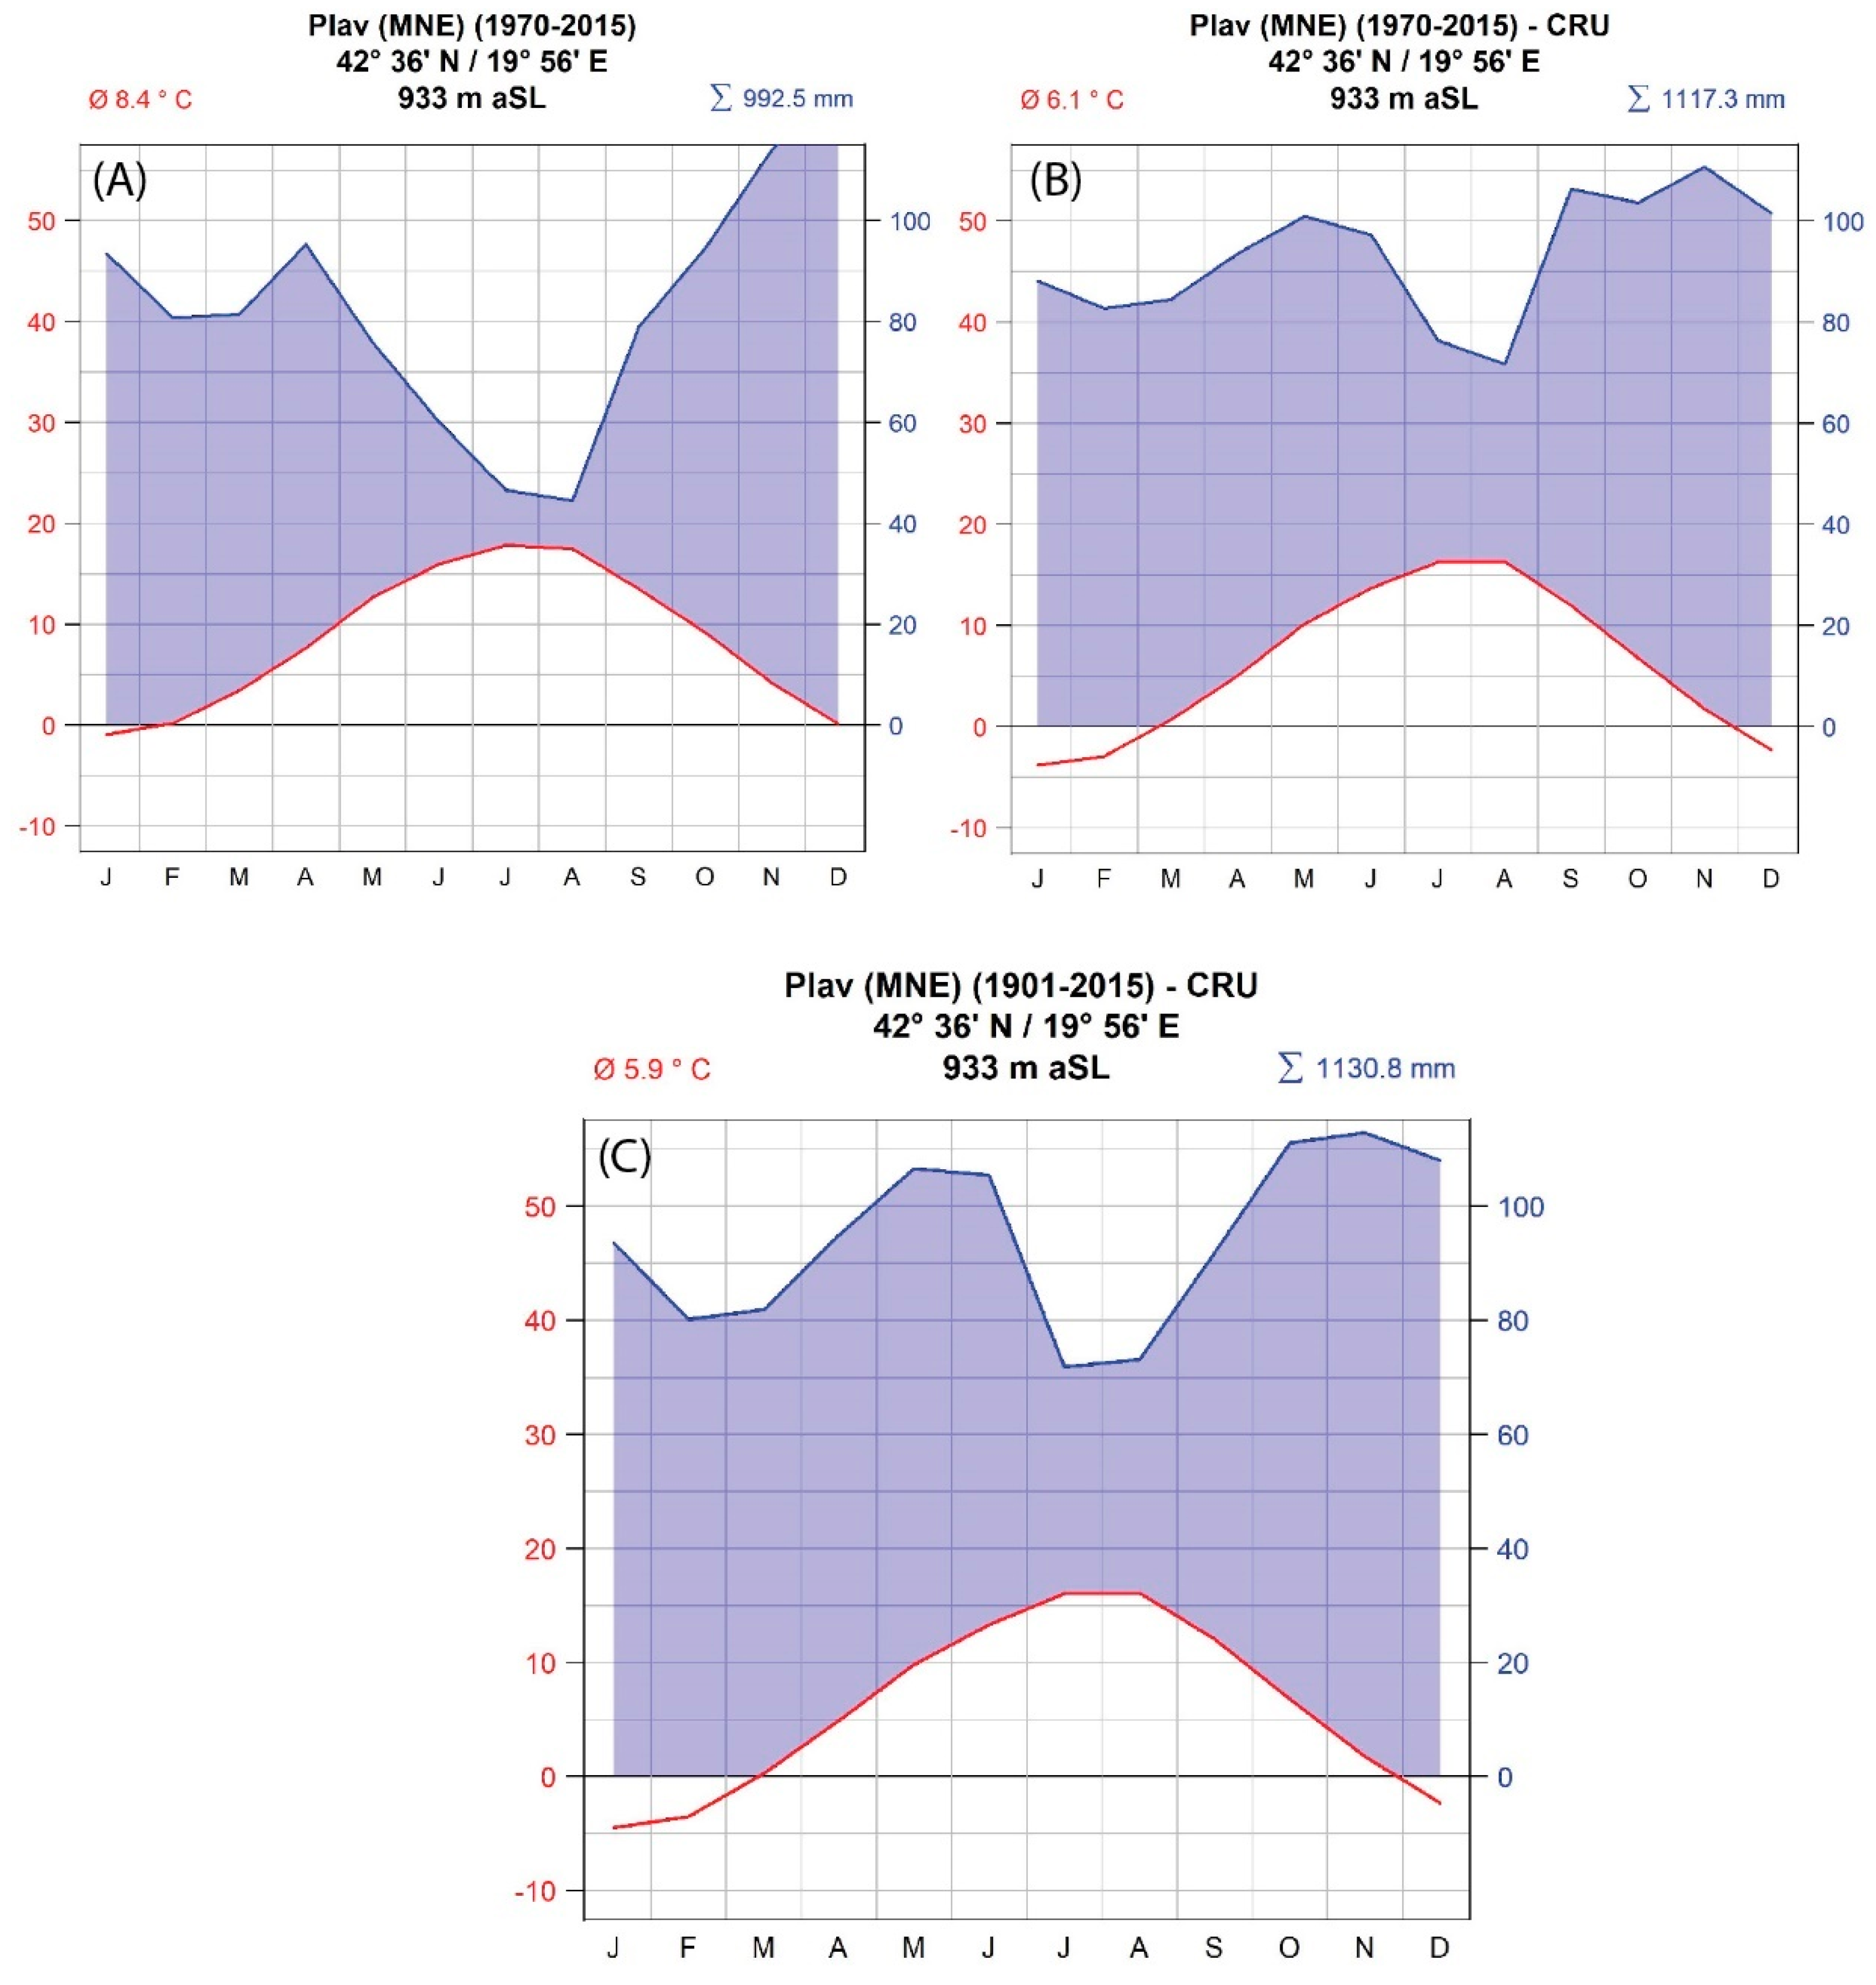
This area of the Balkan Peninsula lacks long-term meteorological data. This applies in particular to the remote and high-elevation sites where the trees were sampled. As a local source of climate data, we used data from the nearby weather station of the city of Plav, Montenegro (N 42.59°, E 19.94°). This weather station has a relatively short data record, from 1970–2016, with several missing values. As such, it cannot be used in dendroclimatological studies, but it can be compared with gridded climate data to see whether the gridded dataset is a good approximation of the local climate measured at the weather station. Gridded meteorological data were therefore obtained from the CRU TS 3.24 database (period 1901–2015, spatial resolution 0.5 × 0.5°) [29] and first compared with the station data (Figure 2). Comparison of the two data sets showed that the station data showed a warmer and drier climate compared to the CRU TS 3.24 dataset. Summer precipitation minima are larger in the station data set than in the gridded one. Despite some minor differences for the overlapping period, gridded data were used for the major analysis presented in the results section, while station climate data were only used to calculate the relationship between cloudiness and δ13C.
The climate of the studied region is characterized as cold, without a dry season and with warm summers (Dfb after Köppen-Geiger climate classification). Precipitation minima are in the summer months (June–August). However, there is no lack of soil moisture in the summer. The peak of precipitation in the studied region is in late autumn and the early winter months. Another peak is observed in the mid spring period. The temperature in the studied region is relatively low, with a winter monthly average minimum of about −3.8°C in January and summer monthly average maximum of 16.4°C in August (Figure 2).
2.3. Sample Collection and Tree-Ring Width Analysis
For TRW analysis, we sampled 11 trees and collected 21 cores (the number of P. heldreichii trees available for coring was low due to a forest fire in the year before coring) on the Murina site and 16 trees and 27 cores collected on the Hridsko site. For tree-ring width (TRW) analysis, we took two 5 mm cores from each tree. If the tree was difficult to access and coring on both sides not possible, we took one core per tree. Additionally, we took six 12-mm cores at the Murina site and nine at the Hridsko site for stable isotope analysis (δ13C). All sampled trees were healthy, co-dominant trees with no visible signs of old trunk damage or any kind of declining tree vitality. Cores were stored in plastic holders and transported to the laboratory.
Once in the laboratory, the TRW and δ13C cores were dried. The TRW cores were then glued onto wooden holders and sanded with progressively finer sanding paper on an industrial belt sander to achieve a highly polished surface. Cores for stable isotope analysis were not sanded, to avoid cross-ring contamination, but only thinned with a circular saw to achieve a thickness suitable for manual single ring extraction. We scanned both types of tree core using the ATRICS system [30], while TRW were measured using CooRecorder and CDendro programs (Cybis, Sweden); absolute dating was done in the PAST-5 program (SCIEM).
Individual TRW series were standardized to remove long-term trends [31] using a 67% cubic smoothing spline with a 50% frequency cut-off in the dplR library [32,33] of the R program. Departures of the measured values from the regression curve were calculated as the quotient between the measured ring and fitted value, resulting in a dimensionless index with a mean of 1. The purpose of this step is to remove factors that are not connected with climate, such as tree age and the effects of stand dynamics [31]. Index values were pre-whitened using an autoregressive model selected on the basis of the minimum Akaike criterion and combined across all series using a biweight robust estimation of the mean to exclude the influence of the outliers. The dplR produces two chronologies, namely standardized (STD) and residual (RES). In this research, we used the STD chronology, which is a robust estimate of the arithmetic mean and contains autocorrelation [31].
2.4. Stable Carbon Isotope Analysis
Scanned, measured, and dated 12-mm cores were used for the analysis of the stable carbon isotope ratio in the tree rings. The stable carbon isotopes (δ13C) were analyzed for each tree individually and at an annual resolution. The whole ring was used in stable isotope analysis. α-cellulose was isolated from the cut samples following the procedure proposed by Loader et al. [34]. Briefly, wood slivers are placed into extraction tubes and lignin and hemicellulose are removed in a series of chemical baths until pure α-cellulose is retrieved. Typically, this procedure lasts for 48 h. Vials with cellulose are then filled with deionized water, homogenized using a Hielscher ultrasound probe, put in a freezer at −80 °C for 24 h, and then into a freeze drier for 48 h. Samples of extracted α-cellulose were weighed (0.30–0.35 mg) into tin capsules and combusted. Combustion was conducted at 950 °C using a Vario PYRO Cube elemental analyzer (Elementar, Germany) interfaced to an IsoPrime100 stable isotope ratio mass spectrometer (Isoprime, UK). We analyzed 113 rings for each tree. In total, over 1250 wood samples were converted to α-cellulose and further analyzed.
We applied two corrections to the δ13C series. Since cca. AD 1850, δ13C values of atmospheric CO2 have decreased, mainly due to burning δ13C depleted fossil fuels. This decline is directly reflected in δ13C values in tree rings and must be corrected by adding the difference between the atmospheric δ13C values estimated from the ice cores (or air samples) and the estimated δ13C value in AD 1850 (−6.4%) to each year [35]. In this way, the δ13Catm chronology is obtained. The second correction considers the physiological response of trees to changes in the atmospheric concentration of CO2 for the purpose of adjusting tree ring δ13C values to those in preindustrial conditions [36]. The correction applies a unique, non-linear de-trending of individual tree δ13C series, taking into account the stable isotope fractionation theory and logical assumptions on how trees could potentially respond to rising CO2. This correction is called “PIN” or pre-industrial correction and has already been successfully used in various studies [37,38,39,40]. The δ13Catm chronology was used in the climate correlation analysis for comparison of the results with the δ13Cpin chronology. The δ13Cpin chronology was used for all other analyses.
2.5. Analysis of the Climate-Growth Relationship
After detrending in the case of TRW, and after atmospheric and PIN corrections in the case of δ13C, the expressed population signal (EPS) was calculated to assess the common signal (e.g., climate) in stable isotope and tree-ring width chronologies. According to the generally accepted threshold, an EPS of 0.85 or higher is enough to show that the analyzed tree ring series contains some kind of common signal or common forcing mechanisms [41].
TRW and δ13C chronologies were compared to average monthly temperatures, monthly sum of precipitation and monthly average of the proportion of the sky covered by clouds (cloudiness is defined as the part of the sky covered with clouds. At this station it was measured in 10-ths of visible sky covered with clouds. Values range between 0 and 10, whereby 0 means completely clear sky and 10 completely cloudy sky. The monthly cloud coverage value is expressed as the average of the daily values) using a bootstrapped correlation coefficient available in the treeclim library [42] of the R program. Spatial correlation patterns between tree ring proxies and different combinations of monthly and seasonal variables were investigated using temperature and precipitation monthly gridded data (0.5 × 0.5° grid) from the CRU TS database [29] available at the KNMI Climate Explorer website [43,44].
Each tree ring proxy was tested against monthly meteorological data or different combinations of seasonal variables (e.g., May–June, July–August, or June–August) to see its potential for climate reconstruction. The likely skill of regression-based reconstructions was tested using a split-period calibration/verification approach, as recommended by the National Research Council. This includes calculations of reduction of error (RE), coefficient of efficiency (CE), mean squared error (MSE), and the squared correlation coefficient (r2) [45]. Statistical analysis was performed using R (libraries dplR [32], treeclim [41], graphs were created using IgorPRO.
3. Results
3.1. Long TRW Chronology
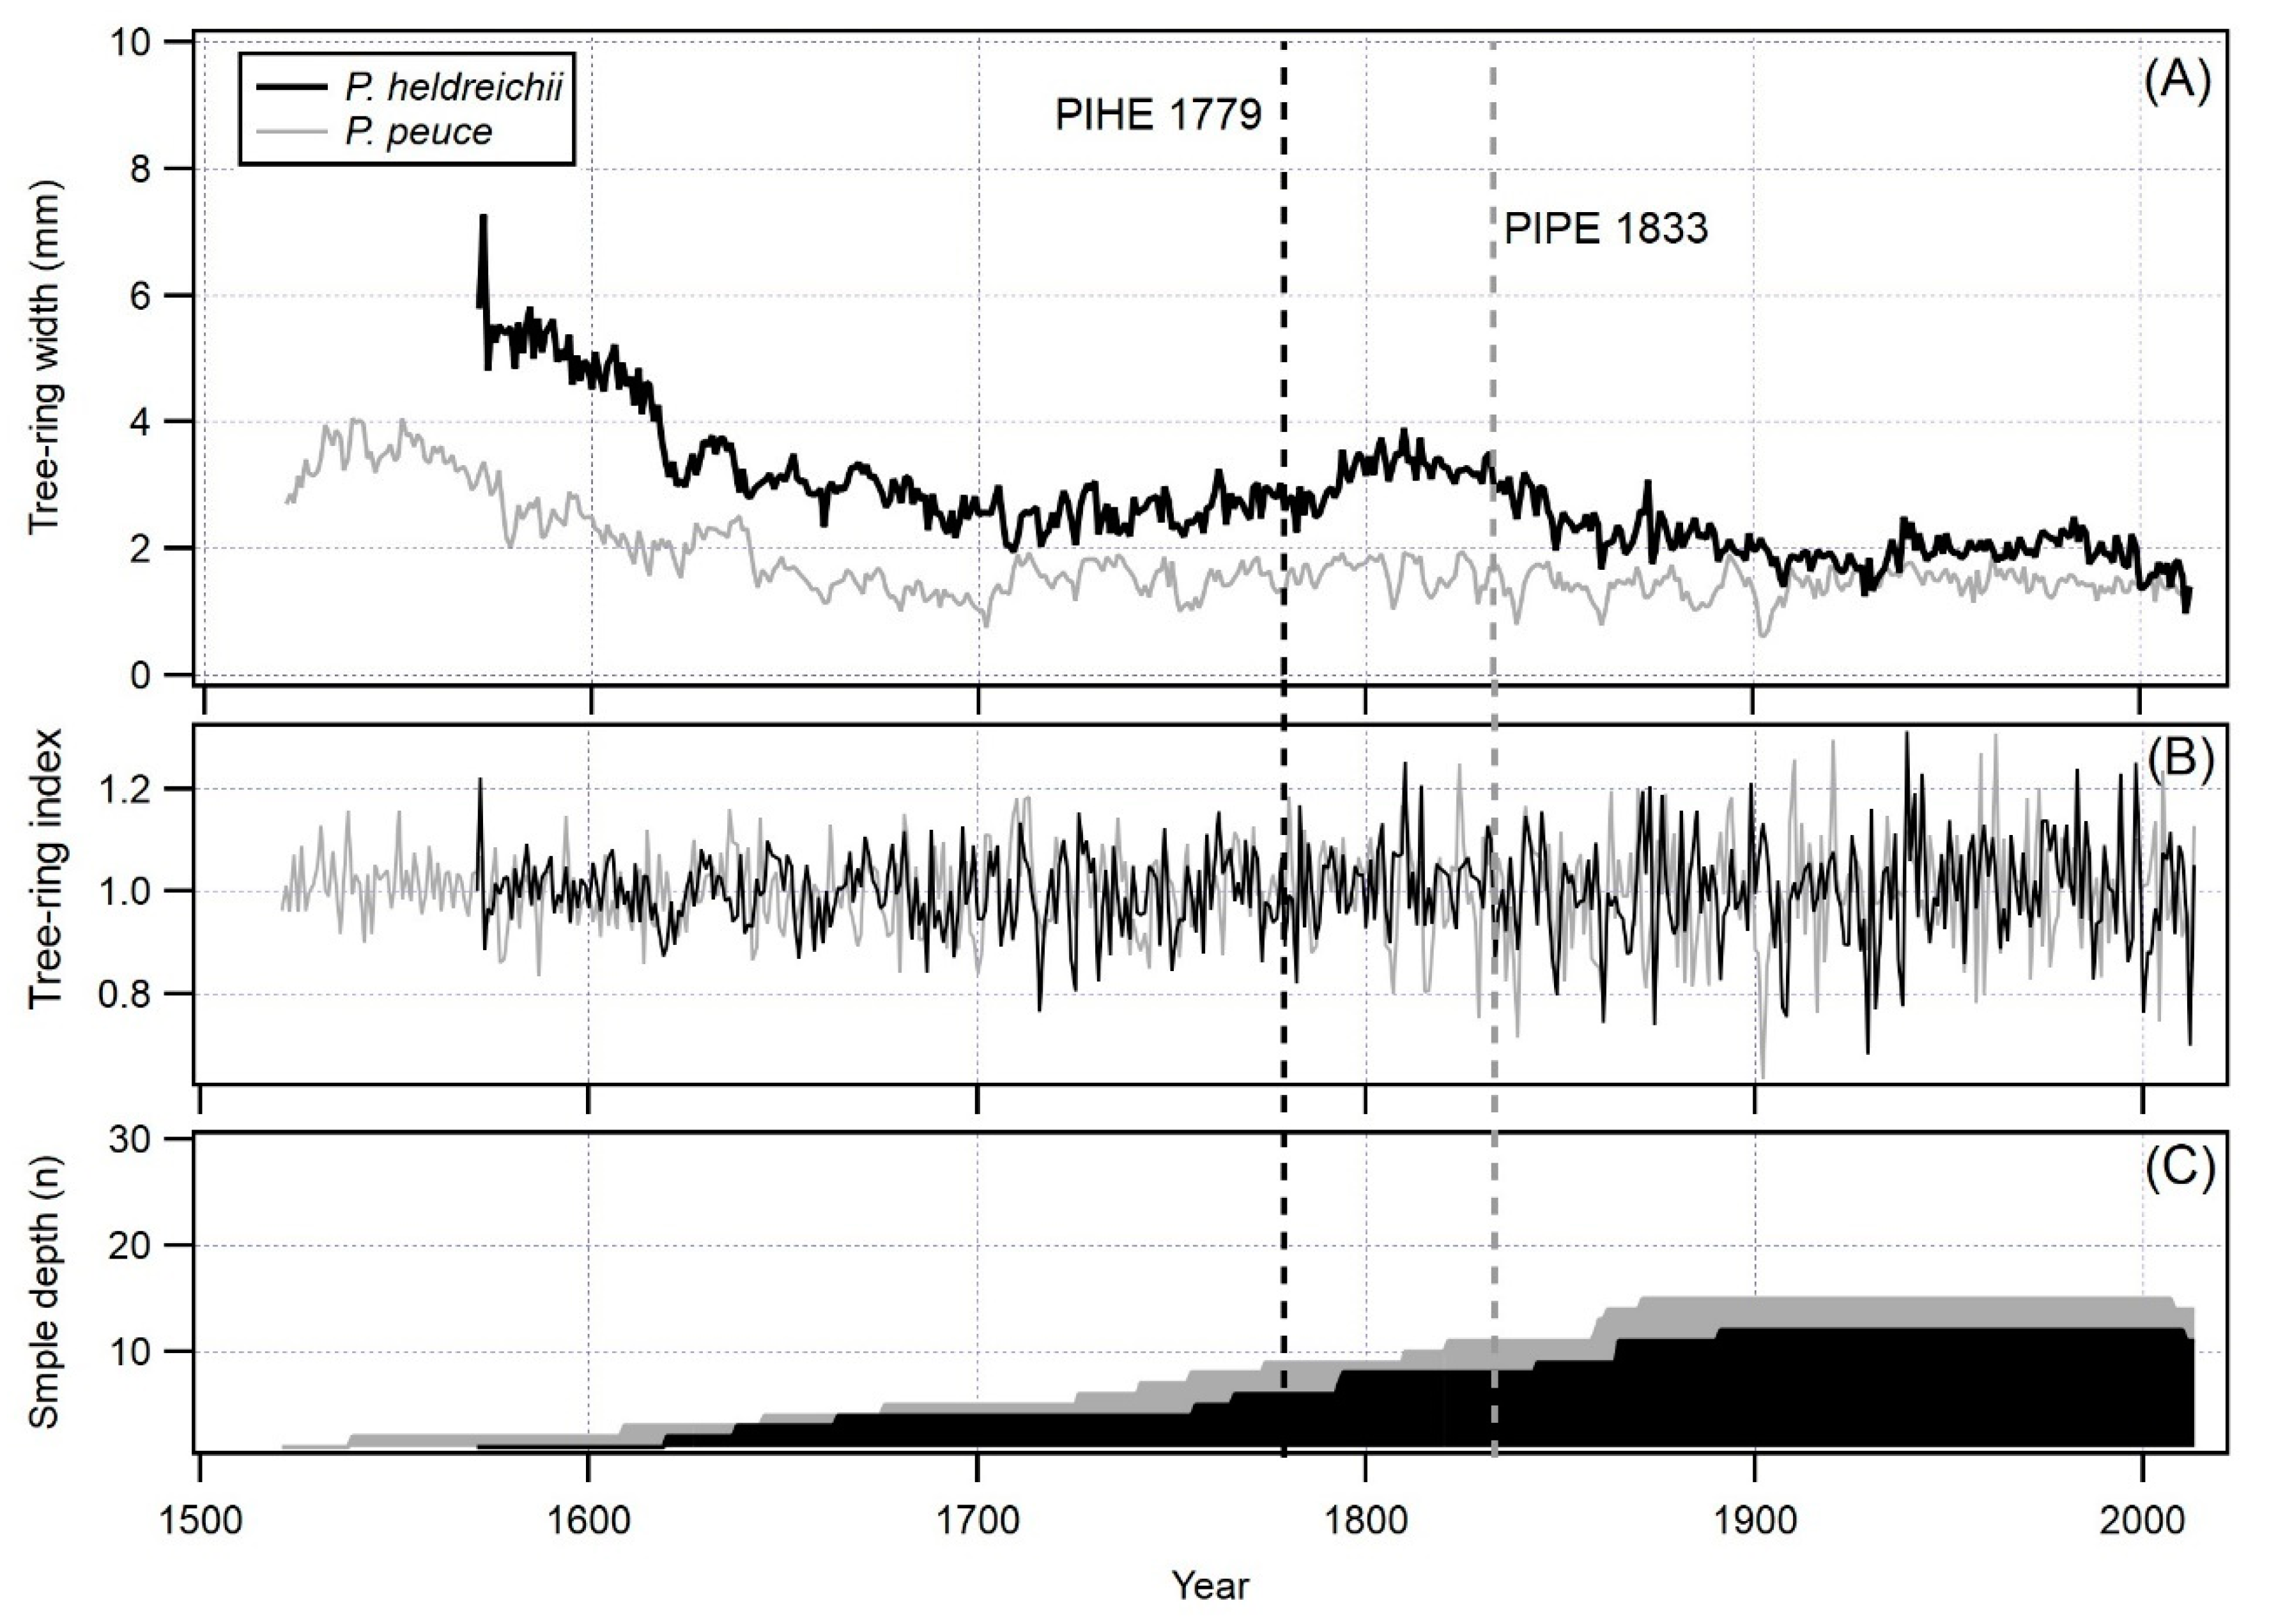
Both studied pines are long-lived species and, even with a limited number of cored trees, it was possible to construct more than 440-year chronologies (443 years for P. heldreichii and 493 years for P. peuce), so the potential for construction of a long chronologies is excellent for both tree species. In general, P. heldreichii showed better radial growth than P. peuce: average TRW was 1.71 mm and 1.24 mm, respectively. Typical of these two pine species is low mean sensitivity, which indicates complacent, non-sensitive growth (0.17 for both species). The period of expressed population signal (EPS) equal or above 0.85 is longer for P. heldreichii (until 1779) than for P. peuce (until 1833), despite the fact that P. heldreichii had a lower sample depth than P. peuce (Figure 3). Low frequency oscillations of TRW in both chronologies show a typical radial increment decrease of trees growing in sparse forest stands with low intensity (or no) human intervention.
While the P. heldreichii chronology shows some long-term oscillations, the P. peuce chronology seems to be very stable in time, showing only high frequency oscillations and almost no low frequency oscillations, apart from a tree-ring width decrease caused by increasing tree diameter. Basic parameters of both chronologies are presented in Table 2.
Comparison between P. heldreichii and P. peuce TRW chronologies showed relatively low tBP and GLK% values, especially when taking into account the very long overlap (tBP = 6.19, GLK% = 60.40, overlap = 443 years). To put these values into a broader context, we compared both TRW chronologies with same-species chronologies from the Slovenian Forestry Institute dendrochronological archive. When we compared Murina P. heldreichii with chronologies from Western Balkan region (Bosnia and Herzegovina, Albania and Kosovo), we calculated more significant statistical metrices, even when the overlap was not very long (Table 3). When comparing Hridsko P. peuce chronology with other P. peuce chronologies from not so distant locations in Albania (Lure) and North Macedonia (Pelister), we got lower statistical values than when comparing P. peuce and P. heldreichii from Murina and Hridsko (Table 3).
3.2. Climate Signal in P. peuce and P. heldreichii Tree-Ring Widths
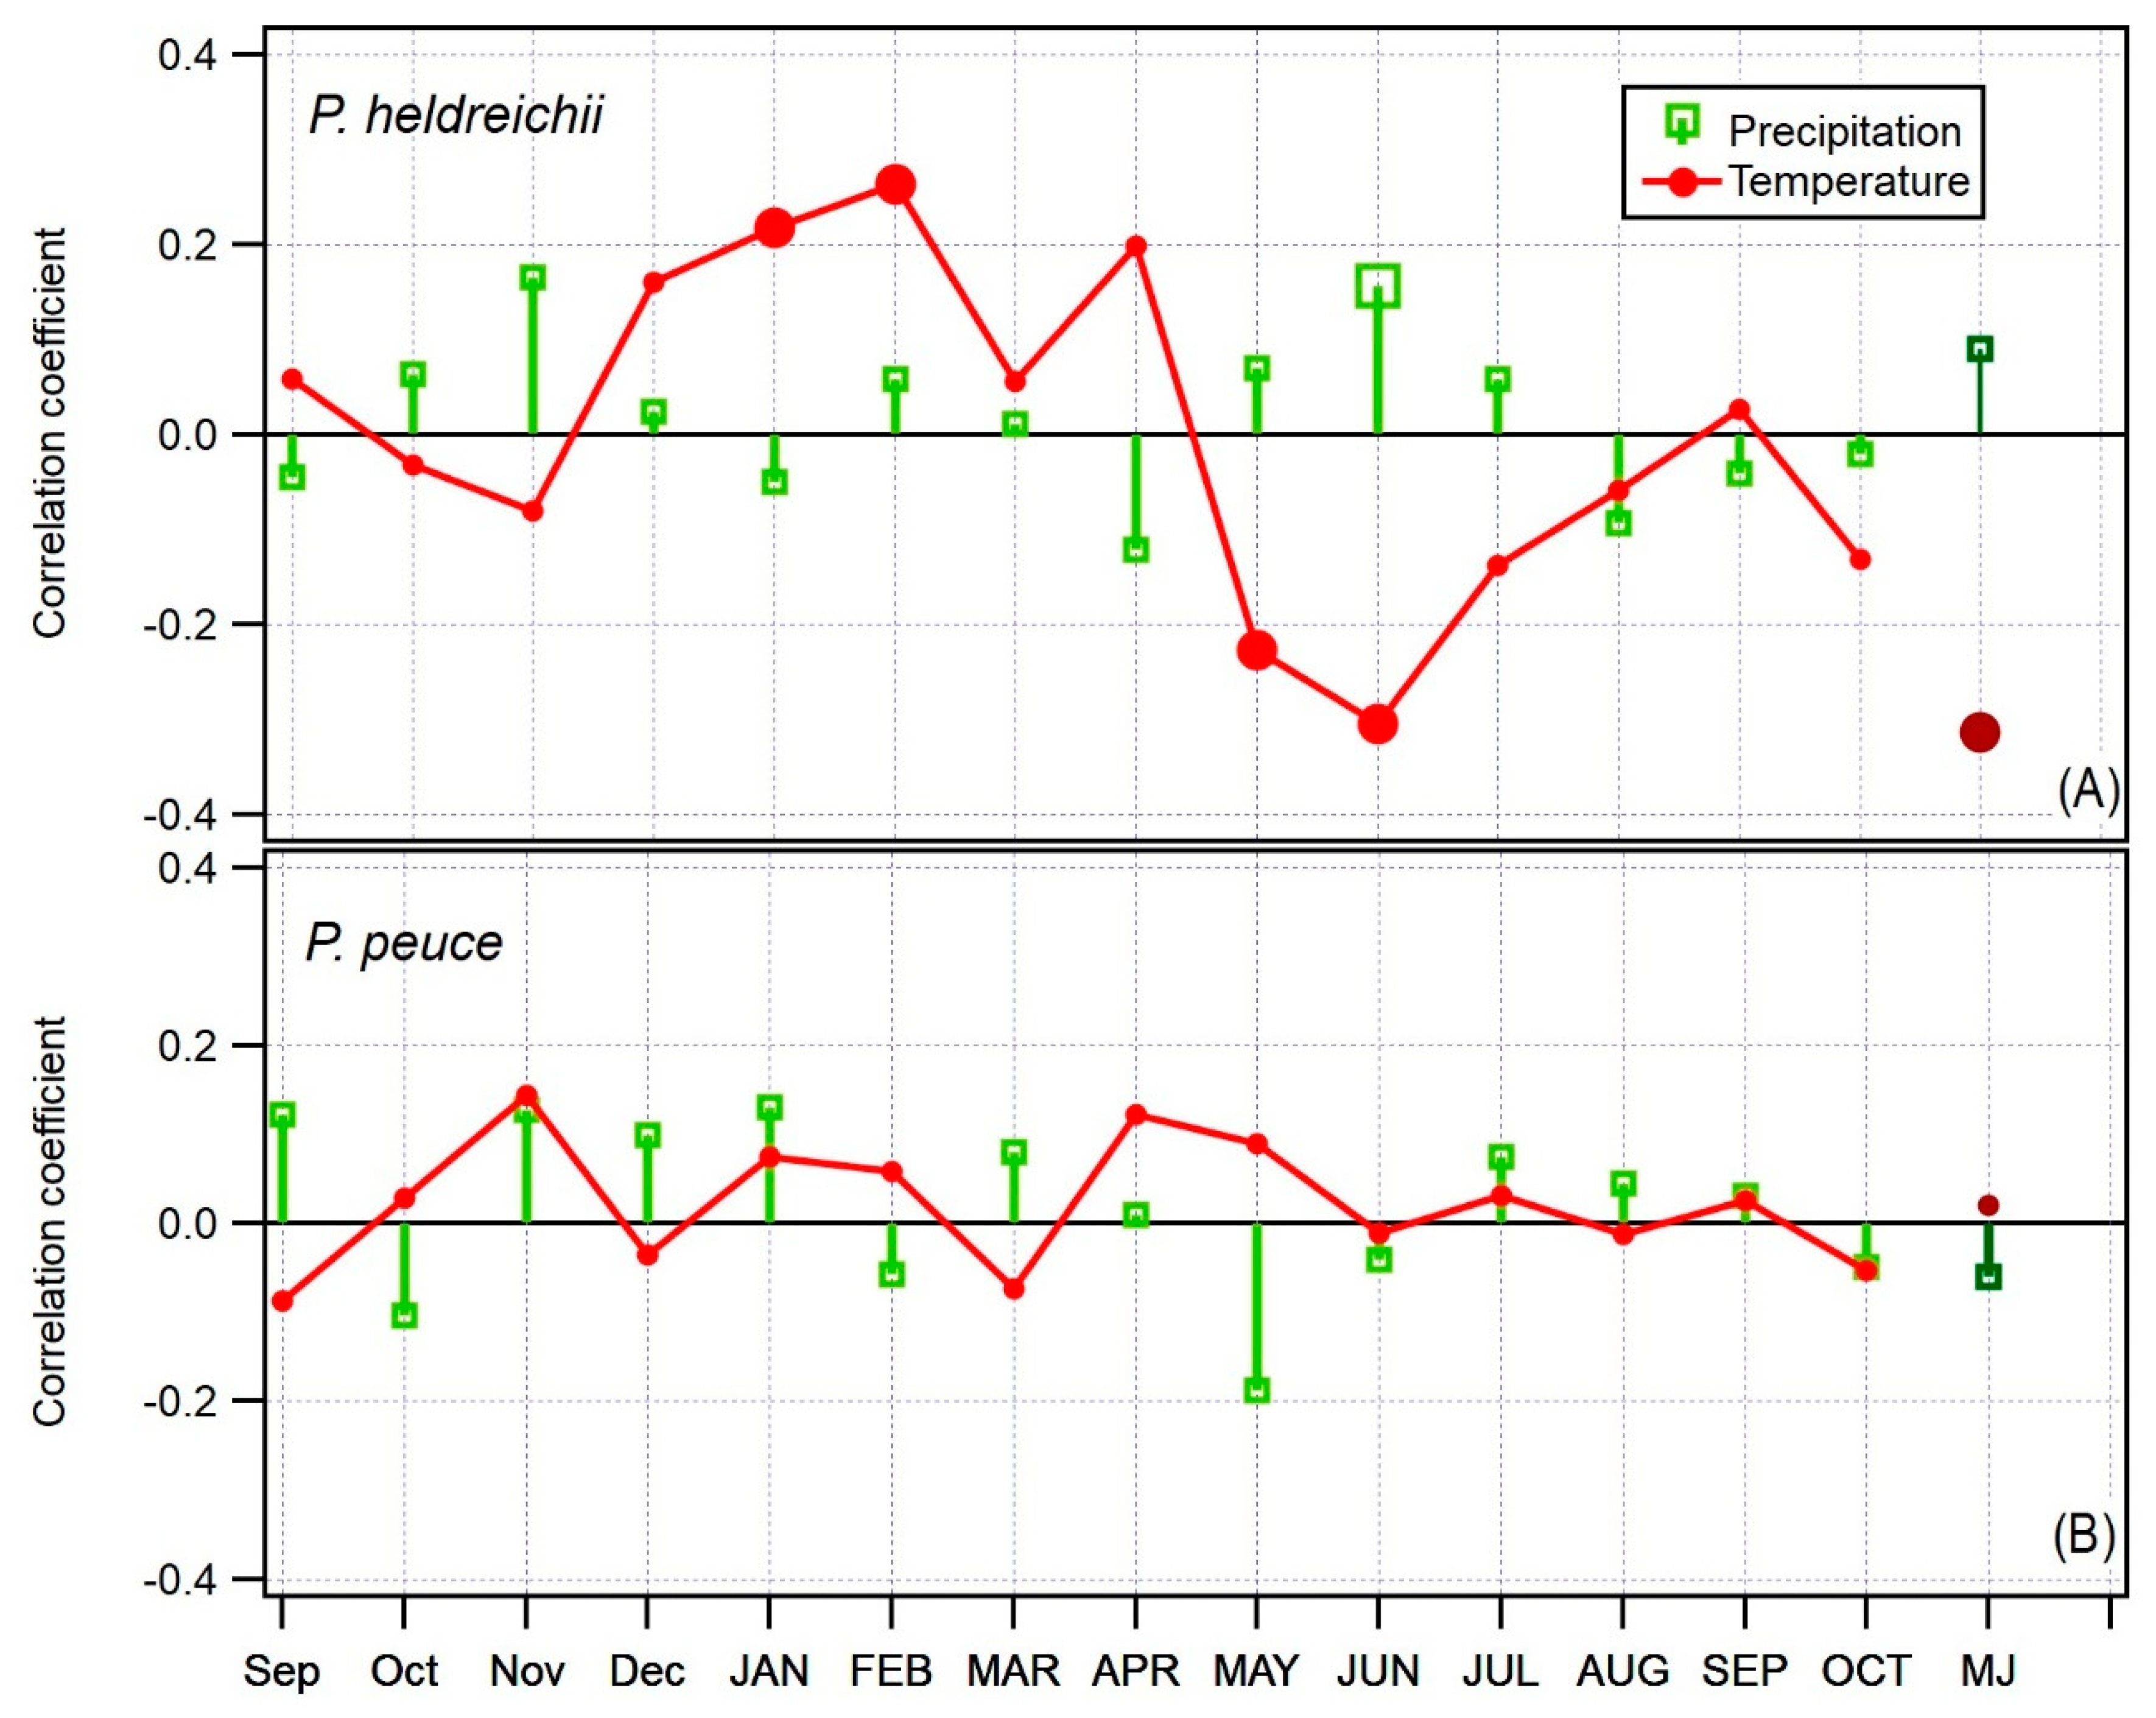
We found a very weak to non-existent climate signal in the tree-ring widths of both species. P. heldreichii seems to have a slightly more pronounced climate signal in tree-ring widths than P. peuce. In P. heldreichii, we found significant and positive, yet weak, correlations with January and February above average temperature, 0.22 and 0.26, respectively, and significant but negative correlations with temperature in May and June, −0.23 and −0.31, respectively. When both months with significant correlations were merged into a seasonal variable May–June (MJ), we got a significant correlation of −0.31 (Figure 4 A). The temporal stability of the MJ temperature climate signal is weak and most of the time at the threshold of significance. There are periods of significant correlation between 1900 and 1935 and between 1950 and 1975 (data not shown here).
The climate signal in TRW of P. peuce is weak to non-existent. We found no significant correlations between TRW and any of the monthly or seasonal combinations of meteorological parameters (Figure 4B).
Despite weak or non-existent significant correlations between TRW and the monthly meteorological variables in P. heldreichii, we tested P. heldreichii TRW performance for climate reconstruction (Table 4). As expected, due to the low correlation values between TRW and monthly or seasonal combinations of meteorological parameters, the statistics used to assess the accuracy of the climate reconstruction potential for P. heldreichii failed. RE and CE for the only significant seasonal combination May–June (MJ) were negative, which means that the current P. heldreichii chronology does not reach the thresholds required for reliable climate reconstruction and cannot be used for this purpose. P. peuce tree-ring widths, on the other hand, showed no significant correlations with any of the climate monthly or seasonal variables, so performance for climate reconstruction was not tested (and data not presented in Table 4).
It must be stressed that researchers working with both species in the countries in which the analyzed species also grow (Bulgaria, Albania, Kosovo, Greece) have found relatively low correlations between P. heldreichii TRW and climate, making P. heldreichii less useful for climate reconstruction [10,15,16,19]. On the other hand, the results of climate-growth studies in P. peuce from Bulgaria have shown that the climate signal in tree-ring widths is very weak [10].
3.3. P. heldreichii and P. peuce Stable Isotope Ratio Chronologies
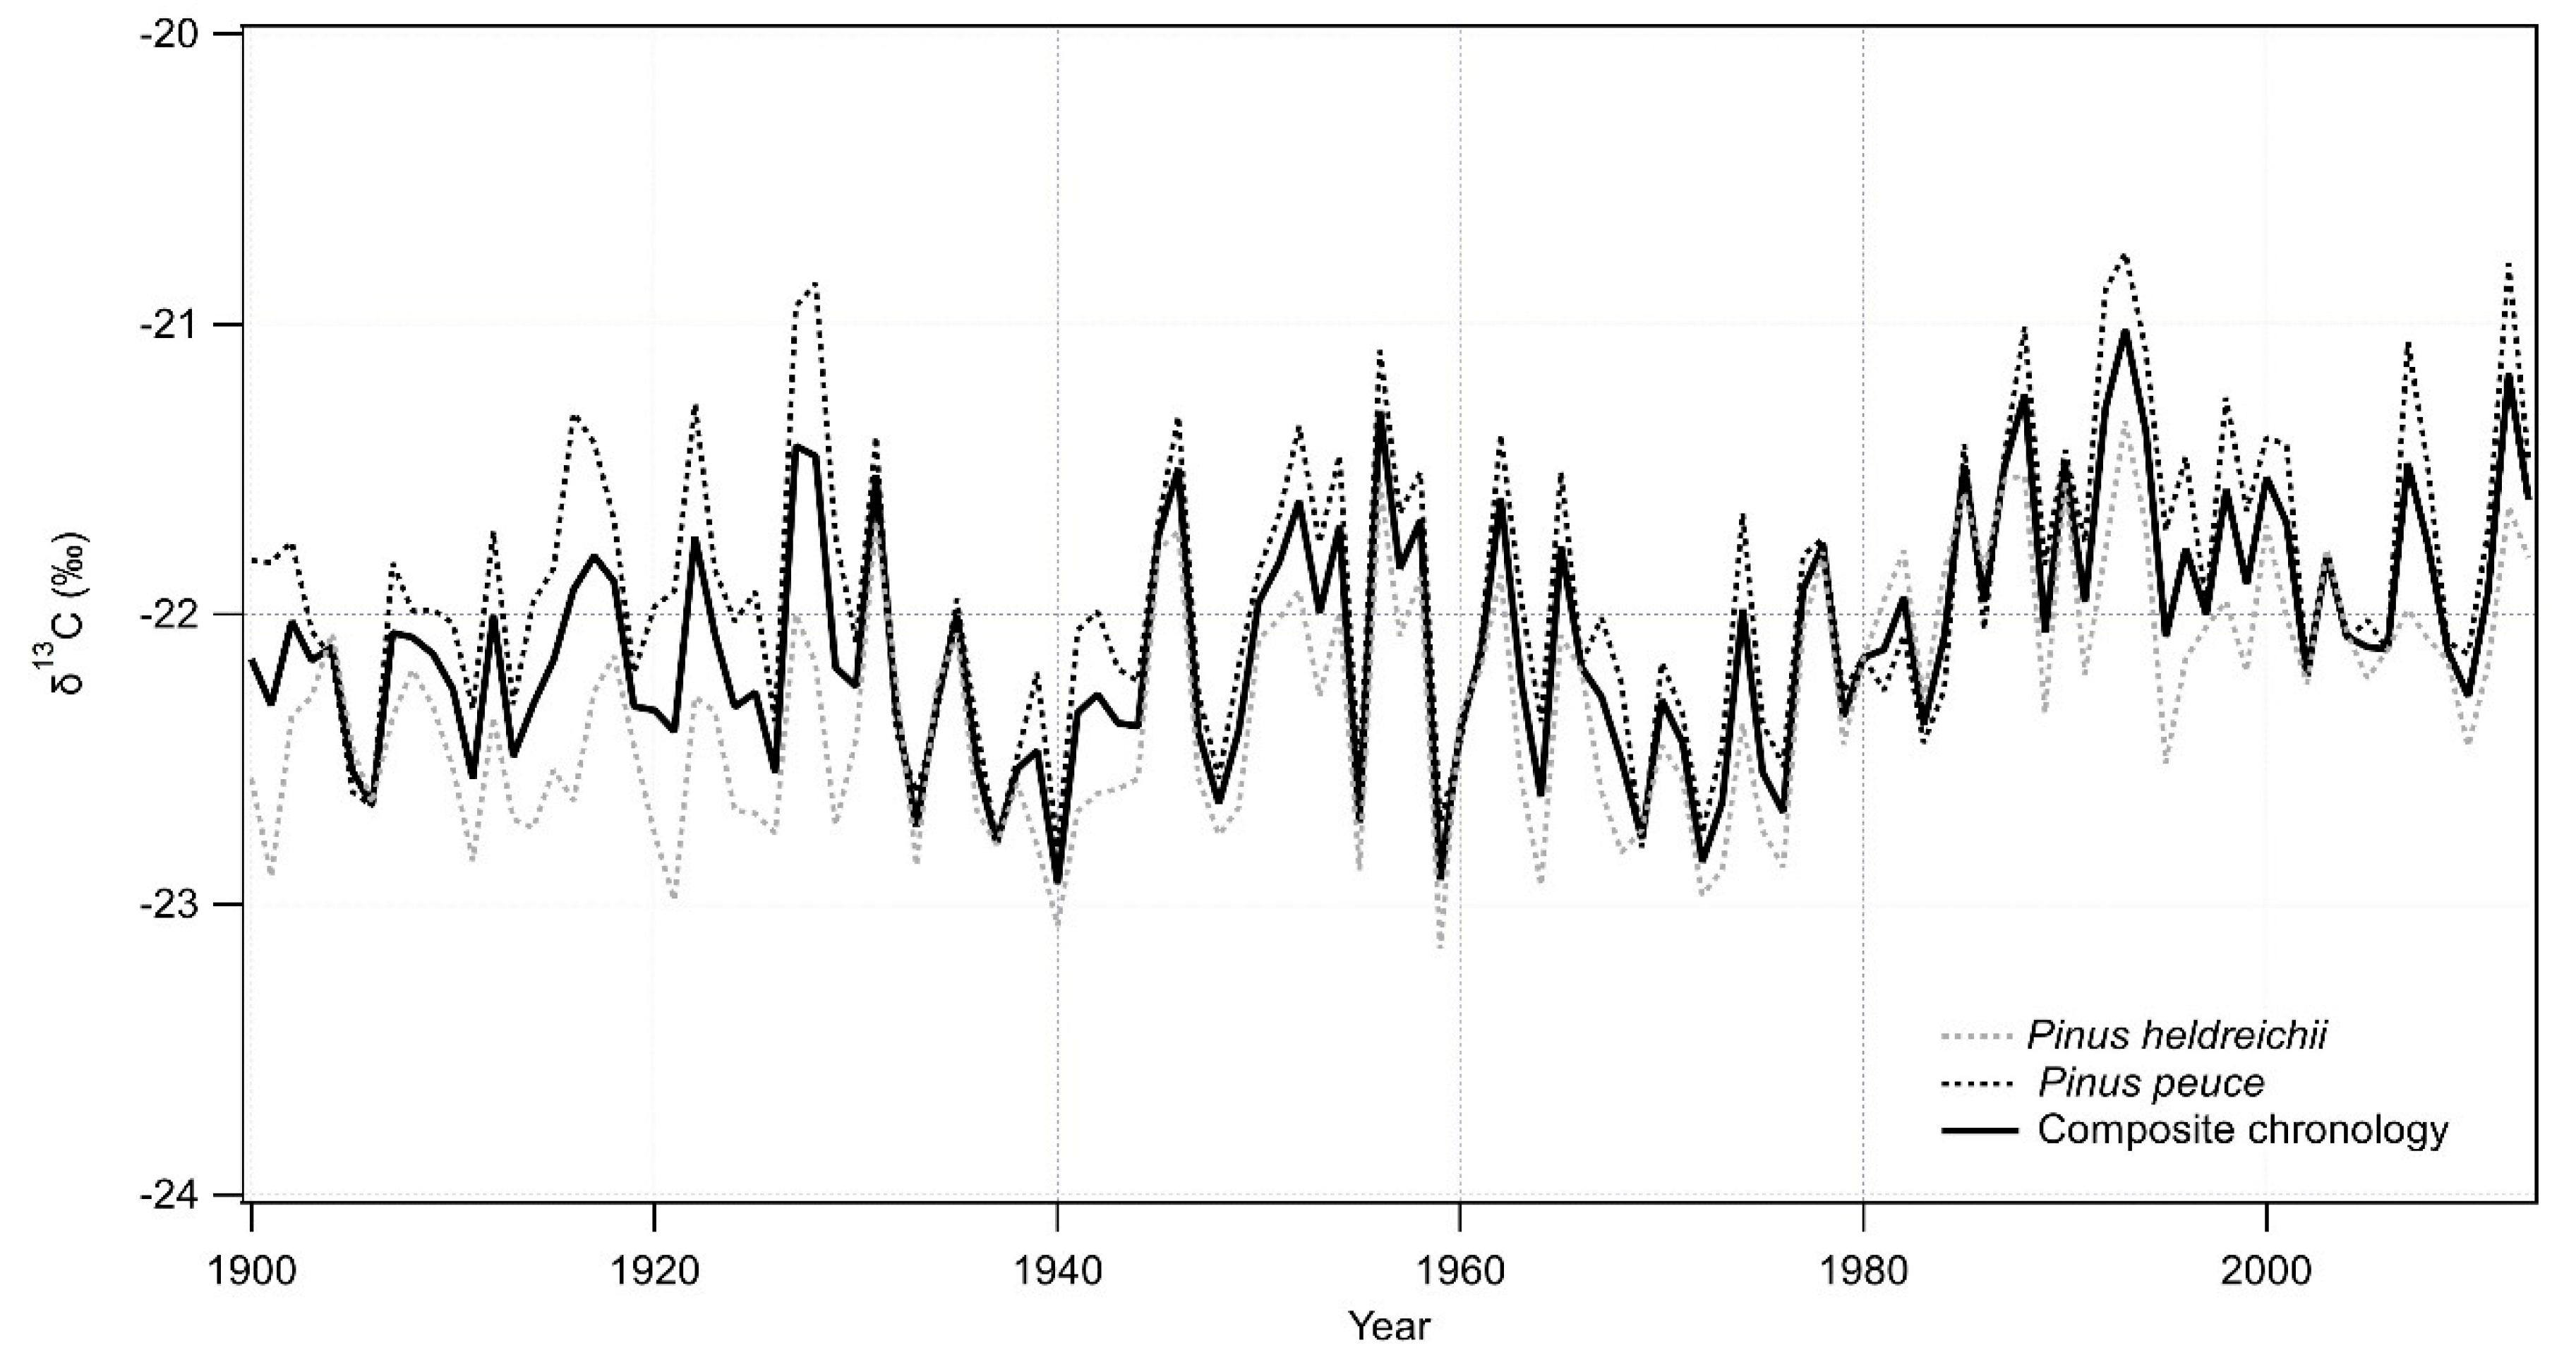
In addition to the two TRW chronologies, we also developed two δ13C chronologies, one for each tree species. When we compared the two δ13C chronologies (Figure 5), we found that they were significantly and positively correlated with each other, yielding a Pearson’s correlation coefficient of r = 0.70 (p < 0.001). Due to the high correlation coefficient, almost identical trend of chronology curves, and the purpose of the study (analysis of climate signal over the larger Balkan region), we decided to merge the two chronologies into a single, composite δ13C chronology, referred from here on as Pinus composite. Descriptive statistics, including EPS and average correlation between individual trees from the two sites and for the composite stable isotope ratio chronology are presented in Table 5.
3.4. Relationship between Climate and Composite δ13C Chronology
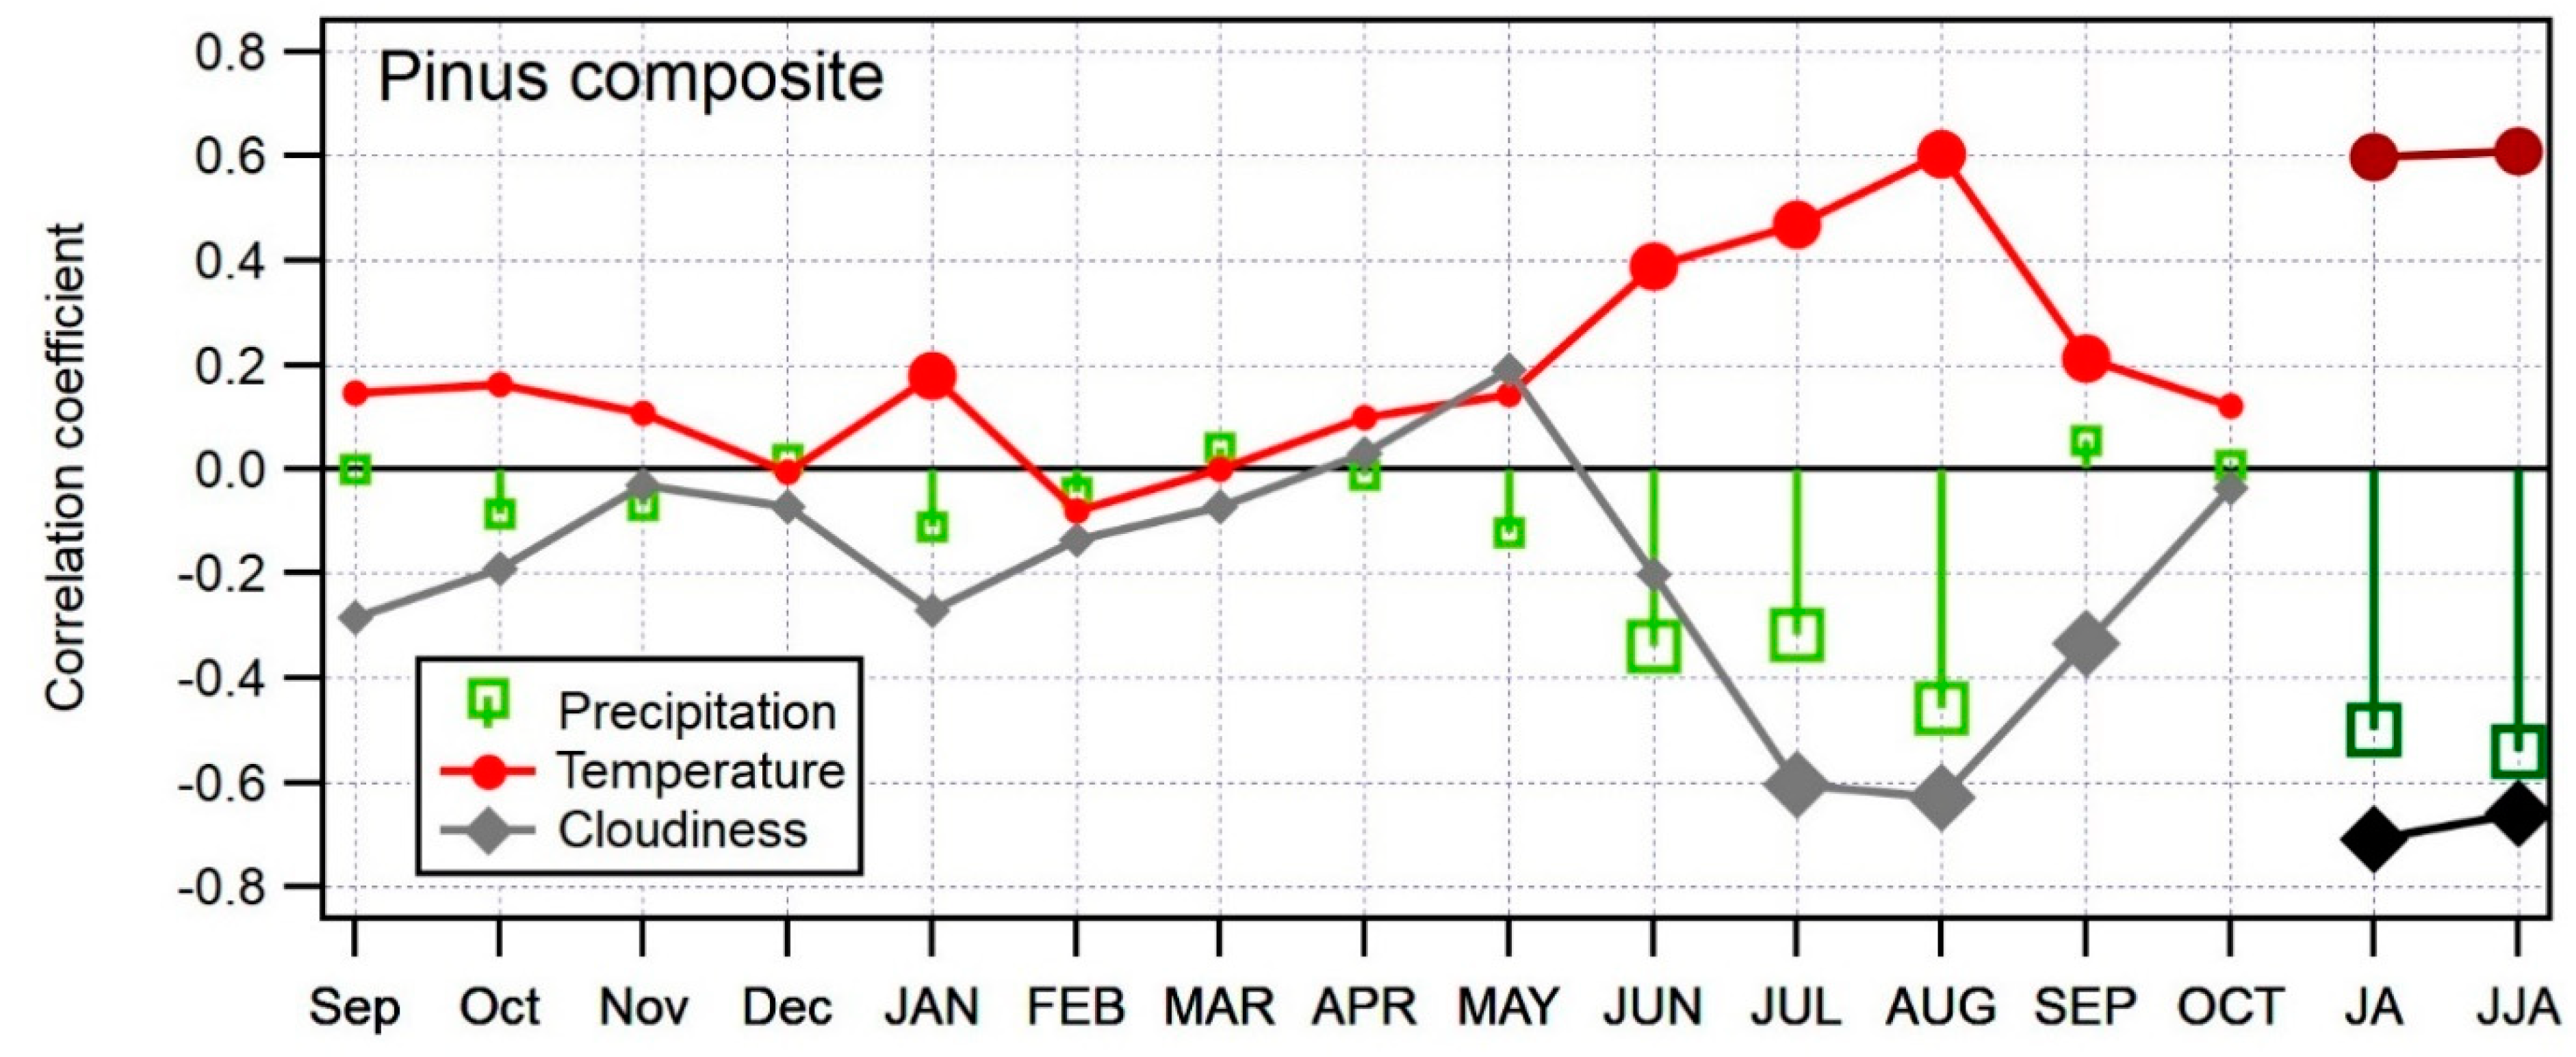
The bootstrapped correlation coefficients were calculated between the composite δ13C chronology and monthly climate variables, from September of the year prior to ring formation to October of the year of ring formation. In addition to single months, we also included several seasonal combinations in the calculation. Statistically significant r values were obtained for all three analyzed climate parameters: positive for temperature and negative for precipitation and cloudiness in summer months. The highest correlations were found between δ13C and cloudiness in July (r = −0.60) and August (r = −0.63). The cloudiness signal was enhanced when July and August were merged into a seasonal variable JA (r = −0.71) or June, July, and August (r = −0.66). Despite high correlations between δ13C and cloudiness data, the results should be treated with care since the cloudiness data covers only a short time period, between 1970 and 2016. The temperature signal in the δ13C chronology was also significant. Summer months June, July, and August showed the highest correlations, with August displaying the highest correlation for temperature (r = 0.60). When merged into a seasonal variable, July and August (JA) gave a correlation of 0.60 and June, July, and August (JJA) a correlation of 0.61. The correlation between δ13C and precipitation is important, but not as much as temperature or cloudiness. When merging July and August into a seasonal variable, we got a correlation value of −0.50, and −0.51 for the combination of June, July, and August. Figure 6 shows correlations between δ13C and meteorological variables for the entire period of the available data for temperature and precipitation (1901–2013) and for cloudiness (1970–2013).
3.5. Temporal Stability of the Climate Signal
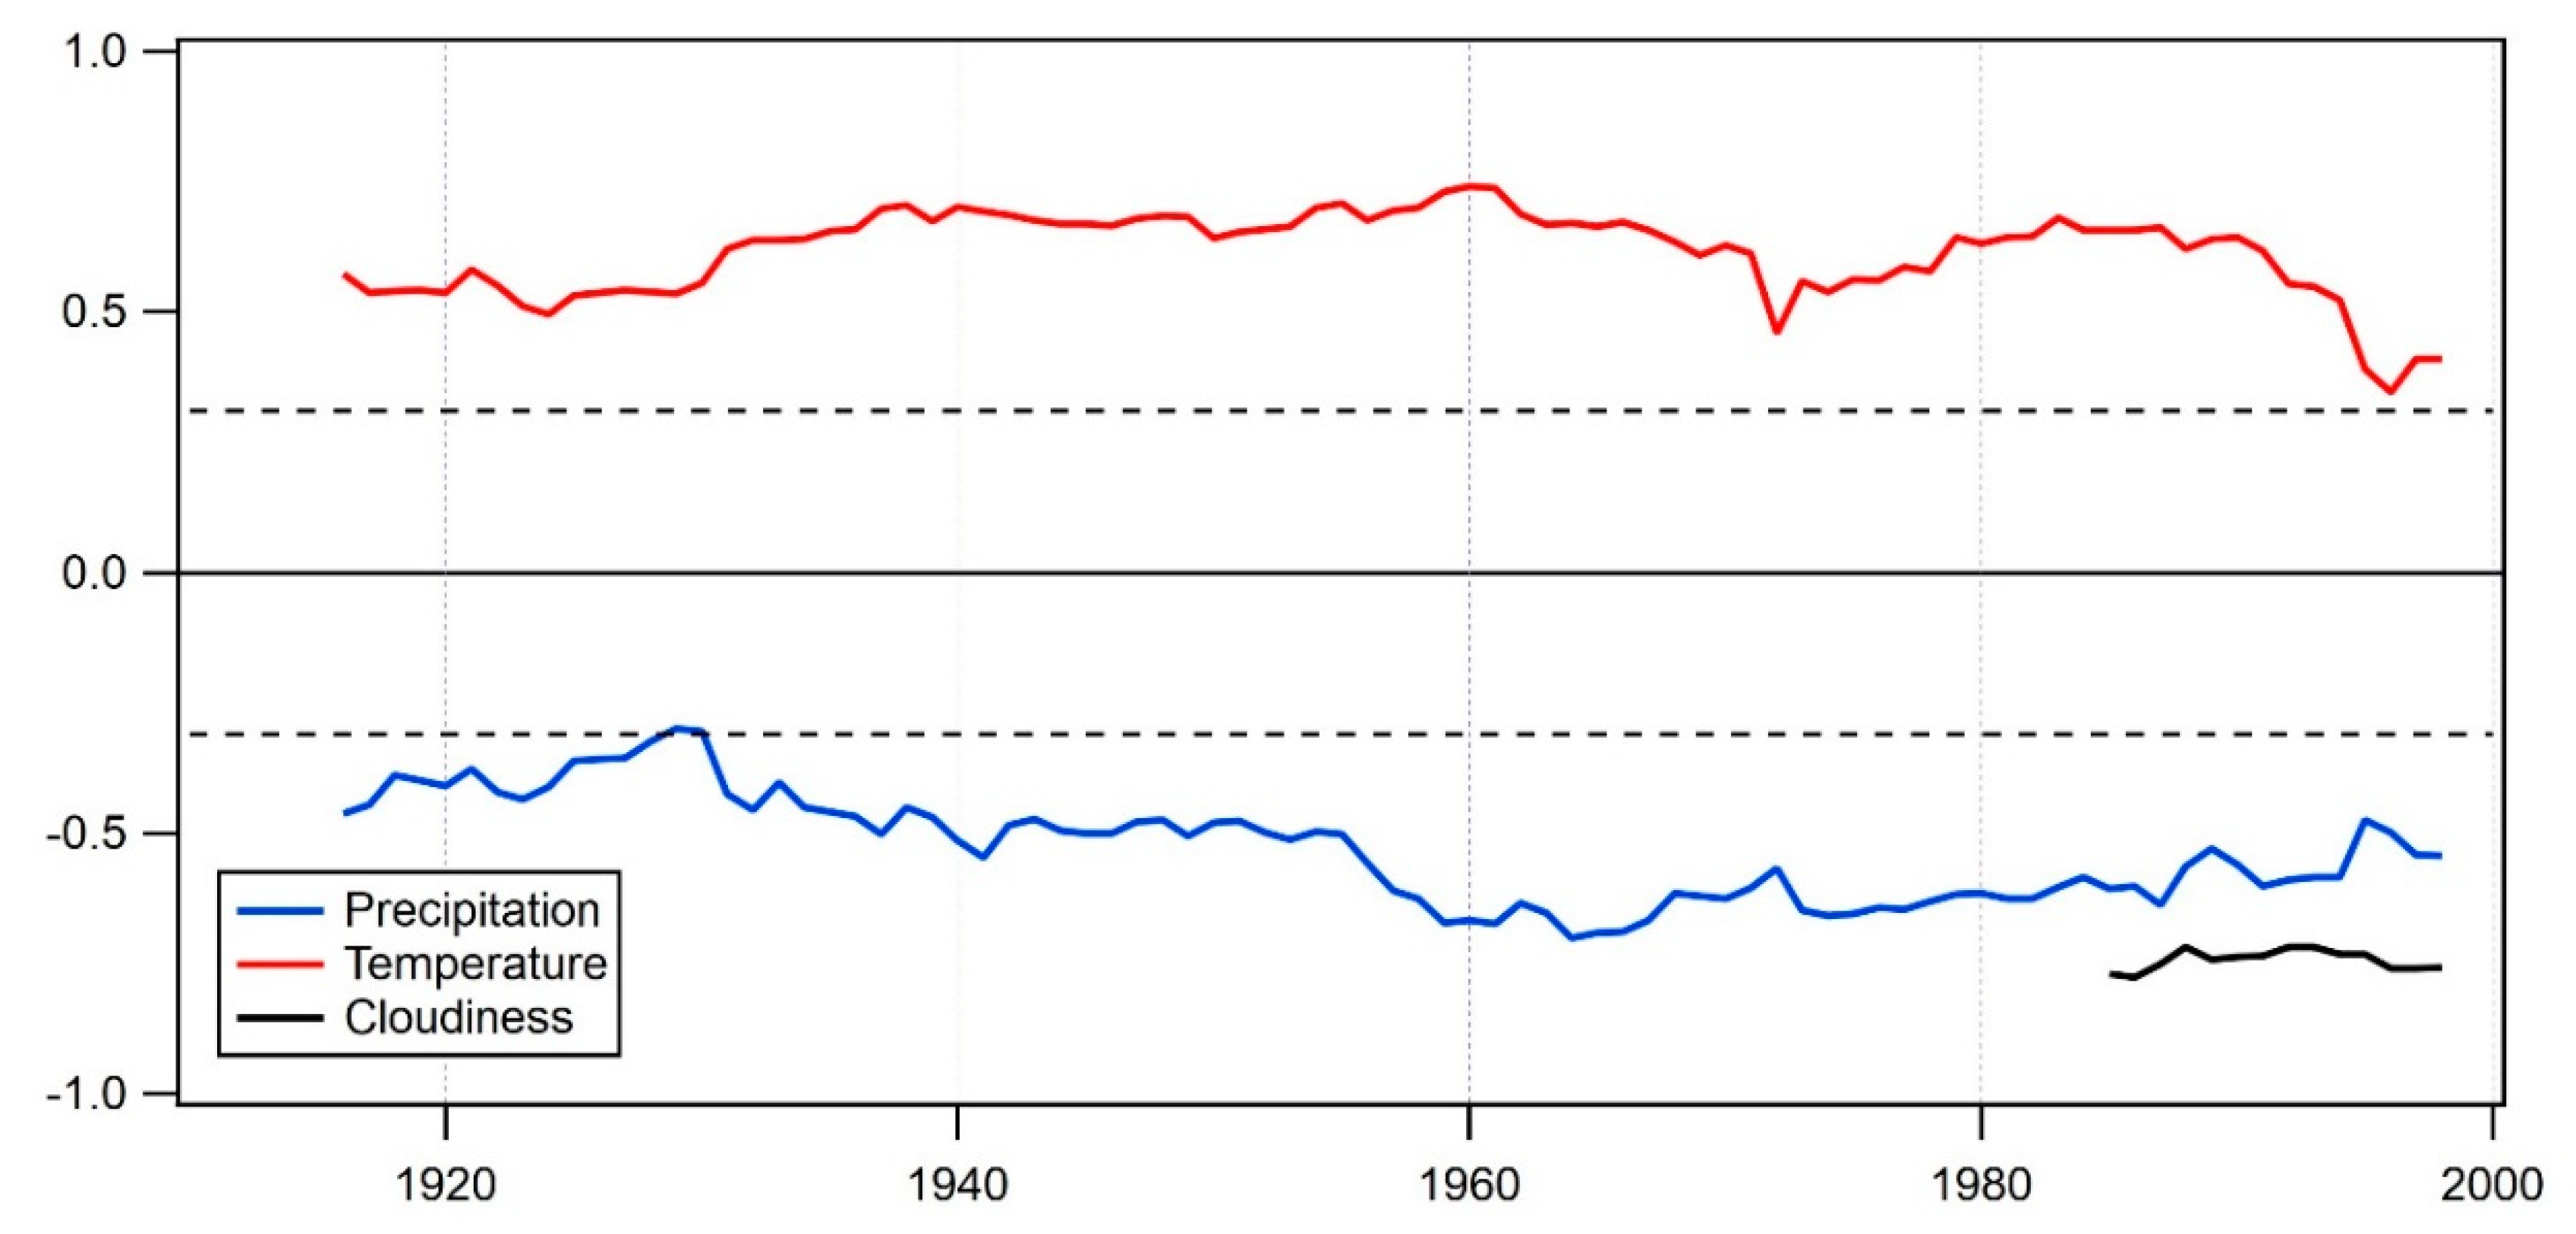
For any kind of climate reconstruction, it is crucial to test the temporal stability of the climate signal. Based on the bootstrapped correlation analysis (Figure 6), the JJA combination was selected as a variable with the highest correlation among all three climate variables and therefore used in the temporal stability test (Figure 7). The influence of all three analyzed climate variables is pronounced through the whole analyzed period, although there were some changes in trends through time. In the early period, around 1930, the precipitation climate signal was close to not significant. The period 1930–1990 is characterized by a significant impact of both temperature and precipitation. In the last period (1990–2013), the impact of temperature slightly declines, but the amount of precipitation gains in importance. The analysis of a short set of cloudiness data showed a highly significant and stable signal of cloudiness in δ13C for the latest period. Although based on a short dataset, these results indicate that cloudiness or, better said, the opposite of it, duration of sunshine hours as an approximation for photon flux, has dominant control on photosynthetic rate and therefore on stable carbon isotope fractionation.
We also tested the temporal stability of the JJA climate signal using different lengths of moving window (data not shown here) and the correlation pattern appeared to be stable in time, and similar. This confirmed that, combined, June, July, and August climate conditions are the most prevailing factors influencing δ13C values in tree rings of endemic pines growing in Balkan high-elevation areas.
3.6. Spatial Pattern of Correlation between δ13C and Climate and Spatial Outreach of the Climate Signal
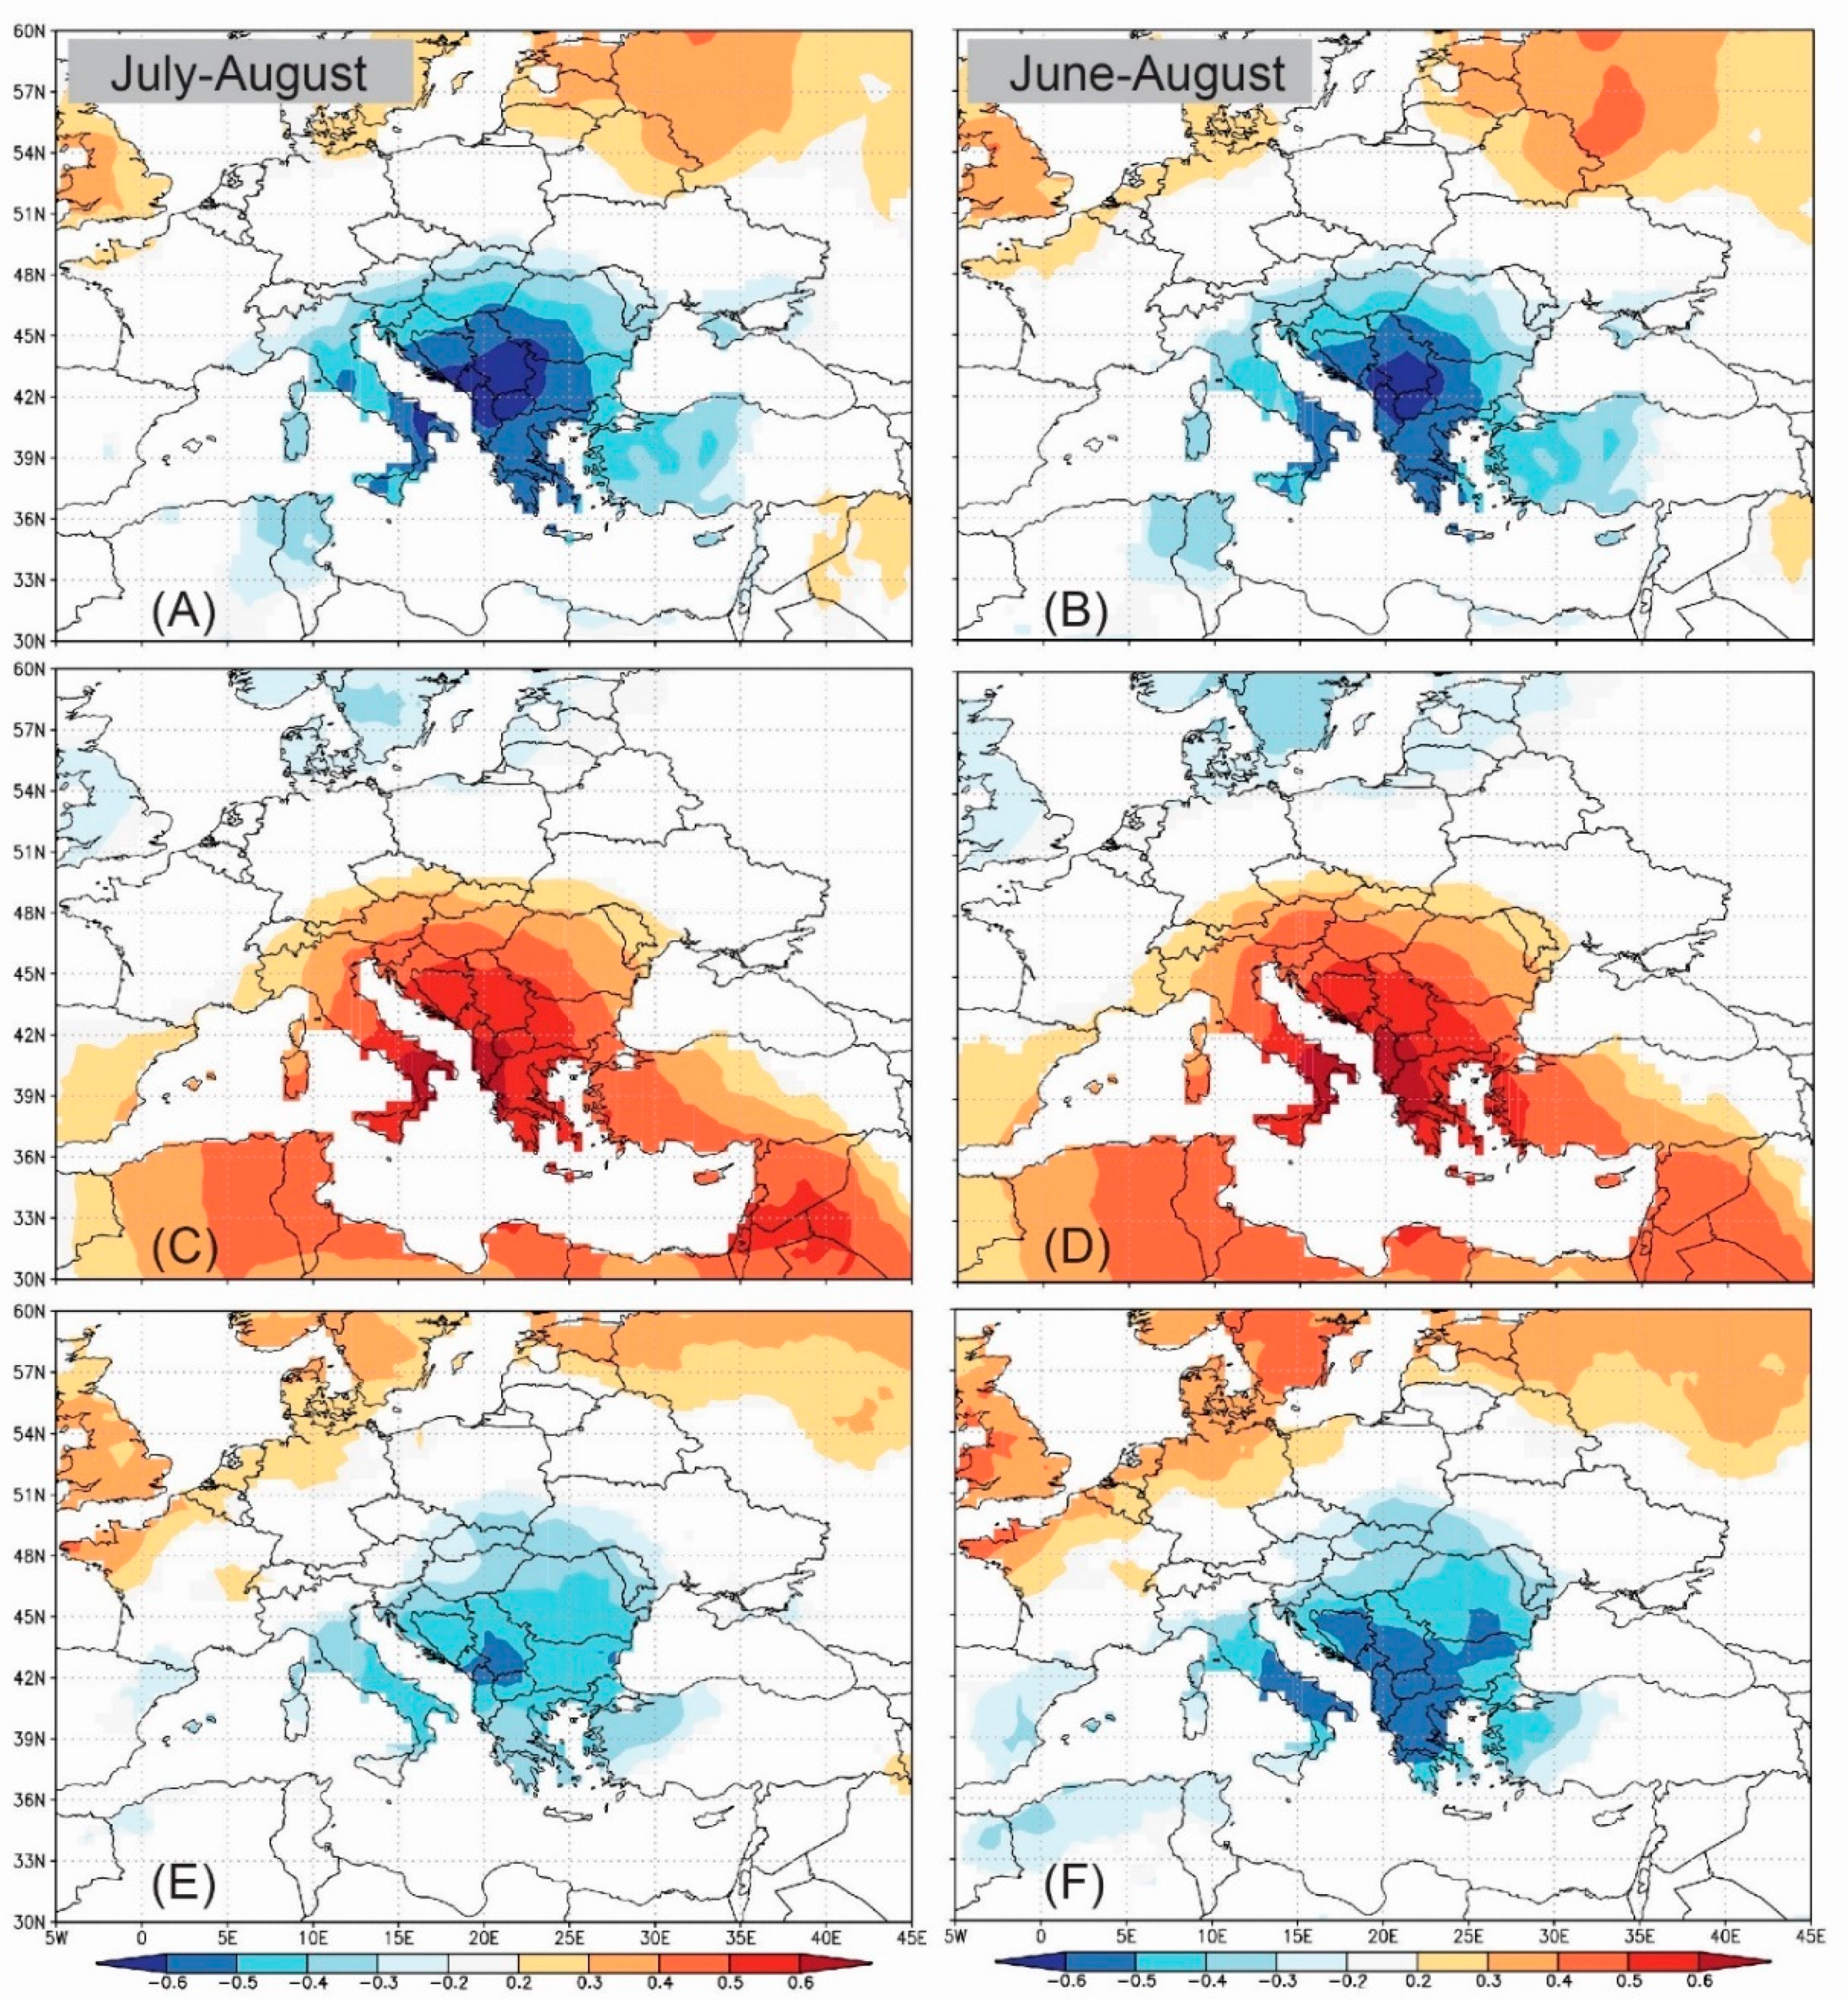
The combined July–August and June–August climate series from the CRU TS 3.24 gridded dataset significantly correlate with the δ13C chronology, as shown in Figure 8. The strongest positive signal is shown for the correlation with summer (JJA) temperatures, with the strongest signal over the Balkan region, extending over the Mediterranean Sea and the Middle East. A nearly identical, but negative, pattern is obtained for the correlation with cloudiness. As to precipitation, δ13C is less strongly correlated with local precipitation and significant correlations have smaller spatial outreach, although the spatial pattern is very similar to that obtained for temperature and cloudiness.
3.7. Potential for Climate Reconstruction
Significant spatial field correlations and large spatial outreach for temperature (Figure 8C,D), as well as significant correlations between tree ring δ13C and seasonal variables (July–August and June–August), indicate that tree-ring δ13C provides a promising proxy for summer temperature reconstruction in the Balkan peninsula. The stability of the relationship was tested using separate 56-year calibration and verification periods for the two seasonal variables with the highest correlation—July–August (JA) and June–August (JJA). Both commonly used measures of the predictive skills for a linear regression model (RE and CE statistics) are highly positive, regardless of whether the early or the later period is used for the calibration (Table 6).
The high correlation between JJA and the δ13C chronology, as well as the temporal stability of the signal, allow for the development of a linear regression model between JJA as the dependent variable and δ13C chronology as an independent variable for the 1902–2013 period. This model explains 38% of the climate variability (Table 6). In the case of JA, the model explains 37% of the variability and, in combination with the slightly lower RE and CE values of this model, it can be concluded that JJA has slightly better climate reconstruction potential.
4. Discussion
4.1. Long TRW Chronologies and Their Potential for Dating Wooden Objects and Constructions
Both analyzed species, Pinus heldreichii and Pinus peuce, are long-lived endemic Balkan pines with P. heldreichii having a slightly larger distribution range than P. peuce (Figure 1). Both pines grow at high elevations and one could expect them to respond well to changes in the environment and/or climate.
From a dendrochronological point of view, the longevity and durability of wood is what makes these two species potentially important for dating purposes in cases where wood originating from the two species was used in buildings or other wooden constructions. Critical in dating historical buildings and wooden constructions is the possibility of synchronizing TRW samples from the constructions with regional chronologies, even if the samples are not from locations close to the origin of the regional chronology. This is called teleconnection. Teleconnection in P. heldreichii is relatively good. When comparing the P. heldreichii TRW chronology from the Murina site with other P. heldreichii TRW chronologies from other sites across the Western Balkan region we got relatively high statistical values—tBP ranges between 5.89 and 15.50 (see Table 3), which is comparable with chronologies from other researchers [16,17].
P. peuce TRW chronologies are more difficult to synchronize and date. A comparison of the Hridsko P. peuce TRW chronology with P. peuce chronologies from other sites from our dendrochronological archive gave very low statistical values (tBP range between 0.6 and 3.05). In the case of P. peuce, teleconnection is not good and even if we had had some samples of P. peuce wood from historical buildings, the likelihood of synchronizing and dating this object would have been small. This is in accordance with results from other researchers, who have reported that it is difficult to teleconnect P. peuce TRW chronologies between sites and that statistical values of such comparisons are usually low, e.g., [10,46].
The dating potential of P. heldreichii is relatively good and the fact that we can produce very long chronologies gives this tree species good potential for dating historical wooden constructions and buildings. P. peuce, on the other hand, has a low potential for dating since chronologies, even from relatively close sites, do not synchronize well.
4.2. Climate Signal in Tree-Ring Widths
In our study, TRW chronologies of both species had only a weak to non-existent climate signal. This seems to be typical of both studied tree species since this characteristic has been reported by several authors [10,16,17,19]. Seim et al. [17,18] reported a weak signal in P. heldreichii from Albania, despite the fact that they collected a large number of samples from three sites. Bojaxhi et al. [16], who analyzed climate signal in P. heldreichii TRW from high elevation sites in Kosovo found a weak signal on two sites and a relatively good signal for precipitation in June on one site. Klippel et al. [19] reported low inter-site correlations of TRW chronologies in Greece (Mt. Smolikas) and an exposition dependent climate response, with south expositions having the strongest (but still not very high) climate signal. This is similar to the findings of Scheithauer et al. on P. heldreichii from the northern Pirin mountains, who suggest that radial growth is humidity limited and that tree-rings negatively reflect high summer temperatures on southern flanks [13,14]. Trouet et al. [11] reported a weak climate signal in TRW for P. heldreichii from Bulgaria and a strong and stable temperature signal in maximum latewood density. Those findings were in line with Büntgen et al. [47], who reported a weak spatiotemporal stability of correlation coefficients in a network of 28 conifer TRW chronologies from the Pyrenees.
Panayotov et al. [10] reported that P. heldreichii and P. peuce in Bulgarian high-elevation sites were negatively influenced by previous summer drought conditions and cold winters. Early summer temperatures were positively correlated with P. peuce radial growth, whereas P. heldreichii displayed dependence on summer precipitation. In the second half of the twentieth century, P. heldreichii trees displayed higher sensitivity to summer drought, which was probably a result of increased summer temperatures and decreased winter precipitation. In our study, we confirmed a weak signal in P. heldreichii. However, we could not confirm low inter-site correlations for P. heldreichii since between sites correlations in our study were high. Our findings regarding P. peuce are similar to those of Panayotov et al. [10,12]—the climate signal was weak to non-existent and between sites correlations are very low. It seems that P.heldreichii has a better signal in tree rings when trees are growing on southern slopes, as was demonstrated by Scheithauer et al. [13,14]. We cannot confirm this, since our site was located on a northern slope and was therefore less exposed to summer heat.
The absence of climate signal in the TRW of these two high-elevation tree species is intriguing. It could be that the number of sampled trees in our study was too low, and more trees of both species need to be sampled to get a better climate signal. However, when developing TRW chronologies, we obtained relatively high correlations among trees of the two species, despite a relatively low number of samples and EPS was accordingly high. EPS is often used in dendroclimatology as a measure of variation in tree-ring widths (or other tree-ring proxies), which is common to all trees at a particular site. This may be regarded as a potential climate signal [41], or not, since there could be some other environmental factors that have a similar effect on tree growth as climate and would also result in a high common variation. In other words, having an EPS above the threshold doesn’t necessarily mean that we have a distinct climate signal in tree rings. With respect to the pine species in our study, the correlation between climate and TRW was better in the case of P. heldreichii than P. peuce, despite the fact that we had fewer trees in the P. heldreichii sample pool.
Another possible explanation for the weak climate signal in TRW is that the duration of cambium activity at the upper timber line could be very short and monthly data are too coarse to be useful for such a short growing period. Here, the use of daily data and new approaches, such as correlation with daily data in a moving window of variable length [48] or process-based models, such as the Vaganov–Shashkin model [49], would probably yield better results than correlations with monthly data. Both approaches have already been tested, either on a large dataset [50] or on a single tree species [49] and have shown promising results. However, none of them have been tested on P. peuce or P. heldreichii.
Both studied tree species have a low climate reconstruction potential in tree-ring widths. The climate signal in TRW is weak, temporally unstable, and the spatial outreach of the climate signal in TRW is short, limited only to the closest vicinity of the sampling locations.
4.3. Climate Signal in Stable Carbon Isotopes in Tree Rings
In contrast to the weak TRW climate signal in both studied species, the climate signal in our δ13C composite P. heldreichii and P. peuce chronology was stable in time and therefore potentially represents a better proxy for climate reconstruction.
The presented δ13C chronology is, to the best of our knowledge, the first stable carbon isotope chronology for endemic Balkan pines (P. heldreichii and P. peuce). Our composite P. heldreichii and P. peuce stable carbon isotope chronology has a similar climate signal in δ13C in tree-rings as δ13C chronologies from the Carpathians [21], Corsica [22,23], or the south-eastern Alps [24]. Even though our composite δ13C chronology correlates best with cloudiness, we decided to test a potential climate reconstruction model of summer temperatures, since the cloudiness dataset is short, with some missing data. Our δ13C chronology correlates best with combined July–August and June–August temperature. This corresponds to findings from other locations and for different conifer tree species (e.g., Larix decidua from the Alps, Pinus nigra from Corsica and Pinus cembra from the Carpathians). In contrast to this, there was less similarity in response between low elevation Q. robur and our δ13C chronology, which is mainly moisture limited [25]. A climate response to precipitation in our δ13C chronology was present, but not as strong as the response in Q. robur. Nevertheless, the response of high-elevation pines to precipitation was the highest in August, and for low-elevation Q. robur in June.
The importance of the newly developed δ13C chronology for high-elevation pines is not only in the fact that it is the first stable carbon isotope chronology for both endemic Balkan pines, but also because the number of available climate reconstructions in the region of the Western Balkans is relatively low. This can be improved by combining the δ13C larch chronology from the south-eastern Alps [24] and our δ13C pine chronology from Montenegro. Both δ13C chronologies showed the highest positive response within the same time period (JA and JJA) and the spatial extent of the two isotope chronologies is partially overlapping: the Larix decidua isotope chronology spatial extent in the south stretches to the center of the Balkans, while the northern extent of the Pinus composite isotope chronology stretches up to the north-western edge of the Balkans. The good spatial overlap of the two isotope chronologies represents potential to fill the gap in climate reconstructions in the Western Balkans [24] (Figure 9).
5. Conclusions
Two long chronologies for endemic, long-lived Balkan pines, Pinus heldreichii and Pinus peuce from two locations in Montenegro were constructed: a 443-year long P. heldreichii chronology covering the period 1571–2013 and a 493-year long P. peuce chronology covering the period 1521–2013.
The P. heldreichii chronology from the studied site Murina (Montenegro) cross-dates well with P. heldreichii chronologies from Albania, Kosovo, and Bosnia and Herzegovina, which makes it suitable for dating wooden constructions from the wider region of the chronology. The P. peuce chronology, on the other hand, does not match well with chronologies from not too distant sites in Albania and northern Macedonia and did not even match the P. heldreichii chronology from the nearby site Murina. P. peuce therefore has weak potential for dating wooden structures.
The climate signal in tree-ring widths (TRW) of both tree species is relatively weak to non-existent. In P. heldreichii TRW, we found only a weak climate signal in May and June temperature, which, when merged into the seasonal variable May–June, gave a weak but significant correlation of −0.31 (p < 0.05). We could not find any climate signal in P. peuce TRW. The temporal and spatial stability of the climate signal in P. heldreichii and P. peuce TRW chronologies was weak and limited only to the vicinity of the sampling locations.
We developed the first stable carbon isotope ratio chronology for endemic Balkan pines for the region of the Western Balkans and tested its potential for climate reconstruction. The best results were obtained when correlating the δ13C chronology with the July–August and June–August combinations of mean monthly temperature. Both combinations also passed all statistical tests that are commonly applied prior to climate reconstruction, i.e., RE, CE, and MSE.
Analysis of the temporal stability of selected seasonal variables (July–August and June–August mean monthly temperature) gave stable relationships with the δ13C chronology, without drastic climate signal loss. Analysis of the spatial outreach of the δ13C chronology compared with gridded meteorological data (July–August and June–August temperature) showed a very wide spatial outreach of both seasonal variables, with June–August having the broadest.
The δ13C chronology of endemic Balkan pines, P. peuce and P. heldreichii, was shown to be a reliable proxy for climate reconstructions of summer temperatures, while TRW chronologies of P. heldreichii could potentially be used for dating and provenience purposes.
Author Contributions
T.L.–wrote the paper, did all calculations related to tree-ring widths and partially stable carbon isotopes, did sampling in the field. P.H.–prepared samples for stable isotope analysis, performed the analysis and stable isotope calculations, prepared the draft of the δ13C part of the paper, helped revising and editing the manuscript. J.J.–prepared the draft of the paper, did sampling in the field and helped revising and editing the manuscript. All authors have read and agreed to the published version of the manuscript.
Funding
The authors acknowledge financial support from the Slovenian Research Agency (research core funding No. P4-0107 Program research group “Forest Biology, Ecology and Technology” at the Slovenian Forestry Institute and basic research projects J4-5519 “Paleoclimate data enhances drought prediction in the W Balkan Region”, J4-8216 “Mortality of lowland oak forests - consequence of lowering underground water or climate change?” and World Federation of Scientists, Slovenian Science Foundation (PH).
Conflicts of Interest
The authors declare no conflict of interest.
References
- Intergovernmental Panel on Climate Change. Climate Change 2007: The Physical Science Basis. Contribution of Working Group I to the Fourth Assessment Report of the Intergovernmental Panel on Climate Change; Solomon, S., Qin, D., Manning, M., Chen, Z., Marquis, M., Averyt, K.B., Tignor, M., Miller, H.L., Eds.; Cambridge University Press: Cambridge, UK, 2007. [Google Scholar]
- Matyas, C. Climate Change Imapcts on Forest Management in Eastern Europe and Central Asia—Dimensions, Impacts and Adaptation Policies; Food and Agricultural Organization of the United Nations: Rome, Italy, 2010. [Google Scholar]
- Bennett, K.D.; Tzedakis, P.C.; Willis, K.J. Quaternary Refugia of North European Trees. J. Biogeogr. 1991, 18, 103–115. [Google Scholar] [CrossRef]
- Médail, F.; Diadema, K. Glacial refugia influence plant diversity patterns in the Mediterranean Basin. J. Biogeogr. 2009, 36, 1333–1345. [Google Scholar] [CrossRef]
- Willis, K. The vegetational history of the Balkans. Quat. Sci. Rev. 1994, 13, 769–788. [Google Scholar] [CrossRef]
- Opała-Owczarek, M. Warm-season temperature reconstruction from high-elevation juniper tree rings over the past millennium in the Pamir region. Palaeogeogr. Palaeoclim. Palaeoecol. 2019, 532, 109248. [Google Scholar] [CrossRef]
- Corona, C.; Guiot, J.; Edouard, J.L.; Chalié, F.; Büntgen, U.; Nola, P.; Urbinati, C. Millennium-long summer temperature variations in the European Alps as reconstructed from tree rings. Clim. Past 2010, 6, 379–400. [Google Scholar] [CrossRef] [Green Version]
- Cerrato, R.; Salvatore, M.C.; Gunnarson, B.E.; Linderholm, H.W.; Carturan, L.; Brunetti, M.; De Blasi, F.; Baroni, C. A Pinus cembra L. tree-ring record for late spring to late summer temperature in the Rhaetian Alps, Italy. Dendrochronologia 2019, 53, 22–31. [Google Scholar] [CrossRef]
- Saulnier, M.; Corona, C.; Stoffel, M.; Guibal, F.; Edouard, J.-L. Climate-growth relationships in a Larix decidua Mill. network in the French Alps. Sci. Total. Environ. 2019, 664, 554–566. [Google Scholar] [CrossRef]
- Panayotov, M.; Bebi, P.; Trouet, V.; Yurukov, S. Climate signal in tree-ring chronologies of Pinus peuce and Pinus heldreichii from the Pirin Mountains in Bulgaria. Trees 2010, 24, 479–490. [Google Scholar] [CrossRef] [Green Version]
- Trouet, V.; Panayotov, M.; Ivanova, A.; Frank, D. A pan-European summer teleconnection mode recorded by a new temperature reconstruction from the northeastern Mediterranean (ad 1768–2008). Holocene 2012, 22, 887–898. [Google Scholar] [CrossRef]
- Panayotov, M.; Tsavkov, E.; Zhelev, P.; Yurukov, S.; Ivanova, A.; Russeva, M.; Todorova, Y.; Trouet, V. Tree ring and anatomical studies in Pinus heldreichii forests in Pirin mountains, Bulgaria. For. Ideas 2011, 17, 66–71. [Google Scholar]
- Scheithauer, J.; Grunewald, K.; Helle, G.; Guenther, B.; Koenig, J.; Gikov, A. Dednroecological studies on Bosnian Pine (Pirin Mtns., Bulgaria). In Proceedings of the TRACE 2008, Zakopane, Poland, 27–30 April 2008; pp. 142–150. [Google Scholar]
- Scheithauer, J.; Grunewald, K.; Helle, G.; Günther, B.; Gikov, A. Bosnian Pine (Pinus Heldreichii) as Geoarchive at the Timberline in the Pirin Mountains and on the Balkan Peninsula. Biotechnol. Biotechnol. Equip. 2014, 23, 96–99. [Google Scholar] [CrossRef]
- Bojaxhi, F.; Toromani, E. Spatial and temporal variation in Bosnian pine (Pinus heldreichii Christ.) growth due to climate in Kosovo. Int. J. Dev. Sustain. 2017, 6, 1–15. [Google Scholar]
- Bojaxhi, F.; Toromani, E. The Growth of Bosnian Pine (Pinus hedreichii Christ.) at Tree-Line Locations from Kosovo and its Response to Climate. South-East Eur. For. 2016, 7, 109–118. [Google Scholar] [CrossRef] [Green Version]
- Seim, A.; Büntgen, U.; Fonti, P.; Haska, H.; Herzig, F.; Tegel, W.; Trouet, V.; Treydte, K. Climate sensitivity of a millennium-long pine chronology from Albania. Clim. Res. 2012, 51, 217–228. [Google Scholar] [CrossRef]
- Seim, A.; Treydte, K.; Büntgen, U.; Esper, J.; Fonti, P.; Haska, H.; Herzig, F.; Tegel, W.; Faust, D. Exploring the potential of Pinus heldreichii Christ. for long-term climate reconstruction in Albania. In Proceedings of TRACE—Tree rings in Archaeology, Climatology and Ecology, Otočec, Slovenija, 16–19 April 2009; pp. 75–82. [Google Scholar]
- Klippel, L.; Krusic, P.J.; Brandes, R.; Hartl-Meier, C.; Trouet, V.; Meko, M.; Esper, J. High-elevation inter-site differences in Mount Smolikas tree-ring width data. Dendrochronologia 2017, 44, 164–173. [Google Scholar] [CrossRef]
- Konter, O.; Krusic, P.; Trouet, V.; Esper, J. Meet Adonis, Europe’s oldest dendrochronologically dated tree. Dendrochronologia 2017, 42. [Google Scholar] [CrossRef]
- Nagavciuc, V.; Kern, Z.; Ionita, M.; Hartl, C.; Konter, O.; Esper, J.; Popa, I. Climate signals in carbon and oxygen isotope ratios of Pinus cembra tree-ring cellulose from the Călimani Mountains, Romania. Int. J. Clim. 2019. [Google Scholar] [CrossRef]
- Szymczak, S.; Joachimski, M.M.; Brauning, A.; Hetzer, T.; Kuhlemann, J. A 560 yr summer temperature reconstruction for the Western Mediterranean basin based on stable carbon isotopes from Pinus nigra ssp. laricio (Corsica/France). Clim. Past Discuss. 2012, 8, 1737–1749. [Google Scholar] [CrossRef] [Green Version]
- Szymczak, S.; Joachimski, M.; Bräuning, A.; Hetzer, T.; Kuhlemann, J. Comparison of whole wood and cellulose carbon and oxygen isotope series from Pinus nigra ssp. laricio (Corsica/France). Dendrochronologia 2011, 29, 219–226. [Google Scholar] [CrossRef]
- Hafner, P.; McCarroll, D.; Robertson, I.; Loader, N.; Gagen, M.; Young, G.; Bale, R.; Sonninen, E.; Levanič, T. A 520 year record of summer sunshine for the eastern European Alps based on stable carbon isotopes in larch tree rings. Clim. Dyn. 2014, 43, 971–980. [Google Scholar] [CrossRef] [Green Version]
- Kern, Z.; Patkó, M.; Kázmér, M.; Fekete, J.; Kele, S.; Pályi, Z. Multiple tree-ring proxies (earlywood width, latewood width and δ13C) from pedunculate oak (Quercus robur L.), Hungary. Quat. Int. 2013, 293, 257–267. [Google Scholar] [CrossRef]
- Vendramin, G.G.; Fineschi, S.; Fady, B. EUFORGEN Technical Guidelines for genetic conservation and use for Bosnian pine (Pinus heldreichii); EUFORGENE c/o Biodiversity International: Rome, Italy, 2008; p. 6. [Google Scholar]
- Aleksandrov, A.H.; Andonovski, V. EUFORGEN Technical Guidelines for genetic conservation and use of Macedonian pine (Pinus peuce); EUFORGEN c/o Biodiversity International: Rome, Italy, 2011; p. 6. [Google Scholar]
- Brus, R. Dendrologija za gozdarje: University book, 2nd ed.; Biotechnical Faculty, Department for Forestry and Renewable Forest Resources: Ljubljana, Slovenia, 2008; p. 408. [Google Scholar]
- Mitchell, T.D.; Jones, P.D. An improved method of constructing a database of monthly climate observations and associated high-resolution grids. Int. J. Clim. 2005, 25, 693–712. [Google Scholar] [CrossRef]
- Levanič, T. Atrics—A New System for Image Acquisition in Dendrochronology. Tree-Ring Res. 2007, 63, 117–122. [Google Scholar] [CrossRef] [Green Version]
- Cook, E.R. A Time Series Analysis Approach to Tree-Ring Standardization; University of Arizona: Tucson, AZ, USA, 1985. [Google Scholar]
- Bunn, A.G. A dendrochronology program library in R (dplR). Dendrochronologia 2008, 26, 115–124. [Google Scholar] [CrossRef]
- Bunn, A.G. Statistical and visual crossdating in R using the dplR library. Dendrochronologia 2010, 28, 251–258. [Google Scholar] [CrossRef]
- Loader, N.J.; Robertson, I.; Barker, A.C.; Switsur, V.R.; Waterhouse, J.S. An improved technique for the batch processing of small wholewood samples to a-cellulose. Chem. Geol. 1997, 136, 313–317. [Google Scholar] [CrossRef]
- McCarroll, D.; Loader, N.J. Stable isotopes in tree rings. Quat. Sci. Rev. 2004, 23, 771–801. [Google Scholar] [CrossRef]
- McCarroll, D.; Gagen, M.H.; Loader, N.J.; Robertson, I.; Anchukaitis, K.J.; Los, S.; Young, G.H.; Jalkanen, R.; Kirchhefer, A.J.; Waterhouse, J.S. Correction of tree ring stable carbon isotope chronologies for changes in the carbon dioxide content of the atmosphere. Geochim. Et Cosmochim. Acta 2009, 73, 1539–1547. [Google Scholar] [CrossRef]
- Gagen, M.; McCarroll, D.; Loader, N.J.; Robertson, I.; Jalkanen, R.; Anchukaitis, K.J. Exorcising the ‘segment length curse’: summer temperature reconstruction since AD 1640 using non-detrended stable carbon isotope ratios from pine trees in northern Finland. Holocene 2007, 17, 435–446. [Google Scholar] [CrossRef]
- Gagen, M.; McCarroll, D.; Robertson, I.; Loader, N.J.; Jalkanen, R. Do tree ring δ13C series from Pinus sylvestris in northern Fennoscandia contain long-term non-climatic trends? Chem. Geol. 2008, 252, 42–51. [Google Scholar] [CrossRef]
- Loader, N.; Santillo, P.; Woodman-Ralph, J.; Rolfe, J.; Hall, M.; Gagen, M.; Robertson, I.; Wilson, R.; Froyd, C.; McCarroll, D. Multiple stable isotopes from oak trees in southwestern Scotland and the potential for stable isotope dendroclimatology in maritime climatic regions. Chem. Geol. 2008, 252, 62–71. [Google Scholar] [CrossRef]
- Young, G.H.; McCarroll, D.; Loader, N.J.; Kirchhefer, A.J. A 500-year record of summer near-ground solar radiation from tree-ring stable carbon isotopes. Holocene 2010, 20, 315–324. [Google Scholar] [CrossRef]
- Wigley, T.M.L.; Briffa, K.R.; Jones, P.D. On the Average Value of Correlated Time Series, with Applications in Dendroclimatology and Hydrometeorology. J. Clim. Appl. Meteorol. 1984, 23, 201–213. [Google Scholar] [CrossRef]
- Zang, C.; Biondi, F. Treeclim: An R package for the numerical calibration of proxy-climate relationships. Ecography 2015, 38, 431–436. [Google Scholar] [CrossRef]
- Van Oldenborgh, G.J.; Balmaseda, M.A.; Ferranti, L.; Stockdale, T.N.; Anderson, D.L.T. Evaluation of Atmospheric Fields from the ECMWF Seasonal Forecasts over a 15-Year Period. J. Clim. 2005, 18, 3250–3269. [Google Scholar] [CrossRef] [Green Version]
- Trouet, V.; Van Oldenborgh, G.J. KNMI Climate Explorer: A Web-Based Research Tool for High-Resolution Paleoclimatology. Tree-Ring Res. 2013, 69, 3–13. [Google Scholar] [CrossRef] [Green Version]
- North, G.B.; Biondi, F.; Bloomfield, P.; Christy, J.R.; Cuffey, K.M.; Dickinson, R.E.; Druffel, E.R.M.; Nychka, D. Surface Temperature Reconstructions for the last 2000 Years; National Academies Press: Washington, DC, USA, 2006; p. 160. [Google Scholar]
- Panayotov, M.; Yurukov, S. Tree ring chronology of Pinus peuce from the Pirin Mts and possibilities to use it for climate analysis. Phytol. Balc. 2007, 13, 313–320. [Google Scholar]
- Büntgen, U.; Frank, D.; Trouet, V.; Esper, J. Diverse climate sensitivity of Mediterranean tree-ring width and density. Trees-Struct. Funct. 2010, 24, 261–273. [Google Scholar] [CrossRef] [Green Version]
- Jevšenak, J.; Levanič, T.; Jernej, J.; Tom, L. dendroTools: R package for studying linear and nonlinear responses between tree-rings and daily environmental data. Dendrochronologia 2018, 48, 32–39. [Google Scholar] [CrossRef] [Green Version]
- Touchan, R.; Shishov, V.V.; Meko, D.M.; Nouiri, I.; Grachev, A. Process based model sheds light on climate sensitivity of Mediterranean tree-ring width. Biogeosciences 2012, 9, 965–972. [Google Scholar] [CrossRef] [Green Version]
- Jevšenak, J. Daily climate data reveal stronger climate-growth relationships for an extended European tree-ring network. Quat. Sci. Rev. 2019, 221, 221. [Google Scholar] [CrossRef]
Figure 1.
Locations of Hridsko and Murina sites (black triangles) with the species distribution range for P. peuce (blue) [27] and P. heldreichii (red) [26].

Figure 2.
Climate diagrams for the city of Plav (Montenegro) based on (A) data from the local meteorological station and (B) data from the CRU TS 3.24 gridded climate data for the period 1970–2015 (for comparison) and (C) for the entire period of gridded climate data—1901–2015.
Figure 2.
Climate diagrams for the city of Plav (Montenegro) based on (A) data from the local meteorological station and (B) data from the CRU TS 3.24 gridded climate data for the period 1970–2015 (for comparison) and (C) for the entire period of gridded climate data—1901–2015.

Figure 3.
Long tree-ring width chronologies for Pinus heldreichii and Pinus peuce. Vertical dashed lines indicate EPS > 0.85, (A) raw chronologies, (B) standardized chronologies and (C) number of tree-ring width series included in chronologies (P. heldreichii—black, P. peuce—grey).
Figure 3.
Long tree-ring width chronologies for Pinus heldreichii and Pinus peuce. Vertical dashed lines indicate EPS > 0.85, (A) raw chronologies, (B) standardized chronologies and (C) number of tree-ring width series included in chronologies (P. heldreichii—black, P. peuce—grey).

Figure 4.
Bootstrapped correlation between TRW and average monthly temperature and sum of precipitation for the period 1901–2013, from September prior to ring formation until October of the year of ring formation. The response in May–June (MJ) is presented at the right side of the graph (for P. heldreichii only). (A) response of Pinus heldreichii TRW to climate. (B) response of Pinus peuce TRW to climate. Significant correlations (p < 0.05) are indicated with larger markers.

Figure 5.
Stable carbon isotope ratio chronology of P. peuce and P. heldreichii (black and grey dotted line) and Pinus composite—composite chronology of P. peuce and P. heldreichii (solid black line).
Figure 5.
Stable carbon isotope ratio chronology of P. peuce and P. heldreichii (black and grey dotted line) and Pinus composite—composite chronology of P. peuce and P. heldreichii (solid black line).

Figure 6.
Bootstrapped correlation coefficients between average monthly meteorological variables (temperature, cloudiness, precipitation) and δ13C combined pine chronology for the period 1901–2013 (temperature and precipitation) and 1970–2013 (cloudiness). Significant correlations (p < 0.05) are indicated with larger markers. Months of the year prior to ring formation are written in lowercase and months of the year of ring formation in uppercase. Seasonal variables are denoted JA (July to August) and JJA (June to August).

Figure 7.
Temporal stability between δ13C Pinus chronology and June–August climate parameters, calculated as a 30-year moving correlation. Horizontal dashed line represents 95% probability threshold of the statistical significance of the Pearson’s correlation coefficient.
Figure 7.
Temporal stability between δ13C Pinus chronology and June–August climate parameters, calculated as a 30-year moving correlation. Horizontal dashed line represents 95% probability threshold of the statistical significance of the Pearson’s correlation coefficient.

Figure 8.
Spatial field correlation (p < 0.05) between CRU TS dataset summer temperature and δ13C composite Pinus chronology. (A,B) present the spatial field correlation with July–August and June–August cloudiness, respectively. (C,D) present the spatial field correlation with July–August and June–August temperature, respectively. (E,F) present the spatial field correlation with July–August and June–August precipitation, respectively.

Figure 9.
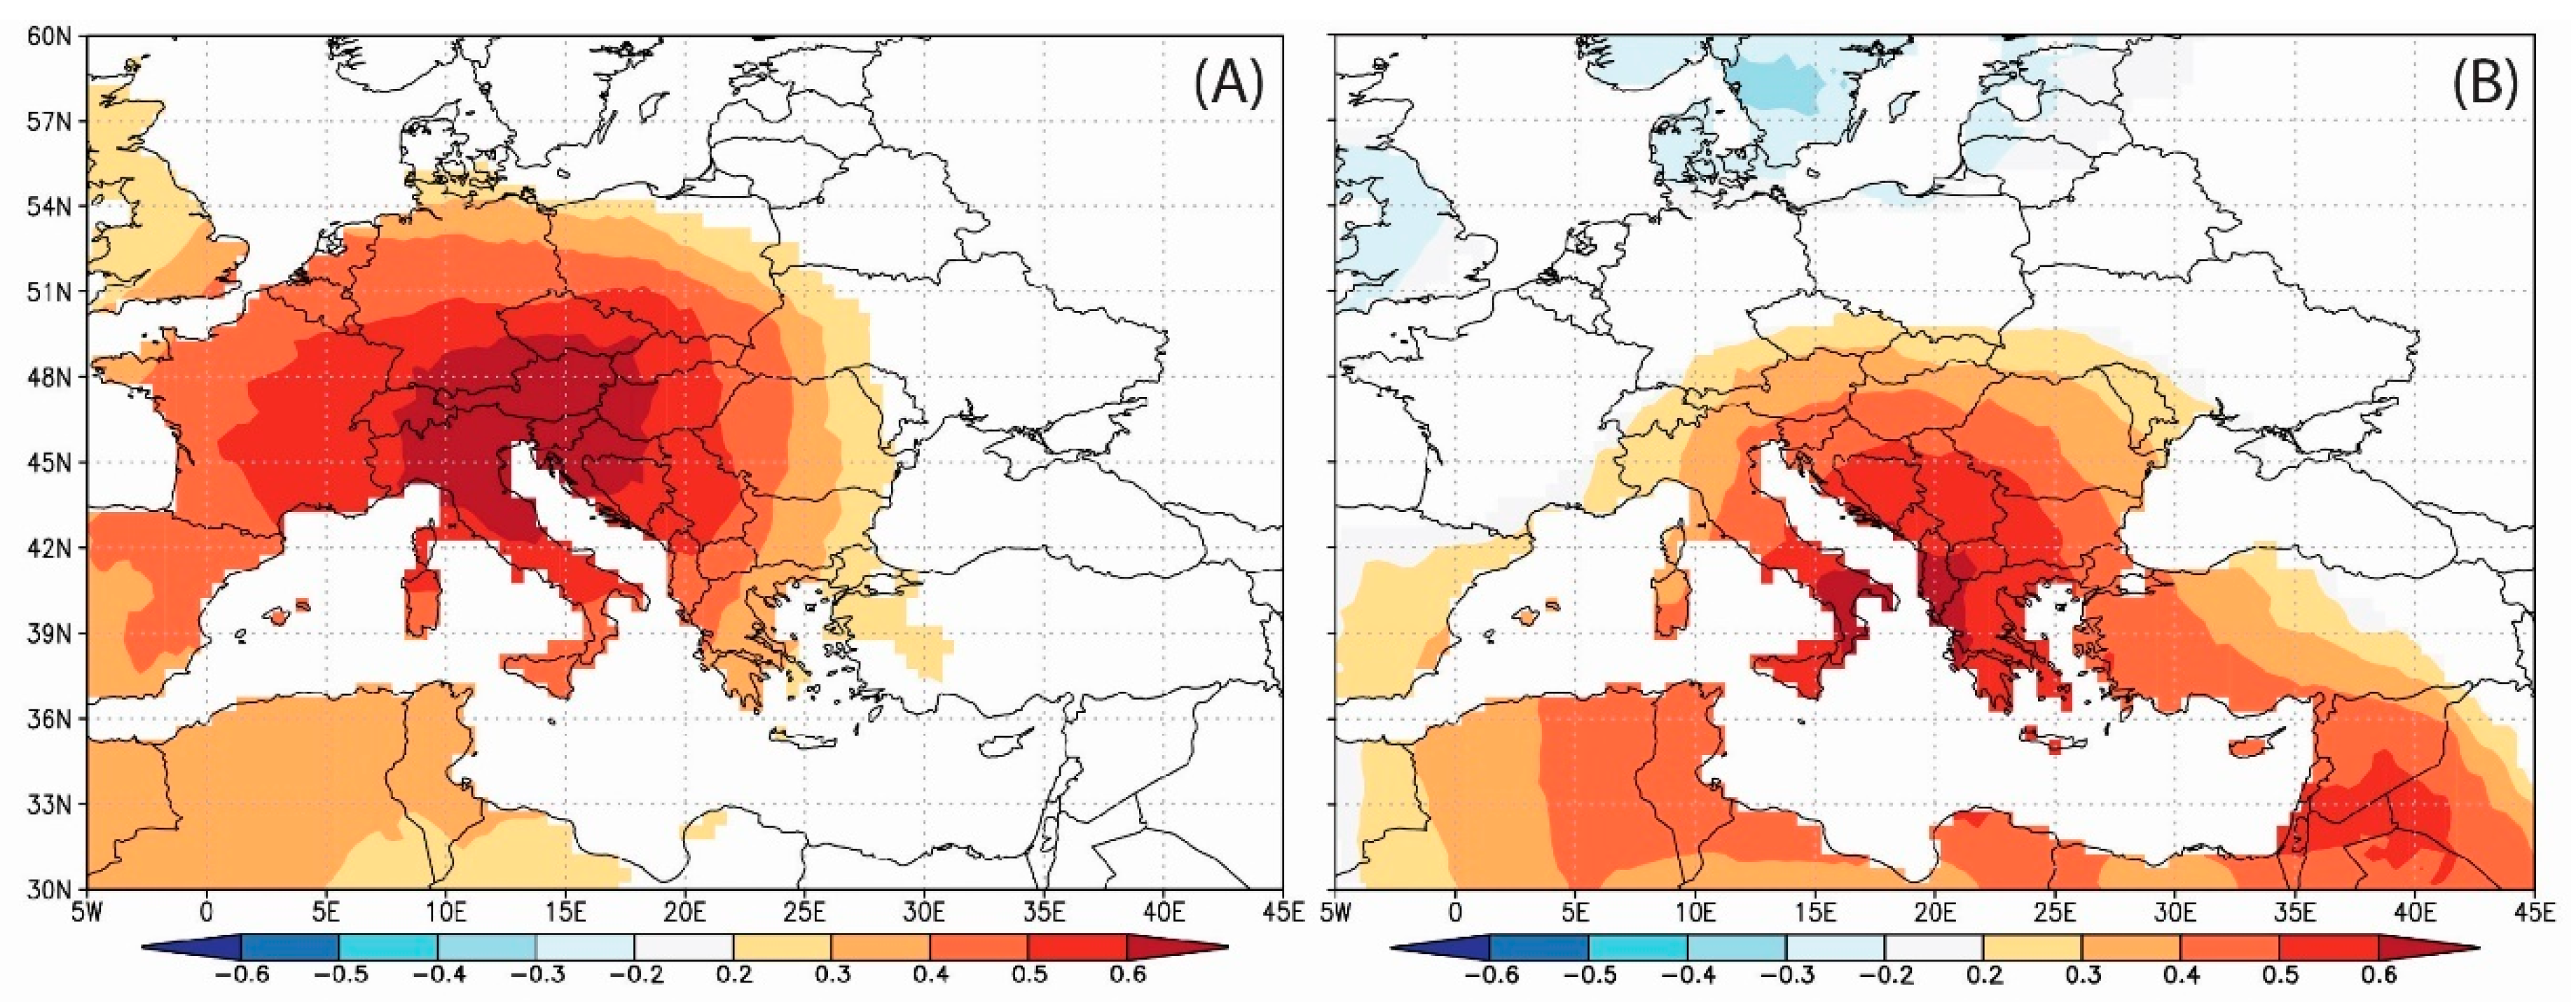
Spatial field correlation (p < 0.05) between (A) CRU TS dataset summer temperature (JA) and δ13C chronology of Larix decidua from the Alps for the period 1907–2006 [24] and (B) CRU TS dataset summer temperature (JA) and δ13C Pinus chronology from Montenegro for the period 1902–2013.
Figure 9.
Spatial field correlation (p < 0.05) between (A) CRU TS dataset summer temperature (JA) and δ13C chronology of Larix decidua from the Alps for the period 1907–2006 [24] and (B) CRU TS dataset summer temperature (JA) and δ13C Pinus chronology from Montenegro for the period 1902–2013.


Table 1.
Site characteristics and sample replication.
| Pinus Heldreichii | Pinus Peuce | |
|---|---|---|
| Local site name | Murina | Hridsko |
| Coordinates | N 42.57°, E 20.03° | N 42.63°, E 19.85° |
| Elevation | 1710 m | 1960 m |
| Slope | 40–50° | 10–40° |
| Exposition | W-NW | W-NW |
| Soil type | Brown soil on limestone | Acidic soil on ultrabasic |
| Number of cores for tree-ring analysis | 21 cores (11 trees) | 27 cores (16 trees) |
| Number of cores for δ13C | 6 cores (6 trees) | 9 cores (9 trees) |
Table 2.
Basic descriptive statistics for both TRW chronologies. RBAR was calculated as the average value of the 30-year moving RBAR for the period in which EPS ≥ 0.85.
Table 2.
Basic descriptive statistics for both TRW chronologies. RBAR was calculated as the average value of the 30-year moving RBAR for the period in which EPS ≥ 0.85.
| Parameter | Pinus Heldreichii | Pinus Peuce |
|---|---|---|
| EPS ≥ 0.85 | 1779 | 1833 |
| RBAR | 0.397 | 0.353 |
| SNR | 1.464 | 2.416 |
| Time period | 1571–2013 | 1521–2013 |
| Number of rings | 443 | 493 |
| Average TRW | 1.71 | 1.24 |
| Standard deviation | 0.82 | 0.56 |
| 1st order autocorrelation | 0.84 | 0.86 |
| Mean sensitivity | 0.17 | 0.17 |
Table 3.
Comparison of P. peuce and P. heldreichii chronologies from Montenegro with chronologies for the same species from Bosnia and Herzegovina (BIH), Albania (ALB), Kosovo (XKX), and North Macedonia (MKD). All chronologies for comparison are from the dendrochronological archive of the Slovenian Forestry Institute.
| Pinus peuce(Hridsko, MNE) | ||||
| Location | tBP | GLK% | Overlap | Time Period |
| Begova česma (MKD) | 0.60 | 54.20 | 189 | 1825–2014 |
| Lure (ALB) | 3.05 | 54.70 | 451 | 1100–1971 |
| Pinus heldreichii(Murina, MNE) | ||||
| Location | tBP | GLK% | Overlap | Time Period |
| Boričevac (BIH) | 5.89 | 71.20 | 172 | 1839–2010 |
| Prenj (BIH) | 9.99 | 66.60 | 438 | 1573–2010 |
| Šar planina (XKX) | 10.60 | 72.30 | 157 | 1857–2014 |
| Koritnik (XKX) | 6.28 | 70.60 | 182 | 1831–2012 |
| Streoške planine (XKX) | 15.50 | 71.20 | 274 | 1741–2014 |
| Prevalla (XKX) | 8.20 | 70.70 | 135 | 1879–2014 |
Table 4.
Measurement of the prediction skill of the linear model for temperature reconstruction using Pinus heldreichii tree-ring widths for two periods, 1902–1957 (verification) and 1958–2013 (calibration): squared correlation coefficient for the entire period of available climate data (r2), reduction of error (RE), coefficient of efficiency (CE), mean squared error (MSE).
| Seasonal variable | Entire Period | 1902–1957 | 1958–2013 | |||||
|---|---|---|---|---|---|---|---|---|
| r2 | RE | CE | MSE | RE | CE | MSE | ||
| TRW P. heldreichii | MJ | 0.097 | −0.065 | −0.315 | 1.6 | 0.009 | −0.18 | 1.767 |
Table 5.
Descriptive statistics: Expressed population signal (EPS) and average Pearson’s correlation coefficient (rBT) among individual trees included in δ13C chronologies from sites Murina (P. heldreichii) and Hridsko (P. peuce). Columns 2 and 3 (P. peuce and P. heldreichii) show statistical descriptors for each of the δ13C chronologies, the last column (4) shows descriptive statistics for the composite δ13C chronology (Pinus composite).
| P. Peuce | P. Heldreichii | Pinus Composite | |
|---|---|---|---|
| n | 5 | 6 | 11 |
| rBT | 0.31 | 0.37 | 0.33 |
| EPS | 0.69 | 0.78 | 0.84 |
| average | −22,3 | −21.9 | −22.1 |
| standard deviation | 0.40 | 0.47 | 0.41 |
| minimum | −23.2 | −22.8 | −22.9 |
| maximum | −21.3 | −20.8 | −21.0 |
Table 6.
Measurement of the prediction skill of the linear model for two combinations of seasonal variables for temperature reconstructions and for two periods, 1902–1957 (verification) and 1958–2013 (calibration), using the stable carbon isotope ratio in tree rings: squared correlation coefficient for the entire period of available climate data (r2), reduction of error (RE), coefficient of efficiency (CE), mean squared error (MSE).
| Seasonal | 1902–1957 | 1958–2013 | |||||
|---|---|---|---|---|---|---|---|
| Variable | r2 | RE | CE | MSE | RE | CE | MSE |
| JJA | 0.38 | 0.43 | 0.39 | 0.65 | 0.37 | 0.34 | 0.87 |
| JA | 0.37 | 0.31 | 0.29 | 0.96 | 0.40 | 0.39 | 1.03 |
© 2020 by the authors. Licensee MDPI, Basel, Switzerland. This article is an open access article distributed under the terms and conditions of the Creative Commons Attribution (CC BY) license (http://creativecommons.org/licenses/by/4.0/).
Share and Cite
MDPI and ACS Style
Levanič, T.; Jevšenak, J.; Hafner, P. Stable Isotopes Reveal Climate Signal Hidden in Tree Rings of Endemic Balkan Pines. Atmosphere 2020, 11, 135. https://0-doi-org.brum.beds.ac.uk/10.3390/atmos11020135
AMA Style
Levanič T, Jevšenak J, Hafner P. Stable Isotopes Reveal Climate Signal Hidden in Tree Rings of Endemic Balkan Pines. Atmosphere. 2020; 11(2):135. https://0-doi-org.brum.beds.ac.uk/10.3390/atmos11020135
Chicago/Turabian StyleLevanič, Tom, Jernej Jevšenak, and Polona Hafner. 2020. "Stable Isotopes Reveal Climate Signal Hidden in Tree Rings of Endemic Balkan Pines" Atmosphere 11, no. 2: 135. https://0-doi-org.brum.beds.ac.uk/10.3390/atmos11020135
Note that from the first issue of 2016, this journal uses article numbers instead of page numbers. See further details here.