Spatial Characteristics of Heat Extremes in South Korea from the Climatological Mean Perspective


1
Department of Earth Science Education, Kyungpook National University, 80, Daehak-ro, Buk-gu, Daegu 41566, Korea
2
Department of Earth Science Education, Chosun University, 309, Pilmun-daero, Dong-gu, Gwangju 61452, Korea
3
Exhibition Commentary Team, National Milyang Meteorological Science Museum, 84, Milyangdaegongwon-ro, Milyang-si, Gyeongsangnam-do 50420, Korea
4
Department of Earth Science Education, Chonnam National University, 77, Yongbong-ro, Buk-gu, Gwangju 61186, Korea
*
Author to whom correspondence should be addressed.
Atmosphere 2020, 11(3), 250; https://0-doi-org.brum.beds.ac.uk/10.3390/atmos11030250
Submission received: 17 January 2020
/
Revised: 27 February 2020
/
Accepted: 1 March 2020
/
Published: 2 March 2020
(This article belongs to the Special Issue Atmospheric Hazards)
Abstract
:We investigated the spatial characteristics of heat extremes in South Korea from the climatological mean perspective. A heat extreme was defined as a day when the daily maximum temperature was higher than 33 °C. According to our analyses, the eastern area of the Sobaek and Taebaek mountain ranges (hereafter called the eastern district) is significantly more exposed to heat extremes compared to other areas. The onset date and total number of days of annual heat extremes in the eastern district are approximately 13 days earlier and 3 days higher than those in the western district on average, respectively. Likewise, the annual mean of daily maximum temperatures during heat extreme days are approximately 0.25 °C higher. This larger exposure to heat extremes in the eastern district appears to be attributable to the Föhn phenomenon, which is likely induced by the dominant southwesterly monsoon during the early-to-peak summer. In contrast, differences in the ending dates of annual heat extremes are not noticeable between the eastern and western districts, when the southerly winds are dominant. Our analyses suggest that heat extremes in South Korea cannot be understood by a simple function of latitude, but in conjunction with atmospheric physical processes.
1. Introduction
Heat extremes bring extremely hot air into midlatitude and subtropical regions. Because of the vulnerability of living things to extreme weather conditions corresponding to climate change, heat extremes have inflicted an immense amount of suffering on human societies, resulting in several deaths worldwide [1]. It is important to examine and assess the characteristics of heat extremes, especially in relation to global warming. In 2003, the heat extremes that swept across Europe resulted in approximately 35,000 deaths [2,3]. Europe, especially Russia, also experienced an extremely hot summer accompanied by strong heat extremes in 2010 [4]. In East Asia, there was a total of more than 3000 deaths in South Korea because of a record-breaking heat extreme that occurred in 1994 [5], while a number of fatal heat extremes in 1998 [6], 2003 [6,7], and 2013 [8] had exceedingly adverse effects on several regions in China. With increasing global warming, heat extremes have tended to increase in their intensity and frequency [9,10].
In the 21st century, South Korea has already suffered from extremely hot summers twice, in 2016 and 2018, where 2125 (17) and 4526 (48) patients (deaths) with heat-related diseases were recorded, respectively [11]. These types of record-breaking hot summers will very likely increase in the future due to global warming [12]. The mortality due to heat extremes is also expected to increase, even in the fairly successful mitigation scenario, i.e., the Representative Concentration Pathway (RCP) 4.5 [13]. Hence, many previous studies regarding the heat extremes over South Korea have focused more on past and future changes of heat extremes, but less on the climatological mean [14]. They found that the expansion of the Tibetan high and the western North Pacific high is responsible for more frequent and stronger heat extremes across the country [15]. The warmer tropical sea surface temperature (SST) in the western Pacific was suggested as another reason. The warmer tropical SST can strengthen the local Hadley cell, enhancing the adiabatic warming in its downward branch and increasing temperatures in the mid-latitude [16]. The West Pacific subtropical high also plays a role in influencing the number of heat extremes [17].
In terms of human adaptive capacity, it is of equal importance to understand the climatological average, considering that the resistance against heat stress is possibly high in people living in hot regions. Although the mortality rate due to heat extremes can be affected by various factors, such as aging population, population density, and economic development [18,19], climatological distribution of heat extremes appears to be a significant factor in South Korea. The excessive mortality rates due to heat extremes for every 10 million people are higher in Gwangju than Daegu, even though the annual mean of the daily maximum temperature is lower in Gwangju [20]. Since the south is generally hotter, people simply guess that heat extremes are more serious in the southern region of South Korea from the climatological perspective. However, it has not been studied in detail whether this is true or not. Hence, we investigated the climatological pattern of heat extremes in South Korea. In addition, we suggest a possible mechanism of the climatological pattern of heat extremes.
2. Materials and Methods
A heat extreme was defined as the day when the daily maximum temperature was higher than 33 °C by reference to the heat wave warning standard of Korea Meteorological Administration (KMA). The KMA issues a heat wave warning when the daily maximum temperature exceeds 33 °C continuously for more than two days. In this study, however, the continuity was not considered for simplicity. For the detailed analysis, we utilized four types of indicators. Annual number of days with heat extremes and annual averages of daily maximum temperature during heat extreme days were applied, which are hereafter referred to as total heat days and heat strength, respectively. These indicators can measure how long extremes occur for and how strong they are in a certain region. The onset and ending dates of annual heat extremes were also used, which indicate the very first and last dates of heat extreme events in each year, respectively. Hereafter, they are called the onset and ending heat dates, respectively. These can represent how early and late heat extremes begin and end, respectively, at a certain place every year.
To calculate the climatological spatial pattern of each indicator mentioned above, the datasets from 52 weather stations over South Korea were utilized that cover the period 1973–2017. In a case that there was no heat extreme at a weather station in a year, it was considered as a missing value, and hence excluded in our calculation for climatological mean value at the station. Nevertheless, we have enough samples of heat extremes to calculate the climatological average for each station over the analysis period, since heat extremes have been recorded in most weather stations every year except for three years that were largely cooler than usual (i.e., 1980, 1993, and 2003). To consider possible oceanic effects on heat extremes, we classified the stations into two types: 31 inland and 21 coastal stations (red and blue dots in Figure 1, respectively). For weather stations located in an administrative district where there were coast lines, they were considered coastal stations. Note that the stations at islands were excluded from our analyses. Islands are strongly affected by the ocean; therefore, their climatological characteristics should be understood independently from the stations located in the Korean peninsula. Here, we are more focused on the climatological characteristics of heat extremes within the Korean peninsula.
For the analyses on the climatological large-scale circulation associated with heat extremes, daily reanalysis data of the National Centers for Environmental Prediction/National Center for Atmospheric Research (NCEP/NCAR) were employed [21]. In addition, it was necessary to define the fixed periods for onset, peak, and ending heat dates, respectively. Note that the peak date was defined as the day when the annual maximum of the daily maximum temperature occurred. Firstly, we calculated the temporal averages and standard deviations for the annual country-wide mean values of the onset, peak, and ending heat dates. Then, each period was defined as the date from the average minus the standard deviation to the average plus the standard deviation. Note that the distributions of all kinds of heat dates can be regarded as the normal distributions according to the Kolmogorov-Smirnov two-sample test. The Kolmogorov-Smirnov two-sample test can determine whether two samples come from the same distribution [22]. Here, we compared the distribution of each kind of heat date with an arbitrary distribution which was made by one hundred random samples with normal distribution. Average and standard deviation of the arbitrary distribution are equal to those of each kind of heat date for comparison. According to our definition, the periods of onset, peak, and ending dates are June 27th–July 20th, July 21st–August 10th, and August 5th–August 25th, respectively.
3. Results
To confirm whether heat extremes are more severe in the southern region of South Korea or not, the regression coefficients (rc) between latitudes and four climatological heat-related indicators of weather stations were calculated (Table 1). The negative regression coefficient between latitude and onset heat dates of each station is shown (rc = −2.49 days/degree), but it is not statistically significant at the 90% confidence level. Total heat days and heat strength also display statistically insignificant regression coefficients with their relationships to latitude (rc = −0.34 days/degree and +0.02 °C/degree, respectively). In contrast, the significant negative regression coefficient between latitude and ending heat dates at the 90% confidence level (rc = −1.63 days/degree) indicates that the ending heat dates are relatively early in the northern region compared to the southern one. This is consistent with the common assumption that the south is hotter than the north. Comprehensively, our results suggest that heat extremes in South Korea do not have a strong dependency on latitude, which differs from the common assumption of people.
The same analyses were separately performed for the inland and the coastal stations to obtain more detailed results (Table 1). According to the regression coefficients of the inland stations, heat extremes are relatively weak in the northern region compared to those of the southern one. Onset heat dates are late by 4.67 days for every degree of latitude further north. Total heat days and heat strength decrease by 3.13 days and 0.08 °C for every degree of latitude further north, respectively. Ending heat dates are early by 3.49 days for every degree further north. All of the regression coefficients are statistically significant at the 90% confidence levels. For the coastal stations, the regression coefficients of the four heat-related indicators exhibit different results from the inland stations. The significant negative regression coefficient for onset heat dates at the 90% confidence level (rc = −4.16 days/degree) implies that the onset heat dates are relatively early in the northern region, which is completely contrary to the common assumption. For total heat days and heat strength, the statistically insignificant relationships with latitude are shown (rc = +0.03 days/degree and +0.06 °C/degree, respectively). For ending heat dates, however, the regression coefficient is significantly negative at the 90% confidence level (rc = −1.45 days/degree), suggesting that latitude is important, particularly for ending heat dates for both inland and coastal stations.
According to our results, heat extremes are not likely solely dependent on latitude. Hence, we performed the same analyses, but for longitude (Table 1). Except for ending heat dates (rc = −0.59 days/degree), the indicators show statistically significant regression coefficients at the 90% confidence levels. Onset heat dates are early by 9 days for every degree further east. Total heat days and heat strength increase by 1.89 days and 0.15 °C, respectively, for every degree further east. For the analyses of inland only and coastal only cases, similar results are shown. Ending heat dates have statistically insignificant regression coefficients for both inland only and coastal only cases (rc = −0.38 days/degree and −0.84 days/degree, respectively). The other indicators, except for total heat days for the coastal stations, display statistically significant signals for both cases at the 90% confidence levels. Onset heat dates were earlier by 8.70 days and 8.51 days for every degree further east for the inland and coastal stations, respectively. Total heat days (heat strength) were found to rise by 3.06 days and 1.14 days (0.16 °C and 0.14 °C) for every degree further east for the inland and coastal stations, respectively. To figure out the relative importance of latitude and longitude in heat extremes, the multivariate linear regression was performed by using both latitude and longitude as the explanatory variables (Table 2). Only longitude shows statistically significant regression coefficients with 90% confidence for all heat-related indicators except for ending heat dates. Likewise, in terms of absolute magnitude, the coefficients of longitude are much larger than those of latitude. Hence, in South Korea, longitude appears to be a superior explanatory variable for heat extremes than latitude.
To better understand the climatological spatial patterns of heat extremes in South Korea, each indicator was plotted on a map (Figure 1). Onset heat dates are later for each degree further north, particularly for the inland stations. Additionally, onset heat dates are generally earlier in the eastern districts of the Sobaek and the Taebaek mountainous ranges. The differences are much more noticeable for the coastal stations than for the inland stations. The late onset heat dates along the south coast, together with the early onset heat dates along the eastern coast, appear to be a main factor in the negligible regression coefficient between latitudes and onset heat dates, as shown in Table 1. Similar spatial patterns were also observed for total heat days and heat strength. Both indicators were seen to become higher and stronger, respectively, for each degree further north. They are relatively higher and stronger in the eastern districts of the mountainous ranges than in the western districts. In contrast, ending heat dates are considerably early for each degree further north, but they do not exhibit noticeable differences between the western and eastern districts of the mountainous ranges. For a more objective interpretation, the weather stations were divided into two—the western and eastern stations of the Sobaek and Tabaek mountainous ranges—and then the difference between each indicator was calculated (Table 3). Except for heat strength in coastal stations, the statistically significant differences were found with 90% confidence. This strongly suggests that heat extremes are more severe in the eastern districts of the mountainous ranges than those in the western districts. We can infer that the Föhn phenomenon, which is likely associated with dominant southwesterly summer monsoon, might result in such climatological patterns of heat-related indicators. This hypothesis is further supported by the insignificant differences in ending heat dates between the western and eastern districts, which implies that the ending heat dates are possibly controlled by different mechanisms than the other three indicators.
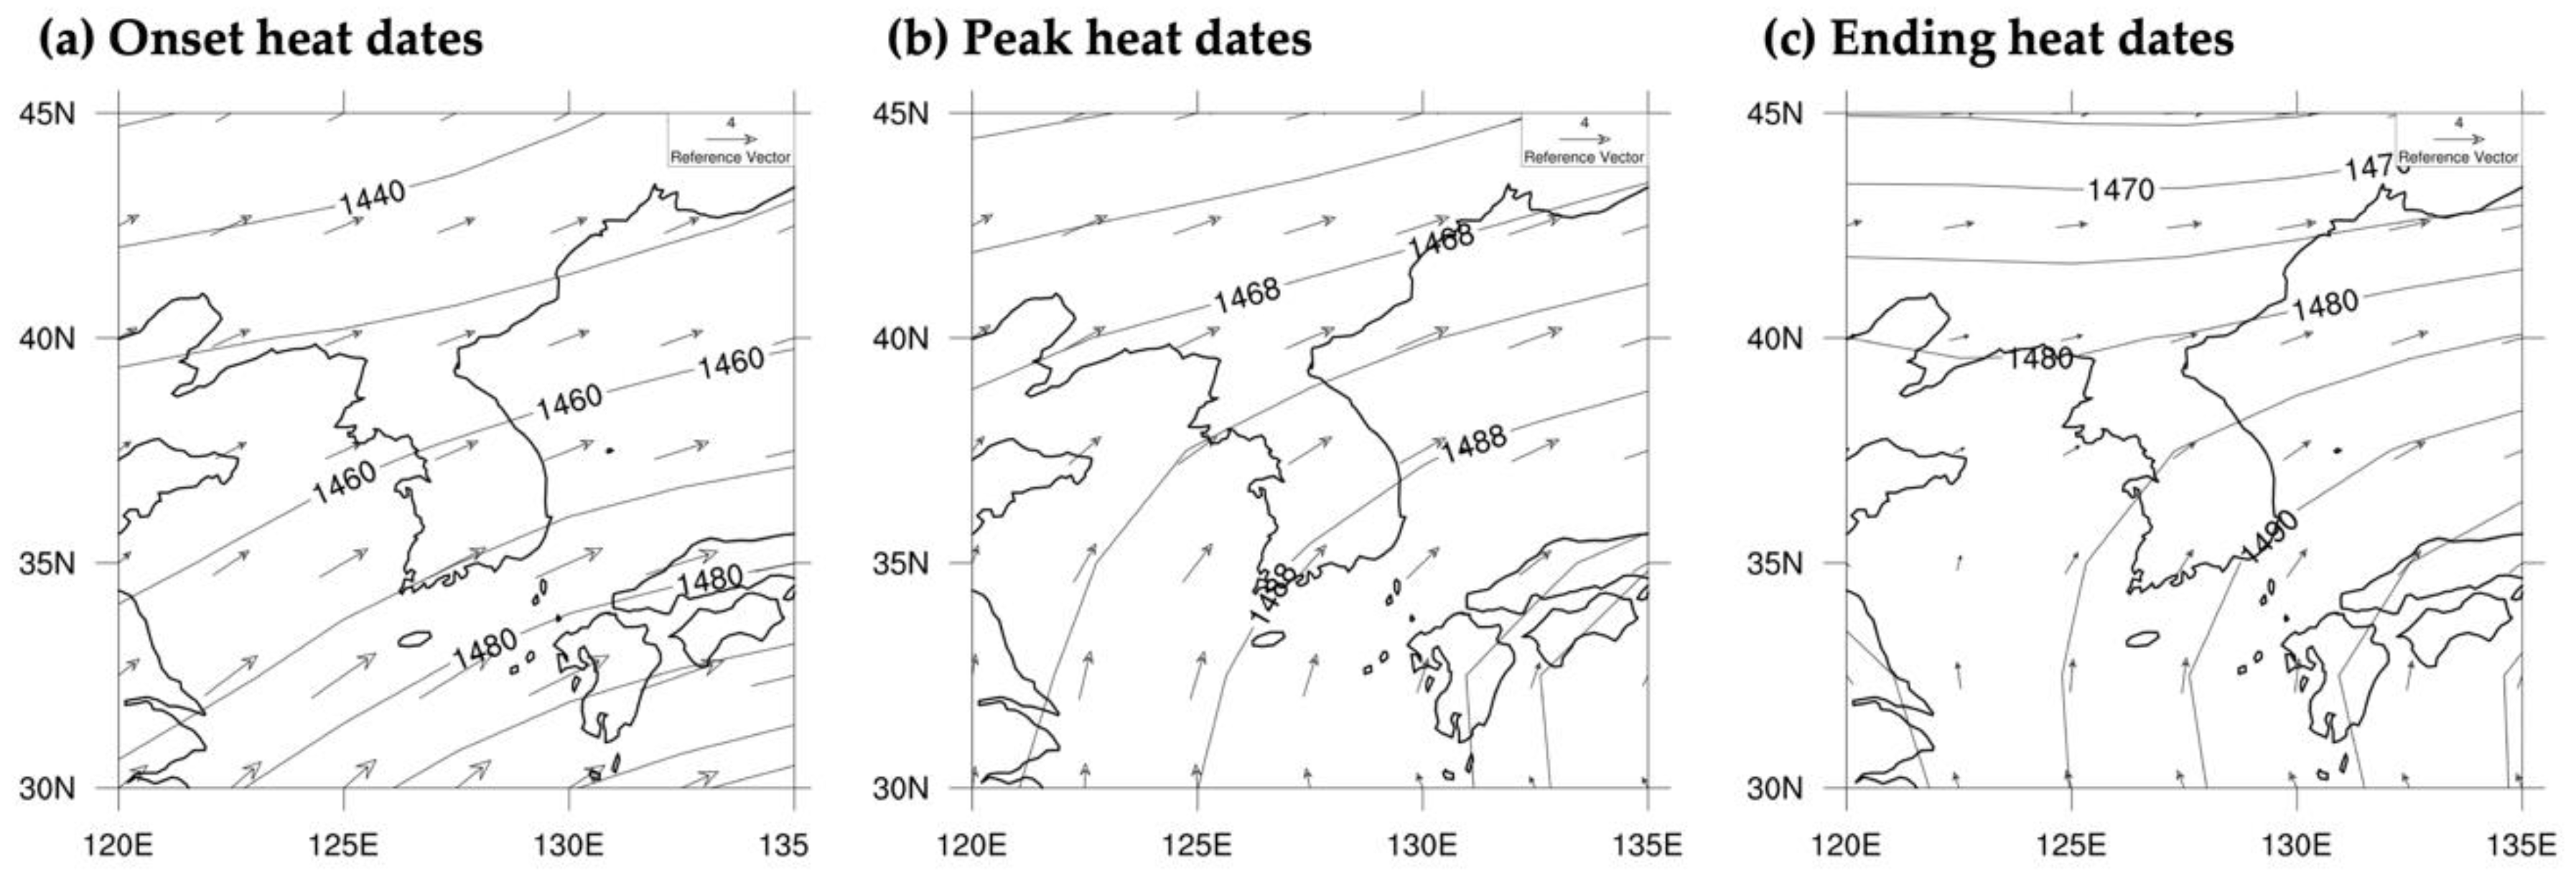
To confirm whether the Föhn phenomenon causes the climatological patterns of onset heat dates, total heat days, and heat strength, low-level large-scale circulations were plotted for the periods of onset, peak, and ending heat dates (Figure 2). Note that the three periods were defined in the Materials and Methods section. In both periods of onset and peak heat dates, southwesterly winds were found to prevail in the Korean peninsula. The dominant southwesterly winds can enhance precipitation in the western district of the Sobaek and the Taebaek mountain ranges through orographic lifting. This orographic precipitation dries the air when it reaches the eastern district from the western district by extracting water vapor from it. As shown in Table 4, in the western district, precipitation and relative humidity are significantly larger in value at the 90% confidence level than in the eastern district. This means that the air experiences the combination of dry and moist adiabatic cooling while climbing the western sides of the mountain ranges, but it experiences only dry adiabatic warming while going down the eastern sides. Consequently, the air should be hotter and drier in the eastern district than in the western district, resulting in the relatively early onset heat dates, large total heat days, and strong heat strength in the eastern district. In contrast, during the period of ending heat dates, the southerly component of southwesterly winds becomes dominant, which is ineffective for leading the orographic lifting effect along the Sobaek and the Taebaek mountains. In fact, differences in both of relative humidity and precipitation between the western and eastern districts are not statistically significant at the 90% confidence levels.
4. Summary and Discussion
Here, we examined the spatial characteristics of heat extremes in South Korea in terms of the climatological mean perspective, which has not been previously investigated in detail. Contrary to the common assumptions of people in the country, onset heat dates, total heat days, and heat strength are much stronger in the eastern districts of the Sobaek and the Tabaek mountain ranges than in the western districts. Onset heat dates, total heat days, and heat strength in the eastern districts were 13 days earlier, 3 days higher, and 0.25 °C higher than those in the western districts, respectively. Hence, the indicators are more likely dependent on longitude but not on latitude. The high dependence on longitude is attributable to the dominant southwesterly monsoon and orographic lifting effect by the mountain ranges which lie across the country in the south-north direction. This causes the Föhn phenomenon, making the air in the eastern district drier and hotter than the western district. In contrast, for the ending heat dates, no significant difference between the eastern and western districts was found because the predominant southerly winds cannot effectively cause the orographic lifting effect across the mountain ranges.
Our analyses suggest that heat extremes in South Korea are not due to a simple function of latitude. Hence, this study highlights the necessity of in-depth analyses on heat extremes from the climatological mean perspective and provides information for a better adaptation plan against heat extremes. Our results also imply that future heat extremes in South Korea can be strongly affected by orography as well as wind field change. If a coarse-resolution model that cannot resolve a detailed orographic feature is used for the future projection of heat extremes, it may produce an inaccurate result with no consideration of the orographic effect in conjunction with wind field change. Therefore, this study highlights the necessity of high-resolution models which can accurately simulate the orographic effect when studying heat extremes over South Korea.
Author Contributions
Conceptualization, D.-S.R.P.; methodology, D.-S.R.P.; formal analysis, S.Y.; investigation, D.-S.R.P. and S.Y.; writing—original draft, D.-S.R.P., H.W.C.; writing—review and editing, D.-S.R.P. and T.-W.P.; visualization, S.Y.; supervision, D.-S.R.P. and T.-W.P.; project administration, D.-S.R.P. and T.-W.P.; funding acquisition, D.-S.R.P. and T.-W.P. All authors have read and agreed to the published version of the manuscript.
Acknowledgments
This study was supported by the National Research Foundation of the Korean government (Grant NRF-2018R1D1A1B07041597) and the Korea Meteorological Administration Research and Development Program (Grant KMI2018-07010).
Conflicts of Interest
The authors declare no conflict of interest.
References
- Kunkel, K.E.; Pielke, R.A.; Changnon, S.A. Temporal fluctuations in weather and climate extremes that cause economic and human health impacts: A review. Bull. Am. Meteorol. Soc. 1999, 80, 1077–1098. [Google Scholar] [CrossRef] [Green Version]
- Larsen, J. Record Heat Wave in Europe Takes 35,000 Lives: Far Greater Losses May Lie Ahead; Earth Policy Institute: Washington, DC, USA, 2003; Volume 9. [Google Scholar]
- Stott, P.A.; Stone, D.A.; Allen, M.R. Human contribution to the European heatwave of 2003. Nature 2004, 432, 610–614. [Google Scholar] [CrossRef] [PubMed]
- Bariopedro, D.; Fischer, E.M.; Luterbacher, J.; Trigo, R.M.; Garcia-Herrera, R. The hot summer of 2010: Redrawing the temperature record map of Europe. Science 2011, 332, 220–224. [Google Scholar] [CrossRef] [PubMed] [Green Version]
- Kysely, R.D.; Kim, J. Mortality during heat waves in South Korea, 1991 to 2005: How exceptional was the 1994 heat wave? Clim. Res. 2009, 38, 105–116. [Google Scholar] [CrossRef] [Green Version]
- Tan, J.; Zheng, Y.; Song, G.; Kalkstein, L.S.; Kalkstein, A.J.; Tang, X. Heat wave impacts on mortality in Shanghai, 1998 and 2003. Int. J. Biometeor. 2007, 51, 193–200. [Google Scholar] [CrossRef]
- Huang, W.; Kan, H.; Kovats, S. The impact of the 2003 heat wave on mortality in Shanghai, China. Sci. Total Environ. 2020, 408, 2418–2420. [Google Scholar] [CrossRef]
- Sun, X.; Sun, Q.; Zhou, X.; Li, X.; Yang, M.; Yu, A.; Geng, F. Heat wave impact on mortality in Pudong New Area, China in 2013. Sci. Total Environ. 2020, 493, 789–794. [Google Scholar] [CrossRef] [PubMed]
- Meehl, G.A.; Tebaldi, C. More intense, more frequent, and longer lasting heat waves in the 21st century. Science 2004, 305, 994–997. [Google Scholar] [CrossRef] [Green Version]
- Trenberth, K.E.; Fasullo, J.T. Climate extremes and climate change: The Russian heat wave and other climate extreme of 2010. J. Geophys. Res.-Atmos. 2012, 117. [Google Scholar] [CrossRef]
- Korea Meteorological Administration Global Atmosphere Watch. Available online: https://www.climate.go.kr/home/bbs/list.php?code=93&bname=abnormal (accessed on 8 January 2020).
- Min, S.-K.; Son, S.-W.; Seo, K.-W.; Kug, J.-S.; An, S.-I.; Choi, Y.-S.; Jeong, J.-H.; Kim, B.-M.; Kim, J.-W.; Kim, Y.-H.; et al. Change in Waether and Climate Extremes over Korea and Possible Causes: A Review. Asia-Pac. J. Atmos. Sci. 2015, 51, 103–121. [Google Scholar] [CrossRef]
- Kim, D.-W.; Deo, R.C.; Chung, J.-H.; Lee, J.-S. Projection of heat wave mortality related to climate change in Korea. Nat. Hazards 2016, 80, 623–627. [Google Scholar] [CrossRef]
- Ho, C.-H.; Park, T.-W.; Jun, S.-Y.; Lee, M.-H.; Park, C.-H.; Kim, J.; Lee, S.-J.; Hong, Y.-D.; Song, C.-K.; Lee, J.-B. A Projection of Extreme Climate Events in the 21st Century over East Asia Using the Community Climate System Model 3. Asia-Pac. J. Atmos. Sci. 2011, 47, 329–344. [Google Scholar] [CrossRef]
- Park, C.K.; Schubert, S.D. On the nature of the 1994 East Asian summer drought. J. Clim. 1997, 10, 1056–1070. [Google Scholar] [CrossRef]
- Nitta, T. Convective activities in the tropical western Pacific and their impact on the Northern Hemisphere summer circulation. J. Meteor. Soc. Jpn. 1987, 65, 373–390. [Google Scholar] [CrossRef] [Green Version]
- Liu, Q.; Zhou, T.; Mao, H.; Fu, C. Decadal Variations in the Relationship between the Western Pacific Subtropical High and Summer Heat Waves in East China. J. Clim. 2019, 32, 1627–1640. [Google Scholar] [CrossRef]
- Kalkstein, L.S. A new approach to evaluate the impact of climate on human mortality. Environ. Health Persp. 1991, 96, 145–150. [Google Scholar] [CrossRef] [PubMed]
- Kalkstein, L.S.; Davis, R.E. Weather and human mortality: An evaluation of demographic and interregional responses in the United States. Ann. Assoc. Am. Geogr. 1989, 79, 44–64. [Google Scholar] [CrossRef]
- Kim, J.; Lee, D.-G.; Park, I.-S.; Choi, B.-C.; Kim, J.-S. Influences of Heat Waves on Daily Mortality in South Korea. Atmosphere 2006, 16, 269–278. [Google Scholar]
- Kalnay, E.; Kanamitsu, M.; Kistler, R.; Collins, W.; Deaven, D.; Gandin, L.; Iredell, M.; Saha, S.; White, G.; Woollen, J.; et al. The NCEP/NCAR 40-Year Reanalysis Project. Bull. Am. Meteor. Soc. 1996, 77, 437–472. [Google Scholar] [CrossRef] [Green Version]
- Hollander, M.; Wolfe, D.A.; Chicken, E. Nonparametric Statistical Methods, 3rd ed.; Wiley: Hoboken, NJ, USA, 2013; pp. 190–200. [Google Scholar]
Figure 1.
Climatological means of (a) onset heat dates (Julian days), (b) total heat days (days), (c) heat strength (°C), and (d) ending heat dates (Julian days). The red and blue dots indicate inland and coastal stations, respectively. The size of each circle shows the value of each heat-related indicator over the weather stations; refer the legend below each map. “x” in the legend means each relevant indicator. The green shading represents the altitude of the topography: brighter green indicates a higher altitude. Black thick lines indicate the Sobaek and the Tabaek mountain ranges from the left in order.

Figure 2.
Climatological patterns of 850-hPa geopotential height (m) and wind vectors (m s−1) for the periods of (a) onset heat dates, (b) peak heat dates, and (c) ending heat dates.
Figure 2.
Climatological patterns of 850-hPa geopotential height (m) and wind vectors (m s−1) for the periods of (a) onset heat dates, (b) peak heat dates, and (c) ending heat dates.


Table 1.
The regression coefficients of onset heat dates, total heat days, heat strength, and ending heat dates with the latitudes and the longitudes in cases of all, inland only, and coastal only stations.
Table 1.
The regression coefficients of onset heat dates, total heat days, heat strength, and ending heat dates with the latitudes and the longitudes in cases of all, inland only, and coastal only stations.
| Onset Heat Dates (Days/Degree) | Total Heat Days (Days/Degree) | Heat Strength (°C/Degree) | Ending Heat Dates (Days/Degree) | |||||||||
|---|---|---|---|---|---|---|---|---|---|---|---|---|
| All | Inland Only | Coastal Only | All | Inland Only | Coastal Only | All | Inland Only | Coastal Only | All | Inland Only | Coastal Only | |
| Latitudes | −2.49 | 4.67 * | −4.16 * | −0.34 | −3.13 * | +0.03 | +0.02 | −0.08 * | +0.06 | −1.63 * | −3.49 * | −1.45 * |
| Longitudes | −9.00 * | −8.70 * | −8.51 * | +1.89 * | +3.06 * | +1.14 | +0.15 * | +0.16 * | +0.14 * | −0.59 | −0.38 | −0.84 |
* The coefficient is statistically significant at the 90% confidence level based on the Student’s t-test.
Table 2.
The regression coefficients of onset heat dates, total heat days, heat strength, and ending heat dates with the latitudes and the longitudes.
Table 2.
The regression coefficients of onset heat dates, total heat days, heat strength, and ending heat dates with the latitudes and the longitudes.
| Onset Heat Dates (Days/Degree) | Total Heat Days (days/Degree) | Heat Strength (°C/Degree) | Ending Heat Dates (Days/Degree) | |
|---|---|---|---|---|
| Latitudes | −1.66 | −0.73 | +0.002 | −1.59 * |
| Longitudes | −8.76 * | +1.79 * | +0.15 * | −0.37 |
* The coefficient is statistically significant at the 90% confidence level based on the Student’s t-test.
Table 3.
The differences between onset heat dates, total heat days, heat strength, and ending heat dates of the eastern and western districts of the Sobaek and the Taebaek mountain ranges in cases of all, inland only, and coastal only stations. Note that the differences were calculated by the values of the eastern districts minus those of the western districts.
| Onset Heat Dates (Days) | Total Heat Days (Days) | Heat Strength (°C) | Ending Heat Dates (Days) | ||||||||
|---|---|---|---|---|---|---|---|---|---|---|---|
| All | Inland Only | Coastal Only | All | Inland Only | Coastal Only | All | Inland Only | Coastal Only | All | Inland Only | Coastal Only |
| −13.02 * | −13.11 * | −15.76 * | +3.40 * | +5.84 * | +1.53 | +0.25 * | +0.27 * | +0.20 * | +0.74 | +2.89 | −1.84 |
* The coefficient is statistically significant at the 90% confidence level based on the Student’s t-test.
Table 4.
The differences in precipitation and relative humidity for the periods of onset, peak, and ending heat dates between the eastern and western districts of the Sobaek and the Taebaek mountain ranges. Note that the differences were calculated by subtracting the values of the eastern districts from those of the western districts.
| Period of Onset Heat Dates | Period of Peak Heat Dates | Period of Ending Heat Dates | |||||||
|---|---|---|---|---|---|---|---|---|---|
| Eastern District | Western District | Diff. | Eastern District | Western District | Diff. | Eastern District | Western District | Diff. | |
| Precipitation (mm) | 15.31 | 17.32 | −2.01 * | 13.86 | 16.23 | −2.37 * | 15.94 | 16.65 | −0.71 |
| Relative humidity (%) | 79.18 | 80.80 | −1.62 * | 77.87 | 79.76 | −1.89 * | 78.37 | 79.36 | −0.99 |
* The coefficient is statistically significant at the 90% confidence level based on the Student’s t-test.
© 2020 by the authors. Licensee MDPI, Basel, Switzerland. This article is an open access article distributed under the terms and conditions of the Creative Commons Attribution (CC BY) license (http://creativecommons.org/licenses/by/4.0/).
Share and Cite
MDPI and ACS Style
Park, D.-S.R.; Yang, S.; Cho, H.W.; Park, T.-W. Spatial Characteristics of Heat Extremes in South Korea from the Climatological Mean Perspective. Atmosphere 2020, 11, 250. https://0-doi-org.brum.beds.ac.uk/10.3390/atmos11030250
AMA Style
Park D-SR, Yang S, Cho HW, Park T-W. Spatial Characteristics of Heat Extremes in South Korea from the Climatological Mean Perspective. Atmosphere. 2020; 11(3):250. https://0-doi-org.brum.beds.ac.uk/10.3390/atmos11030250
Chicago/Turabian StylePark, Doo-Sun R., Suyeon Yang, Hyung Wook Cho, and Tae-Won Park. 2020. "Spatial Characteristics of Heat Extremes in South Korea from the Climatological Mean Perspective" Atmosphere 11, no. 3: 250. https://0-doi-org.brum.beds.ac.uk/10.3390/atmos11030250
Note that from the first issue of 2016, this journal uses article numbers instead of page numbers. See further details here.