Long-Term Characterization of Submicron Atmospheric Particles in an Urban Background Site in Southern Italy


Institute of Atmospheric Sciences and Climate, ISAC-CNR, S. P. Lecce-Monteroni Km 1.2, 73100 Lecce, Italy
*
Author to whom correspondence should be addressed.
Atmosphere 2020, 11(4), 334; https://0-doi-org.brum.beds.ac.uk/10.3390/atmos11040334
Submission received: 4 February 2020
/
Revised: 27 March 2020
/
Accepted: 27 March 2020
/
Published: 30 March 2020
(This article belongs to the Special Issue 10th Anniversary of Atmosphere: Air Quality)
Abstract
:Continuous measurements of particle number size distributions in the size range from 10 nm to 800 nm were performed from 2015 to 2019 at the ECO Environmental-Climate Observatory of Lecce (Global Atmosphere Watch Programme/Aerosol, Clouds and Trace Gases Research Infrastructure (GAW/ACTRIS) regional station). The main objectives of this work were to investigate the daily, weekly and seasonal trends of particle number concentrations and their dependence on meteorological parameters gathering information on potential sources. The highest total number concentrations were observed during autumn-winter with average values nearly twice as high as in summer. More than 52% of total particle number concentration consisted of Aitken mode (20 nm < particle diameter (Dp) < 100 nm) particles followed by accumulation (100 nm < Dp < 800 nm) and nucleation (10 nm < Dp < 20 nm) modes representing, respectively, 27% and 21% of particles. The total number concentration was usually significantly higher during workdays than during weekends/holidays in all years, showing a trend likely correlated with local traffic activities. The number concentration of each particle mode showed a characteristic daily variation that was different in cold and warm seasons. The highest concentrations of the Aitken and accumulation particle mode were observed in the morning and the late evening, during typical rush hour traffic times, highlighting that the two-particle size ranges are related, although there was significant variation in the number concentrations. The peak in the number concentrations of the nucleation mode observed in the midday of spring and summer can be attributed to the intensive formation of new particles from gaseous precursors. Based on Pearson coefficients between particle number concentrations and meteorological parameters, temperature, and wind speed had significant negative relationships with the Aitken and accumulation particle number concentrations, whereas relative humidity was positively correlated. No significant correlations were found for the nucleation particle number concentrations.
1. Introduction
In urban or urban-background environments, air quality could be impaired due to consistent emissions from anthropogenic activities that combined with natural sources and long-range transport of aerosols altogether contribute to producing high levels of pollution. Given the wide variability in the number and type of sources, the relative contribution to air pollution concentrations spans considerably from place to place. The number of particles with specific size present at a given site depends on many factors that include the origin of particles, atmospheric processes (condensation, nucleation, and evaporation), and chemical transformations [1]. The number concentration of submicron particles is not a metric included in European policies for air quality assessment; however, recent studies indicate that it has adverse health effects [2]. Therefore, it becomes more and more important to investigate the concentration levels, trends, sources, and dynamics, especially in urban and urban background areas [3].
Typically, aerosol number concentrations are lower in rural areas, ~103–104 cm−3, compared to urban agglomerations where number concentrations exceed 104 cm−3 [4]. In cities, submicron particles (particle diameter Dp < 1 µm) are present in very high number concentrations, more than 80% of total number [5,6,7], and the major contributing sources of these particles include vehicular exhausts [8], industrial emissions [9], biomass burning, and new particle formation [10].
As observed in many studies performed in European cities [11,12], particle number concentrations and size distributions show daily and seasonal behaviors that are strongly linked to local emission sources and meteorological factors. In winter, for example, the number concentration of submicron particles is higher than in summer due to the increase of emission sources, especially from biomass burning for domestic heating, and due to more stable atmospheric conditions. On the other hand, during warmer months, a high concentration of gaseous precursors and a more intense solar radiation can trigger the process of formation of new particles [13,14]. Literature studies [15,16] suggest that the aerosol number concentration represents a better indicator of climate and health effects of particulate compared to mass concentration. Owing to their small size and chemical/physical properties, these particles are involved in toxic and carcinogenic health effects and contribute, directly and indirectly, to anthropogenic climate change.
To date, only a few studies on long-term measurements of aerosol particle number and size distributions were performed in southern Italy. Long-term observations [17,18,19,20,21,22] allow getting robust statistics to better characterize the sources that affect a measurement site, in terms of number concentration and size, and provide insights into the processes controlling aerosol dynamics.
In this work, continuous measurements of the number size distribution over five years, from 2015 to 2019, were performed in an urban background area in Southern Italy. Located in the central Mediterranean, the site is influenced by a variety of aerosol types, sources, and transport pathways that allow the study of a wide range of processes and to characterize aerosol properties of a typical coastal area. To our knowledge, this is the first long-term study done in this area, to investigate trends of both aerosol number concentration and size distribution. The seasonal and daily patterns together with the behavior of the modal structure of aerosol particles during different periods of the year were analyzed. Correlation with local meteorological parameters were also used to interpret the dynamics of particles.
2. Experiments
2.1. Measurement Site
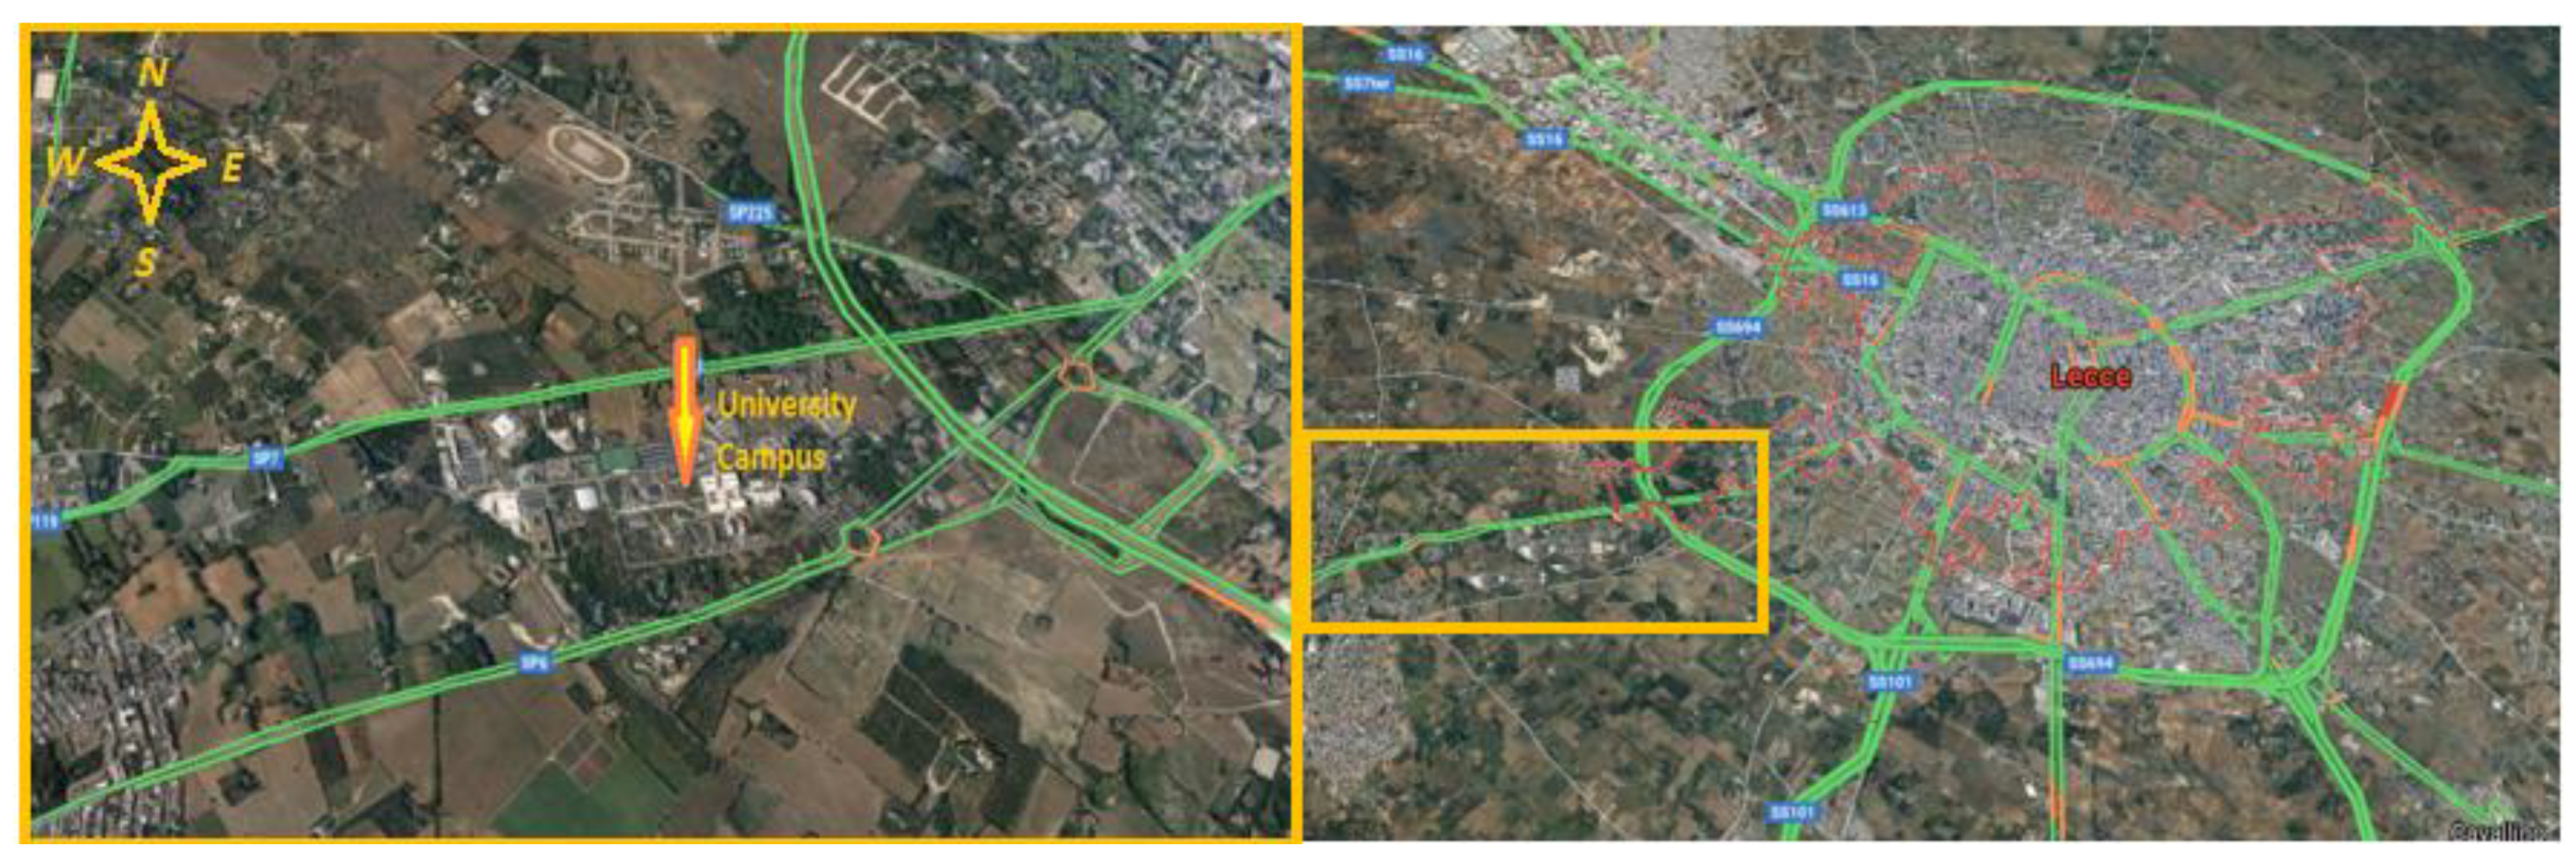
The measurements were conducted between January 2015 and October 2019 at Environmental-Climate Observatory of Lecce (ECO, 40°20′8″ N, 18°07′28″ E) that is part of GAW/ACTRIS Network. The observatory is located at the Institute of Atmospheric Sciences, Research National Council (ISAC-CNR), inside the University Campus, at about 13 m above ground level [23]. The site is at about 5 km SW of the town of Lecce, ~20 km away from the Adriatic and the Ionian Sea, 100 km away from the Balkan coast, and 800 km away from the Northern Africa coast. There is an important road ~500 m away from the site that, combined with on-road mobile source impact from traffic inside the campus, acts as sources of airborne particulates (Figure 1).
This area, considered an urban background site [24], is affected by the integrated contribution of local anthropogenic sources (mainly traffic and biomass burning) and by the long-range transport of natural (sea spray and desert dust) and anthropogenic dust from large industrial settlements located at distances between 30 and 80 km.
Therefore, its location in the heart of the Mediterranean is strategic to study chemical and physical characteristics of regional background conditions, and the measurements of atmospheric compounds carried out at the ECO can be considered representative of many Mediterranean background areas located near the coast.
2.2. Instrumentation
Particle number size distribution was measured by a Mobility Particle Size Spectrometer (MPSS), equipped with a differential mobility analyzer (DMA, length 28 cm) and a condensation particle counter (CPC, model: TSI 3772, TSI Inc., Rome, Italy). The instrument was designed and manufactured according to EUSAAR/ACTRIS recommendation at the Leibniz Institute for Tropospheric Research TROPOS [25]. Briefly, the system, after having aspirated air from an appositely developed PM10 inlet, dries the inlet flow below 40% relative humidity using a Perma Pure nafion dryer. After, the inlet flow containing aerosol passes a bipolar diffusion charger to bring the aerosol particle population into defined bipolar charge equilibrium [26]. Throughout a cylindrical differential mobility analyzer, particles are selected based on their electrical mobility and counted by a condensation particle counter that measures the resulting number concentrations in each of the selected size ranges [27]. The diffusion loss of the particles during the sample transport in the tubing and negatively charged particles were corrected according to a multiple charge correction routine proposed by [26]. Missing, incorrect, or incomplete scans were flagged using the flag list and recommendations published in [25]. Operational parameters like flows, high voltage, zero points, and size standards were checked and calibrated periodically. Each measurement was made in five minutes, covering a particle diameter range from 10 to 800 nm divided into forty channels.
During the sampling period, meteorological parameters were obtained from the continuous measurement performed at the ECO observatory. The weather data, ambient temperature, relative humidity (RH), wind speed, wind direction, and precipitation were collected simultaneously by a Vaisala WXT520 automatic weather station (Vaisala Oyj, Helsinki, Finland).
3. Results and Discussions
3.1. Overview of Particle Number Concentration
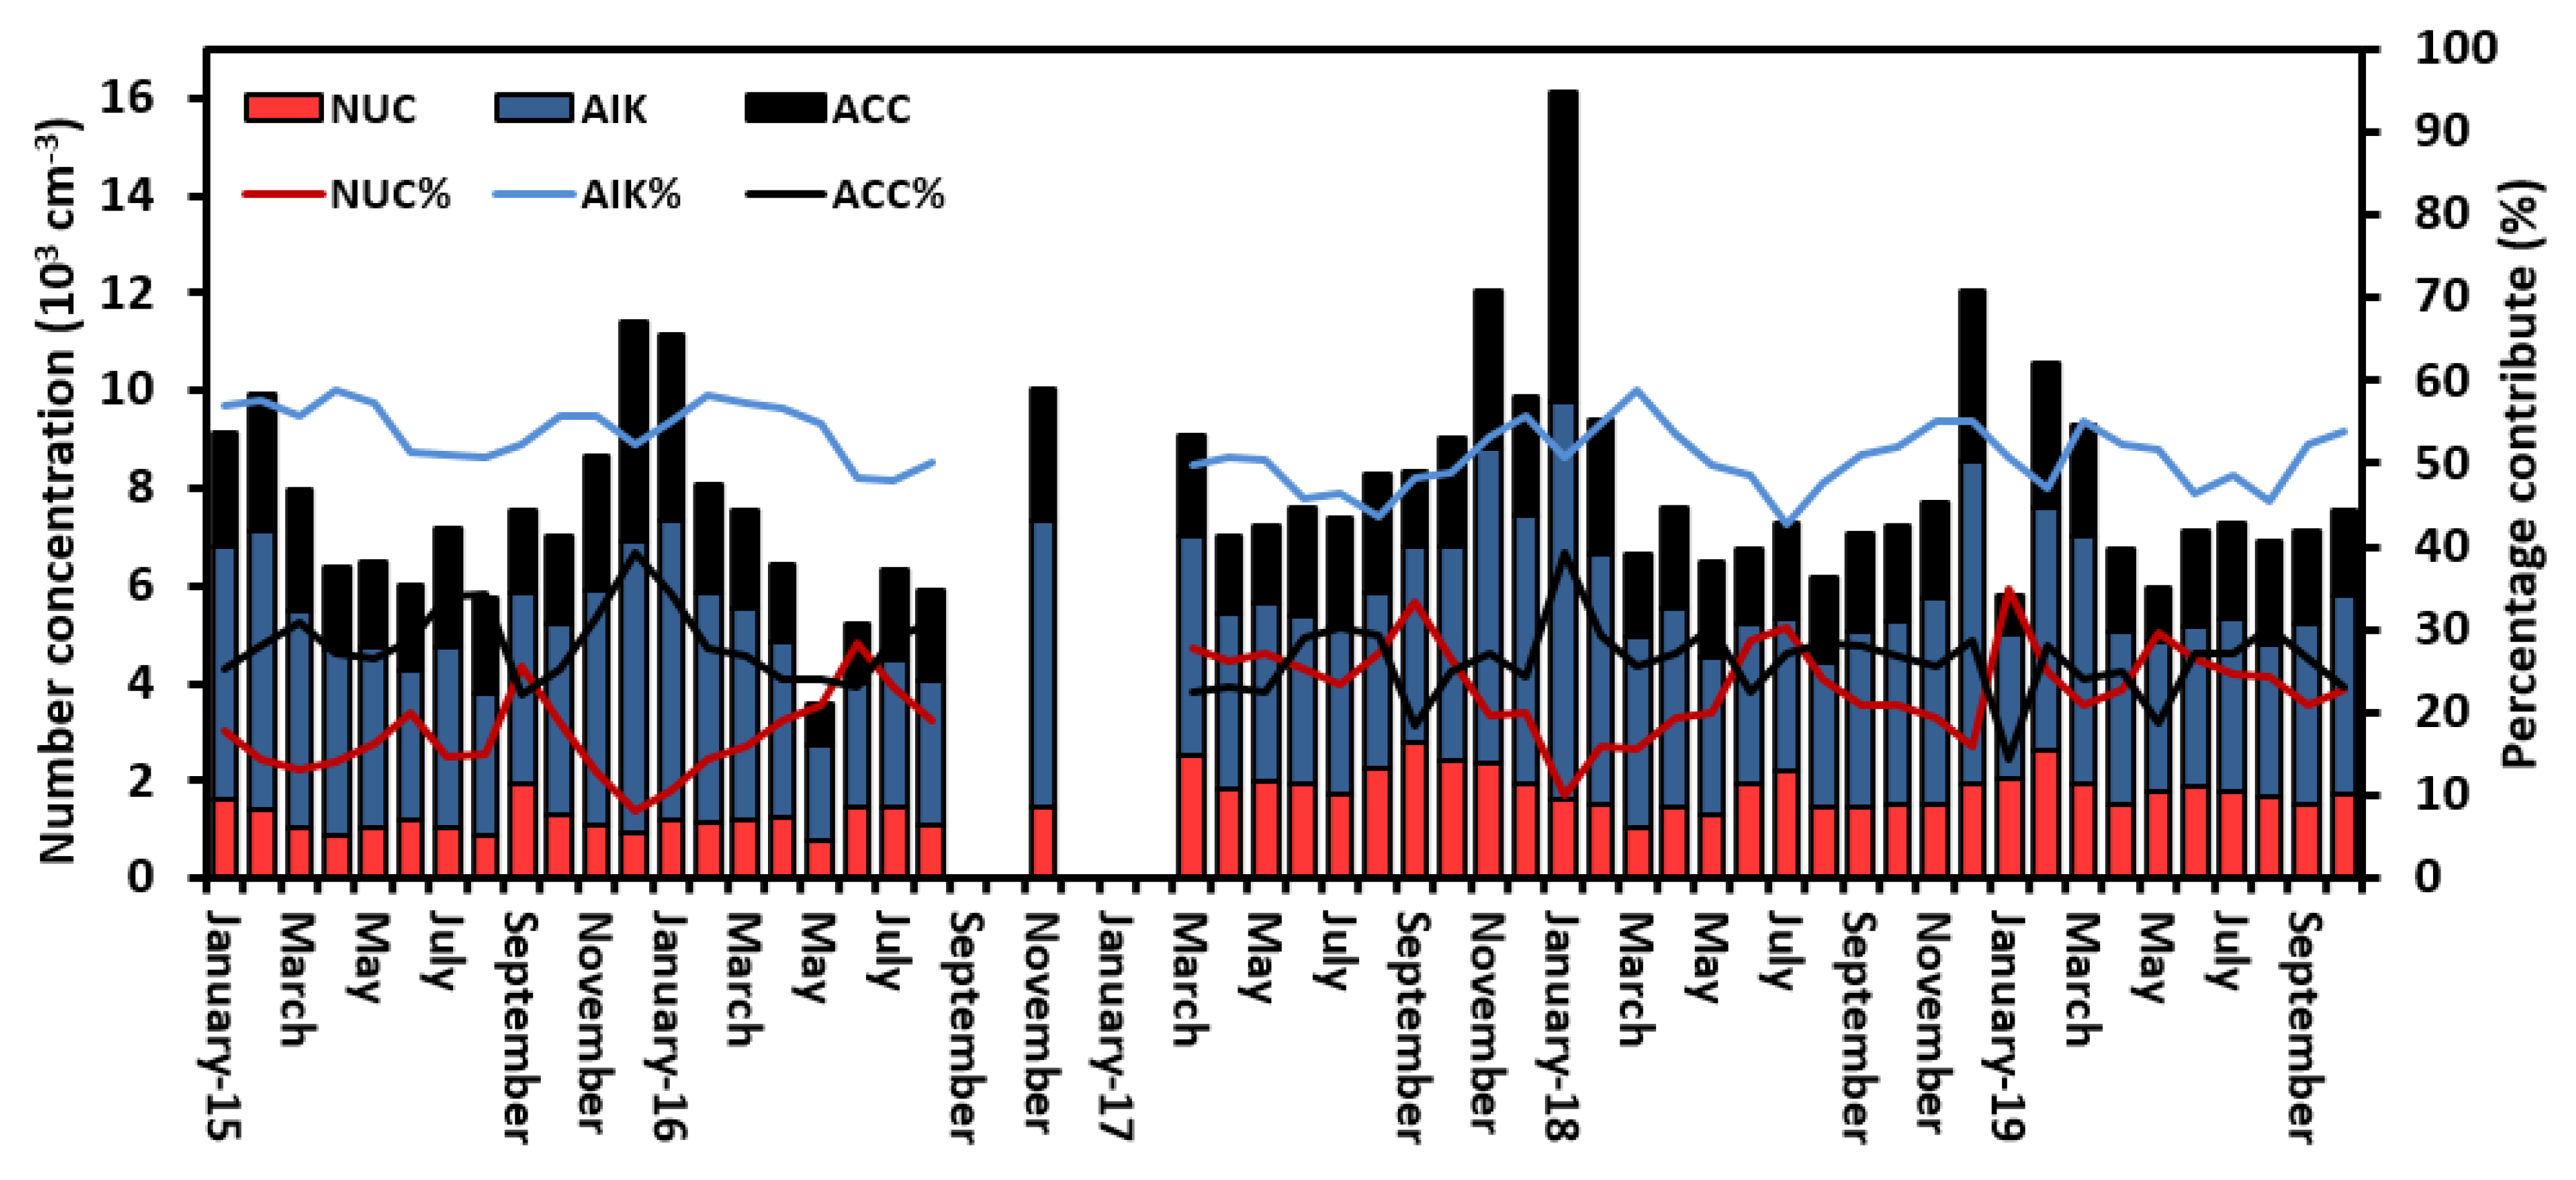
To investigate the contribution of the different size fractions, the measured particle number concentration (PNC) was divided into three classes, nucleation particle mode NNUC < 20 nm, Aitken particle mode 20 < NAIT < 100 nm, and accumulation particle mode 100 nm < NACC < 800 nm. The total particle number concentration, NTOT (10–800 nm), is the sum of the three modes. Yearly averages ± 1 standard deviation and medians with 25th and 75th percentiles were calculated and summarized in Table 1 for each size class. The yearly average and median values of NTOT, NACC, and NAIT do not show any noticeable inter-annual trend. Higher variability, about 50%, was instead observed on NNUC, probably because this fraction of particles is influenced not only by the primary emissions but also by other processes such as new particle formation when the ambient air conditions are favorable. During the study period, the number of concentrations exhibited monthly variability with several pronounced increases, as shown in Figure 2. Due to technical/maintenance problems with SMPS, measurements from late 2016 to early 2017 were not carried out, as shown in Figure 2 (missing data). The highest values of NTOT were recorded during cold months where the monthly averages varied from 12033 ± 9017 cm−3 to 8068 ± 6469 cm−3 between December and February respectively, while lower number concentrations, between 3577 ± 2451 cm−3 and 5730 ± 2954 cm−3, were measured between May and August. A similar trend was also observed in the accumulation and Aitken particle mode. Monthly averages of accumulation particles number concentrations ranged between 828 ± 626 cm−3 and 4500 ± 4029 cm−3 while Aitken mode number concentrations were higher than the other modes with values ranging between 1960 ± 1300 cm−3 and 8154 ± 5330 cm−3. A similar behavior, but less marked was observed for the nucleation particle mode with values between 860 cm−3 and 2780 cm−3.
In general, the differences in aerosol PNCs are a consequence of the seasonal effects that could be explained by the higher emissions and lower Planetary Boundary Layer (PBL) height during autumn-winter with respect to spring-summer. In particular, the higher number concentration of particles during cold months is related to the domestic use of wood/biomass burning for home heating, which represents a significant emission source in autumn-winter as shown in recent source apportionment results at this site [24]. Along with that, the reduction of the atmospheric boundary layer height and the greater atmospheric stability conditions, typical of the cold months, prevent the vertical dispersion of air pollutants that accumulate in the lower atmospheric layer with a consequent increase of particulate matter (PM) mass and number concentrations. The slightly higher levels of nucleation particles in warm periods are probably due to the higher frequency of new particle formation events, a feature observed in many other European sites [28]. The greater amount of biogenic precursor gases and higher photochemical activity, typical of this period of the year, together promote this process by explaining the higher frequency of events.
The different contributions of each size range to the total number and their different relationship offers, as a first-order approximation, some insight into the nature of particles (fresh or aged) and in the role of local sources. In this study, the Aitken particles mode were the main contributor to NTOT accounting for about 52% (43–59%) of it, followed by the accumulation and nucleation modes with 27% (14–39%) and 21% (8–35%), respectively, throughout the observation period. This result is in agreement with that observed by [29,30] who found that in urban areas, influenced mainly by traffic emissions, the total particle number is dominated by the Aitken modes. This is supported by the significant correlation r = 0.82 (Pearson’s correlation coefficients) found between the Aitken and accumulation particles mode, pointing out that the two particle classes could be related to the same sources and processes. The observation site is influenced by direct emission of vehicular activity, inside the Campus and along the nearby roads that, as well known, is an important source of ultrafine particles from 30 nm up to some hundred nanometers [31,32]. On the contrary, the low correlation, r = 0.15, between the Aitken and nucleation particle mode is indicative of their different origin and/or atmospheric processes.
3.2. Variability of Particle Number Size Distribution
The size distribution of ambient particles is usually characterized by different modes (i.e., nucleation, Aitken, accumulation, and coarse mode) each of which reflects the dominant processes giving rise to levels of ambient particles [15]. In this work, the analysis of number size distributions showed the existence of two modes: one in the Aitken size range and another in the nucleation size range.
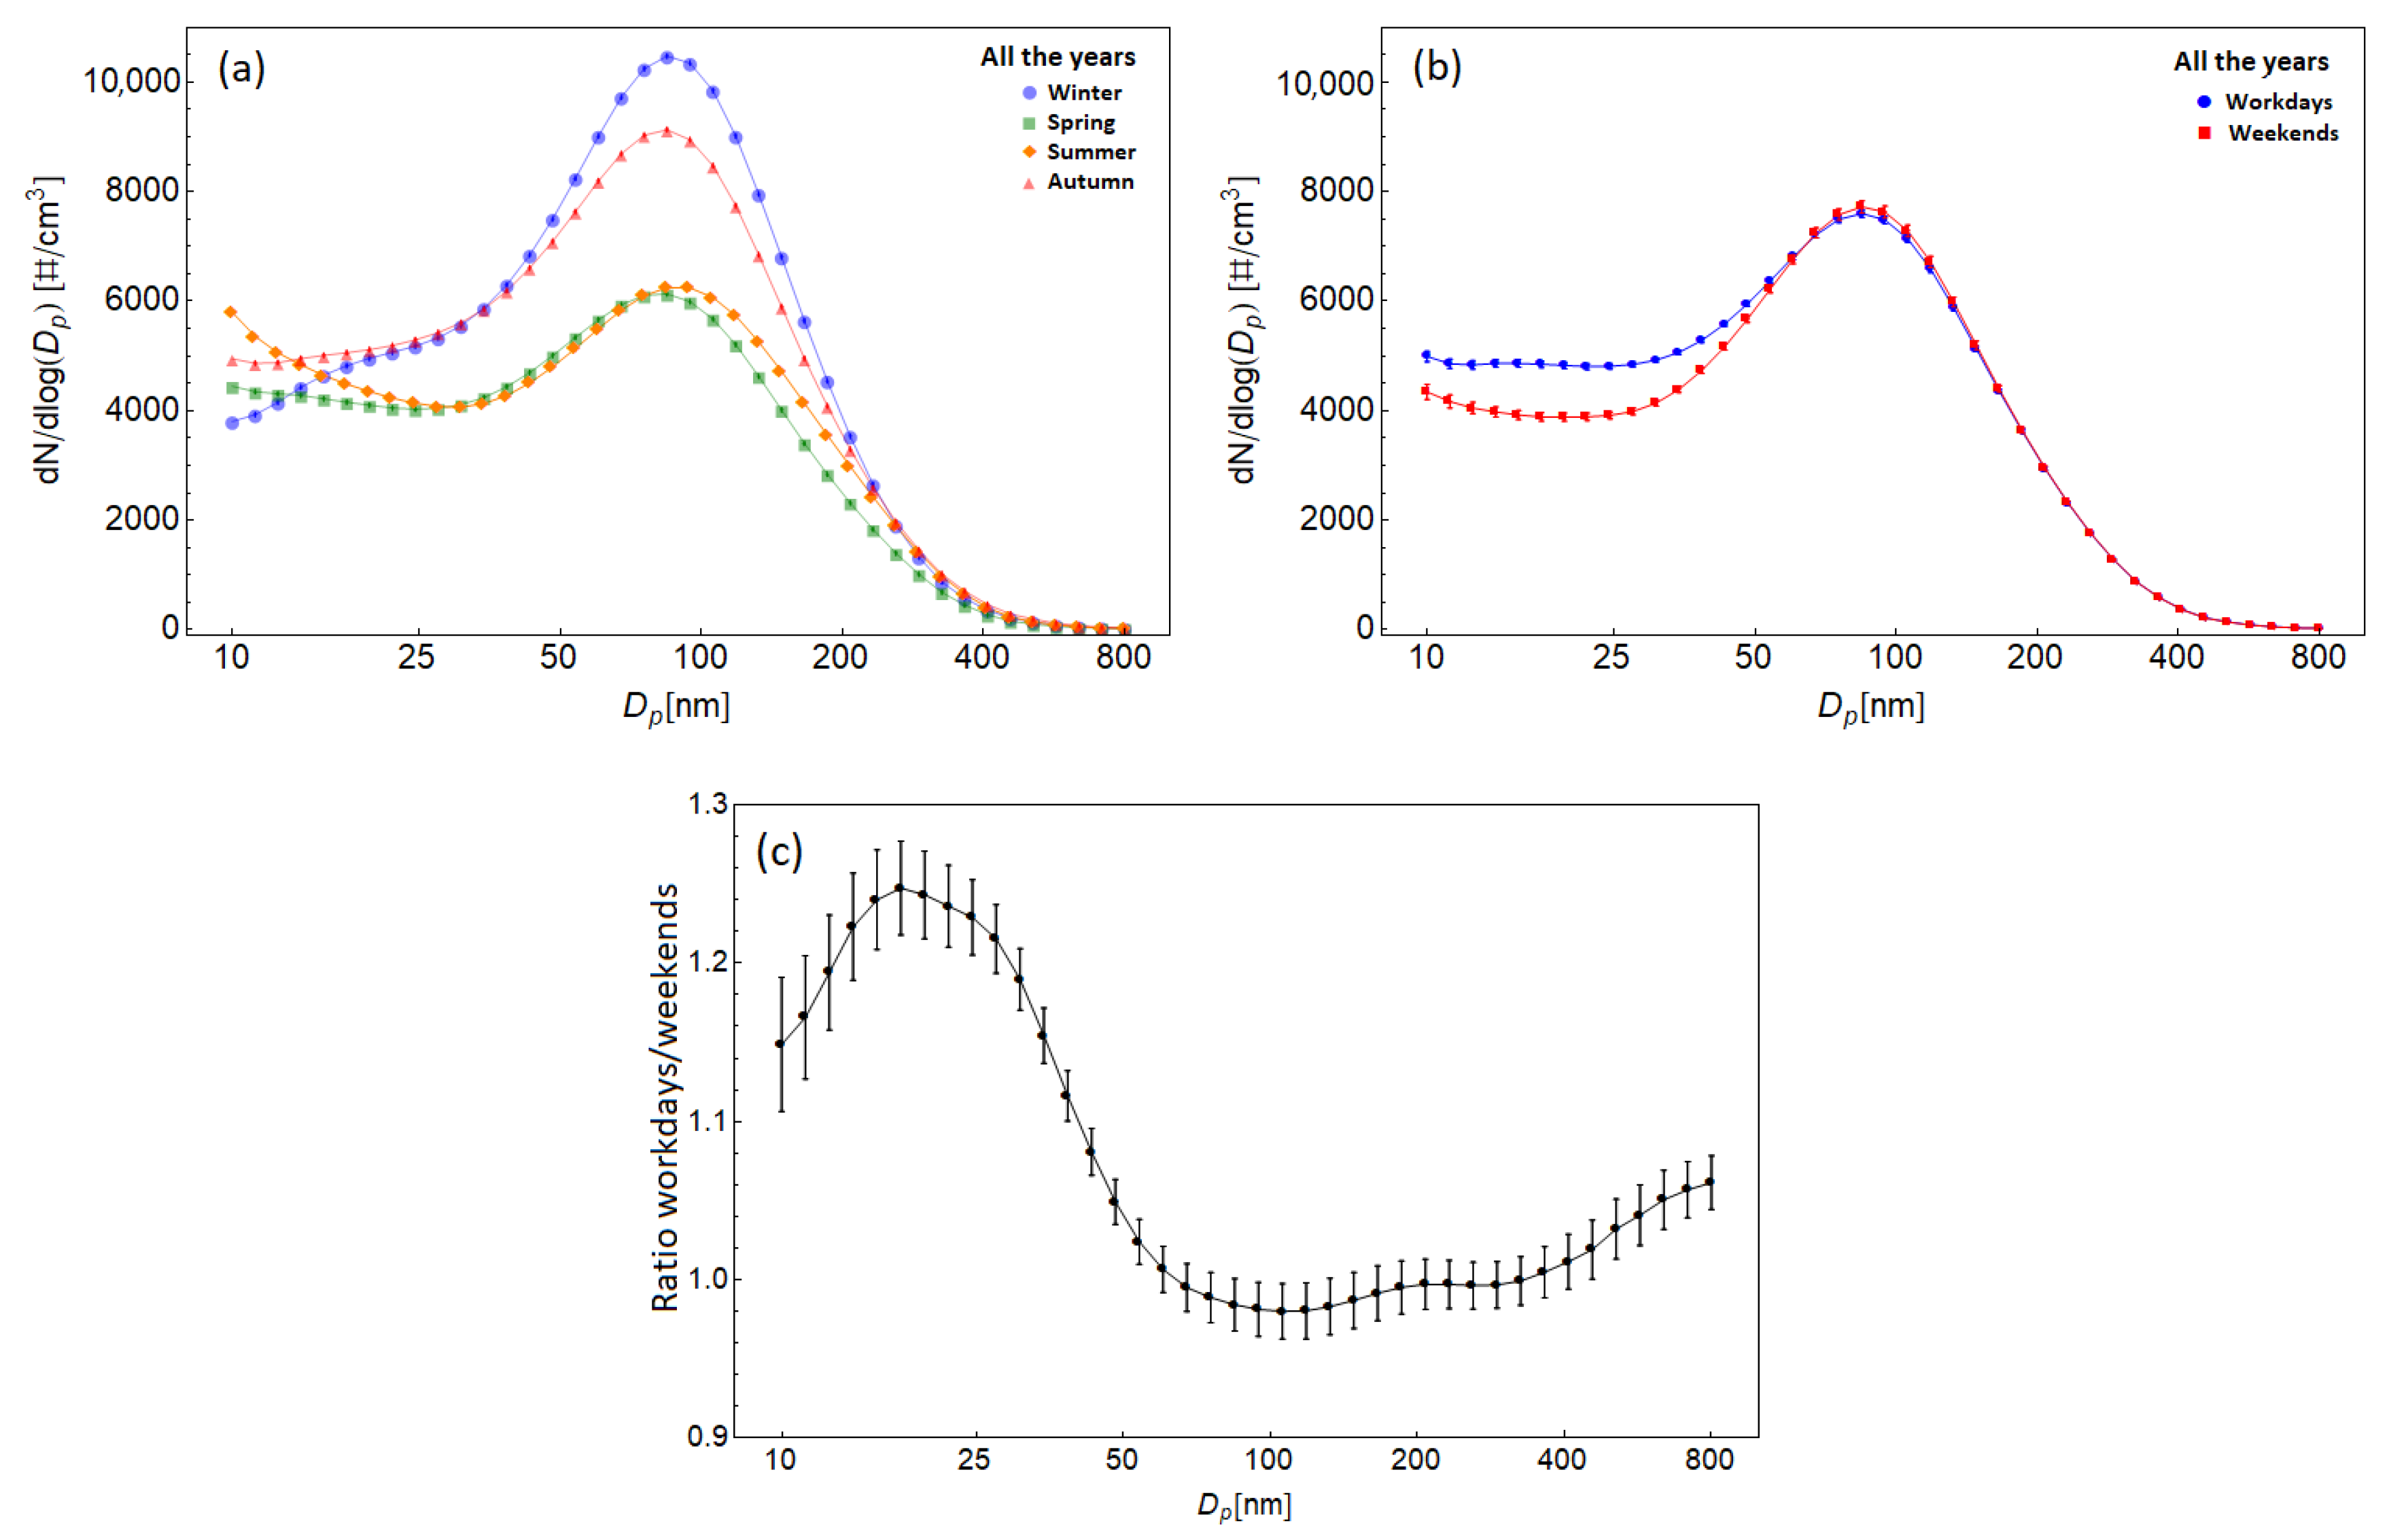
The results averaged over all years and separated for workdays, weekend and seasons, are shown in Figure 3. As can be seen, a strong seasonality is present in Figure 3a, with the lowest number concentrations in spring and summer, and highest in autumn and winter. The greatest variability in seasonal aerosol number size distribution concerns the Aitken particles mode, 20–200 nm, where each curve shows a maximum centered on median diameters around 90 nm. These seasonal differences tend to vanish for the accumulation particle, 200–800 nm, as shown by the overlapping curves. Seasonal variability was instead observed for the nucleation particle mode, 10 ÷ 20 nm, where the increase of number size distribution during the summer season is observable at very small diameters (10–15 nm) and is likely related to the larger frequency of nucleation events.
Figure 3b compares the particle number size distributions during workdays (blue dots) and weekends (red dots). In the size range between 50–800 nm, the two size distributions are similar to an intensity peak of 7700 cm−3 centered around 90 nm. In the size range between 10–50 nm, the number size distributions showed a different behavior, with number concentrations during weekends on average 20% lower compared to workdays, which are probably correlated to lower traffic activity during weekends. This behavior has been also confirmed by the different workdays/weekends ratio of aerosol number size distributions (Figure 3c), which varies from 0.98 to 1.25 as a function of particle size. For particles between 10 nm and 50 nm, the ratio is significantly higher than unity reaching a maximum of 1.25, highlighting a contribution of traffic source in this size range. Subsequently, in the size range between 50 nm and 400 nm, the ratio remains almost constant, around 1, but it increases again up to about 1.06 for particles larger than 400 nm. This last increase could be due to the influence of non-exhaust emissions, tires, brake wear, and resuspension of road dust [3], which are all connected to the variation of the traffic flow that is more intense on workdays than on weekends.
3.3. Daily Trends of Measured Number Concentrations
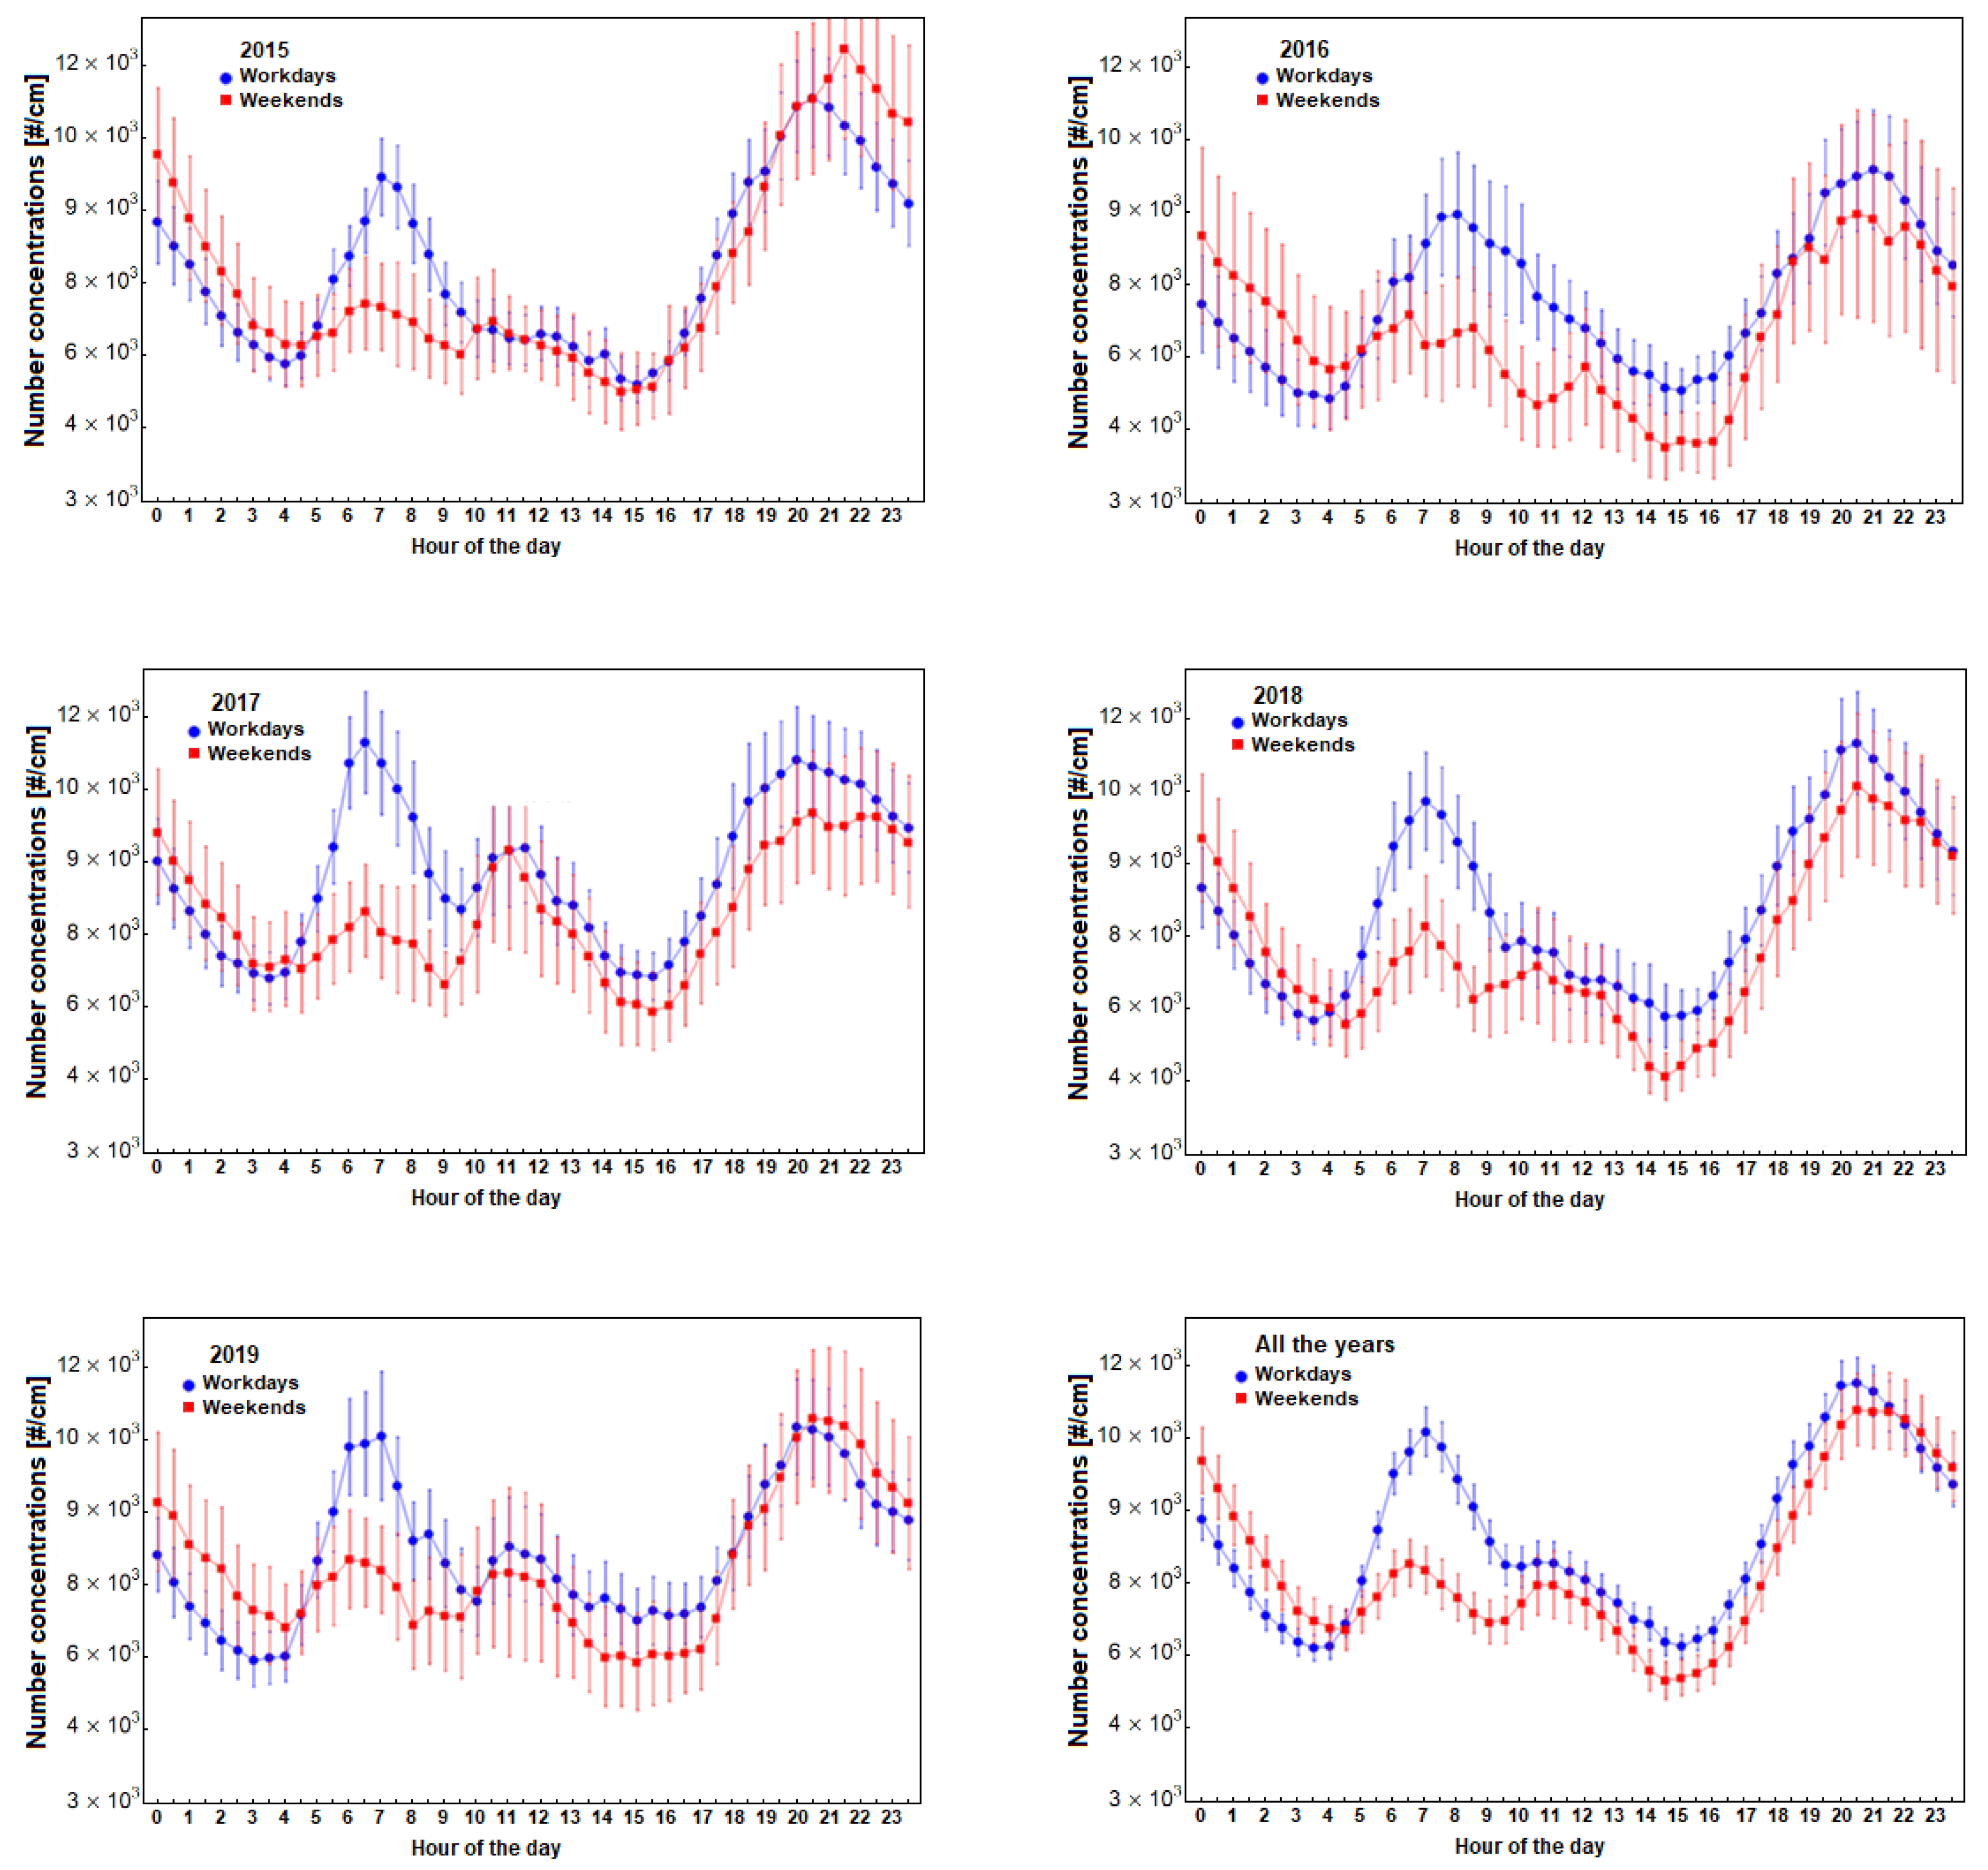
The daily evolution of total particle number concentrations was analyzed separating workdays and weekends/holidays. During different hours of the day, the particle number concentrations exhibited well-defined behavior with similar characteristics for the different years that can be directly related to human activities, in particular road traffic.
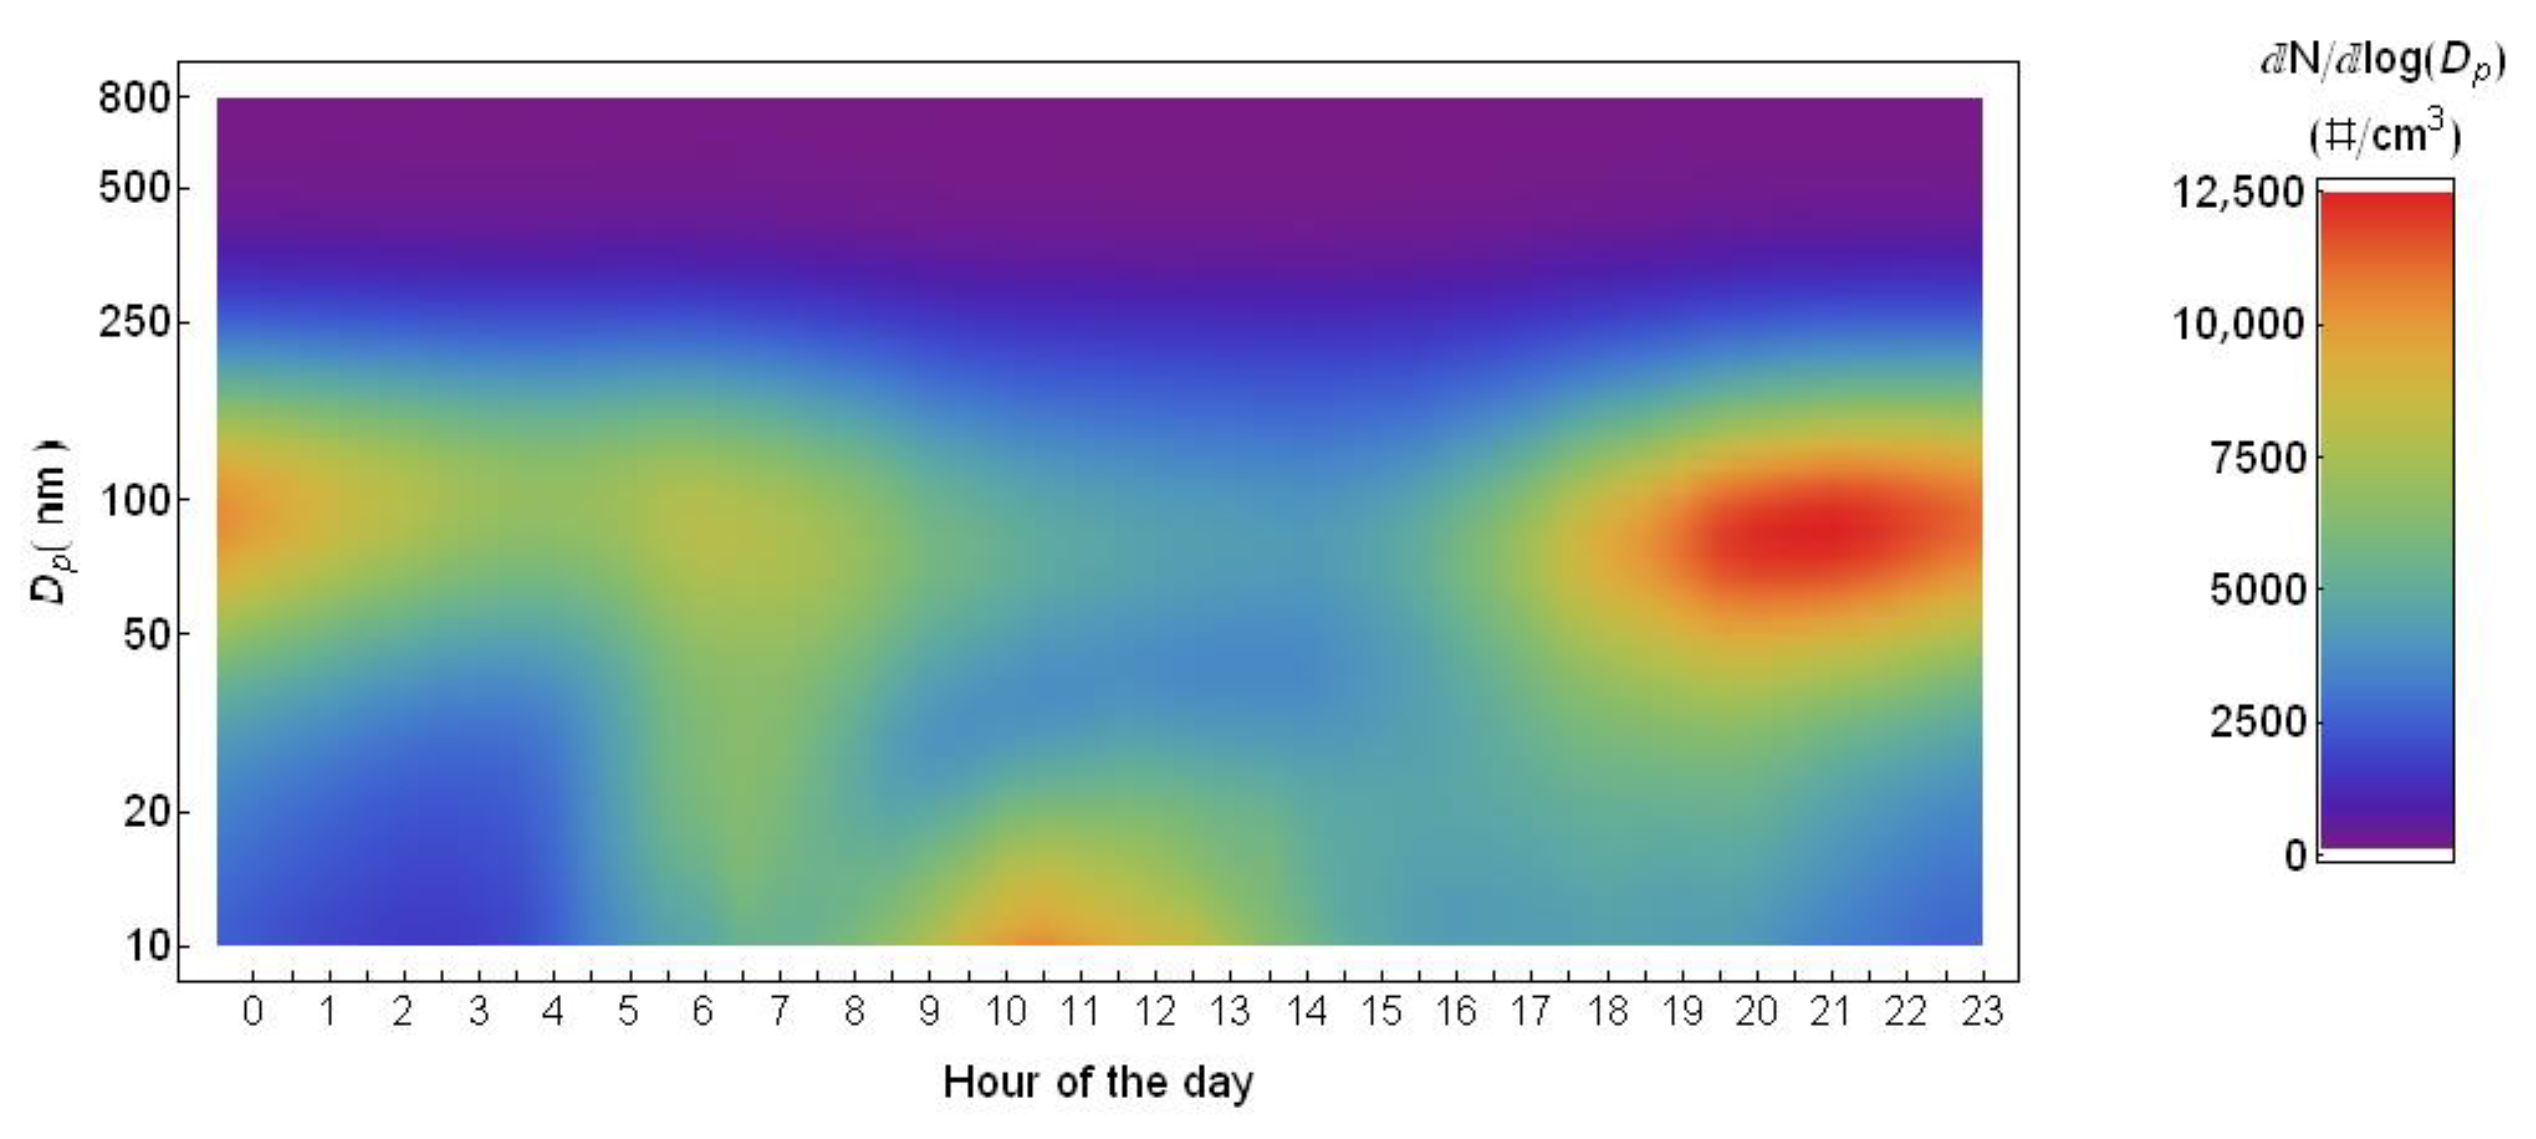
Figure 4 shows the daily trend of the size distribution averaged over the whole measurement period. It shows a larger concentration for particles around 100 nm in diameter late in the evening and during the first hours of the night. After this period there is a decrease and a successive increase starting from small particles (i.e., from 10 nm) in the morning rush hours (between 05:00 a.m. and 08:00 a.m.). A clear increase of particles in the nucleation size range is observed in the central hours of the day (between 09:00 a.m. and 02:00 p.m.). Figure 5 compares the daily trends of particle concentrations during workdays with those during weekends. Looking at Figure 5, high number of concentrations of particles were observed during the traffic rush hours, whether it was a workday or a weekend. The first peak in number concentration appeared on the morning rush hours, between 06:00 and 09:00 a.m., coincident with the beginning of the working day and school activity. In each year, the number concentrations are lower during weekends than workdays by about 20%, which could be correlated to lower traffic activity during weekends/holidays [4]. Subsequently, number concentration decreases to exhibit another peak of particles between 10:00 and 12:00 a.m., which is more visible for the years 2017 and 2019. This peak is related to new particle formation events. The differences among one year and the other arise from various combinations of factors, such as a different contribution of sources, meteorological conditions, and photochemical reactions.
A third important peak of particles, with values higher than 10,000 cm−3, appears in the evening, between 08:00 and 09:00 p.m., also attributable to the late evening rush hours traffic emissions (and to residential burning process during winter months). This peak reaches number concentrations higher than the morning peak, likely because it is also influenced by the lower height of the boundary-layer and the stable conditions present during the late evening especially in autumn and winter. This behavior was observed also for mass concentrations at this site [23].
In all plots, the average number concentrations during weekends/holidays are lower compared to workdays with the exclusion of the night in which higher number concentrations are observed. This is due to a shift in the traffic in the area that is significantly larger late in the evening and night during weekends compared to workdays [33]. During the night, number concentrations slowly decrease until the early hours of the morning. On average, the number concentration drops by 30% between midnight and 3:00 a.m., when it reaches the minimum value. This occurs under stable atmospheric conditions, a shallower boundary layer, and smaller average wind speeds, developed during the night that are generally still present in the early hours of the day.
3.4. Seasonal Variation of Particle Number Concentration
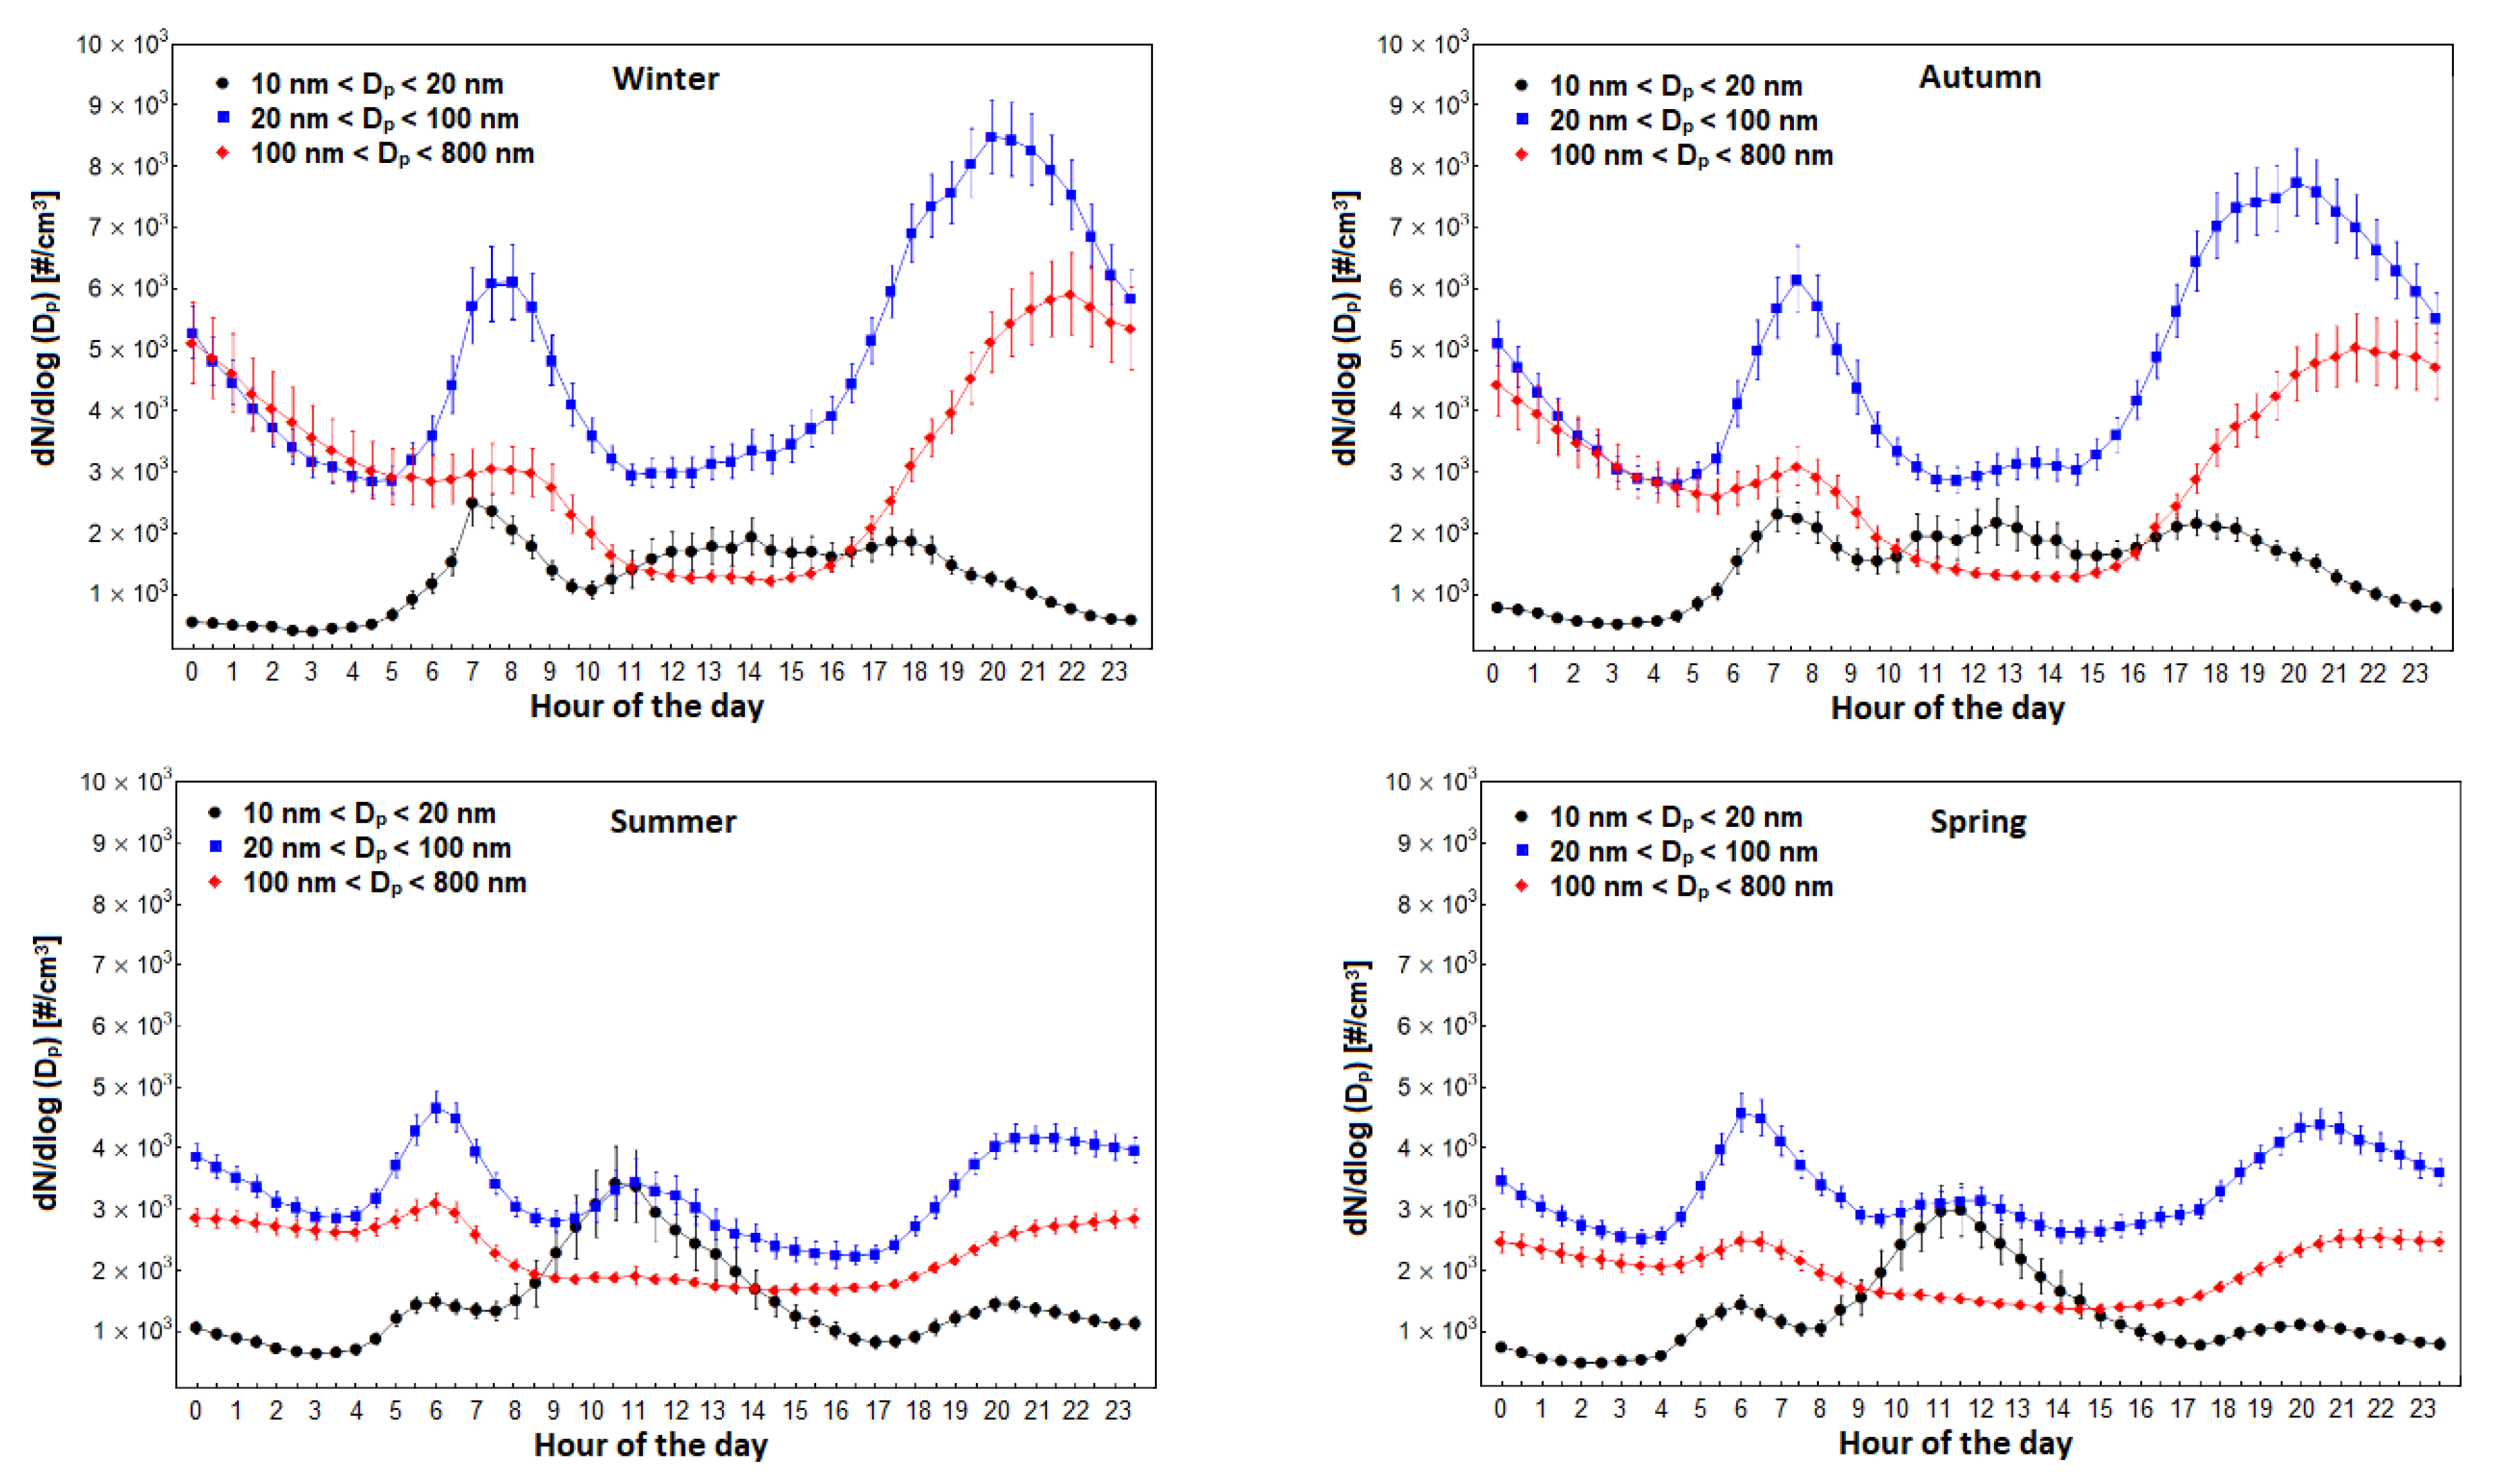
The daily patterns of particle number concentrations were investigated for the different seasons. The different size ranges were averaged over the five years, considering Winter (December, January, February), Spring (March, April, May), Summer (June, July, August), and Autumn (September, October, November) seasons separately (Figure 6). Seasonal averages ±1 standard deviation and medians with 25th and 75th percentiles were also calculated and summarized in Table 2 for each size range.
The particle number concentration of the Aitken mode (blue dots) shows a clear bimodal peak distribution over the autumn-winter and a triple-peak on spring-summer. The two common peaks, which are shown in all seasons, coincide with the morning and late evening traffic rush hours while midday peak, not visible in winter-autumn, may be explained by the process of the growth of particles from the nucleation mode.
The accumulation particles mode (red dots) have a pattern similar to Aitken particles mode, with the exclusion of the midday peak meaning that nucleation and growth processes have limited influence on this size range. Looking at the morning and evening peaks in the accumulation mode, it appears that they are weaker compared to Aitken size range suggesting than this size range is affected by mobile sources at a lower extent compared to smaller particles. It is instead evident that the modulation due to the daily trend of the mixing layer height can lead to higher or lower number concentrations according to the season and the hours of the day.
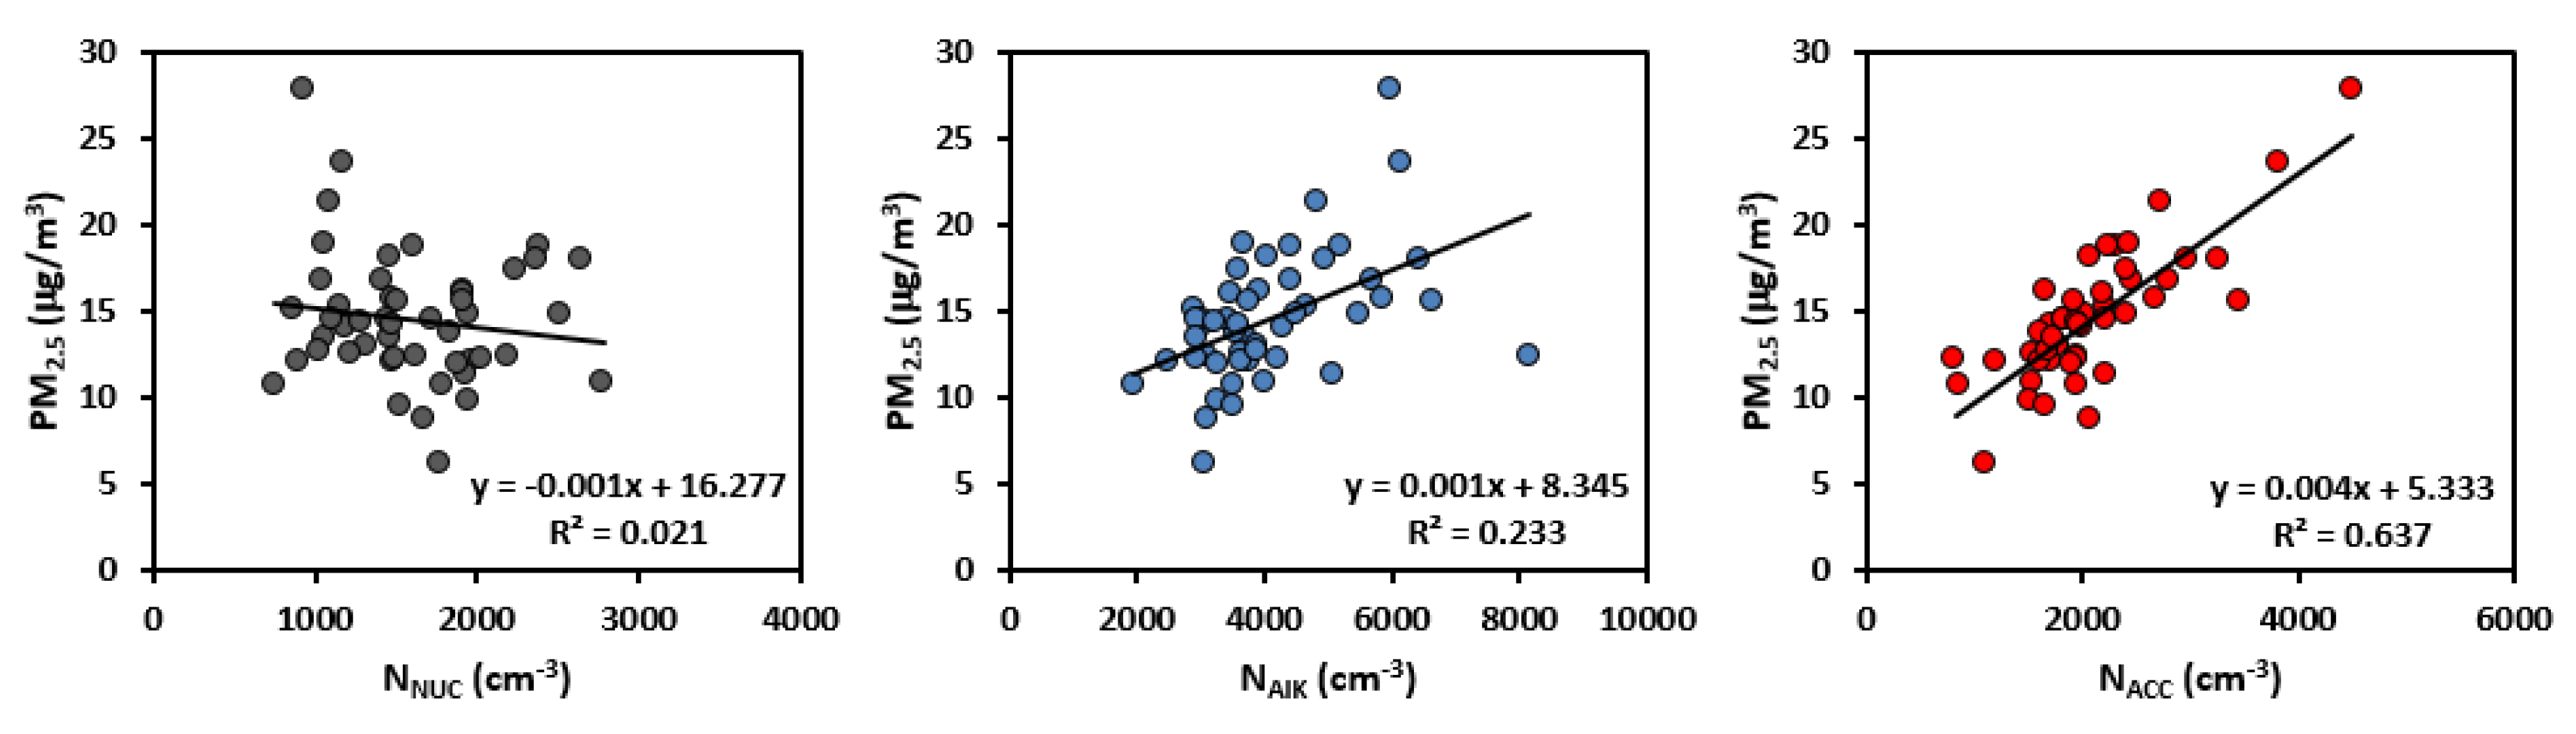
Each size range shows a different daily pattern with some changes between the cold and warm seasons. The particle number concentrations in the nucleation mode (black dots) are larger during diurnal hours with an increase in the morning and a decrease in the afternoon. The pattern has a peak at around 7:00 a.m. in winter-autumn and at around 6:00 a.m. in spring-summer likely due to local traffic sources. Another peak appears around 11:00–12:00 a.m. but it is relevant only in spring and summer, probably due to photochemical processes. This pattern is due to new particulate formation events and their frequency that is relatively high in spring and summer when climatic conditions and high concentrations of precursor species create suitable conditions to trigger the process [34,35,36]. Continuous daily measurements of PM2.5 is done at the observatory with a low-volume (2.3 m3/h) automatic sampler [23]. The average PM2.5 concentration in the measurement period was 15 g/m3 presenting a clear seasonal trend with larger concentrations during the cold season autumn and winter (average 16.6 g/m3) compared to the warm season spring and summer (average 13.3 g/m3). This is in agreement with a previous source apportionment study at this site [24]. Correlations of monthly average PM2.5 concentrations with particle number concentrations in the three size ranges are reported in Figure 7. There is not a correlation between PM2.5 and NNUC because these very small particles do not contribute significantly to mass concentration, the same happens for NAIK. This may also be attributed to particle uptake by larger particles. Instead, there is a good correlation between PM2.5 and NACC suggesting that the accumulation mode particles give a contribution to mass concentrations.
The seasonal differences in number concentrations showed a clear and pronounced variability on Aitken and accumulation particles, with higher average values in winter, followed by autumn, spring, and summer. This variability was not observed in nucleation particles where the average values of particle number concentrations varied between 1.4 × 103 cm−3 in spring and 1.8 × 103 cm−3 in autumn.
3.5. Effects of Local Meteorological Conditions
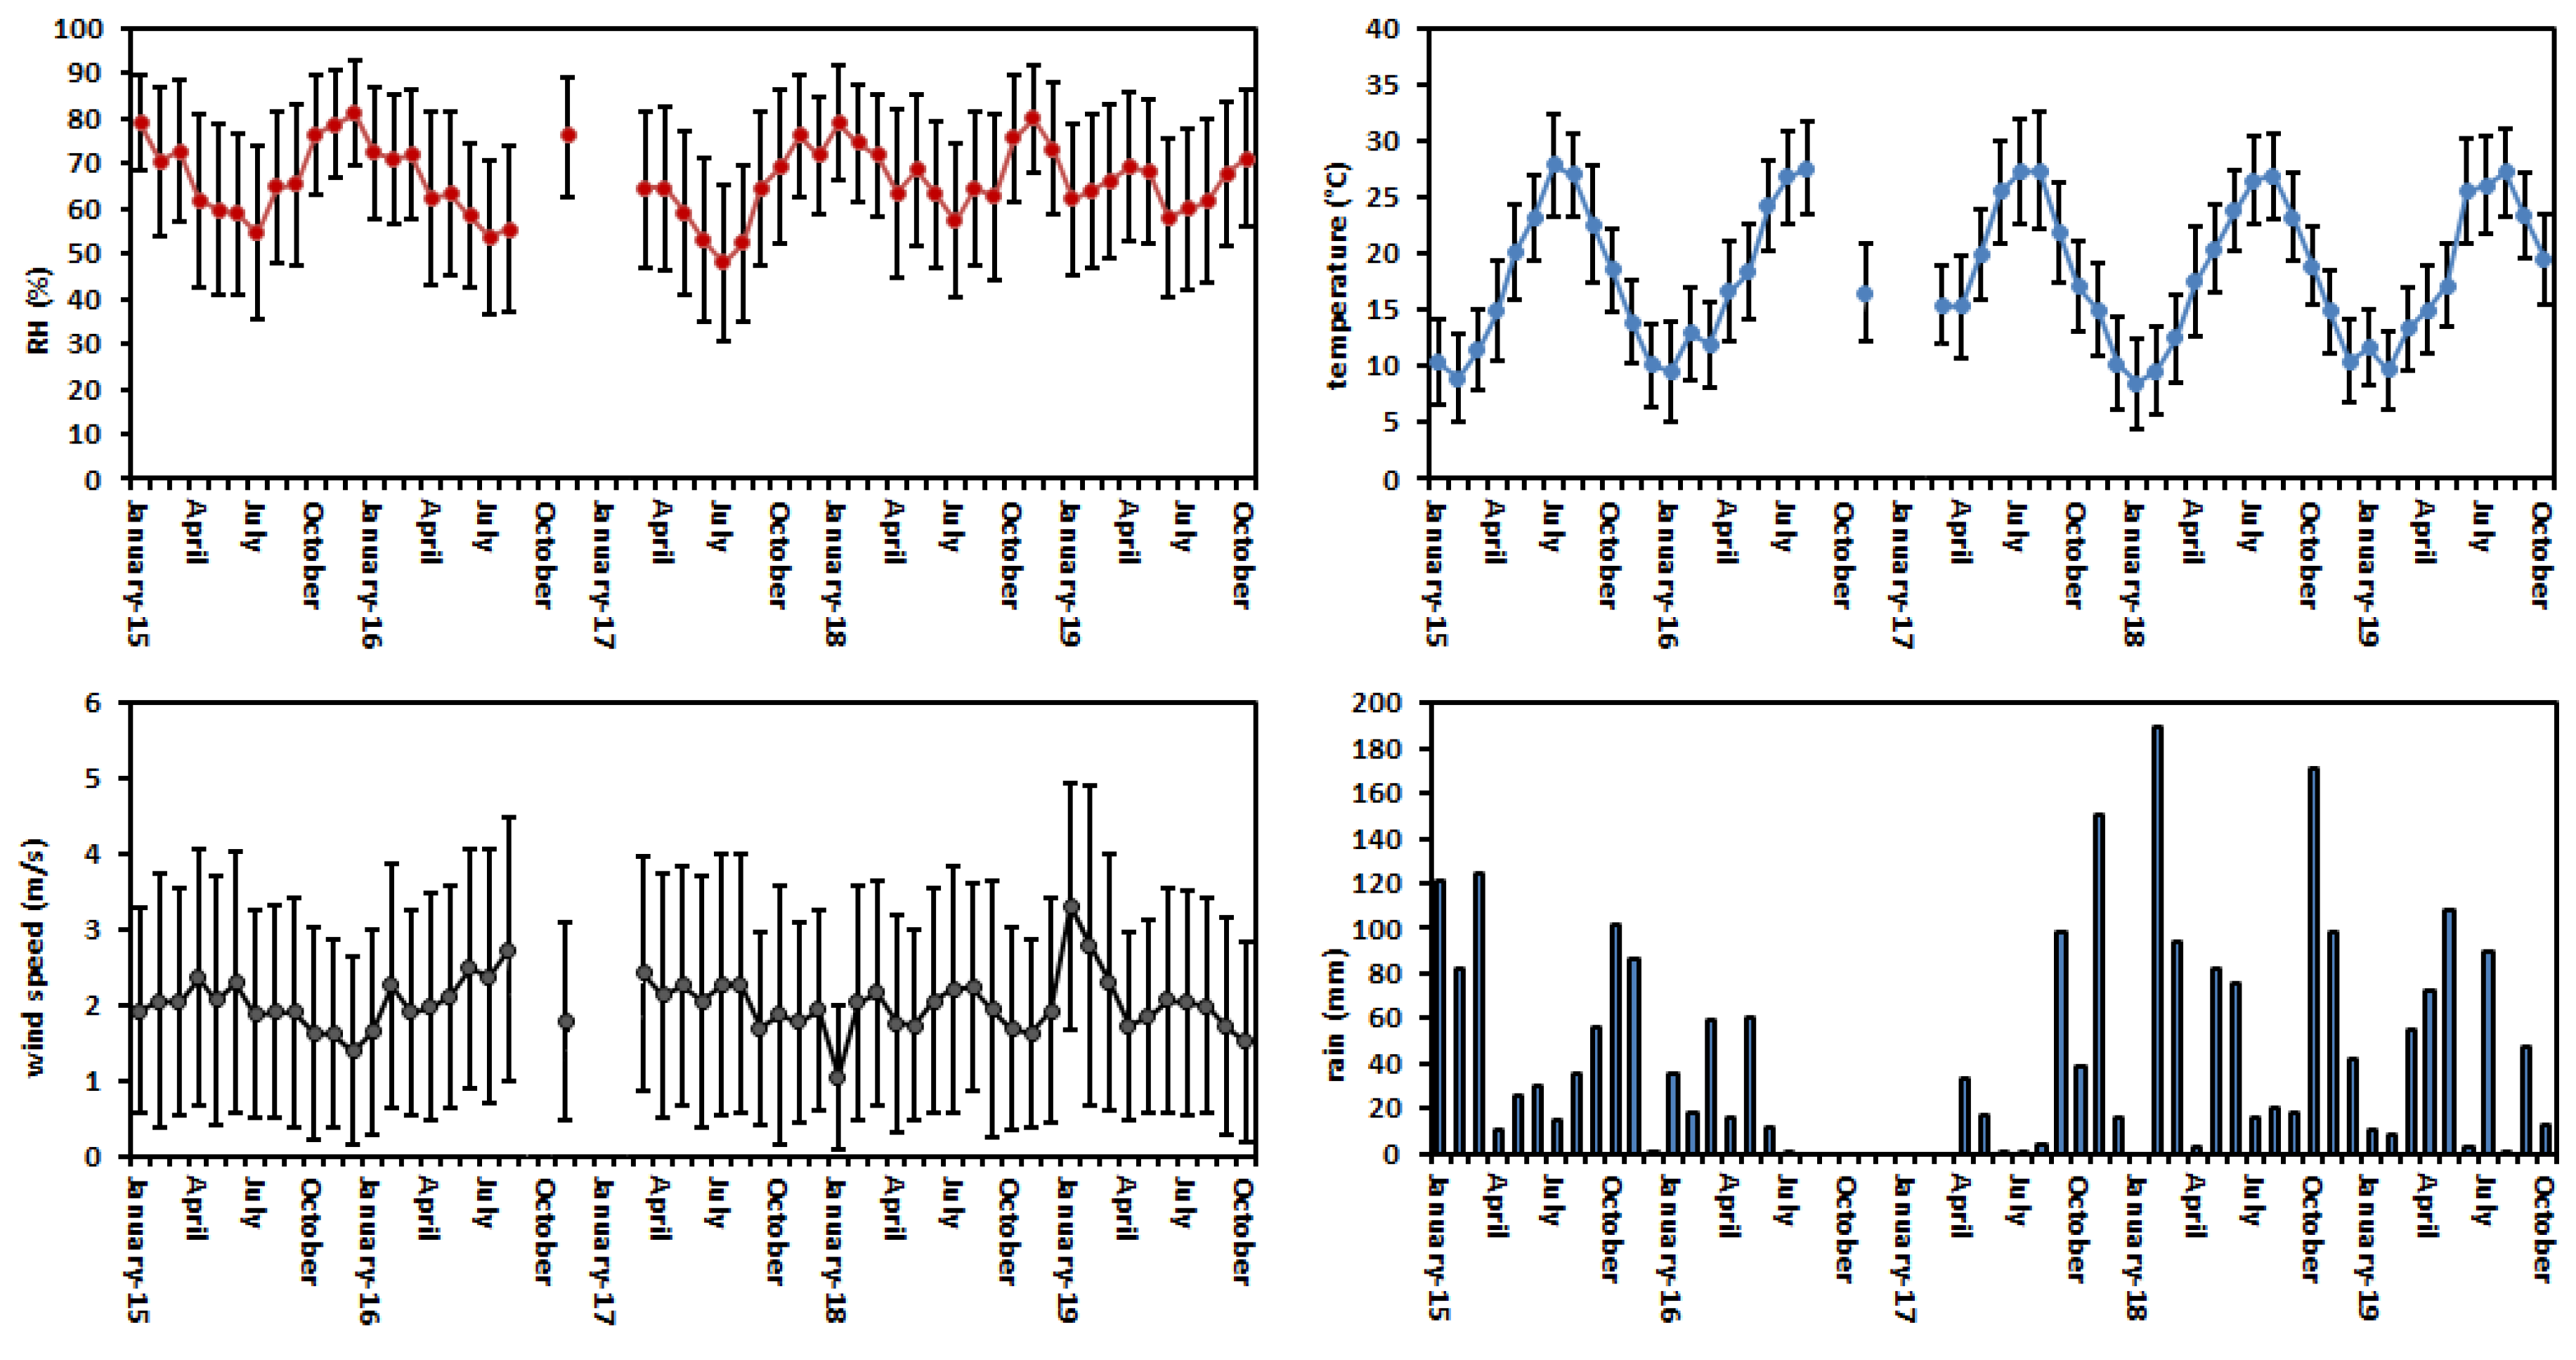
In addition to the source strength and characteristics, the concentrations of aerosol particles are strongly dependent on the meteorological conditions. The observation site is characterized by the typical Mediterranean climate, with mild winters and high percentage levels of relative humidity (RH), hot summers, and low wind speed. Monthly variations in wind speed, temperature, RH, and rain accumulation during the five-year measurements are summarized in Figure 8.
A seasonal variation pattern was observed both for temperature and for RH. The average temperature ranged approximately from 8 °C to 28 °C between winter and summer, while average RH was lower in summer, ~48%, than in other seasons ~81%. However, no marked pattern was observed in the monthly average wind speed that ranged between 1–3.3 m/s. It rained most frequently in autumn-winter with an average of over 70 mm of precipitation, and less frequently in spring-summer with an average below 30 mm.
The correlation between the number concentration of particles, in the three modes, and meteorological parameters, both averaged by month, were calculated by Pearson coefficients, even if this approach could have some limitation in describing processes involving several meteorological parameters together, it could furnish some indications on the role of local meteorology on particle number concentrations. Considering precipitations, no correlation was observed, perhaps because of two factors: the first is that wet scavenging removes super-micrometric particles more efficiently [37] and the second is that the moderate precipitation levels of this area influenced the long-term average level of number concentrations only marginally.
It was found that particle number concentrations were negatively correlated to temperature, with Pearson coefficients of −0.70 (Aitken size range) and −0.44 (accumulation size range), and wind speed with Pearson coefficients of −0.46 and −0.49 in the Aitken, and accumulation particle modes, respectively. There was a positive correlation between RH and NAIT and NACC, coefficients of 0.66 and 0.45, respectively. No significant correlation was found between the NNUC number concentration and wind speed (0.18), temperature (0.04), and RH (−0.16). These results indicate that the dilution effect of wind and temperature, which promotes the dispersion of particles into the atmosphere reducing the number concentration, affects above all large particles. In addition, RH plays an important role as a catalyst in the hygroscopic growth of primary and secondary particles [38] through various processes such as nucleation, condensation, and evaporation which seems to be more relevant on NAIT and NACC.
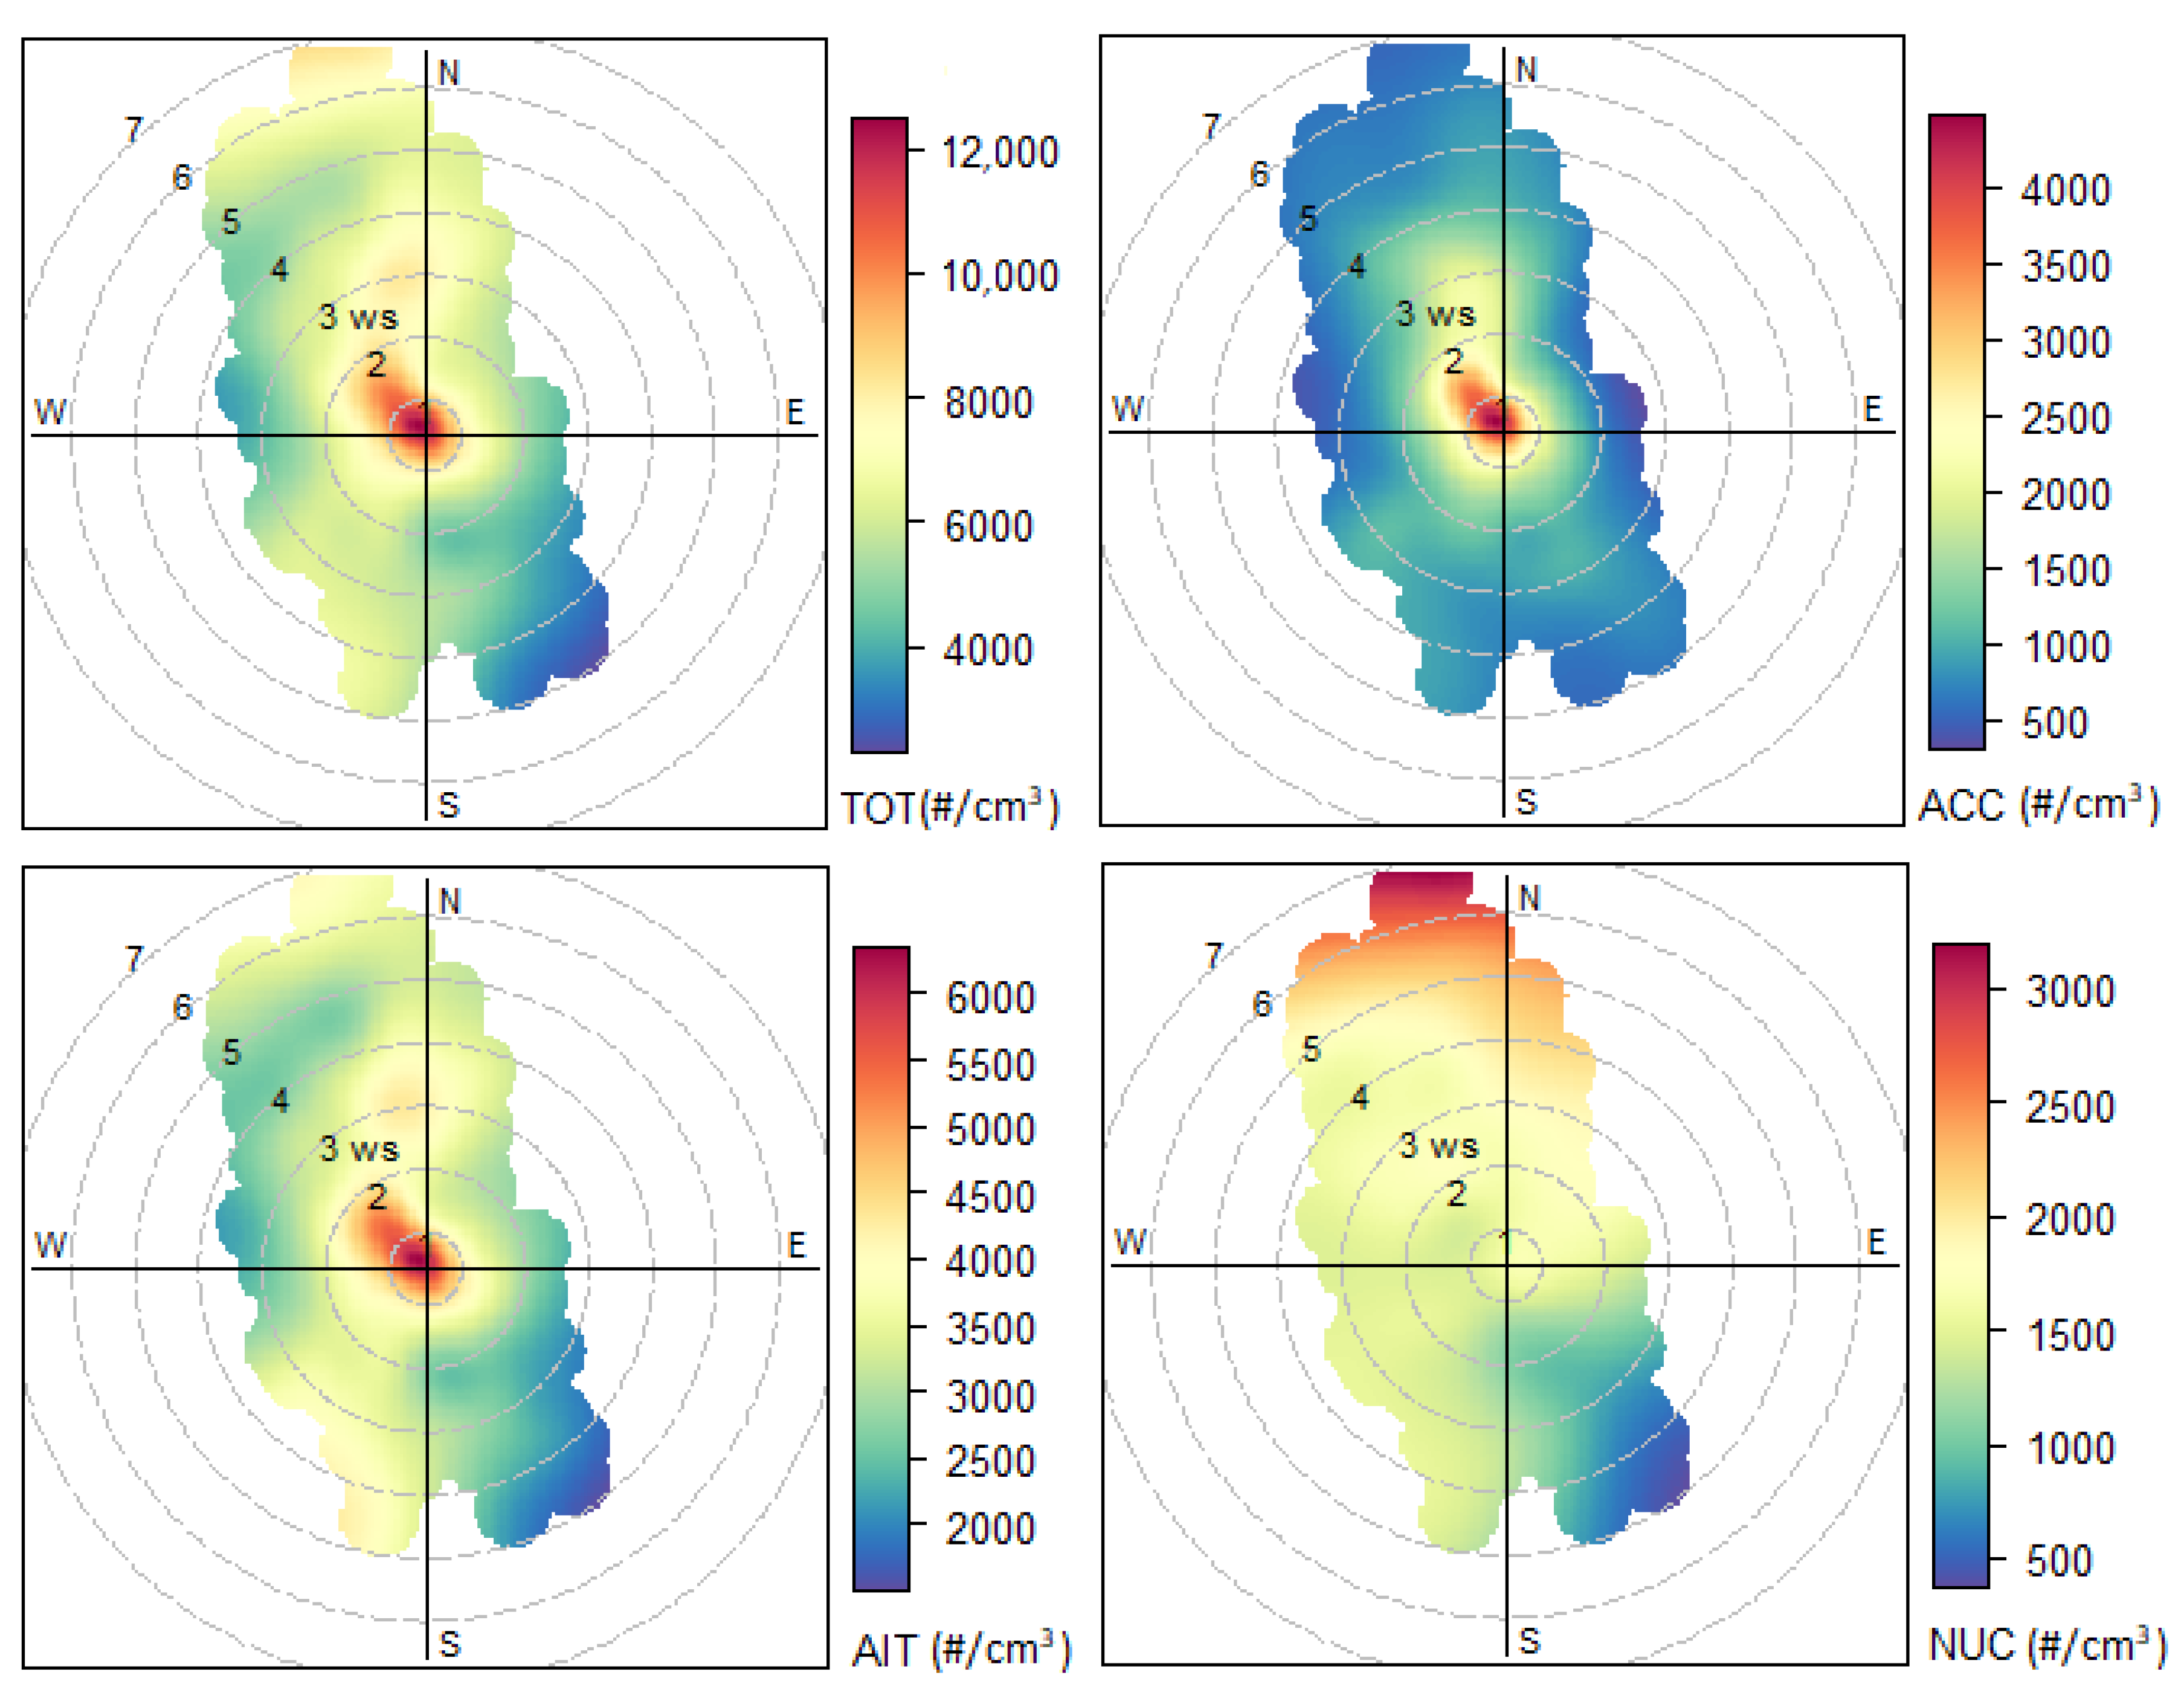
The influence of wind speed and direction on the particle number concentrations was also investigated using pollution roses. Figure 9 shows the pollution increase generated for each size range and total particle number concentration over the whole measurement period. The grey circles indicate wind speeds in 1 m/s intervals, while the color scales indicate particle number concentration. The analysis, related to NTOT, NACC, and NAIT, revealed that the highest number concentrations were registered at very low wind speeds (<1 m/s) and when weak winds (<2 m/s) blew predominantly from the NW sector. This information suggests that the major sources of particle number concentrations are local and that a significant contribution comes from the NW sector where, at about 500 m away from the measurement site, there is a road affected by intense traffic (highlighted in green in Figure 1). The highest number concentrations of NNUC were instead associated with higher wind speeds (6–7 m/s) coming from the N–NNW direction, possibly indicating long-range transport and low contributions from local sources. For all size fractions, low concentrations were associated with the SSE–SE direction.
4. Conclusions
Five-years (2015–2019) continuous measurements of atmospheric particle number size distribution were conducted at the ECO Environmental-Climate Observatory of Lecce. In this study, the variability in aerosol total number concentrations as well as within specific size range was quantified for a time range from hourly to seasonal. During all period, particle number concentrations in the Aitken (20 < Dp < 100 nm), accumulation (100 nm < Dp < 800nm), and nucleation (Dp < 20 nm) size ranges accounted for 52%, 27%, and 21% of total measured particle, respectively. In terms of seasonal differences, total, Aitken, and accumulation particles number concentrations showed more variability, with higher average values in winter compared to summer. The nucleation size range showed a lower seasonal variability with average values ranging between 1.4 × 103 cm−3 in spring and 1.8 × 103 cm−3 in autumn.
The total number concentration was usually significantly higher during workdays than during weekends/holidays in all years as also confirmed by the workday/weekend ratio, showing a strong correlation with traffic activities in the size range 10–50 nm. This correlation was also observed in daily patterns in correspondence of the morning and the late evening traffic rush hours. The peak in the number concentrations of nucleation mode observed in the midday of spring and summer was instead imputed to new particle formation events.
Pearson coefficients showed that there were distinct differences among the correlation of particle number concentrations in the three size ranges and meteorological parameters. Aitken and accumulation particles were negatively correlated to temperature (−0.70 and −0.44, respectively) and wind speed (−0.46 and −0.49, respectively) and positively correlated to RH (0.66 and 0.45, respectively), while no significant correlation was found with nucleation particles. Pollution increases showed a similar trend for accumulation and Aitken particle number concentrations. Both size fractions had larger concentrations at low wind velocity or during wind calms, suggesting that they are dominated by local emission sources. Instead, the number concentration in the nucleation size range showed a different pattern with non-local sources, located in the NNW direction, strongly influencing concentration levels.
Author Contributions
Conceptualization, A.D., M.C. and D.C.; investigation, A.D. and M.C.; writing—original draft, A.D.; writing—review & editing, A.D., M.C., F.M.G. and D.C. All authors have read and agreed to the published version of the manuscript.
Funding
This work was supported by the financial contribution of the project I-AMICA (Infrastructure of High Technology for Environmental and Climate Monitoring-PONa3_00363), a project of Structural improvement financed under the National Operational Program (NOP) for “Research and Competitiveness 2007–2013” co-funded with European Regional Development Fund (ERDF) and National resources.
Conflicts of Interest
The authors declare no conflict of interest.
References
- Klejnowski, K.; Krasa, A.; Rogula-Kozłowska, W.; Błaszczak, B. Number Size Distribution of Ambient Particles in a Typical Urban Site: The First Polish Assessment Based on Long-Term (9 Months) Measurements. Sci. World J. 2013, 2013, 1–13. [Google Scholar] [CrossRef]
- Ohlwein, S.; Kappeler, R.; Joss, M.K.; Künzli, N.; Hoffmann, B. Health effects of ultrafine particles: A systematic literature review update of epidemiological evidence. Int. J. Public Health 2019, 64, 547–559. [Google Scholar] [CrossRef] [PubMed]
- Conte, M.; Contini, D. Size-resolved particle emission factors of vehicular traffic derived from urban eddy covariance measurements. Environ. Pollut. 2019, 251, 830–838. [Google Scholar] [CrossRef] [PubMed]
- Hussein, T.; Puustinen, A.; Aalto, P.P.; Mäkelä, J.M.; Hämeri, K.; Kulmala, M. Urban aerosol number size distributions. Atmos. Chem. Phys. Discuss. 2004, 4, 391–411. [Google Scholar] [CrossRef] [Green Version]
- Morawska, L.; Thomas, S.; Bofinger, N.; Wainwright, D.; Neale, D. Comprehensive characterization of aerosols in a subtropical urban atmosphere. Atmos. Environ. 1998, 32, 2467–2478. [Google Scholar] [CrossRef] [Green Version]
- Shi, J.P.; E Evans, D.; Khan, A.; Harrison, R.M. Sources and concentration of nanoparticles (<10 nm diameter) in the urban atmosphere. Atmos. Environ. 2001, 35, 1193–1202. [Google Scholar] [CrossRef]
- Ruuskanen, J.; Tuch, T.; Brink, H.T.; Peters, A.; Khlystov, A.; Mirme, A.; Kos, G.; Brunekreef, B.; Wichmann, H.; Buzorius, G.; et al. Concentrations of ultrafine, fine and PM2.5 particles in three European cities. Atmos. Environ. 2001, 35, 3729–3738. [Google Scholar] [CrossRef]
- Perez, N.; Pey, J.; Cusack, M.; Reche, C.; Querol, X.; Alastuey, A.; Viana, M. Variability of Particle Number, Black Carbon, and PM10, PM2.5, and PM1Levels and Speciation: Influence of Road Traffic Emissions on Urban Air Quality. Aerosol Sci. Technol. 2010, 44, 487–499. [Google Scholar] [CrossRef]
- Gao, H.C.; Ni, Y.W.; Zhang, H.J.; Zhao, L.; Zhang, N.; Zhang, X.P.; Zhang, Q.; Chen, J.P. PCDD/Fs Emissions from Hazardous Waste Incinerators in China. Organohalogen. Compd. 2009, 71, 1649–1652. [Google Scholar]
- Pey, J.; Querol, X.; Alastuey, A.; Rodríguez, S.; Putaud, J.P.; Van Dingenen, R. Source apportionment of urban fine and ultra-fine particle number concentration in a Western Mediterranean city. Atmos. Environ. 2009, 43, 4407–4415. [Google Scholar] [CrossRef]
- Kumar, P.; Pirjola, L.; Ketzel, M.; Harrison, R.M. Nanoparticle emissions from 11 non-vehicle exhaust sources—A review. Atmos. Environ. 2013, 67, 252–277. [Google Scholar] [CrossRef] [Green Version]
- Schmale, J.; Henning, S.; Decesari, S.; Henzing, B.; Keskinen, H.; Sellegri, K.; Ovadnevaite, J.; Pöhlker, M.L.; Brito, J.; Bougiatioti, A.; et al. Long-term cloud condensation nuclei number concentration, particle number size distribution and chemical composition measurements at regionally representative observatories. Atmos. Chem. Phys. Discuss. 2018, 18, 2853–2881. [Google Scholar] [CrossRef] [Green Version]
- Hamed, A.; Joutsensaari, J.; Mikkonen, S.; Sogacheva, L.; Maso, M.D.; Kulmala, M.; Cavalli, F.; Fuzzi, S.; Facchini, M.C.; Decesari, S.; et al. Nucleation and growth of new particles in Po Valley, Italy. Atmos. Chem. Phys. Discuss. 2007, 7, 355–376. [Google Scholar] [CrossRef] [Green Version]
- Conte, M.; Donateo, A.; Dinoi, A.; Belosi, F.; Contini, D. Case Study of Particle Number Fluxes and Size Distributions during Nucleation Events in Southeastern Italy in the Summer. Atmosphere 2015, 6, 942–959. [Google Scholar] [CrossRef] [Green Version]
- Englert, N. Fine particles and human health a review of epidemiological studies. Toxicol. Lett. 2004, 149, 235–242. [Google Scholar] [CrossRef]
- Vu, T.; Zauli-Sajani, S.; Poluzzi, V.; Harrison, R.M. Factors controlling the lung dose of road traffic-generated sub-micrometre aerosols from outdoor to indoor environments. Air Q. Atmos. Health 2018, 11, 615–625. [Google Scholar] [CrossRef] [Green Version]
- Havasi, Á.; Zlatev, Z. Trends of Hungarian air pollution levels on a long time-scale. Atmos. Environ. 2002, 36, 4145–4156. [Google Scholar] [CrossRef]
- Hussein, T.; Hameri, K.; Kulmala, M. Long-term indoor-outdoor aerosol measurement in Helsinki, Finland. Boreal Environ. Res. 2002, 7, 141–150. [Google Scholar]
- Salma, I.; Borsós, T.; Aalto, P.P.; Kulmala, M. Time-resolved number concentrations and size distribution of aerosol particles in an urban road tunnel. Boreal Environ. Res. 2011, 16, 262–272. [Google Scholar]
- Morawska, L.; Jayaratne, E.; Mengersen, K.; Jamriska, M.; Thomas, S. Differences in airborne particle and gaseous concentrations in urban air between weekdays and weekends. Atmos. Environ. 2002, 36, 4375–4383. [Google Scholar] [CrossRef] [Green Version]
- Jung, C.H.; Kim, Y.; Lee, K. Simulation of the influence of coarse mode particles on the properties of fine mode particles. J. Aerosol Sci. 2002, 33, 1201–1216. [Google Scholar] [CrossRef]
- Zhang, K.M.; Wexler, A.S. Modeling the number distributions of urban and regional aerosols: Theoretical foundations. Atmos. Environ. 2002, 36, 1863–1874. [Google Scholar] [CrossRef]
- Dinoi, A.; Donateo, A.; Belosi, F.; Conte, M.; Contini, D. Comparison of atmospheric particle concentration measurements using different optical detectors: Potentiality and limits for air quality applications. Measurement 2017, 106, 274–282. [Google Scholar] [CrossRef]
- Cesari, D.; De Benedetto, G.; Bonasoni, P.; Busetto, M.; Dinoi, A.; Merico, E.; Chirizzi, D.; Cristofanelli, P.; Donateo, A.; Grasso, F.; et al. Seasonal variability of PM2.5 and PM10 composition and sources in an urban background site in Southern Italy. Sci. Total. Environ. 2018, 612, 202–213. [Google Scholar] [CrossRef]
- Wiedensohler, A.; Birmili, W.; Nowak, A.; Sonntag, A.; Weinhold, K.; Merkel, M.; Wehner, B.; Tuch, T.; Pfeifer, S.; Fiebig, M.; et al. Mobility particle size spectrometers: Harmonization of technical standards and data structure to facilitate high quality long-term observations of atmospheric particle number size distributions. Atmos. Meas. Tech. 2012, 5, 657–685. [Google Scholar] [CrossRef] [Green Version]
- Wiedensohler, A. An approximation of the bipolar charge distribution for particles in the submicron size range. J. Aerosol Sci. 1988, 19, 387–389. [Google Scholar] [CrossRef]
- McMurry, P.H. A review of atmospheric aerosol measurements. Atmos. Environ. 2000, 34, 1959–1999. [Google Scholar] [CrossRef]
- Manninen, H.E.; Nieminen, T.; Asmi, E.; Gagné, S.; Häkkinen, S.; Lehtipalo, K.; Aalto, P.; Vana, M.; Mirme, A.; Mirme, S.; et al. EUCAARI ion spectrometer measurements at 12 European sites—Analysis of new particle formation events. Atmos. Chem. Phys. 2010, 10, 7907–7927. [Google Scholar] [CrossRef] [Green Version]
- Rahman, M.; Mazaheri, M.; Clifford, S.; Morawska, L. Estimate of main local sources to ambient ultrafine particle number concentrations in an urban area. Atmos. Res. 2017, 194, 178–189. [Google Scholar] [CrossRef] [Green Version]
- Hama, S.M.; Cordell, R.L.; Kos, G.P.; Weijers, E.; Monks, P. Sub-micron particle number size distribution characteristics at two urban locations in Leicester. Atmos. Res. 2017, 194, 1–16. [Google Scholar] [CrossRef] [Green Version]
- Alanen, J.; Saukko, E.; Lehtoranta, K.; Murtonen, T.; Timonen, H.; Hillamo, R.; Karjalainen, P.; Kuuluvainen, H.; Harra, J.; Keskinen, J.; et al. The formation and physical properties of the particle emissions from a natural gas engine. Fuel 2015, 162, 155–161. [Google Scholar] [CrossRef]
- Rönkkö, T.; Virtanen, A.; Kannosto, J.; Keskinen, J.; Lappi, M.; Pirjola, L. Nucleation Mode Particles with a Nonvolatile Core in the Exhaust of a Heavy Duty Diesel Vehicle. Environ. Sci. Technol. 2007, 41, 6384–6389. [Google Scholar] [CrossRef] [PubMed]
- Contini, D.; Donateo, A.; Elefante, C.; Grasso, F. Analysis of particles and carbon dioxide concentrations and fluxes in an urban area: Correlation with traffic rate and local micrometeorology. Atmos. Environ. 2012, 46, 25–35. [Google Scholar] [CrossRef]
- Hamburger, T.; Mcmeeking, G.; Minikin, A.; Birmili, W.; Dall’osto, M.; O’dowd, C.; Flentje, H.; Henzing, B.; Junninen, H.; Kristensson, A.; et al. Overview of the synoptic and pollution situation over Europe during the EUCAARI-LONGREX field campaign. Atmos. Chem. Phys. Discuss. 2011, 11, 1065–1082. [Google Scholar] [CrossRef] [Green Version]
- Donahue, N.M.; Epstein, S.A.; Pandis, S.; Robinson, A. A two-dimensional volatility basis set: 1. organic-aerosol mixing thermodynamics. Atmos. Chem. Phys. Discuss. 2011, 11, 3303–3318. [Google Scholar] [CrossRef] [Green Version]
- Pierce, J.; Leaitch, W.R.; Liggio, J.; Westervelt, D.M.; Wainwright, C.D.; Abbatt, J.P.D.; Ahlm, L.; Al-Basheer, W.; Cziczo, D.J.; Hayden, K.L.; et al. Nucleation and condensational growth to CCN sizes during a sustained pristine biogenic SOA event in a forested mountain valley. Atmos. Chem. Phys. Discuss. 2012, 12, 3147–3163. [Google Scholar] [CrossRef] [Green Version]
- Conte, M.; Merico, E.; Cesari, D.; Dinoi, A.; Grasso, F.; Donateo, A.; Guascito, M.; Contini, D. Long-term characterisation of African dust advection in south-eastern Italy: Influence on fine and coarse particle concentrations, size distributions, and carbon content. Atmos. Res. 2020, 233, 104690. [Google Scholar] [CrossRef]
- Zhang, R.; Wang, G.; Guo, S.; Zamora, M.L.; Ying, Q.; Lin, Y.; Wang, W.; Hu, M.; Wang, Y. Formation of Urban Fine Particulate Matter. Chem. Rev. 2015, 115, 3803–3855. [Google Scholar] [CrossRef]
Figure 1.
Location of the sampling site with respect to the city center of Lecce. The most important roads are shown in green.
Figure 1.
Location of the sampling site with respect to the city center of Lecce. The most important roads are shown in green.

Figure 2.
Monthly variation of particle number concentrations for the three size ranges, where the red, blue, and black lines represent the monthly percentage contribution to total particle number concentration of nucleation, Aitken, and accumulation ranges, respectively.
Figure 2.
Monthly variation of particle number concentrations for the three size ranges, where the red, blue, and black lines represent the monthly percentage contribution to total particle number concentration of nucleation, Aitken, and accumulation ranges, respectively.

Figure 3.
Particle number size distributions average over all years during different seasons (a), during workdays and weekends (b), and workdays/weekends ratio (c). Vertical bars represent the standard errors that are comparable with the size of symbols in part (a,b).
Figure 3.
Particle number size distributions average over all years during different seasons (a), during workdays and weekends (b), and workdays/weekends ratio (c). Vertical bars represent the standard errors that are comparable with the size of symbols in part (a,b).

Figure 4.
Average daily trend of size distribution.

Figure 5.
Temporal evolution of particle number concentrations, averaged on workdays (blue dots) and weekends (red dots), separately for each year and the whole measurement period. Vertical bars represent standard errors.
Figure 5.
Temporal evolution of particle number concentrations, averaged on workdays (blue dots) and weekends (red dots), separately for each year and the whole measurement period. Vertical bars represent standard errors.

Figure 6.
Temporal evolution of particle number concentration of NNUC (black dots), NAIT (blue dots), and NACC (red dots) over the four seasons, averaged over five years. Vertical bars represent standard errors.
Figure 6.
Temporal evolution of particle number concentration of NNUC (black dots), NAIT (blue dots), and NACC (red dots) over the four seasons, averaged over five years. Vertical bars represent standard errors.

Figure 7.
Correlation of monthly average PM2.5 concentration with particle number concentrations in the different size ranges (from left to right NNUC, NAIK, and NACC). The graphs include a linear fit.
Figure 7.
Correlation of monthly average PM2.5 concentration with particle number concentrations in the different size ranges (from left to right NNUC, NAIK, and NACC). The graphs include a linear fit.

Figure 8.
Monthly variations in temperature, relative humidity, wind speed, and rain accumulation observed in Lecce during the five-year measurements. Vertical bars represent the standard deviations.
Figure 8.
Monthly variations in temperature, relative humidity, wind speed, and rain accumulation observed in Lecce during the five-year measurements. Vertical bars represent the standard deviations.

Figure 9.
Pollution roses for each class of particle number concentrations, NTOT, NACC, NAIT, and NNUC measured during the five-year period. Vertical color bars represent the number concentration.
Figure 9.
Pollution roses for each class of particle number concentrations, NTOT, NACC, NAIT, and NNUC measured during the five-year period. Vertical color bars represent the number concentration.


Table 1.
Yearly averages ± 1 standard deviation and medians (25th–75th) percentiles of the total, accumulation, Aitken, and nucleation number concentrations (cm−3).
Table 1.
Yearly averages ± 1 standard deviation and medians (25th–75th) percentiles of the total, accumulation, Aitken, and nucleation number concentrations (cm−3).
| 2015 | 2016 | 2017 | 2018 | 2019 | |
|---|---|---|---|---|---|
| NACC | (2.4 ± 2.4) × 103 1650 (1000–2780) | (2.0 ± 2.3) × 103 1190 (715–2130) | (2.2 ± 2.0) × 103 1620 (963–2660) | (2.1 ± 2.1) × 103 1570 (950–2500) | (1.9 ± 1.6) × 103 1550 (967–2310) |
| NAIT | (4.3 ± 3.3) × 103 3230 (2090–5270) | (3.8 ± 3.2) × 103 2760 (1740–4660) | (4.2 ± 3.2) × 103 3270 (2120–5290) | (4.1 ± 3.3) × 103 3020 (1990–4950) | (3.8 ± 2.8) × 103 3000 (2000–4680) |
| NNUC | (1.1 ± 1.8) × 103 644 (324–1310) | (1.2 ± 2.2) × 103 614 (313–1250) | (2.1 ± 3.0) × 103 1222 (621–2470) | (1.6 ± 2.5) × 103 888 (446–1780) | (1.8 ± 2.6) × 103 1060 (553–2120) |
| NTOT | (7.8 ± 5.8) × 103 6020 (3970–9510) | (7.0 ± 5.9) × 103 5010 (3160–8540) | (8.5 ± 6.2) × 103 6730 (4410–10,700) | (7.8 ± 6.0) × 103 5900 (3960–9400) | (7.5 ± 5.2) × 103 6100 (4170–9210) |
Table 2.
Seasonal averages ±1 standard deviation and median (25th–75th) percentiles of the accumulation, Aitken, nucleation, and total number concentrations (cm−3).
Table 2.
Seasonal averages ±1 standard deviation and median (25th–75th) percentiles of the accumulation, Aitken, nucleation, and total number concentrations (cm−3).
| Spring | Summer | Autumn | Winter | |
|---|---|---|---|---|
| NACC | (1.8 ± 1.5) × 103 1290 (793–2130) | (2.0 ± 1.1) × 103 1750 (1230–2470) | (2.1 ± 2.0) × 103 1570 (891–2660) | (3.1 ± 3.6) × 103 1450 (764–3840) |
| NAIT | (3.7 ± 2.7) × 103 2980 (1940–4720) | (3.2 ± 2.1) × 103 2730 (1880–4060) | (4.3 ± 3.4) × 103 3270 (2080–5450) | (5.5 ± 4.5) × 103 4000 (2340–7430) |
| NNUC | (1.4 ± 2.0) × 103 775 (387–1590) | (1.6 ± 2.3) × 103 799 (403–1660) | (1.8 ± 2.5) × 103 1030 (500–2100) | (1.6 ± 2.0) × 103 934 (467–1850) |
| NTOT | (6.9 ± 4.8) × 103 5530 (3580–8700) | (6.8 ± 4.0) × 103 5660 (3980–8370) | (8.2 ± 6.1) × 103 6390 (4210–10,400) | (10.2 ± 8.0) × 103 7370 (4260–14,000) |
© 2020 by the authors. Licensee MDPI, Basel, Switzerland. This article is an open access article distributed under the terms and conditions of the Creative Commons Attribution (CC BY) license (http://creativecommons.org/licenses/by/4.0/).
Share and Cite
MDPI and ACS Style
Dinoi, A.; Conte, M.; Grasso, F.M.; Contini, D. Long-Term Characterization of Submicron Atmospheric Particles in an Urban Background Site in Southern Italy. Atmosphere 2020, 11, 334. https://0-doi-org.brum.beds.ac.uk/10.3390/atmos11040334
AMA Style
Dinoi A, Conte M, Grasso FM, Contini D. Long-Term Characterization of Submicron Atmospheric Particles in an Urban Background Site in Southern Italy. Atmosphere. 2020; 11(4):334. https://0-doi-org.brum.beds.ac.uk/10.3390/atmos11040334
Chicago/Turabian StyleDinoi, Adelaide, Marianna Conte, Fabio M. Grasso, and Daniele Contini. 2020. "Long-Term Characterization of Submicron Atmospheric Particles in an Urban Background Site in Southern Italy" Atmosphere 11, no. 4: 334. https://0-doi-org.brum.beds.ac.uk/10.3390/atmos11040334
Note that from the first issue of 2016, this journal uses article numbers instead of page numbers. See further details here.