Evaluating Temperature Measurements of the iMET-XQ, in the Field, under Varying Atmospheric Conditions


1
Department of Earth Sciences, University of South Alabama, 5871 USA North Drive, Mobile, AL 36688, USA
2
Department of Mechanical Engineering, University of South Alabama, 307 University Blvd North, Mobile, AL 36688, USA
3
Department of Mathematics and Statistics, University of South Alabama, 411 University Blvd North, Mobile, AL 36688, USA
*
Author to whom correspondence should be addressed.
Atmosphere 2020, 11(4), 335; https://0-doi-org.brum.beds.ac.uk/10.3390/atmos11040335
Submission received: 25 February 2020
/
Revised: 17 March 2020
/
Accepted: 20 March 2020
/
Published: 30 March 2020
(This article belongs to the Special Issue Applications of Small Unmanned Aerial Systems (sUAS) in Atmospheric Chemistry and Physics)
Abstract
:Temperature measurements of InterMET Inc. aluminum-coated iMET-XQ sensors were tested in an outdoor setting under a variety of solar radiation and wind speed conditions. Twelve unshielded sensors were mounted side-by-side on the tower of a South Alabama Mesonet weather station next to a reference sensor on the tower. The iMET-XQ temperatures were most precise and accurate in solar radiation values that were close to zero, regardless of wind speed. Under overcast conditions, wind speeds of 2 m s−1 were sufficient to obtain precise and accurate temperature measurements. During the day-time, aspiration of wind speeds higher than or equal to 3 m s−1 is sufficient. An iMET-XQ was placed in a radiation shield next to the tower reference sensor to test the need for a radiation shield. A second iMET-XQ was placed unshielded on the tower. The iMET-XQ sensors with aluminum coating do not need to be shielded, but they do need to be aspirated. It is recommended that, when taking temperature measurements using unmanned aerial vehicles (UAV) with iMET-XQ sensors, the UAV either fly at 3 m s−1, be embedded in winds of those speeds, or to use the propeller wash of the UAV to aspirate the sensors.
1. Introduction
By providing sources of energy, the atmospheric boundary layer (ABL) plays a major role in the development of many meteorological phenomena, including convective initiation and tornado-genesis [1]. For example, knowledge of the ABL stability and strength of the inversion at the top of the ABL are critical in severe weather prediction [2]. Improved observational coverage of the ABL will (1) provide better input for numerical weather models, (2) contribute to the improvement of ABL parameterizations, and (3) increase the understanding of ABL processes. Unfortunately, the current observations of the ABL are inadequate. Towers do not reach high enough [2,3]; 10 m is standard, although towers as high as 300 m exist [4]. Rawinsondes (or weather balloons) only provide a snapshot of the ABL, because they are only typically released twice daily [2]. Weather balloons also ascend too rapidly through the lowest levels of the ABL [3] and the location of the vertical profiles is dependent on atmospheric conditions [5]. Furthermore, the sensor package is typically not recoverable for reuse [3]. Surface-based remote sensing instruments, like microwave radiometers, wind profilers, and sodars, provide vertical profiles at a single point and, therefore, do not provide good horizontal resolution [2]. The same applies to tethered balloons. Surface-based remote sensing instruments also have difficulty resolving thermodynamic fields near the surface [2,6]. Radar provides good horizontal coverage, but it might overshoot the ABL and does not provide thermodynamic information (temperature and relative humidity). Satellite remote sensors can measure vertical thermodynamic and kinematic profiles with good horizontal coverage, but vertical resolutions in the ABL are too coarse [3].
An advantage of small unmanned aerial vehicles (UAV)s is their ability to fly in airspaces or situations that are too difficult or dangerous for manned aircraft, such as, for example, in and around thunderstorms [7] or at low altitude [8]. UAVs are perfectly suited for taking observations in sensitive ecosystems [5]. An advantage of rotary wing UAVs over their fixed-wing cousins is their capability to (1) hover; (2) ascend vertically at a fixed horizontal location [3,7]; and, (3) land on a small spatial footprint [3]. Other scenarios where UAVs can play a role in atmospheric sensing are (1) to determine atmospheric stability and wind characteristics in the event of dangerous gas releases [1,5]; (2) monitoring freezing conditions around temperature-sensitive crops, like citrus; (3) investigating micro-climates in farm fields for precision agriculture; and, (4) observing the structure of meteorological phenomena, like sea breezes and cold fronts.
The recent development of low-cost, easy to use small UAV, and miniaturized thermodynamic sensors have enormous potential to help close the gap in ABL observations [2,3,6]. With the development of UAV technology, however, comes the need to improve knowledge of best practices for accurate measurement [7]. The calibration of meteorological sensors is performed under controlled laboratory conditions [9]. However, calibration or reliance on manufacturer specifications is not sufficient for determining the accuracy and reliability of atmospheric measurements that are made by UAVs, because they do not account for the impacts of turbulence, solar heating, sensor placement on the platform, and how accurately the actual atmosphere is represented.
Therefore, validating sensors that are intended for the use on UAVs is another critical step towards acquiring accurate UAV-based measurements [9]. Validation is performed by comparing measurements from UAV sensors to collocated measurements from independent instruments of generally accepted high quality. Several researchers have recently investigated the validation of sensors in laboratory and field settings, as well as optimal sensor placement on the UAV platform as a function of external (to the sensor) heating sources and aspiration. The results from laboratory and stationary field testing are addressed here. Optimal sensor placement on the UAV will be examined in a companion paper. Only the results from prior temperature sensor comparisons are summarized here.
In [2], the accuracy and precision of the International Met Systems Inc.’s iMET-XQ sensor was evaluated. The iMET-XQ sensors used were the original version without the aluminum coating. First, the accuracy of the sensors was assessed by comparing the iMET-XQ temperature measurements with a National Institutes for Standards and Technology (NIST)-traceable Thermometrics platinum resistance thermometer (PRT) standard, in a calibration chamber. In the chamber, three temperature (T = 10, 20, and 30 °C) and five relative humidity (RH = 20, 40, 60, 80, and 94%) set points were used, for a total of 15 Temperature/Relative Humidity (T/RH) combinations. Three iMET-XQ sensors were tested, and a fan aspirated the chamber. The authors reported “the temperature measurements from all three iMET-XQ sensors were typically within ±0.1 °C of the NIST-traceable Thermometrics PRT standard”. They noted a cool bias in the iMET-XQ measurements of up to 0.3 °C at low temperature and RH combinations, most notably at the 10 °C and 20% RH set point. It was concluded that the chamber measurements from the iMET-XQ sensors were within manufacturer specifications (accuracy of ±0.3 °C).
Next, ref. [2] conducted field experiments on an instrumented tower. The experiments took place at a site near Knoxville, Tennessee. The iMET-XQ measurements were compared to an aspirated Thermometrics PRT. The iMET-XQ sensors were installed inside a radiation shield on the tower, at 2 m above ground level (AGL), adjacent to the PRT. When none of the sensors were aspirated, the correlation coefficient (r) between the iMET-XQ and tower sensor temperature measurements was 0.95. When all of the sensors were aspirated, r dropped slightly to 0.94, but this could be due to random error. It was not reported how long the experiments lasted, how many experiments were conducted, or what time of year they took place. Temperature difference statistics were not reported.
The iMET-XQ temperature sensors are bead thermistors. Thermistors can suffer from self-heating when a current is continually run through them [3]. In ref. [3], an experiment to assess the effects from thermistor self-heating was conducted. A fan, pulling air across three iMET-XF PT 100 thermistors at 6 m s−1, was alternately switched on and off for periods of 2–3 min each. The experiment took place in an indoor chamber. After the fan was turned on, the temperatures measured by the iMET-XQ thermistors dropped over 1 °C in under 20 s. After the fan was off, the sensors measured a temperature increase. It is concluded that this heating was due to a combination of sensor self-heating and the fan motor radiating heat towards the sensors. Proper aspiration can minimize the thermistor self-heating bias [3,6].
In ref. [6], chamber experiments to assess the bias (accuracy) and precision of iMET-XF PT 100 thermistors were conducted, as well as the effects from using aspirated shields. Three sensors were placed inside an aspirated L-duct, inside a chamber. The temperature was varied between 10 and 30 °C, changing 10 °C every hour. Three more sensors were placed in an aspirated chamber, in which the temperature varied over a larger range: −40 to 60 °C, changing by 10 °C every ten minutes. Linear temperature biases were obtained for each thermistor by comparing 1-min. averaged measurements to National Institute of Standards and Technology (NIST) traceable sensors. Additionally, 1-s temperature averages were used to compute mean absolute temperature differences (MATD) between the sensors themselves, while taking the previously determined sensor biases into account. This was done for every 1-s interval to obtain a distribution of MATDs (their formula 1). For the L-duct sensors, the entire MATD distribution was below 0.09 °C with an interquartile range (IQR) of 0.06 °C. Therefore, it was concluded that the sensors in the L-duct are highly precise under steady-state conditions with constant fan aspiration. For the rotor arm sensors, 95% of the MATDs were below 0.12 °C with an IQR of 0.05 °C. The reason for this distribution to be more skewed was attributed to the larger temperature range to which the sensors were subjected in the chamber.
Past studies have explored the importance of aspiration of UAV-based sensors in radiation shields, because radiation shields or other sensor enclosures may warm in sunny conditions. In [7], measurements from many different UAVs and multiple sensor types and configurations were compared to measurements from an 18 m tower. Some of the temperature sensors were aspirated (by rotorwash), some were shielded, some were neither, and some were both. Temperature measurements from shielded, but unaspirated, sensors showed the warmest bias when compared to the reference on the tower, sensors that were neither shielded nor aspirated showed a slightly smaller warm bias, and sensors that were both shielded and aspirated reported the smallest warm bias (their Figure 10). Sensors that were unshielded but aspirated showed a small cool bias. In [10], the sensors were mounted underneath the body of a rotary wing UAV; this way, the sensors were shielded from solar radiation. Aspiration came from the motion of the UAV relative to the air (it ascended and descended at a rate of 3.0 m s−1). The measurements were compared to sensors on a tethered weather balloon [11]. The maximum deviations between the UAV and balloon measurements did not exceed manufacturer specified accuracy figures.
From prior chamber experiments, it was concluded that the iMET-XQ temperature measurements were within the manufacturer specified accuracy of a NIST-traceable standard [2]. Hence, chamber experiments will not be repeated in the current study. It was also reported that thermistors are prone to self-heating, but this can be mitigated by proper aspiration [3,6]. No guidelines were given to define ‘proper’, for example, an air flow speed. To our knowledge, in the past, only one experiment was conducted with iMET-XQ sensors in a stationary location on an instrumented tower [2]. However, this experiment involved only iMET-XQ sensors in a radiation shield and results from varying weather conditions were not addressed.
In this study, aluminum coated iMET-XQ sensors were used to address their accuracy and precision in a stationary position on an instrumented tower, while being subjected to varying weather conditions. A large number of experiments were conducted to include a wide variety of solar radiation and wind conditions. Unexposed temperature measurements are compared to shielded measurements to assess the need for a radiation shield, given that the iMET-XQ sensor is aluminum coated. Past studies have confirmed that radiation shields may warm under sunny conditions [6,11], therefore, the aluminum coating may be a good alternative.
2. Data and Methodology
In this study, the performance of the iMET-XQ (InterMET Inc.) temperature sensor under various weather conditions is evaluated. It is intuitively obvious and has been well documented in the literature [12] that the accuracy of temperature sensors decreases when exposed to direct sunlight. The versions of the iMET-XQ sensors that were used in these experiments are coated in aluminum to reduce warming effects from solar and terrestrial radiation. This is based on radiosonde technology; radiosondes are ventilated by the relative airflow during flight [13,14]. The manufacturer specified accuracy of the iMET-XQ bead thermistor sensor is ±0.3 °C and the response time is two seconds.
All of the experiments were conducted at the South Alabama Mesonet [15] weather station on the campus of the University of South Alabama. The tower has temperature sensors at four levels: 1.5, 2, 9.5, and 10 m AGL. The sensors at 1.5 and 9.5 m are a model 107 thermistor probe from Campbell Scientific Inc. with a manufacturer stated accuracy of ±0.4 °C for a temperature range of −24 to 48 °C. At 2 m and 10 m, HMP45C (Campbell Scientific Inc.) platinum resistance temperature detectors are used. The accuracy of this sensor ranges between ±0.2 °C at 20 °C and ±0.3 °C at 40 °C and 0 °C. All temperature sensors are housed in radiation shields that are aspirated by the wind. Wind speed is measured at two levels (2 and 10 m) by R. M. Young 05103 propeller wind monitors. Solar radiation is measured by a Li-Cor LI200R-PT pyranometer and vertical wind speed is measured at 10 m while using an R.M. Young 27016T propeller anemometer. The tower temperature and wind speed measurements are minute averages. The iMET-XQ 1 Hz measurements are averaged over corresponding minutes in order to calculate consistent temperature differences and to quantify statistical relationships with meteorological parameters. Pyranometer measurements are taken once per minute at the beginning of each minute. Vertical windspeed measurements consist of an instantaneous measurement at the beginning of each minute, as well as a minimum and maximum measurement during each minute. To obtain an approximation of a minute average, the absolute values of the minimum, maximum, and instantaneous vertical wind speed measurements are averaged each minute.
The experiments were conducted in the spring of 2018 and 2019 and in the summer of 2019. Two sets of experiments were conducted to evaluate the performance of the iMET-XQ: (1) Tower and (2) Radiation Shield experiments (details below). Table 1 and Table 2 list dates and other information for each set of experiments.
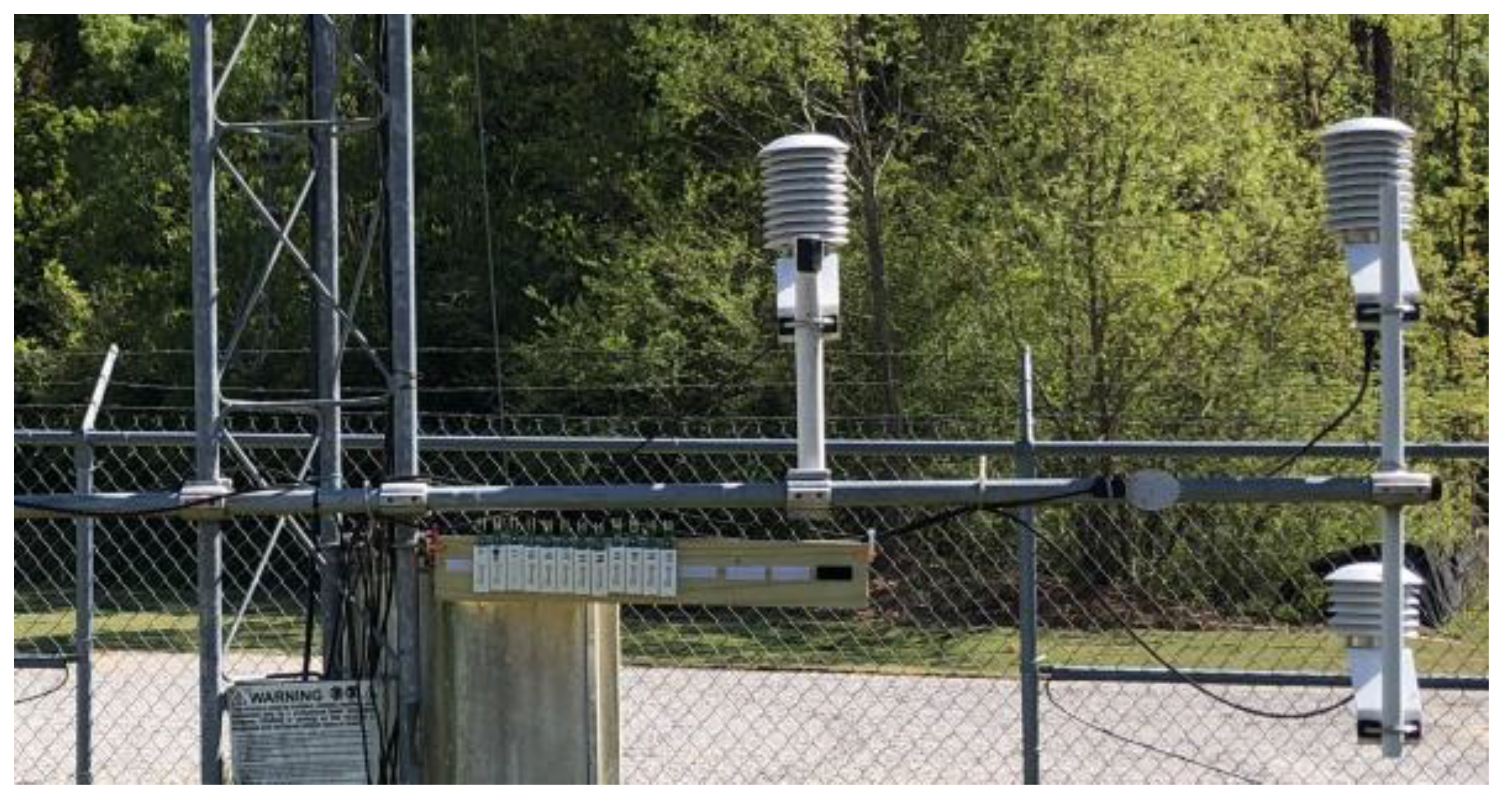
The goal of the Tower experiments is to assess iMET-XQ accuracy and precision, in a fixed location, under various weather conditions. Twelve different iMET-XQ sensors were placed side-by-side on a wooden board suspended, facing north, from the 2 m cross-arm of the Mesonet tower (Figure 1). In this manner, their elevation was almost equivalent to the 1.5 m thermistor on the tower. Hence, this sensor will function as the standard reference sensor to which the iMET-XQ temperatures are compared to assess the accuracy. The iMET-XQ sensors are inter-compared with one-another to assess the precision of the iMET-XQ temperature sensors. The closer the measurements are to one another, the more precise the sensors are. Since 12 iMET-XQ sensors were used, there are 66 possible unique pairs of iMET-XQ sensors. The iMET-XQ sensors are not compared to themselves. The iMET-XQ sensors were given numbers for easy identification.
In the Radiation Shield experiments, one iMET-XQ was placed in an identical radiation shield as that used for the 2 m HMP-45C temperature sensor to assess the need for a radiation shield on the aluminum-coated iMET-XQ sensors. The radiation shields were located 76 cm apart, at the same height, on the 2 m cross-arm of the Mesonet tower. An exposed -XQ sensor was placed next to the shielded iMET-XQ sensor, at the same height. Figure 1 and Figure 2 show the configuration. The same two iMET-XQ sensors were used in each of the 16 Radiation Shield experiments. The iMET-XQ temperature measurements were compared to the HMP-45C temperature measurements.
Data Quality Control (QC)
Both iMET-XQ and tower data were quality controlled by using automated range checks. Upper and lower limits of the range tests (Table 3) were the same for both platforms. Values that were outside of these limits were set to missing. Following the automated QC range test, the timeseries of all experiments were manually reviewed for data outliers. Outliers were identified by comparison to like sensors. For temperature, these consisted of the temperatures from all iMET-XQ sensors and from the 1.5 m and 2 m tower sensors. The 2 m wind speed and direction values were compared to 10 m wind speed and direction. Solar radiation was compared to photosynthetically active radiation, also recorded by the South Alabama Mesonet. After completing the range test, it became clear that the pyranomter on the mesonet tower malfunctioned on three experiment days (18 January, 6 January, and 8 February 2019) and the data were set to missing. The same applied for iMET21’s temperature sensor, which malfunctioned (recorded large negative values) beginning on 12 March 2019. The manual like-sensor tests did not flag any extreme outliers and no data were set to missing as a result. Sometimes, the iMET-XQ sensors randomly lost Global Positioning System (GPS) connectivity, in those cases, no data were collected. The missing data include data that were discarded after the QC process as well as data missing due to loss of GPS connectivity.
3. Results
3.1. Tower Experiments
Table 1 lists the 16 Tower experiments that were conducted and presents average values (over the duration of the experiments) of various environmental and weather conditions. The number of observations (minutes) per experiment is also listed. The number of observations across the 16 experiments totals 1051. Both precision and accuracy of the iMET-XQ sensors were assessed.
It is worth mentioning that observations were not taken on a regular schedule due to limited resources. The first limitation is related to the iMET-XQ sensors themselves. The battery life on the sensors is only 1.5 h and thus once the batteries run out they must be charged. Since there were 12 separate sensors, not all of them could be simultaneously charged. Charging therefore took multiple hours where groups of iMET-XQ sensors were charged in stages. Once the sensors were charged, the data needed to be downloaded, which took about another hour. The second limitation stems from personnel. Undergraduate students were hired to perform experiments. Between driving to and from the tower, waiting at the tower, charging iMET-XQ sensors, downloading data, and processing data, every experiment took around six hours to complete. Since students are juggling classes and other activities, in the best case scenario a student would complete two to three experiments per week. Every semester, students would graduate or get a new course schedule and a new technician would need to be hired. This caused gaps in data collection (as can be seen between May 2018 and January 2019, for example), as well as varying data collection hours (which mostly depended on student class schedules). The weather was the final limitation. South Alabama, especially in the summer months, is plagued with afternoon thunderstorms and numerous amounts of rain showers. Since the iMET-XQ cannot get wet and lightning frequently occurs, many potential experiment days were canceled, leading to an irregular data collection schedule.
3.2. Precision and Accuracy–Tower Experiments
The absolute temperature difference (ATD) of all 66 unique iMET-XQ pairs was calculated to assess iMET-XQ precision. For each iMETx, the absolute temperature differences with iMETy, ATD = |iMETx − iMETy|, was calculated for all x ≠ y in the iMET-XQ pool (12 of them). Each pair is only counted once, i.e., only |iMETx − iMETy| is included, not |iMETy − iMETx|. The absolute value of the temperature difference is used, because when comparing iMET-XQ pairs, the sign of the temperature difference of the pairs does not provide meaningful information regarding over- or under-estimation of temperature measurements. For each minute in a given experiment, the ATD was calculated for each unique iMET-XQ pair, yielding an ATD distribution with a sample size of N = minutes × 66 (Table 1).
The instruments were compared to the thermistor mounted at 1.5 m on the Mesonet tower to assess the accuracy of the 12 iMET-XQ temperature sensors. In all cases, the tower temperature is subtracted from the iMET-XQ temperature, i.e., TD = TiMET − TTower. This is done for the 12 iMET-Tower pairs and all minutes in the 16 experiments. The actual temperature differences (TD) are used (not absolute values or ATD as was done for precision), so that over- or under-estimation of iMET-XQ temperatures compared to the tower sensor can be examined.
The manufacturer specified accuracy of the iMET-XQ temperature sensor is ±0.3 °C. If the difference between two sensors is twice that amount (±0.6 °C), assuming that the bias of each sensor is in the same direction, the sensors are considered precise (for iMET-XQ pairs) and accurate (for iMET-XQ versus tower sensor). The manufacturer specified accuracy of the tower thermistor is ±0.4 °C. For consistency, a difference value of 0.6 °C is employed for both precision and accuracy.
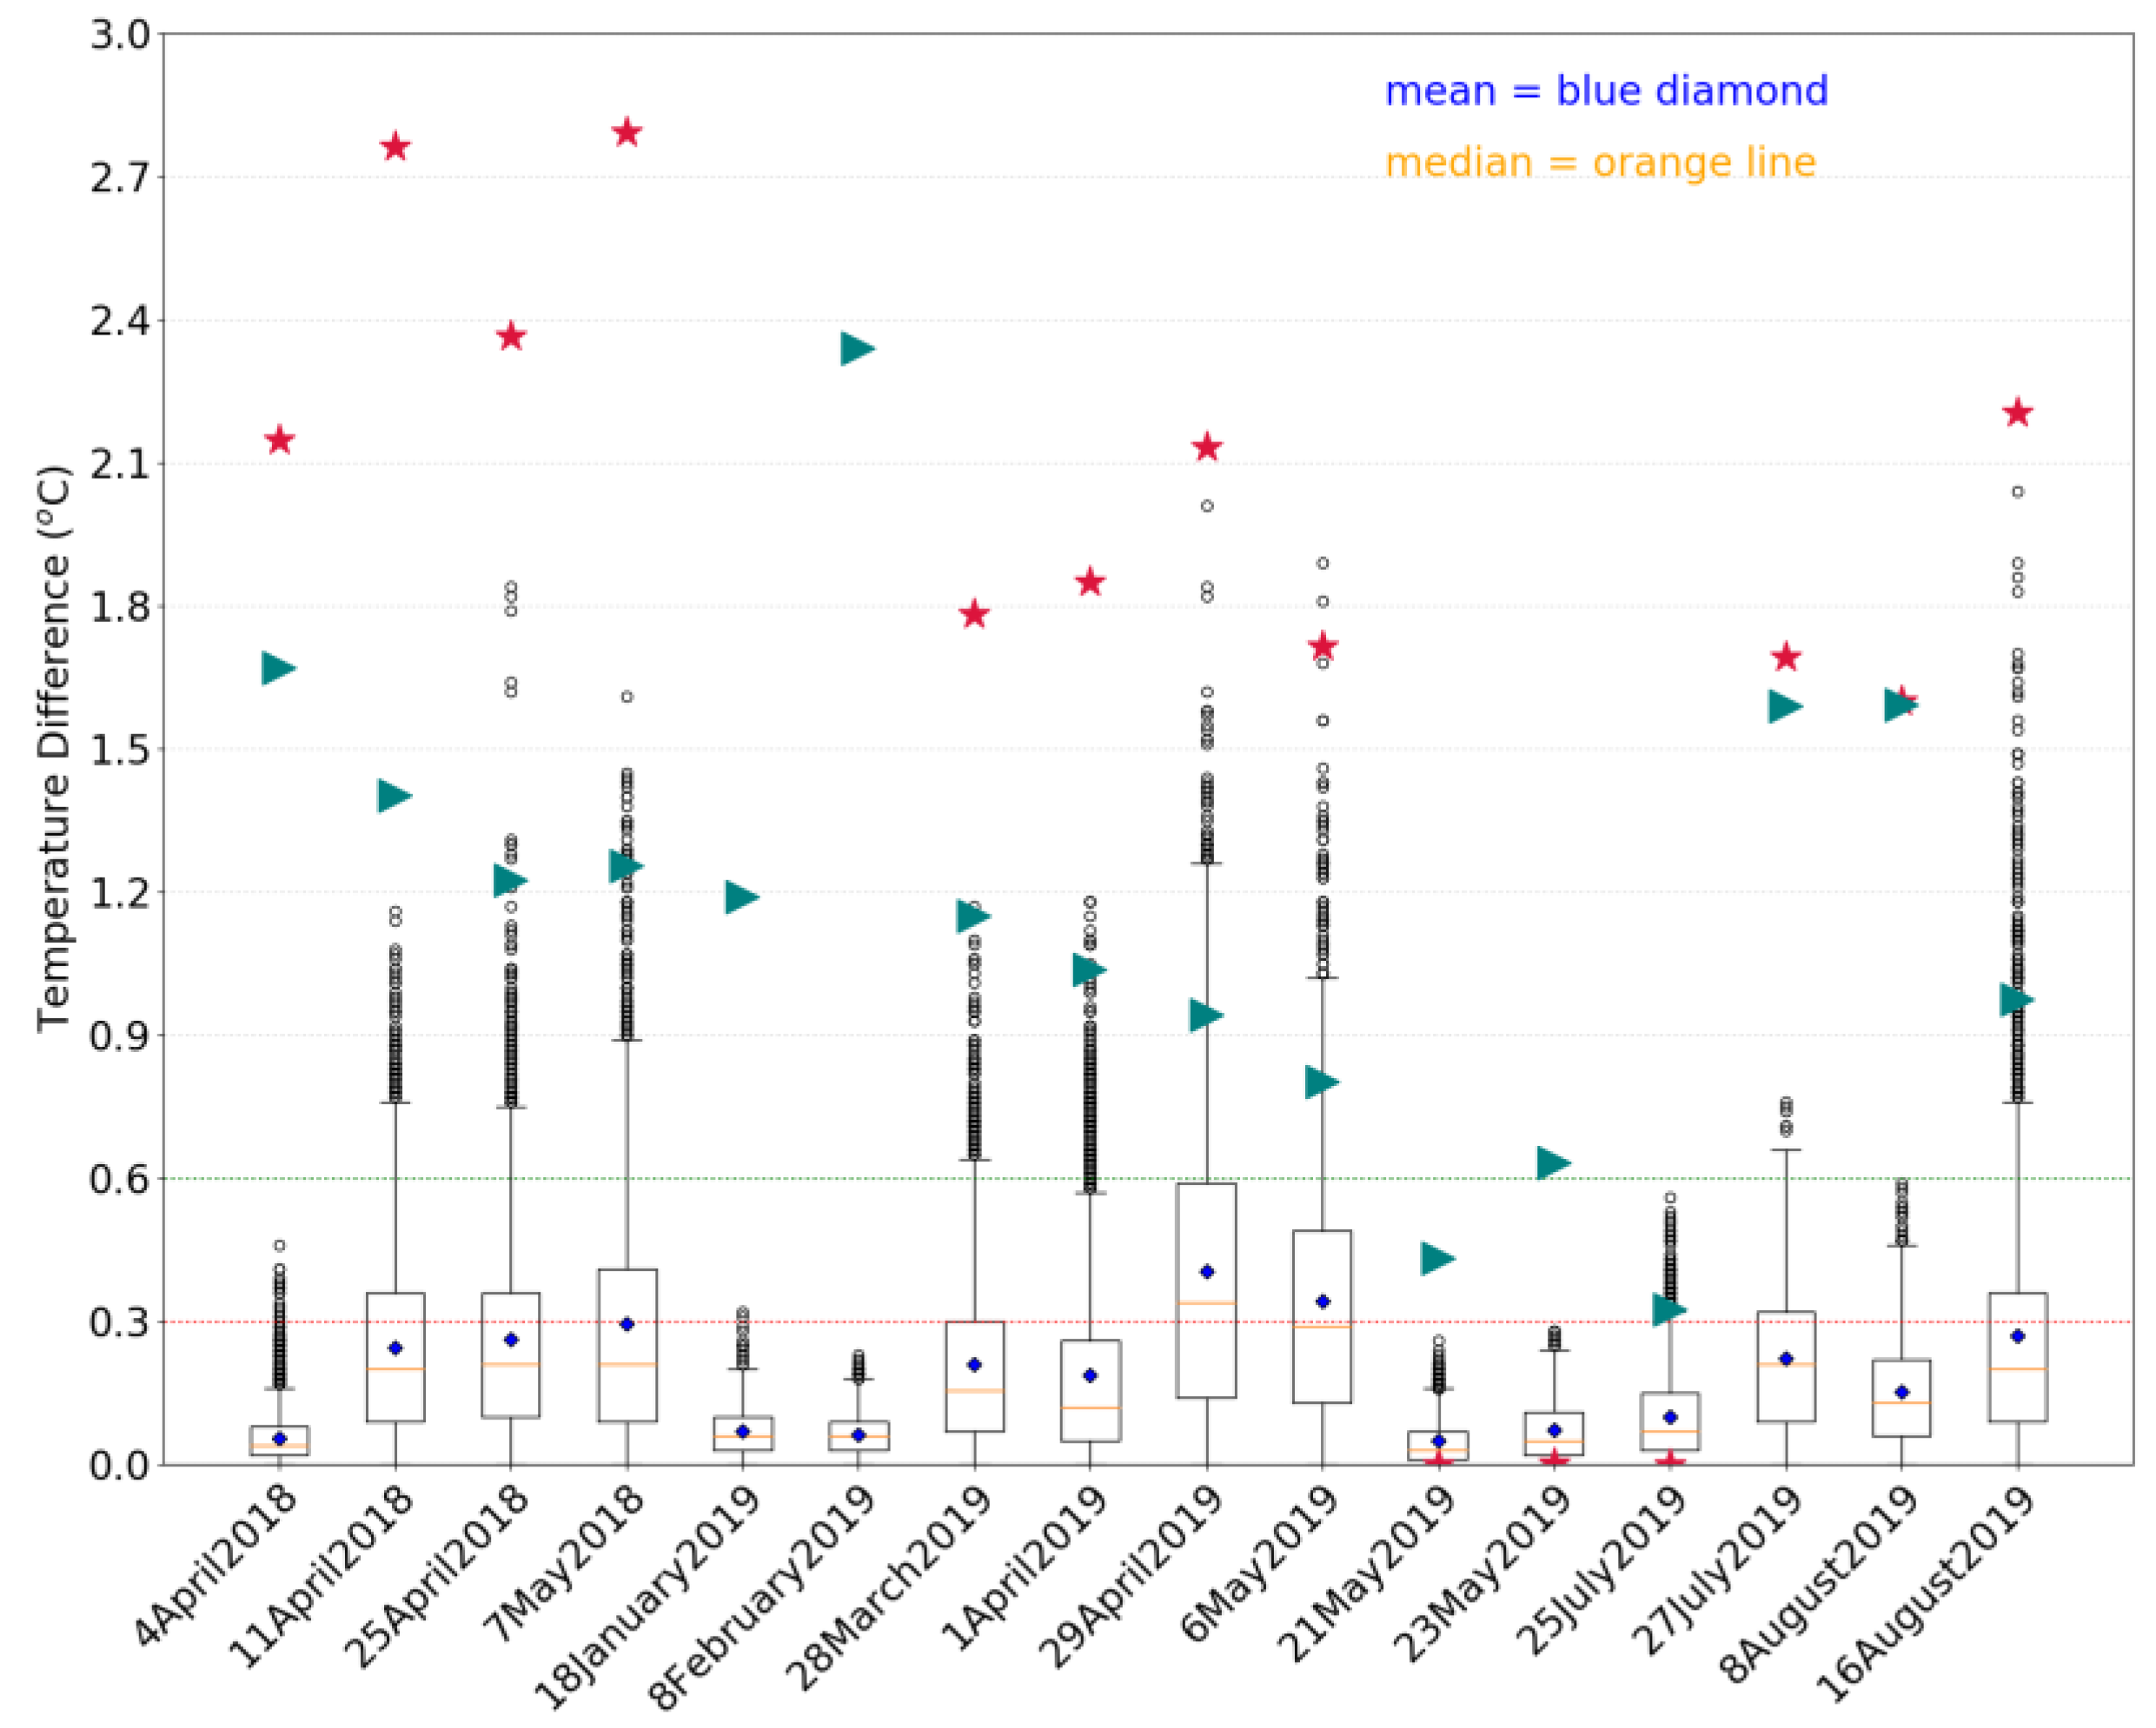
In Figure 3, the ATD distributions are shown by the experiment date, in the form of boxplots. Scaled average solar radiation values (red stars) and 2 m wind speed values (green triangles) are also shown to indicate how their relative values changed across the different experiment days. Table 1 provides the absolute values of these quantities. An overall decreasing precision with time, caused by, for example, sensor drift, is not observed in Figure 3. Excellent precision (Figure 3) and accuracy (Figure S1), with all |ATD| and |TD| values below 0.6 °C, is seen on 21 May 2019, 23 May 2019, and 25 July 2019, with all ATD’s being smaller than twice the manufacturer specified accuracy. The experiments on these days were conducted at dusk; after sunset, the solar radiation and solar elevation angle are low (Table 1). Therefore, sensor warming due to solar heating did not occur and, as a result, the iMET-XQ sensors’ precision and accuracy was high. High precision and accuracy were also observed on 8 February 2019, when the experiment-averaged 2 m wind speed was larger than 3 m s−1, apparently providing optimal sensor aspiration. Additionally, solar heating was likely low, because the solar elevation angle was relatively low (Table 1). Unfortunately, the pyranometer on the tower malfunctioned that day, but surrounding Mesonet stations recorded radiation values that were below 400 W m−2 during the time of the experiment. On the other extreme, the lowest precision and accuracy were observed on 29 April 2019 and 6 May 2019, days with relatively weak horizontal wind speeds and high solar radiation (Table 1).
It must be noted that Table 1 shows average values of meteorological conditions over the duration of the experiment. Individual minute values of solar radiation and 2 m wind speed can substantially fluctuate on some days. In the following sections, the relationships between meteorological conditions (specifically horizontal wind speed and solar radiation) on precision and accuracy are assessed on a minute-by-minute basis. These analyses will exclude the three experiments that were performed at dusk.
The vertical and horizontal wind speeds averaged over the duration of the experiments (Table 1) are weakly, yet significantly, positively correlated (R = 0.51, p = 0.0123). Indicating that, as the horizontal wind speed is larger, the vertical wind speed also tends to be larger, at least on average. However, vertical wind speed values are much smaller than horizontal wind speed and, therefore, will likely not have a significant impact on sensor aspiration.
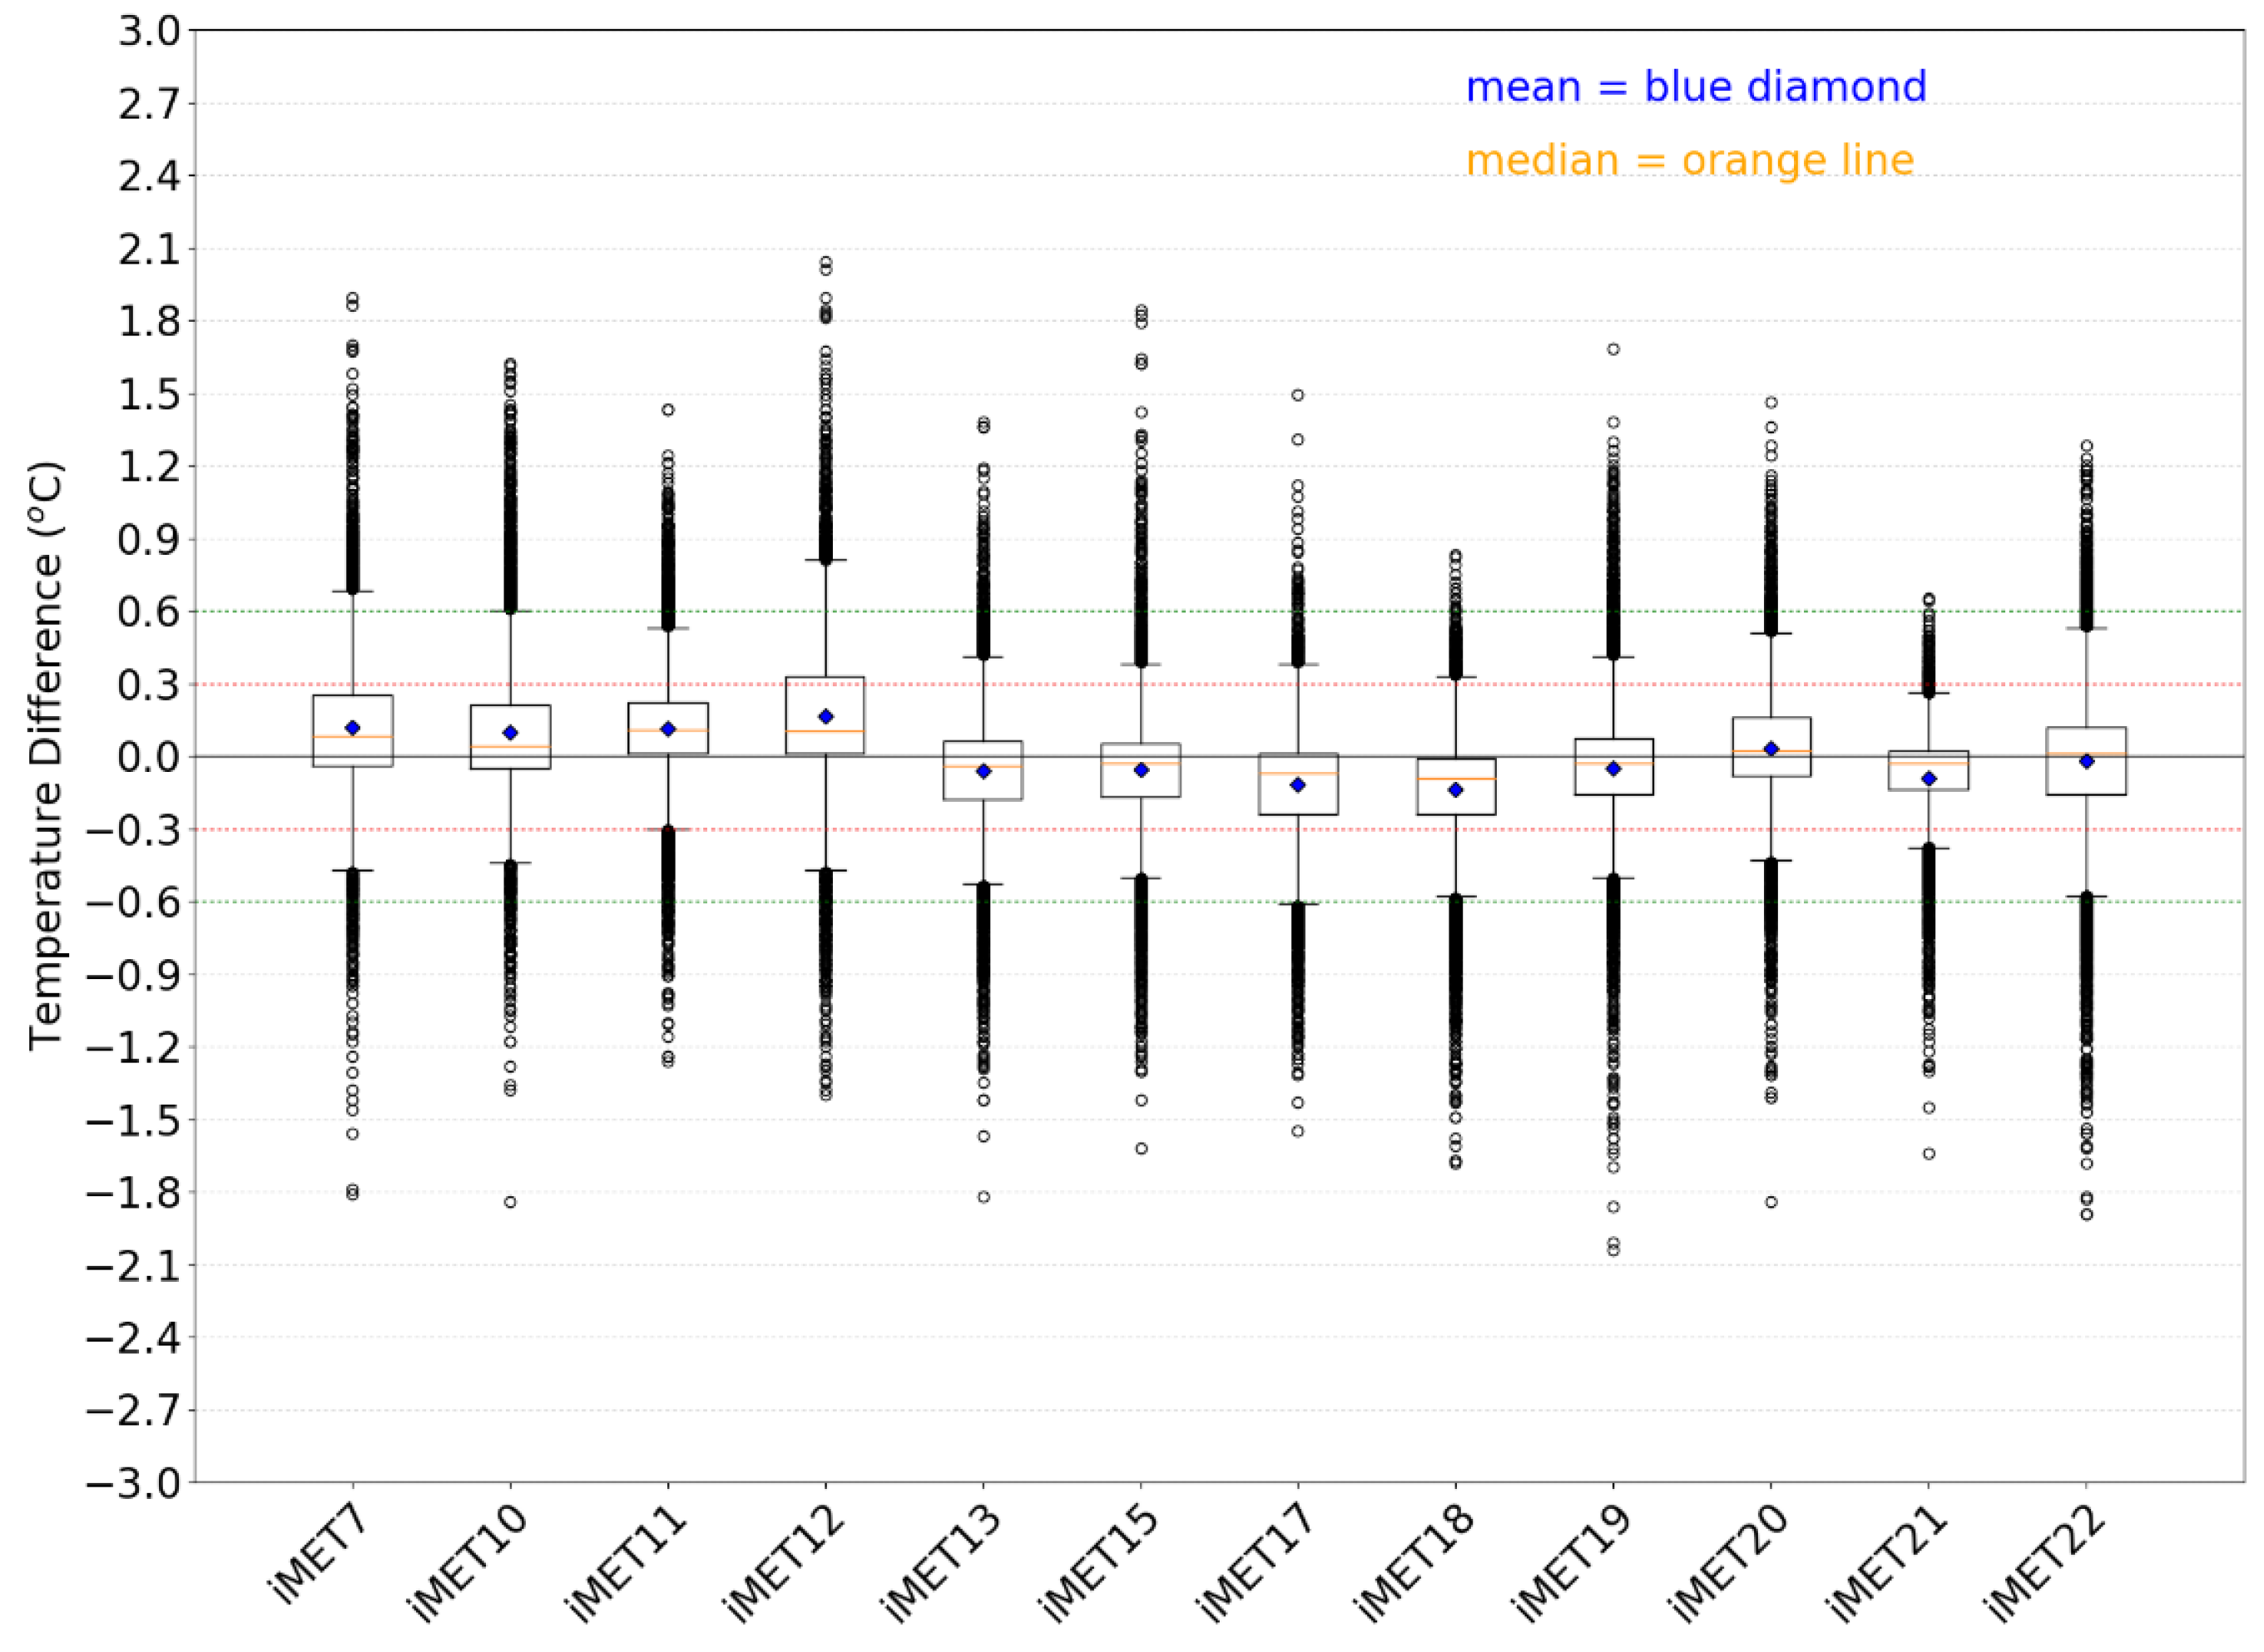
The temperature differences (TD) between each iMET-XQ sensor and all other iMET-XQ sensors are summarized in the form of boxplots to assess whether there are any warm and cold biases of individual iMET-XQ sensors (Figure 4). Figure S2 in the Supplementary Materials shows the same, but for each iMET-XQ sensor and the tower thermistor. Table 4 presents various statistics. Positive temperature differences indicate a warm bias of a given iMET-XQ as compared to the other iMET-XQ sensors and negative values indicate a cool bias. In the case of iMETs 7, 10, 11, 12, and 20, less than 50% of the data (the exact values listed in Table 4) is negative meaning that more than 50% of the data differences are positive and, therefore, these iMET-XQ sensors display a slight warm bias. In the case of iMETs 13, 17, 18, 19, and 21 more than 50% of the data is negative (exact values in Table 4), so these iMET-XQs have a small cool bias. The mean temperature difference of iMET22 is 0.01 °C, so this iMET-XQ shows little bias. The same trends are seen when comparing the iMET-XQ sensors to the tower sensor (Figure S2). However, between 90.5% and 96.31% of the absolute value of the TDs are below 0.6 °C. Furthermore, between 68% and 83.76% of the TDs are below 0.3 °C. For these reasons, the sensors are considered to be precise and the warm/cool biases are considered to be small.
3.2.1. Precision and Accuracy
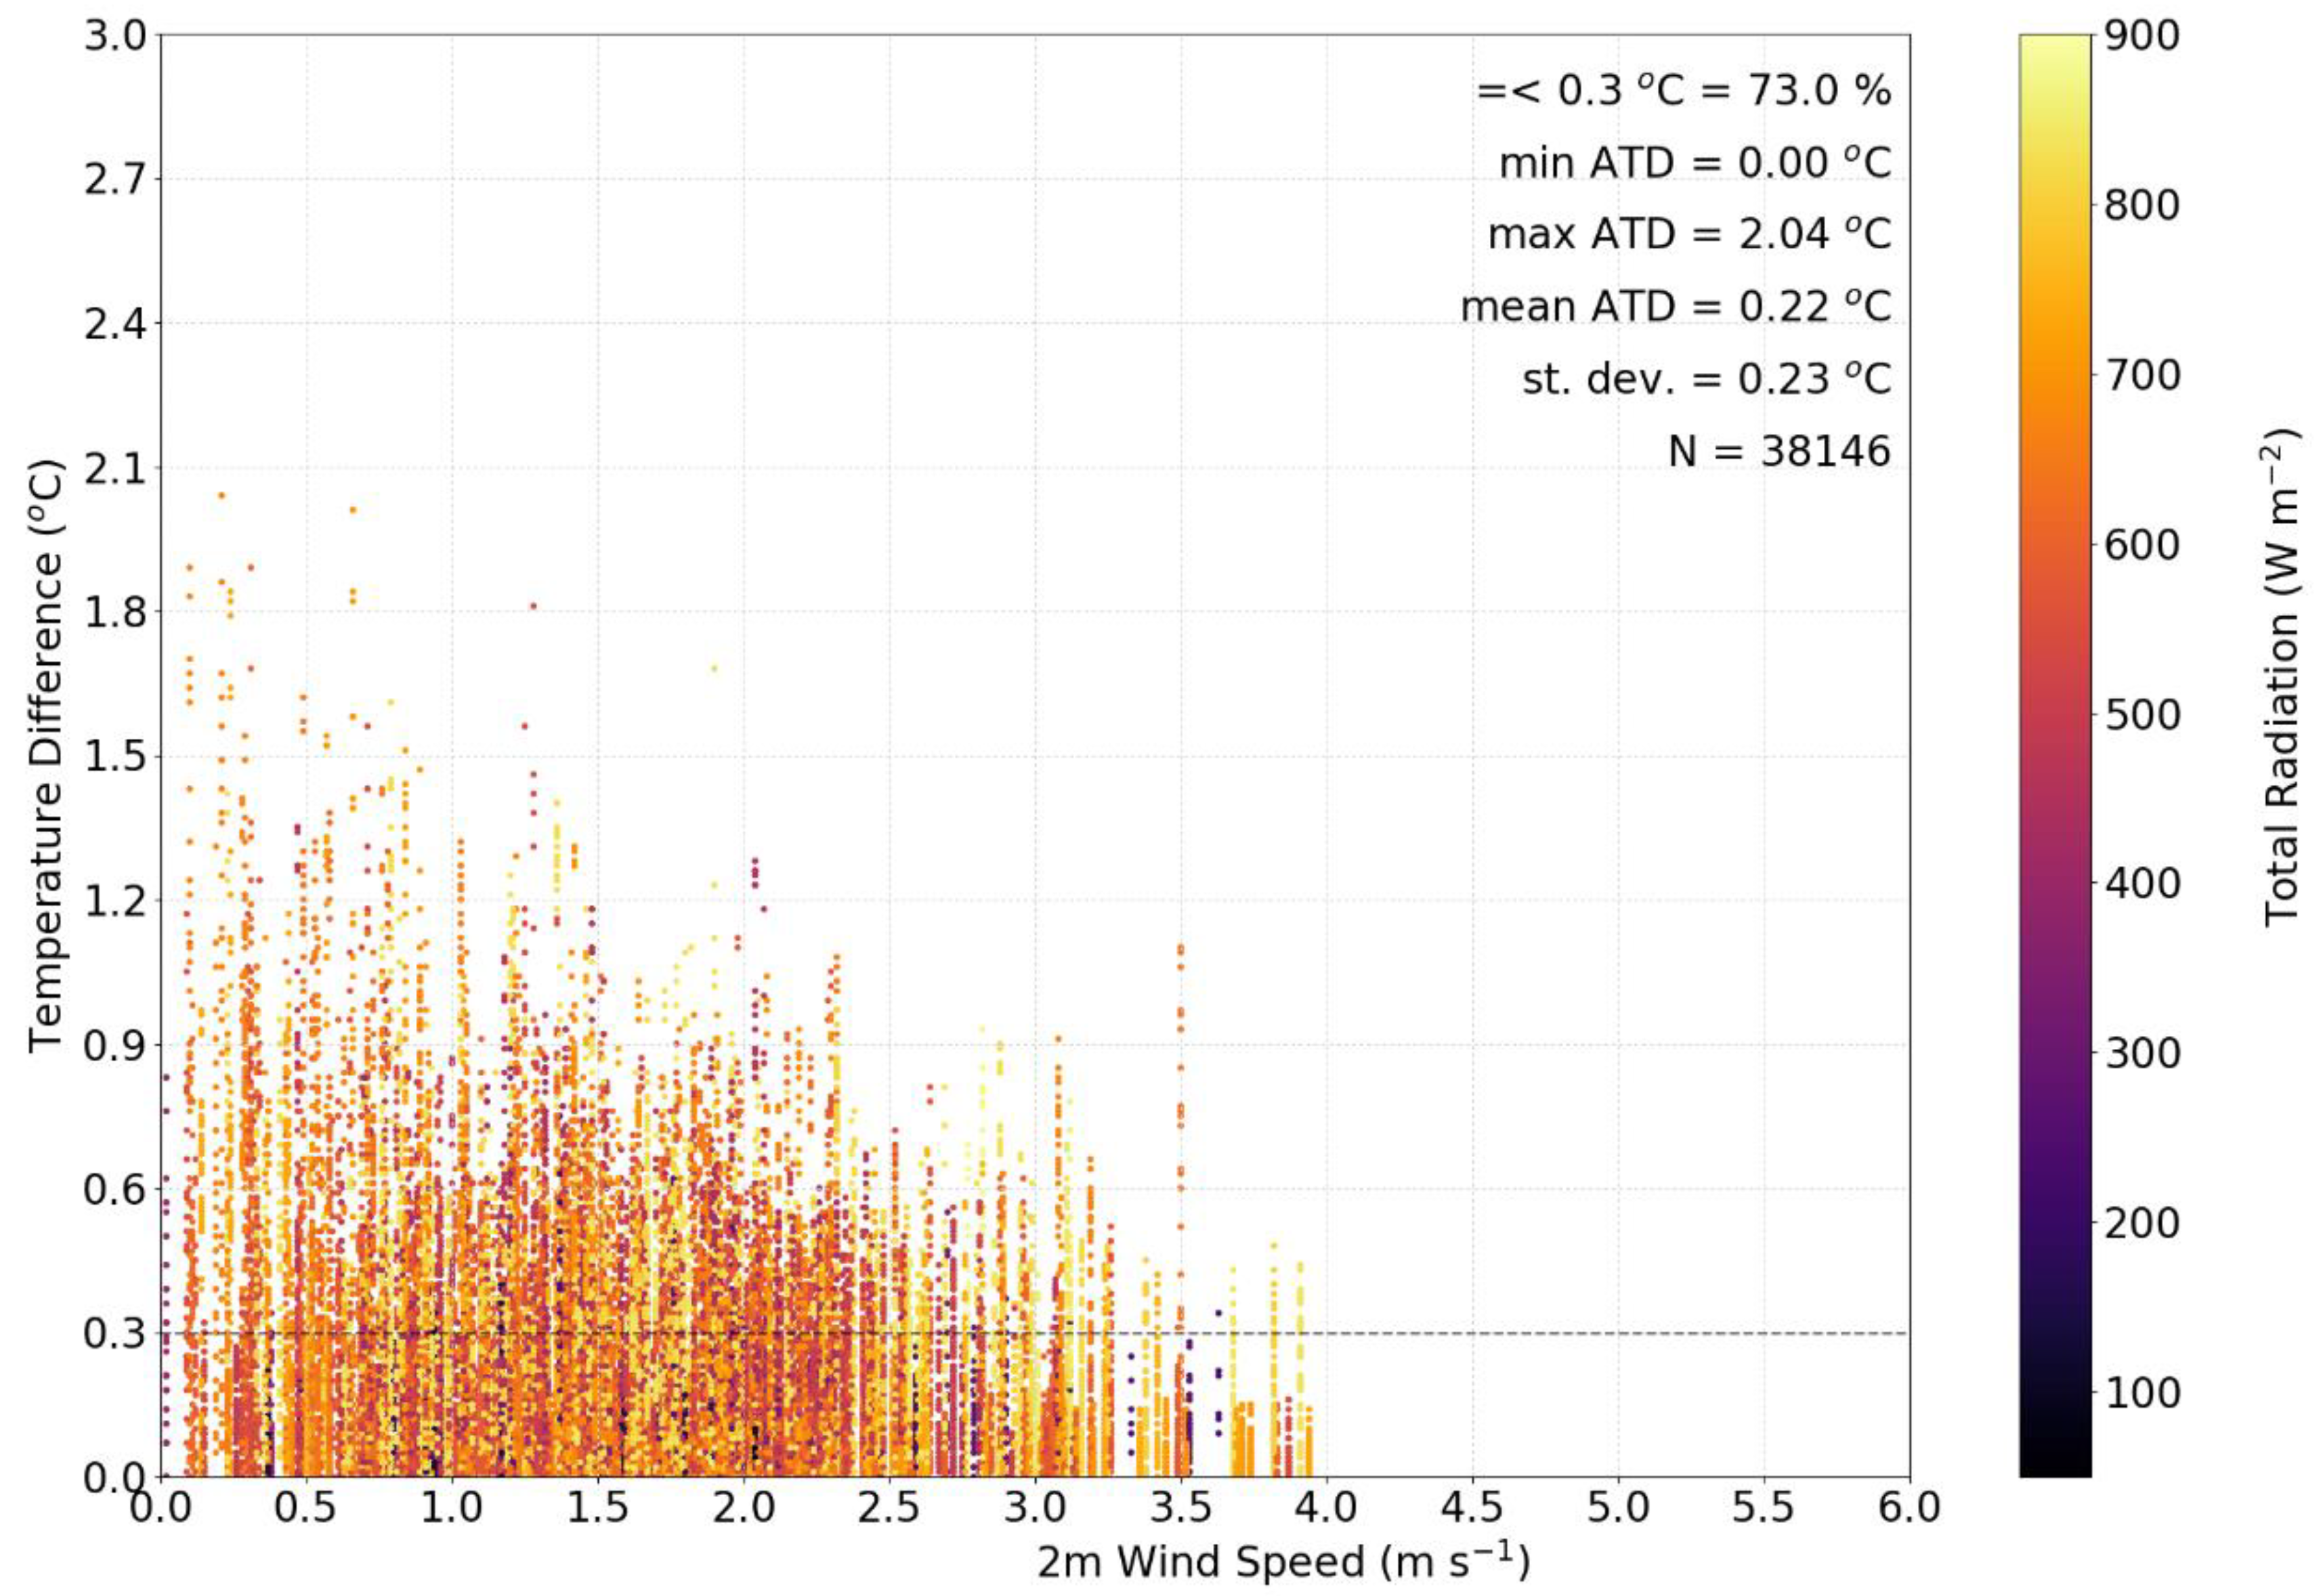
There are several outliers in Figure 4 and Figure S2, the largest of which are close to 2.0 °C. The question is what atmospheric conditions, if any, lead to these larger outliers. In Figure 5, the ATDs for all iMET-XQ pairs and all experiment days are shown as function of 2 m wind speed (along the x-axis) and solar radiation (colors). The wind speed is measured at the Mesonet tower at a height of 2 m, this is close to the iMET-XQ sensors which were mounted 1.5 m above ground level. It is clear that large ATD values occur with lower (2 m s−1 or less) 2 m wind speeds and ATD values generally decrease with increasing wind speeds. However, in weaker winds, smaller ATD values also occur, maybe these occur when the solar radiation is low. But a clear relationship between temperature differences and the intensity of solar radiation, cannot be discerned from Figure 5. Apparently, any value of solar radiation (darker purple though yellow dots) can cause the temperature difference between iMET-XQ pairs to be large in weaker winds, even if the iMET-XQ sensors are located side-by-side. Similarly, darker purple (low radiation), orange, and yellow dots (high radiation) are seen at both small and large temperature differences. The non-aspirated radiation shield that was used on the tower will cause the tower temperature sensor to also warm up in sunnier and calm conditions [12], possibly explaining the lack of a clear relationship between TD and solar radiation. The relationships of ATD and TD with solar radiation and wind speed are further explored in the following sections.
The sensitivity of the temperature difference (TD) between the iMET-XQ sensors and the 1.5 m tower sensor, as a function of zonal (u), meridional (v), and vertical (w) wind speeds, was investigated. Again, a clear relationship appeared (similar to that shown in Figure 5) where TD decreases with increasing u and v. It is noted that the largest (positive) TD values (1.8 °C and larger) were observed to occur with small positive meridional (v) wind speeds (not shown), i.e., with a southerly wind component. When augmenting the investigation to include all wind directions, it was observed that the largest TD values occurred in the southeasterly to southwesterly (135°–225°) wind direction range. Large wind speeds (above 2 m s−1) were never observed (not shown) in this range of directions. In other words, the larger TD values were the result of small wind speeds that just happened to come from a southwesterly to southeasterly direction. Wind speeds with a northerly component tend to be much stronger in the north-central Gulf Coast region and, hence, result in smaller TD values. The sensitivity of TD to vertical wind speed is non-existent, because the vertical wind speed is significantly smaller than the horizontal wind speed. Vertical wind speeds rarely exceed 1 m s−1.
3.2.2. Wind Speed Bins
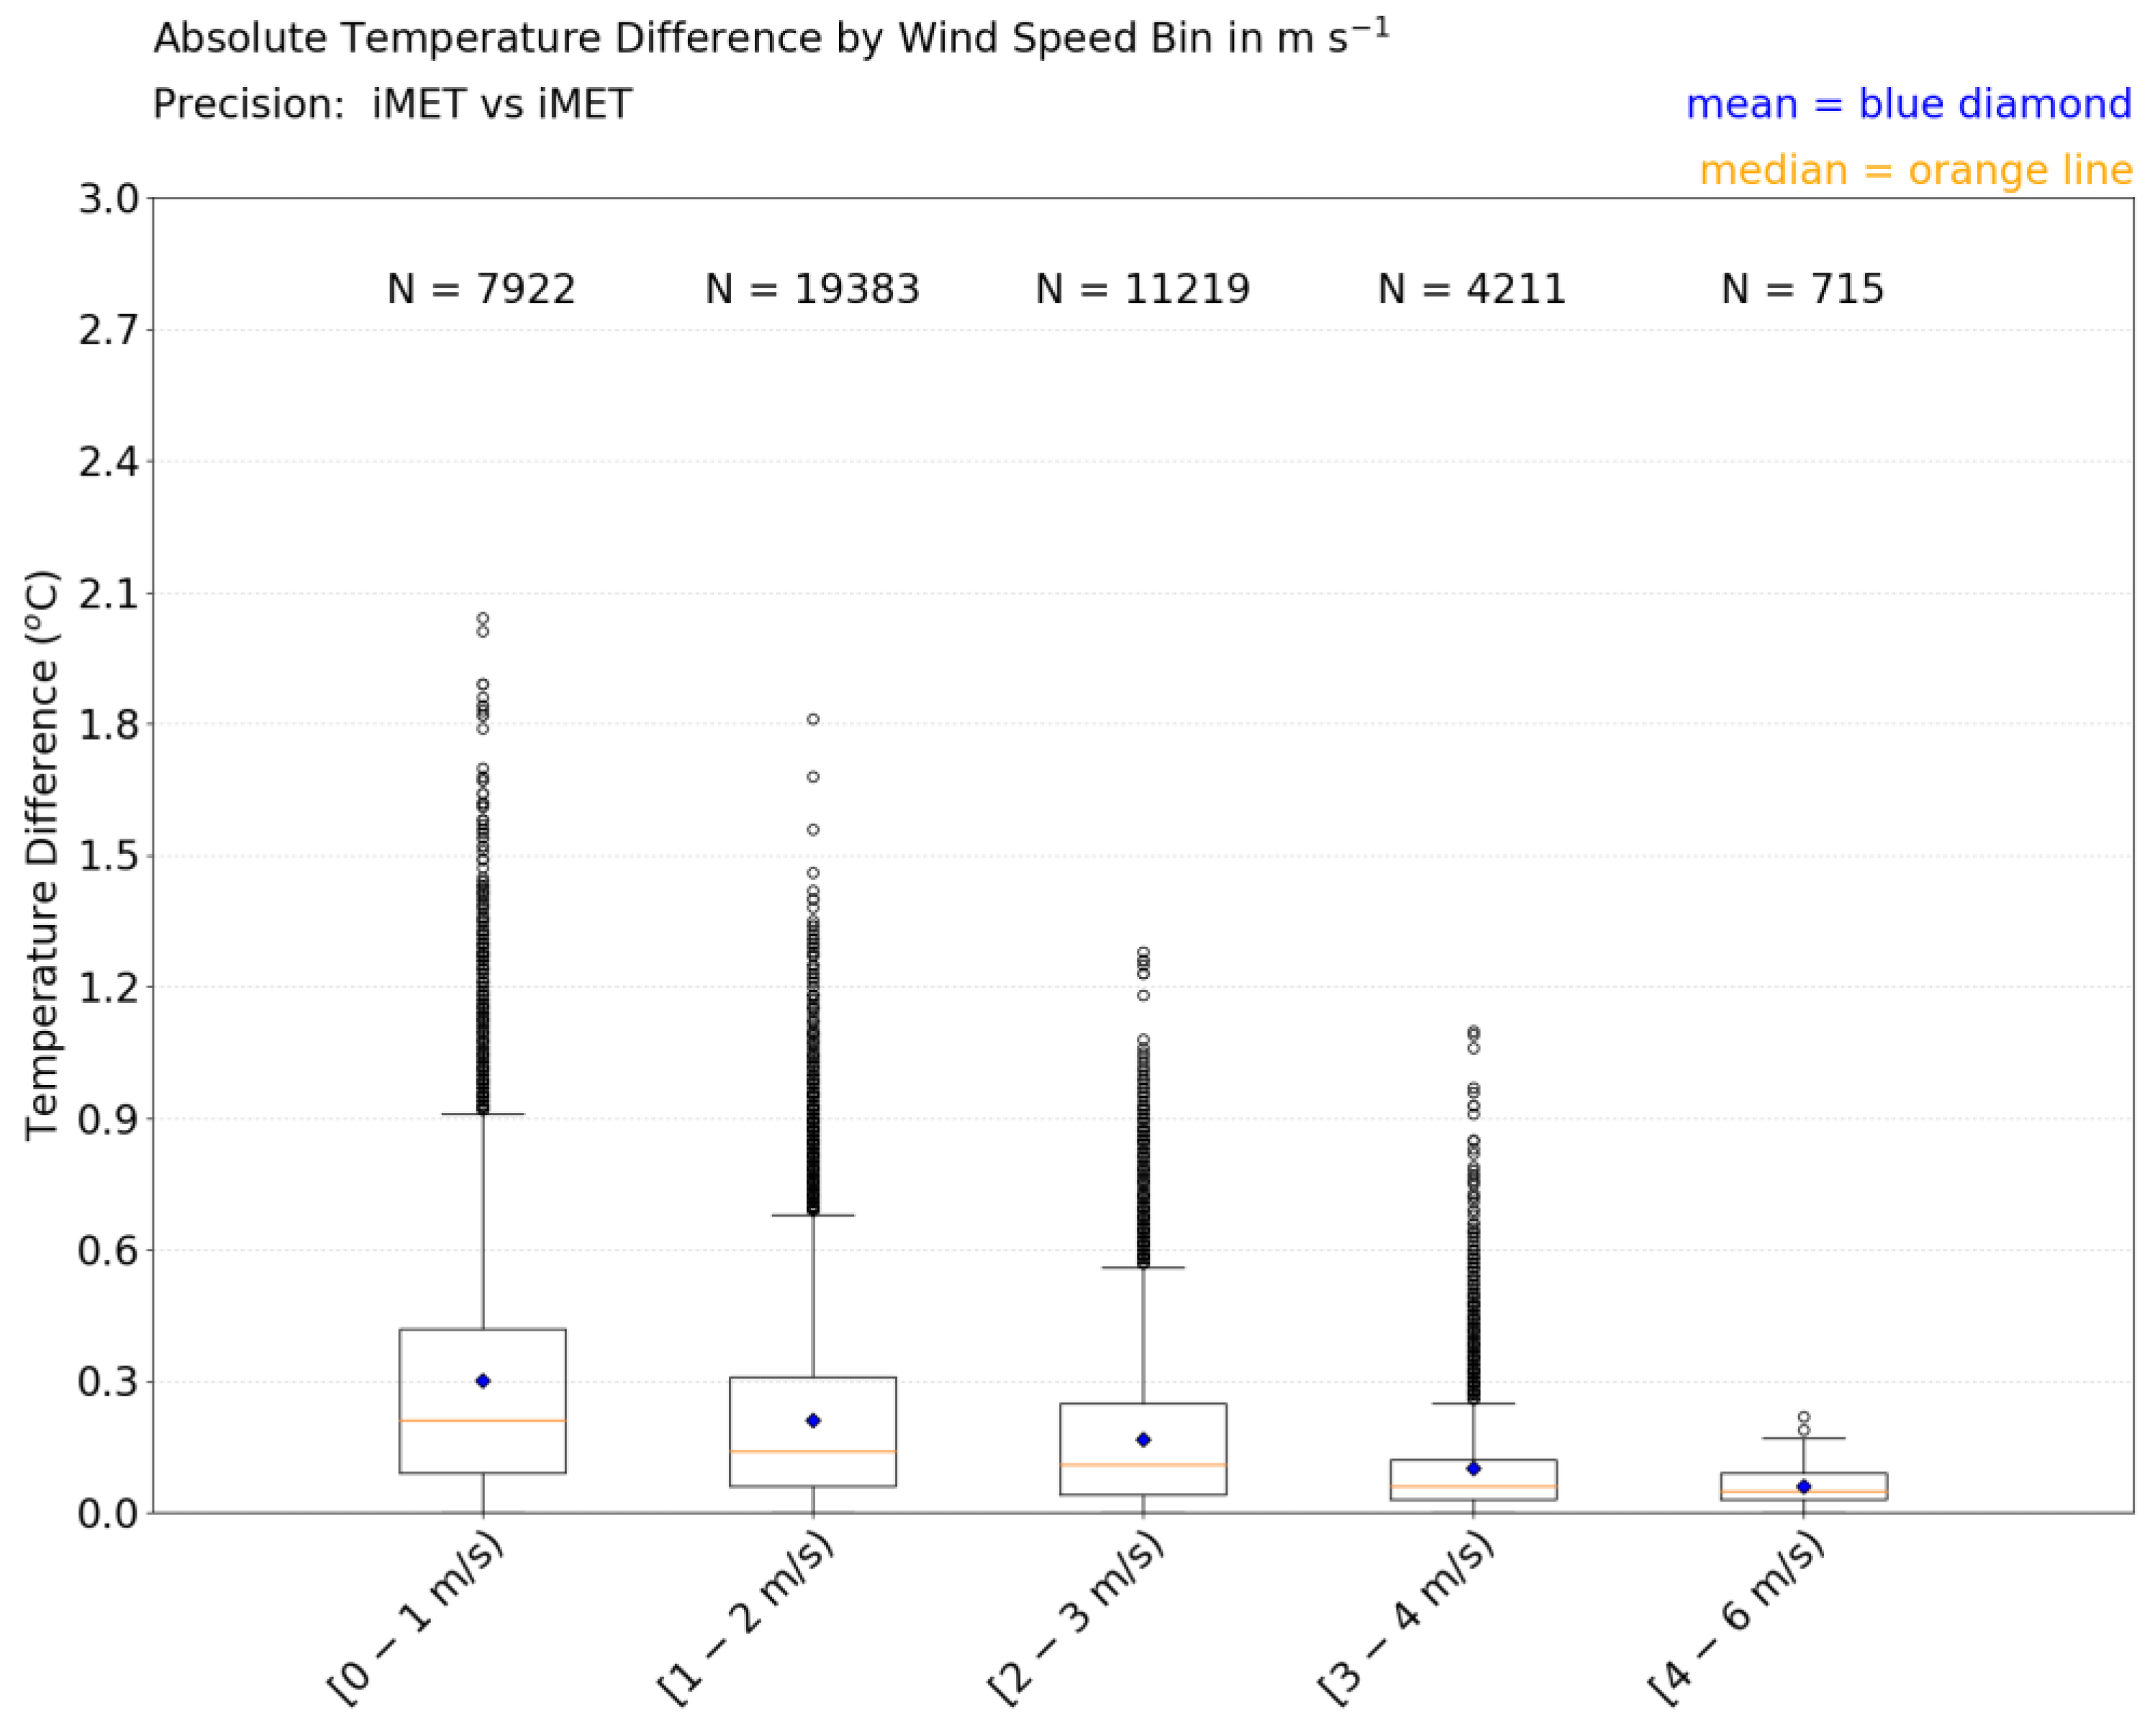
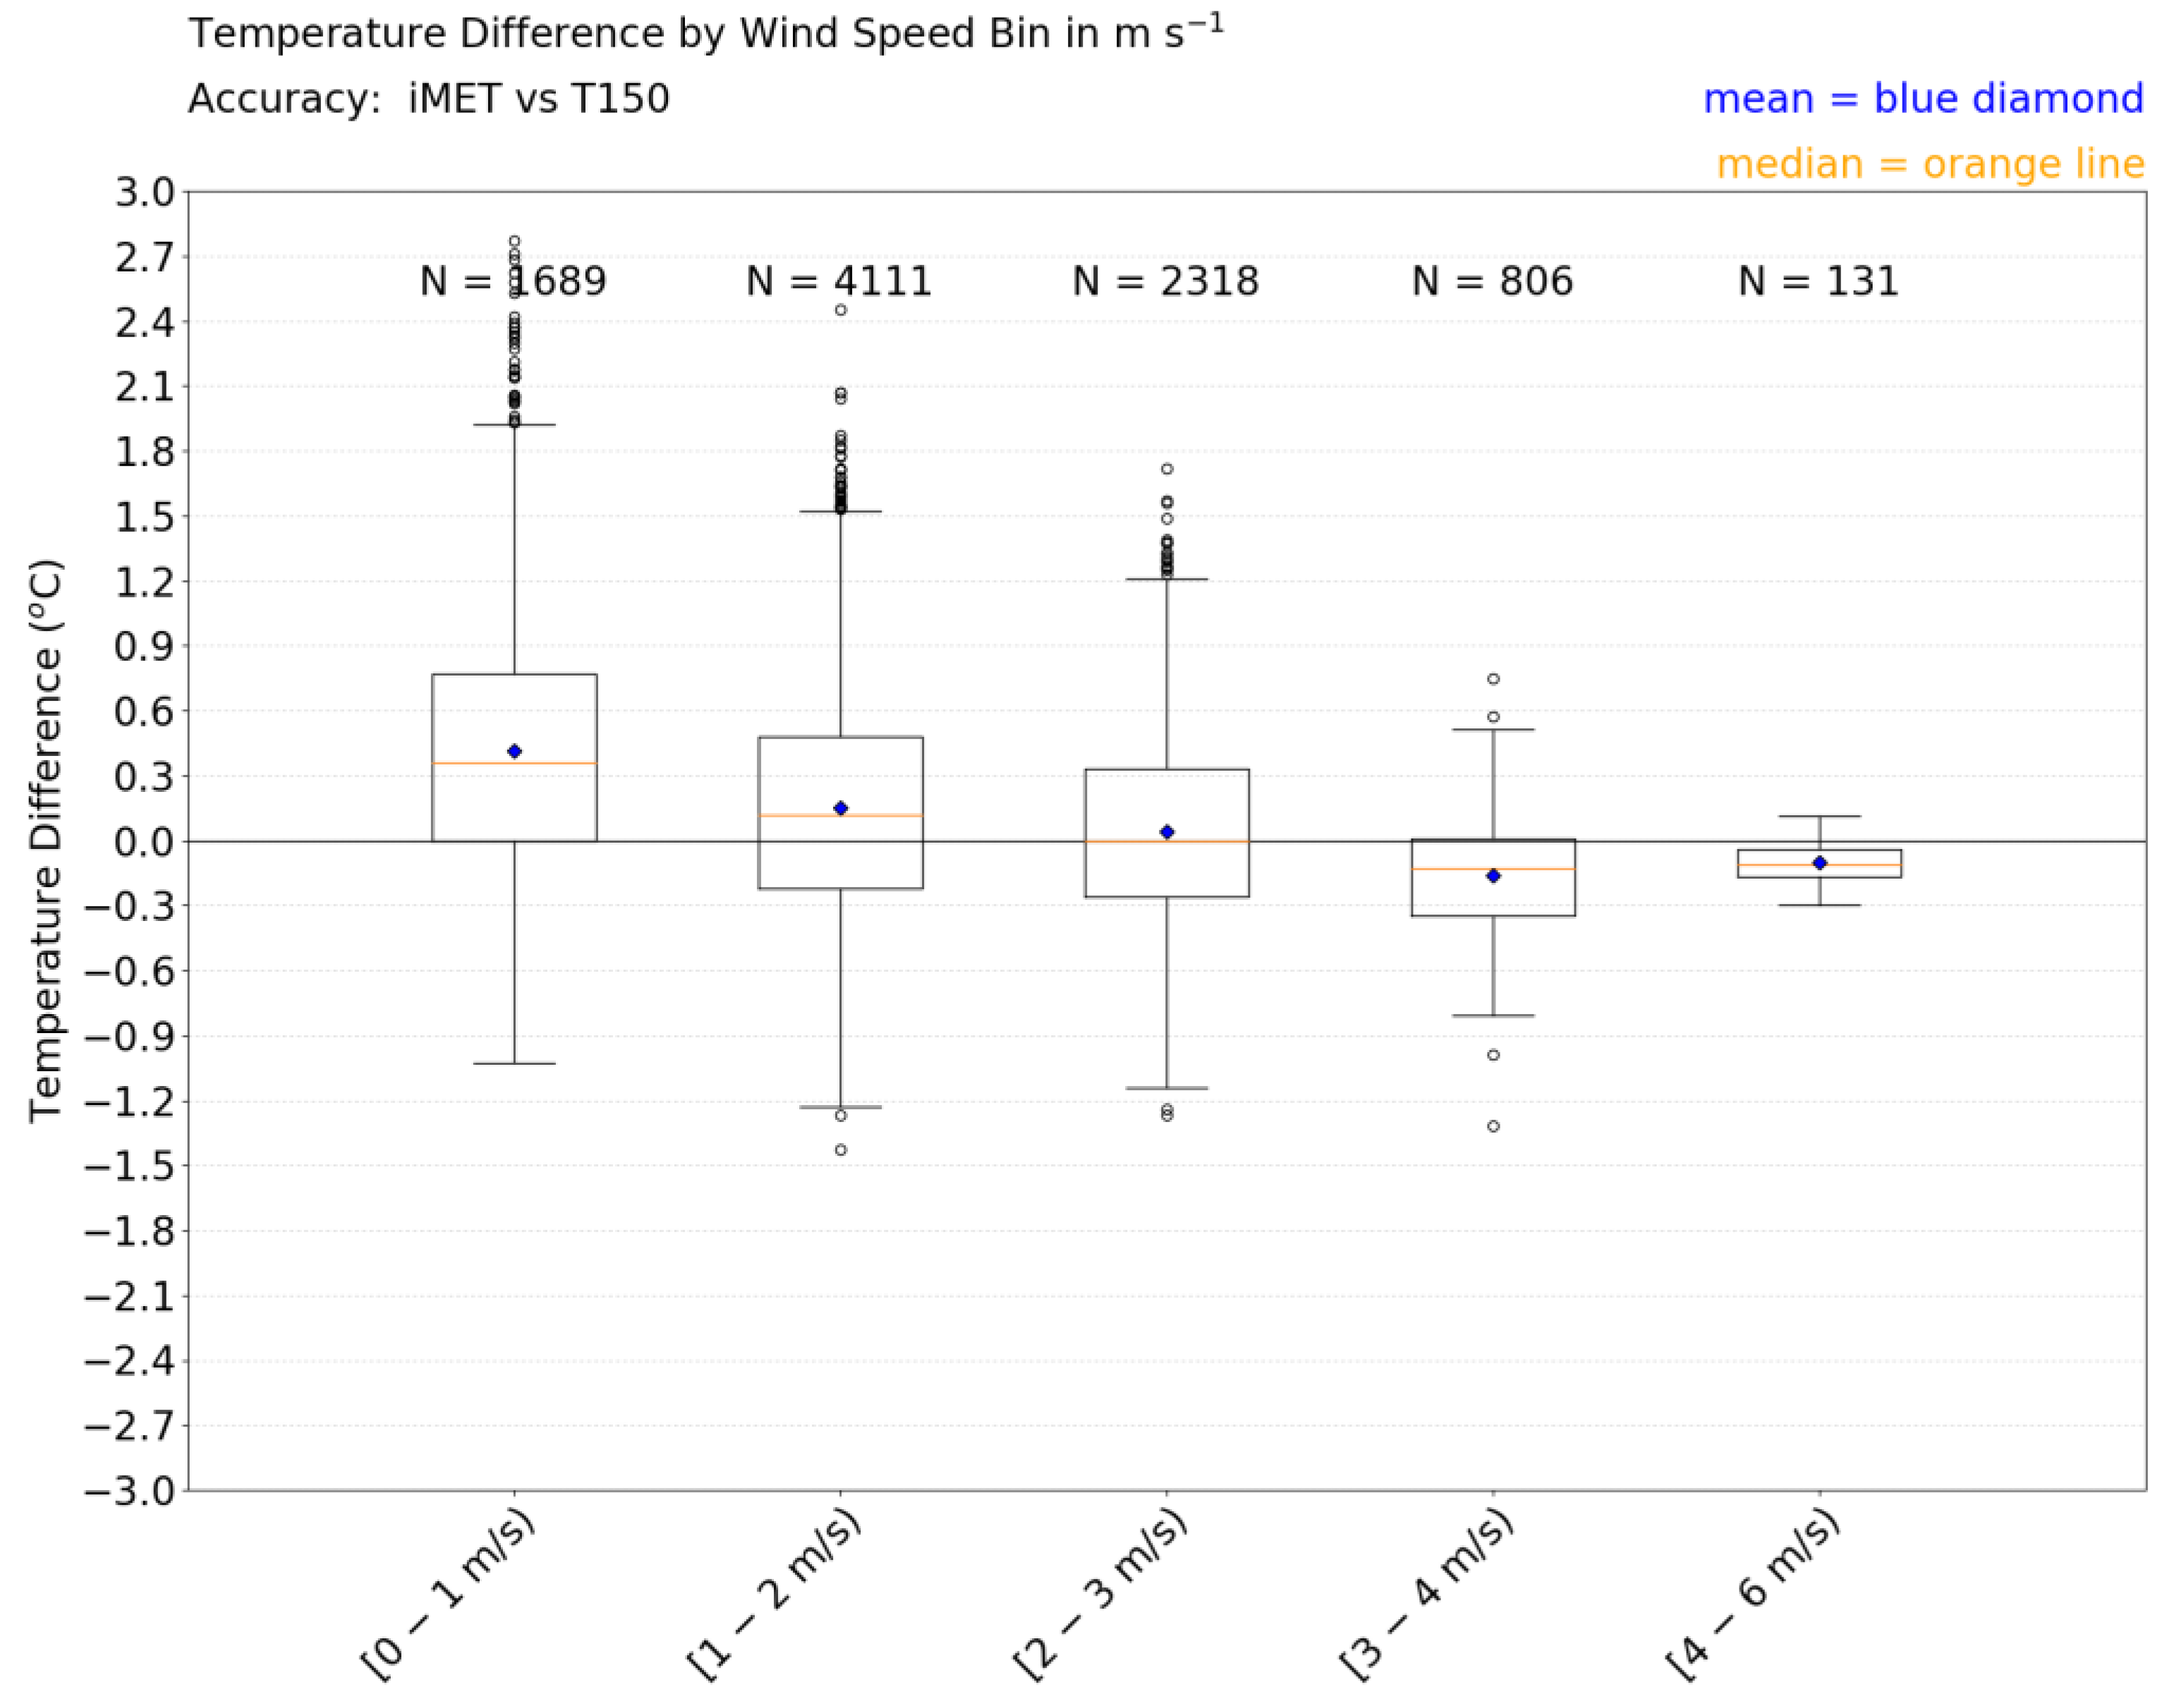
Each of the ATD (TD) values for all daytime experiments are assigned to a 2 m wind speed bin to quantify the improved precision of the iMET-XQ temperature measurements as the wind speed increases (Figure 5), and to define an optimal wind speed threshold above which precision and accuracy are at an acceptable level. In this manner, an ATD (TD) distribution is obtained for each wind bin. The wind speed ranges from 0.02 to 5.81 m s−1, so the bins are defined between 0.0 and 6.0 m s−1. In each bin, the lower limit of the bin range is included in the sample and the upper limit is not; this way, the bins do not overlap. Different bin sizes are explored. Bin sizes of 1.0, 1.5, and 2.0 m s−1 all show a decrease in the mean and spread of the ATD (TD) with increasing wind speed. This is shown for the 1.0 m s−1 bin size in the form of boxplots in Figure 6 (ATD to assess precision) and Figure 7 (TD to assess accuracy). The sample size (N) is shown by each wind bin boxplot. Because of the limited sample sizes in the 4–5 m s−1 and 5–6 m s−1 bins, these two bins were combined to form the last bin (4–6 m s−1) because of limited sample sizes in the 4–5 m s−1 and 5–6 m s−1 bins. In Appendix A, the details of a statistical analysis are presented. The decrease in mean and spread of ATD and TD distributions with increasing wind speed bin are statistically significant, except for the difference in the mean TD for the last two wind speed bins in Figure 7. In other words, the precision and accuracy of the iMET-XQ temperature measurements improves with increasing wind speed. However, because the decrease in mean TD with increasing wind speed is only significant from the (0–1 m s−1) through the (3–4 m s−1) bins, higher wind speeds do not significantly improve iMET-XQ accuracy. Therefore, it is concluded that the aspiration of wind speeds higher than or equal to 3 m s−1 is sufficient.
It is noted that for the two weakest wind speed bins, the mean and median ATD are positive (Figure 7) and 75.6% and 59.4% of the TDs are positive, respectively. In other words, the iMET-XQ temperature is usually warmer than the tower sensor. For the two strongest wind speed bins, the mean and median are negative and 73.3% and 84.7% of the TD observations are negative, respectively. In other words, the tower sensor is usually warmer. Apparently, the iMET-XQ sensors respond better to natural aspiration at these higher wind speed values than the tower sensor; the latter perhaps experiencing warming by being enclosed in a non-aspirated radiation shield, which might have absorbed heat from the sun [12]. That being said, when the wind speed increases to over 4 m s−1, both of the sensors are well aspirated and the absolute values of their TDs are all below 0.3 °C. In wind speed bin 3–4 m s−1, 66.13% of TD observations are below 0.3 °C and 94% of the TD observations or below 0.6 °C. This confirms that, for wind speeds above 3 m s−1, the iMET-XQ sensors accurately measure temperature.
Figure 6 and Figure 7 clearly show that the mean, median, and spread of the ATD and TD values decrease with increasing wind speed. Hence, the precision and accuracy of the iMET-XQ temperature observations improves with increasing wind speed. The solar radiation distributions for each wind speed bin are presented in the form of boxplots in Figure 8 to make sure that this was not caused by the dominance of low radiation values in the higher wind speed bins. Unfortunately, the solar radiation sensor malfunctioned when observations in the last bin (4–6 m s−1) were made. When comparing the 0–1 m s−1 and 1–2 m s−1 wind speed bins, Figure 8 shows that the higher wind speed bin has a slightly smaller mean solar radiation value. However, the higher wind speed bin also has a larger 75th percentile (top of box) and longer upper whisker. This means that there are more large radiation values in this bin. Figure 6 shows that the higher wind speed bin also has smaller ATDs. Apparently, efficient aspiration by the stronger wind speeds in the 1–2 m s−1 wind speed bin, reduces the ATDs, and compensates for potential sensor warming effects from higher solar radiation values.
Transitioning to the next wind speed bin (2–3 m s−1), there are more smaller radiation values (Figure 8), which helps with the decrease in ATD values in that bin (Figure 6). When moving to the 3–4 m s−1 wind speed bin, the median solar radiation value is much larger. Again, the larger radiation values are apparently compensated for by stronger wind speeds, explaining the smaller ATD values in this bin. However, there are two caveats: (1) with increasing solar radiation it is possible that all sensors warm and, hence, that solar radiation does not significantly impact the temperature differences among the sensors, and (2) there are significant amounts of missing solar radiation data (due to a Mesonet tower sensor malfunction) in the higher wind speed bins. Therefore, it is possible that the larger mean and median solar radiation values in the 3–4 m s−1 wind speed bin seen in Figure 8 are actually lower. The dependence of iMET-XQ performance on solar radiation is further explored below.
3.2.3. Solar Radiation Bins
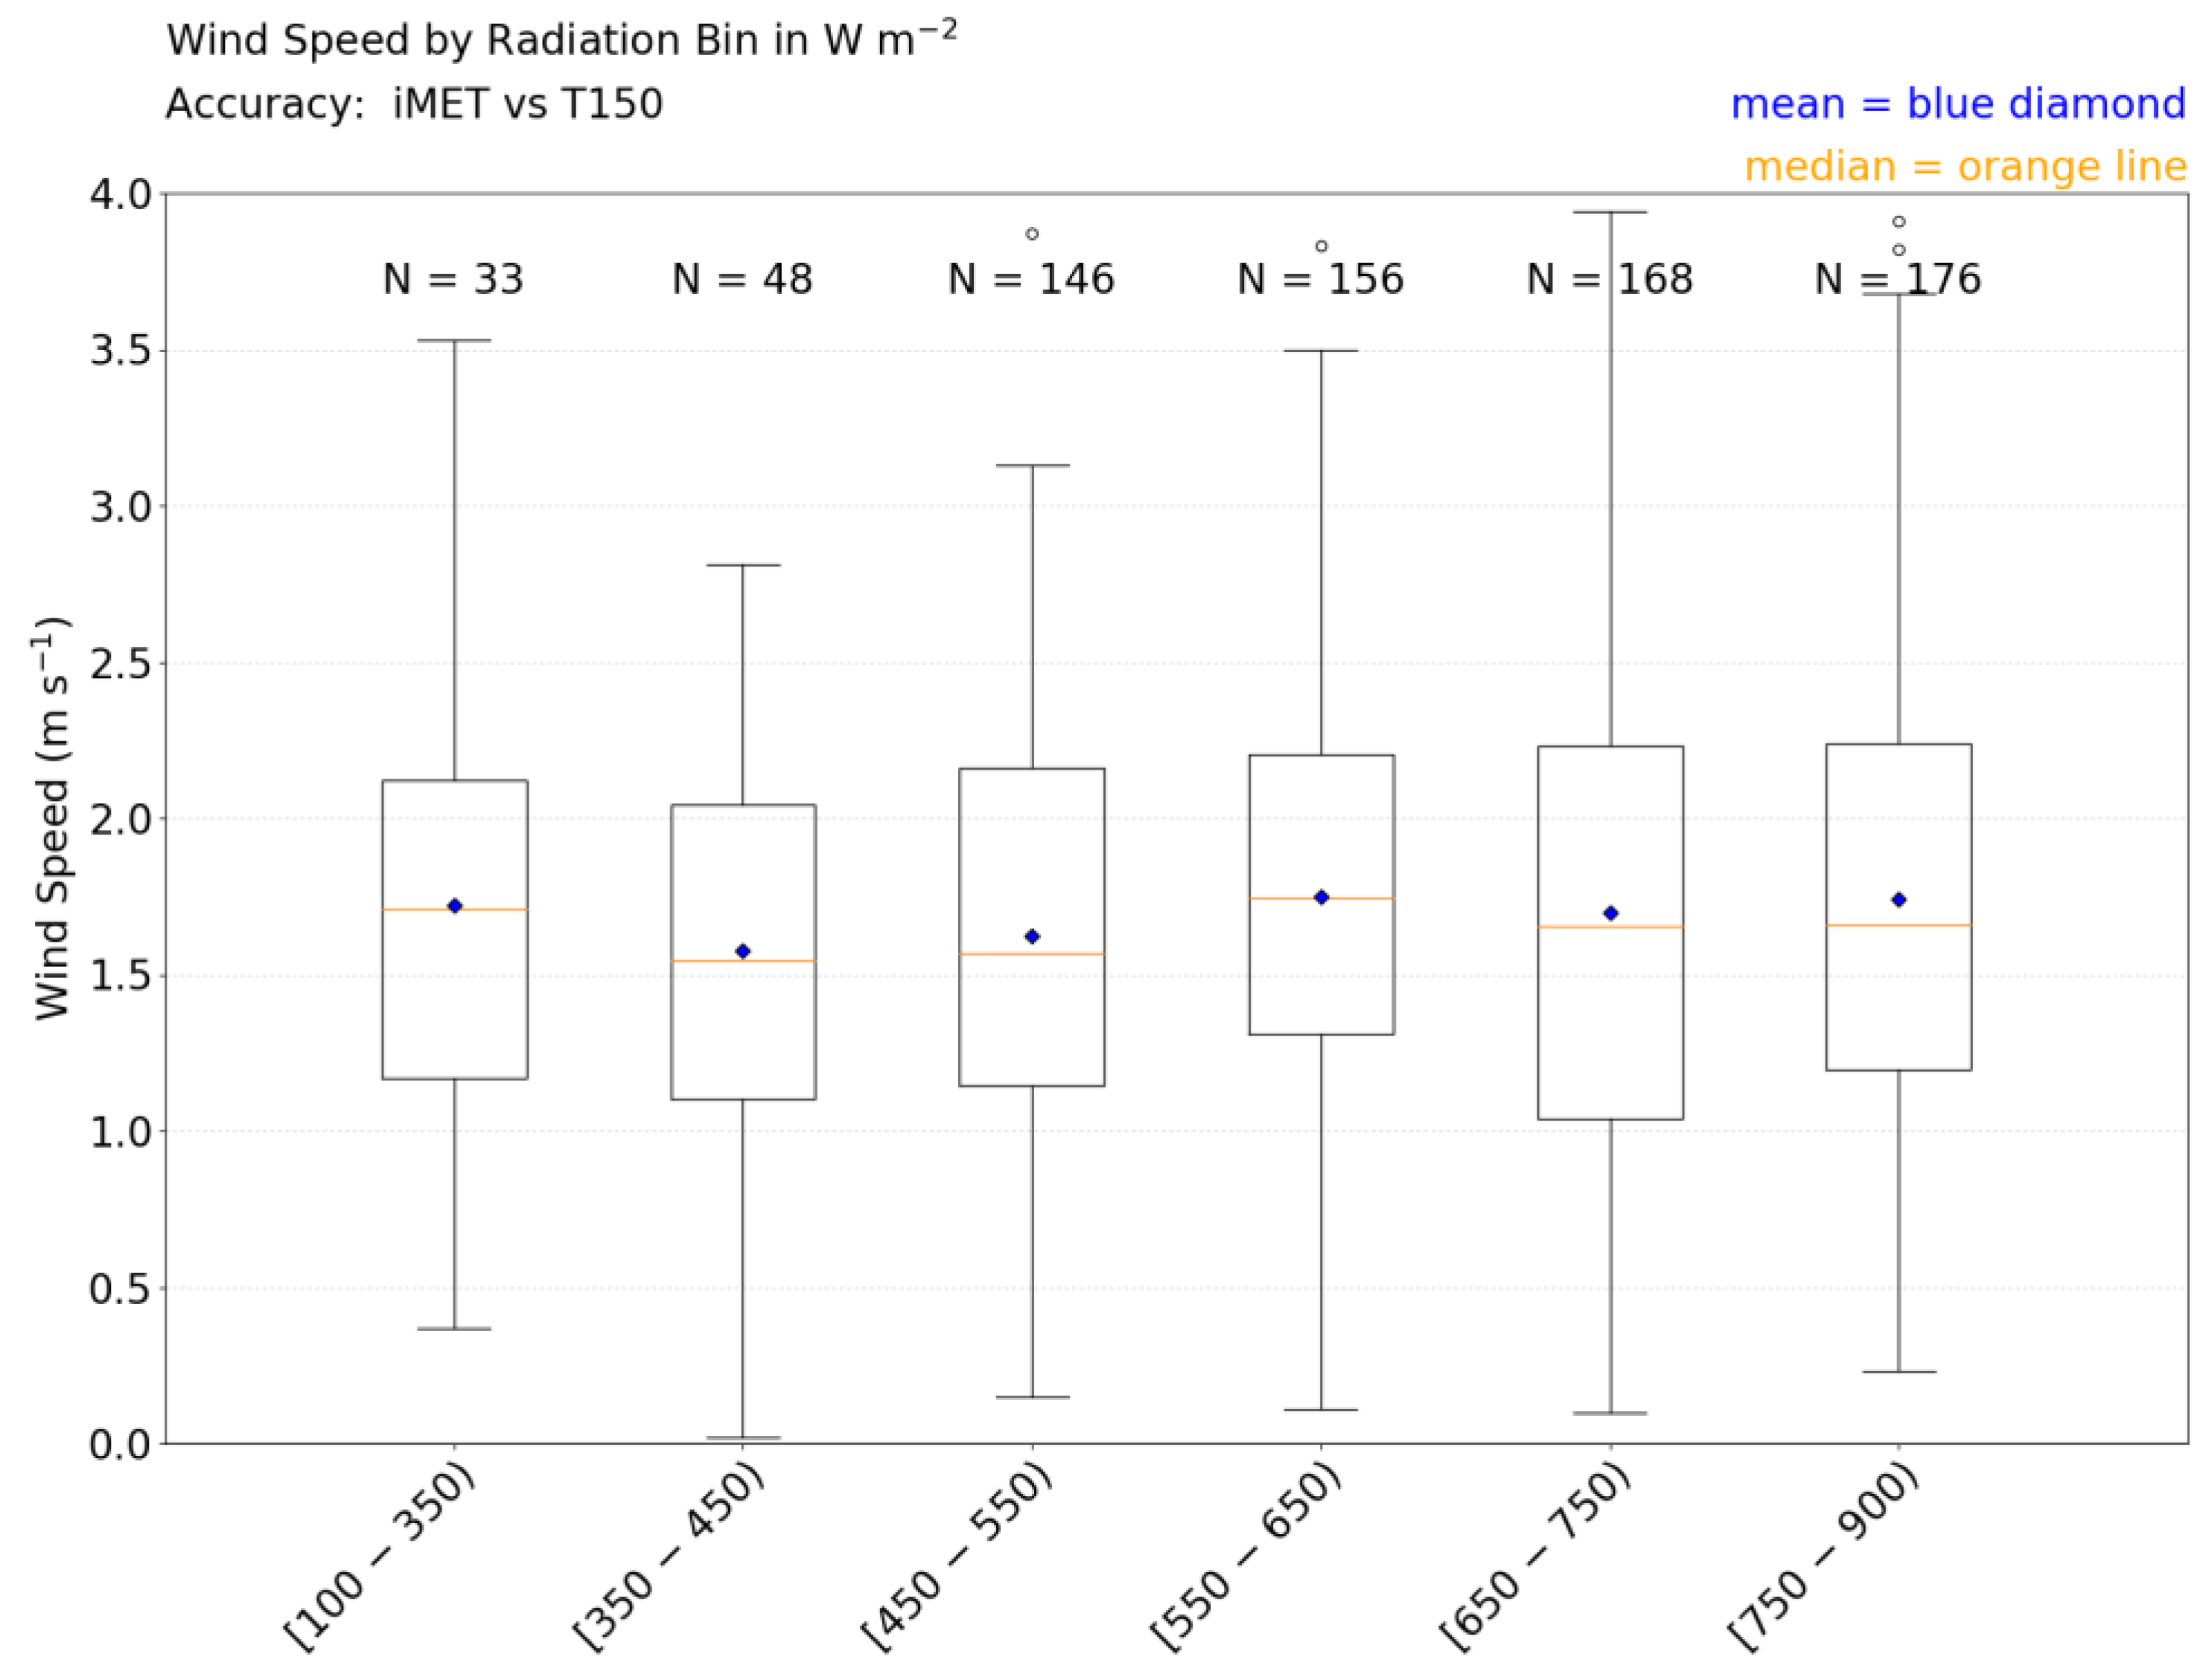
While Figure 5 did not clearly show any trends in solar radiation effects on the precision of the iMET-XQ temperature measurements, it is a well-known fact, which was also confirmed by the experiments that were performed at dusk, that exposure to solar radiation impacts the performance of temperature sensors. The ATD and TD were calculated for different solar radiation bins to quantify this effect. The solar radiation values for the Tower experiments range from 89.9 W m−2 to 888.0 W m−2. Only one value falls below 100 W m−2, so binning starts at 100 W m−2. Only 37 observations fall between 100 and 350 W m−2, so this becomes one bin. Between 350 and 750 W m−2 bin sizes of 100 W m−2 are used. The following bin would be 850–750 W m−2, but because there are only 8 observations between 850 W m−2 and 888.0 W m−2, these observations are combined to form the final bin of 750–900 W m−2. Like with the wind speed bins, the lower limit of the bin range is included in the sample and the upper limit is not; this way the bins do not overlap.
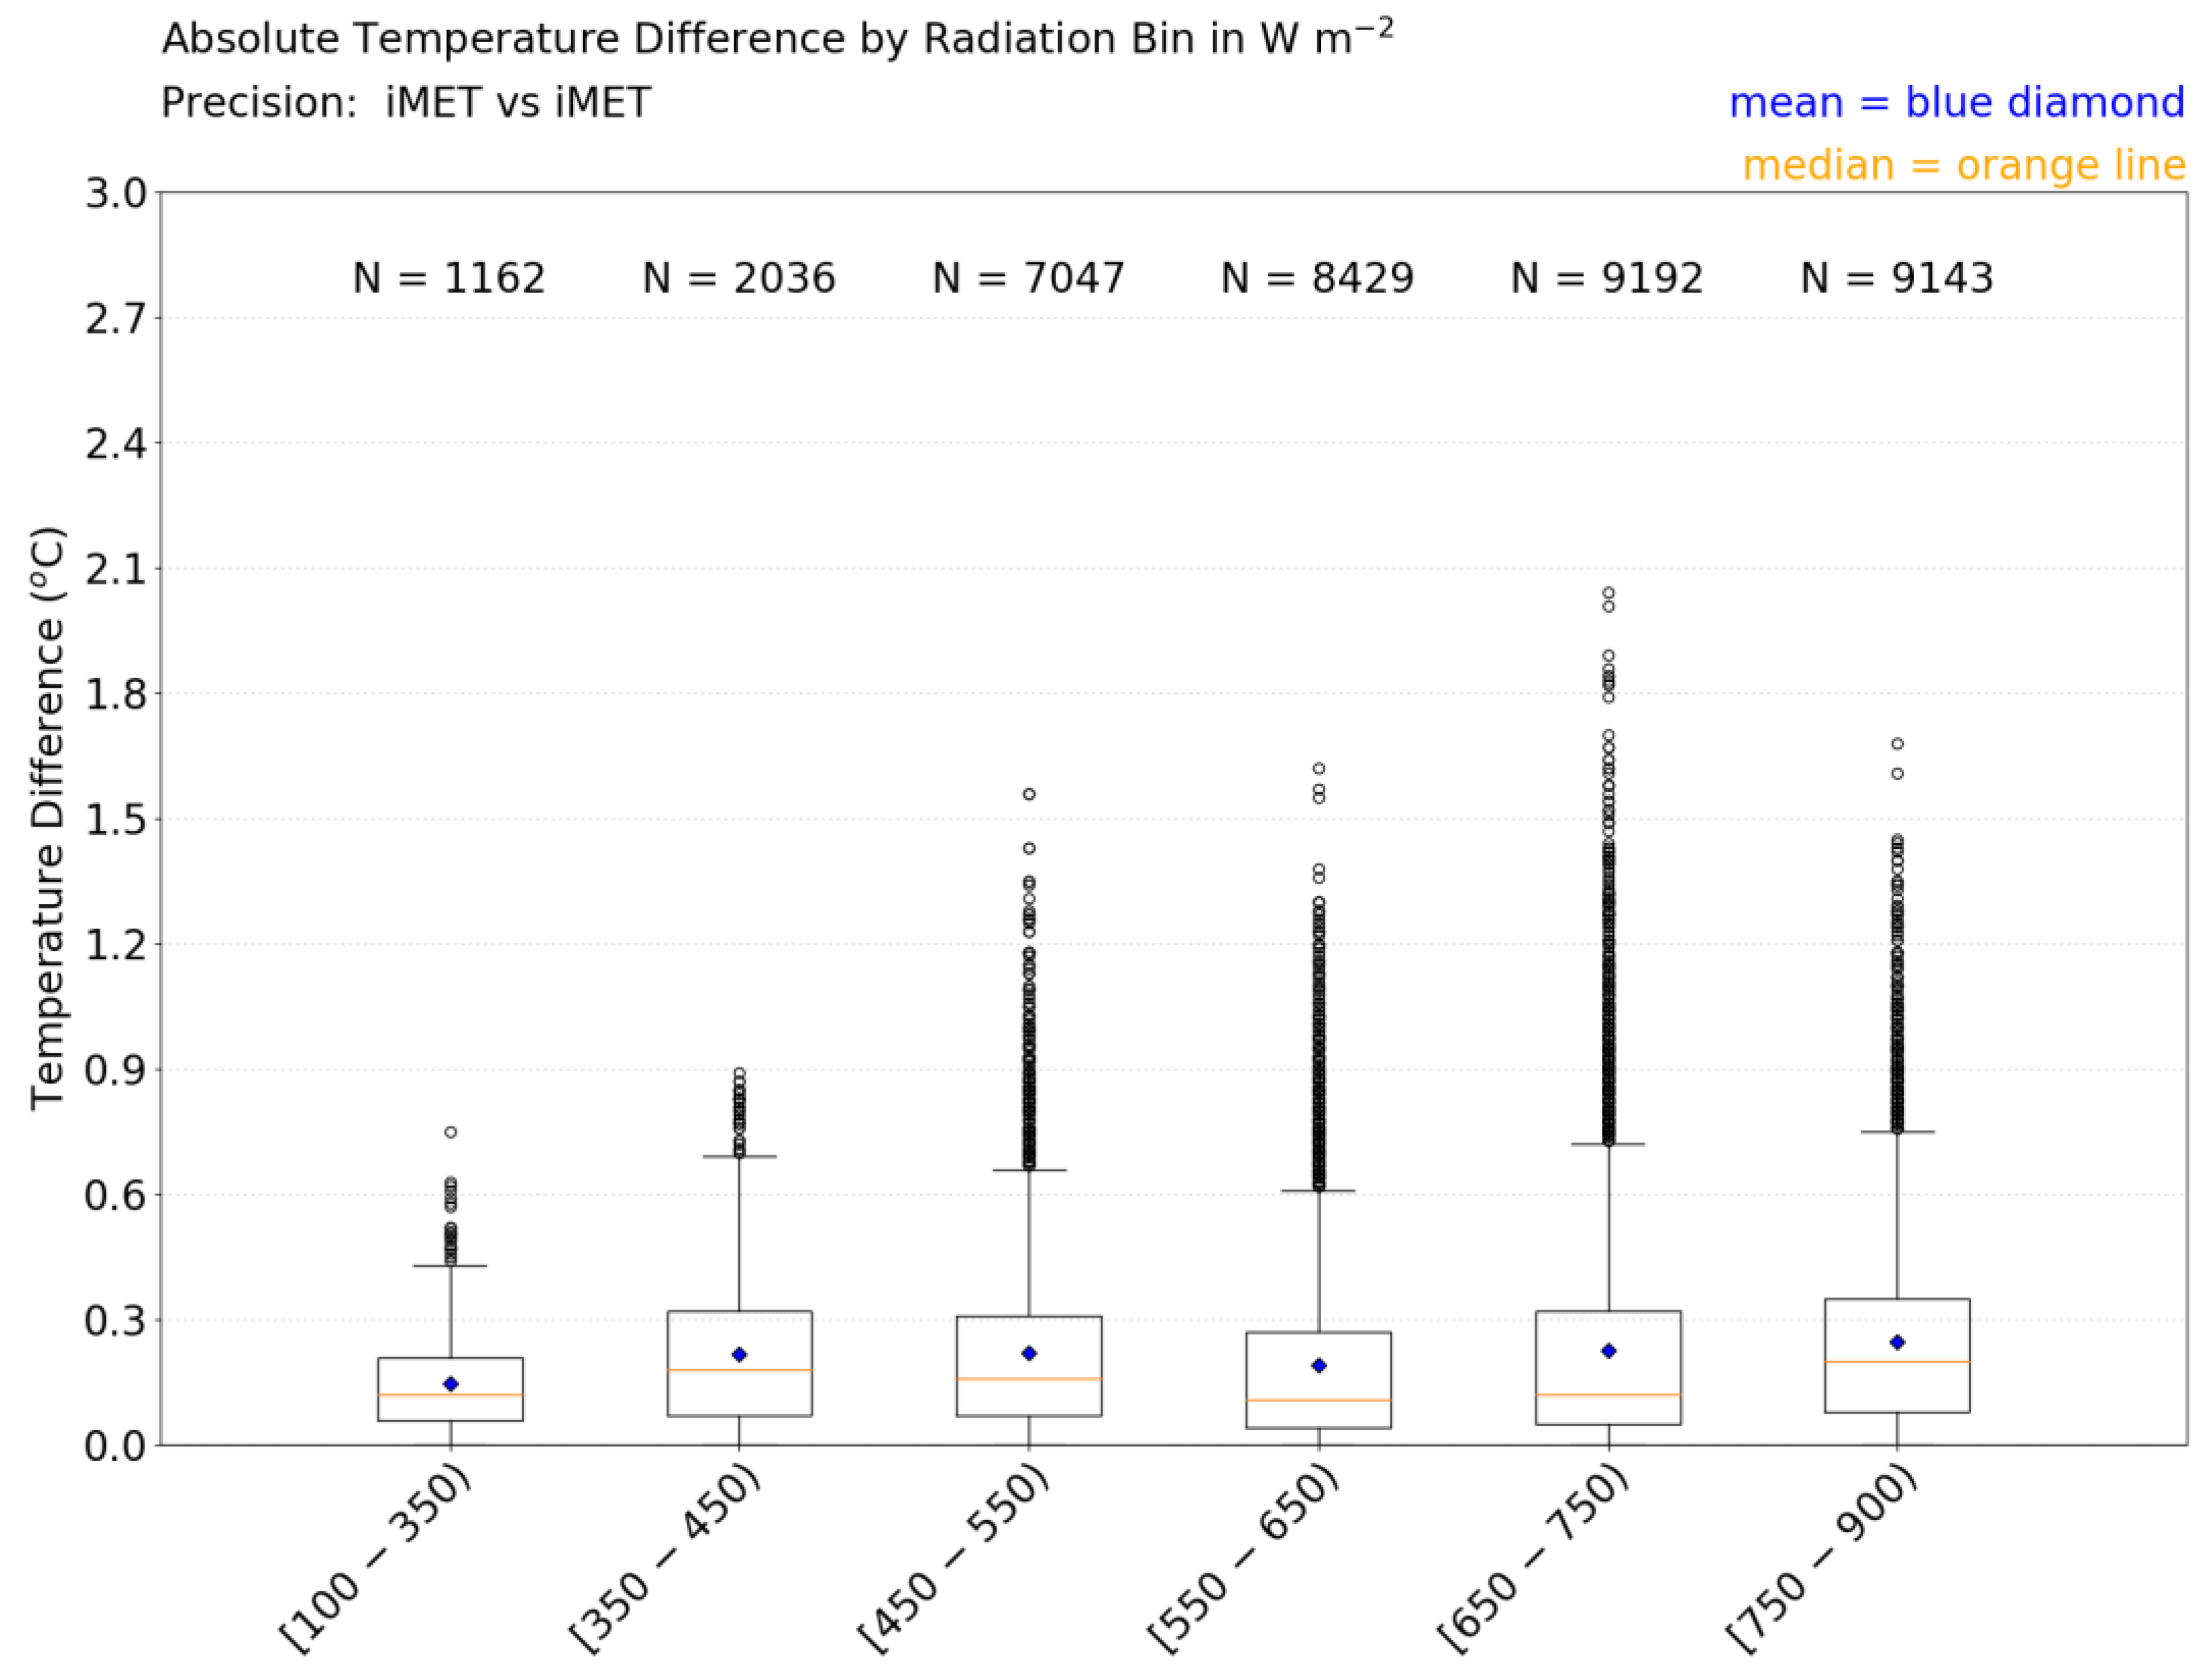
Figure 9 shows the distributions (boxplots) of ATD by solar radiation bin. The spread in ATD values clearly increases with increasing solar radiation (except for the final bin). The statistical tests (Appendix A) confirm that the increasing spread in ATD values across the first 5 bins is significant. In other words, the temperature measurements between the different iMET-XQs deviate more and, hence, the sensors become less precise when solar radiation values increase. Similar results were found for the spread of TD measurements (Figure S3), therefore, the iMET-XQ measurements also become less accurate with increasing solar radiation.
However, the mean and median ATD (and TD, see Appendix A) show a different trend. An increase in solar radiation (from bin 2 to 3) does not lead to a statistically significant change in mean ATD. Therefore, in spite of an increase in solar radiation, no significant change in mean precision is observed. Furthermore, the increase in solar radiation from bin 3 to 4 leads to a significant decrease in mean ATD or improved precision, which is not expected when the solar radiation increases. Finally, the mean ATD for the second largest solar radiation bin (bin 5) is not significantly different from bins 2 and 3. Bins 2 and 3 represent much lower solar radiation values, which would be expected to improve sensor precision and, hence, significantly lower mean ATD values. However, improved sensor precision was unexpected for bin 5. Similar trends were seen for the mean and median TDs and sensor accuracy (Figure S3 and Appendix A).
There are two items that need to be pointed out: (i) as expected, the ATD spread increased with increased radiation and (ii) as shown in the previous subsection, increased wind speed decreases the mean and spread of the ATDs. Figure 9 shows that small ATD values, and high sensor precision, exist in all of the radiation bins. When this occurs in the larger radiation bins, it is in all likelihood caused by favorable environmental conditions, such as increased wind speeds. Figure 10 confirms this. For example, the slight increase in mean ATD between radiation bins 1 and 2 is accompanied by a drop in mean 2 m wind speed. Likewise, the drop in mean ATD between radiation bins 3 and 4 likely resulted from the increase in mean 2 m wind speed that occurs between those two bins. The increased wind speeds better aspirate the iMET-XQ sensors, which offsets sensor warming by increased solar radiation. Figure 5 further confirms this: low ATD values are seen at wind speeds above around 2.5 m s−1 and many of these observations occurred at high solar radiation values (yellow and orange dots). From Section 3.2.2, it appeared that wind speeds that were equal to or greater than 3 m s−1 are strong enough to properly aspirate the sensors. However, not unexpectedly, the wind speed threshold value needed to compensate for iMET-XQ sensor warming due to solar radiation depens on the magnitude of the solar radiation.
3.3. Radiation Shields
In this set of experiments, two iMET-XQ units (iMETs 19 and 20) were used; iMET20 is placed exposed on the tower, iMET19 is put in a non-aspirated radiation shield identical to that used for the 2 m tower HMP-45C probe. The two iMET-XQ sensors are consistently placed in the same location on each experiment day. The tower temperature sensor at 2 m is used instead of 1.5 m (as was done in the previous section), because the iMET-XQ sensors are mounted at 2 m in this set of experiments (Figure 1 and Figure 2). Figure 11 shows the temperature difference of the tower sensors at 2 m and 1.5 m (T2m–T1.5m) and confirms the importance of choosing the 2 m sensor. In almost all cases, the temperature difference is negative, which means that the 1.5 m sensor records warmer temperatures. This is to be expected, given that the experiments took place during the day and that the 1.5 m sensor is closer to the ground. During higher wind speeds, the temperature measurements between the two sensors are smaller because the atmospheric boundary layer is well-mixed and both sensors are well aspirated.
Across all of the Radiation Shield experiment days, the solar radiation values varied between 77.8 and 1065.0 W m−2 and 2 m wind speed values varied from 0.1 m s−1 to 5.3 m s−1. The temperature differences by minute of the three pairs of sensors as a function of wind speed and solar radiation are investigated below. For consistency with Section 3.1, the same wind speed bin sizes are used.
3.3.1. Temperature Difference between Exposed iMET-XQ and Tower Sensor
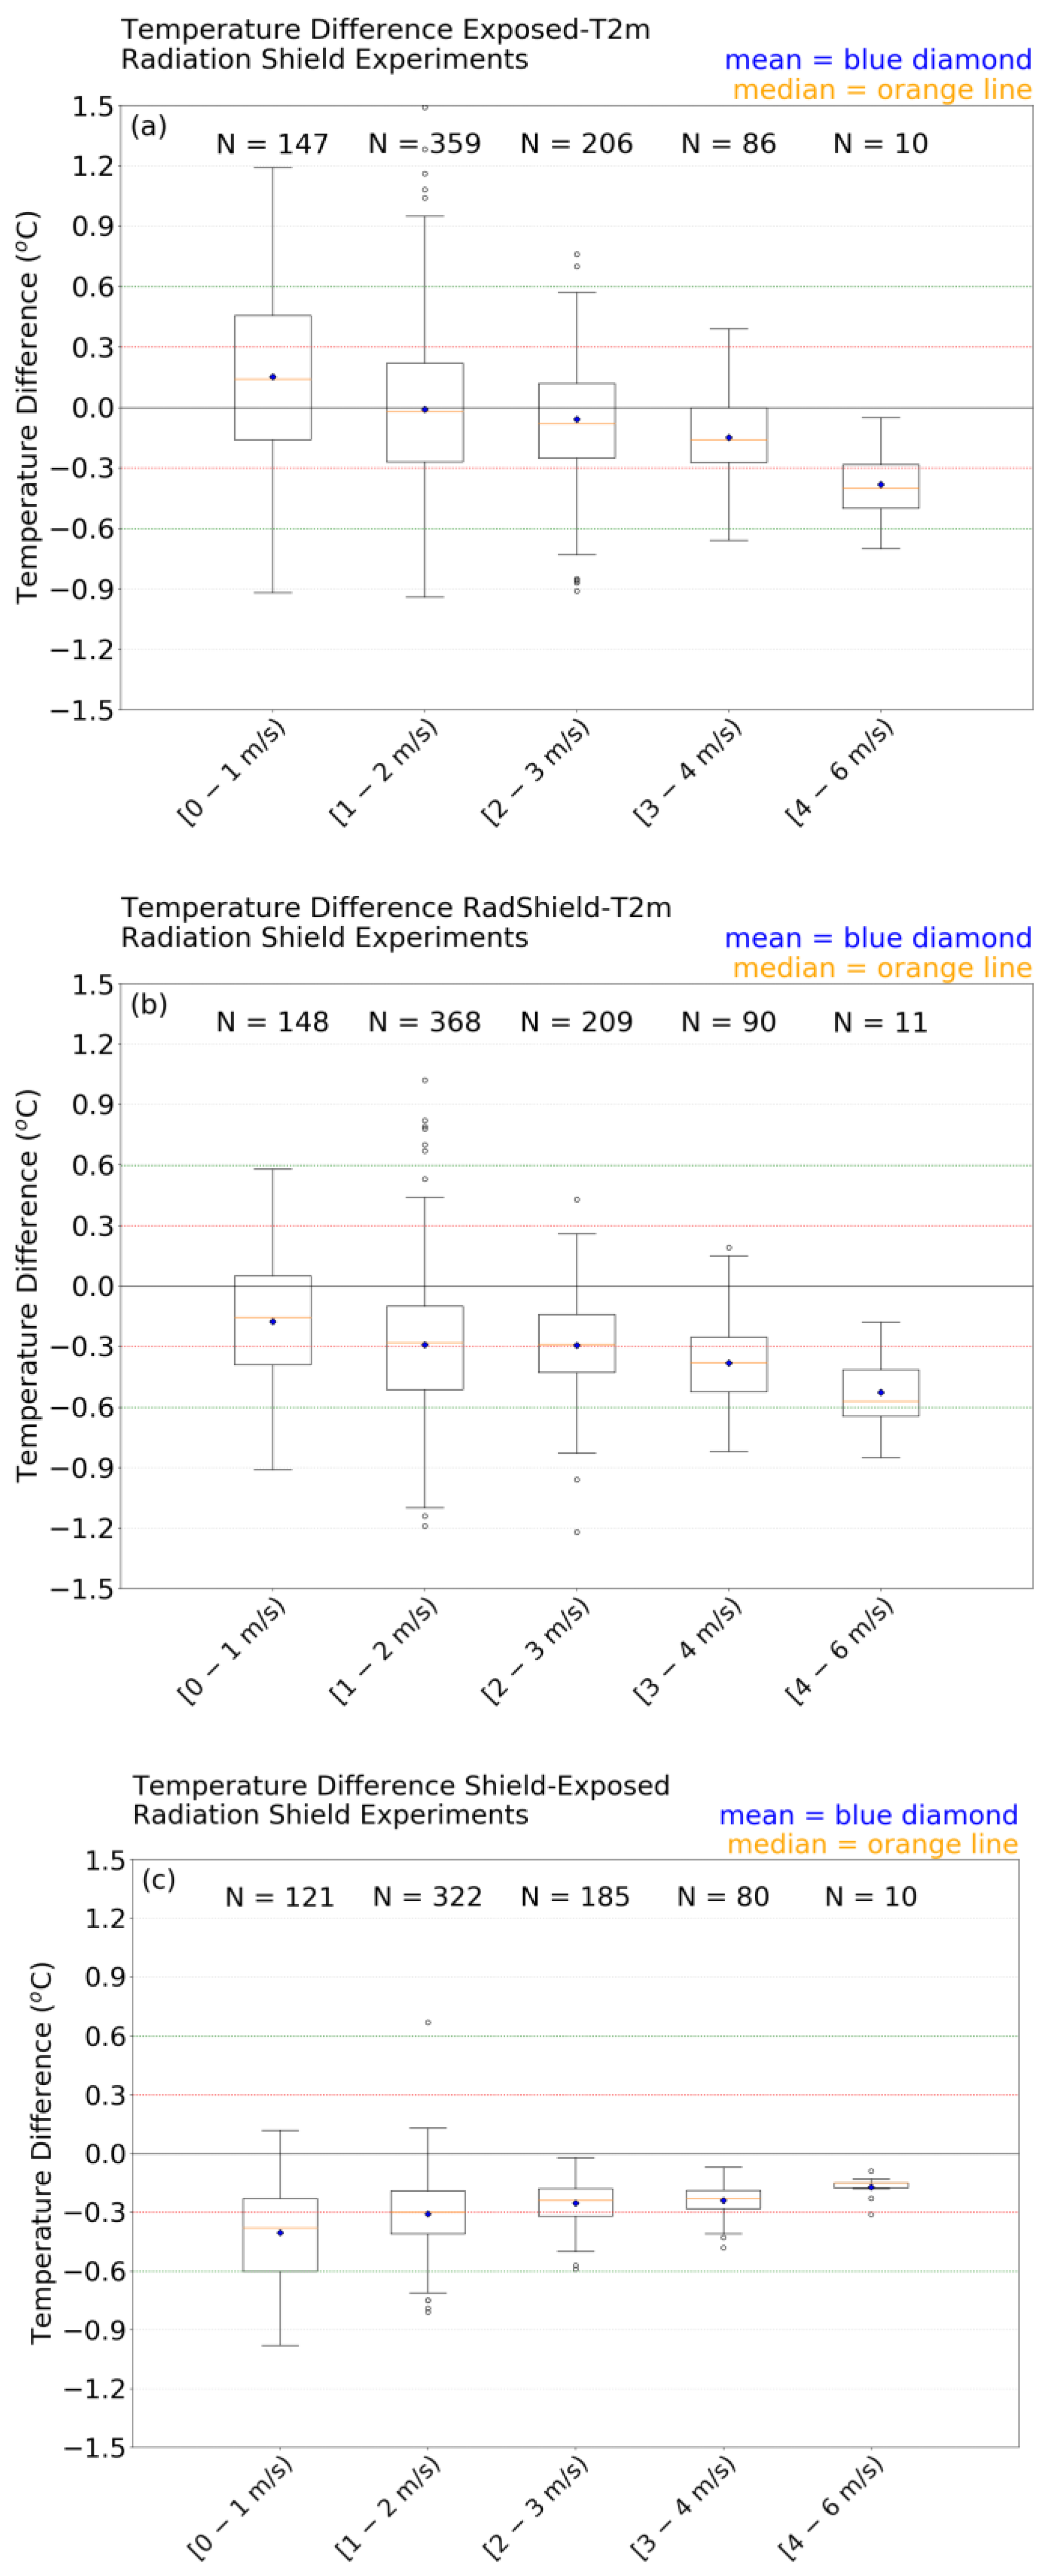
Figure 12a shows the TD = Texposed − T2m between the tower-mounted exposed iMET-XQ sensor (Texposed) and the HMP-45C tower sensor at 2 m AGL (T2m) by wind speed bin. The temperature difference spread (whiskers on the box plots) decreases with an increasing wind speed. The first wind speed bin also has 63.9% positive temperature difference values, which means that, in more cases, the iMET-XQ sensor is warmer than the tower sensor. The last three wind speed bins (wind speed greater than 2 m s−1) contain 57.8%, 74.4%, and 100% negative TD values, respectively (tower sensor warmer in most cases) and they display less spread in temperature difference values.
The impacts from wind speed (i.e., aspiration) and solar heating can be better assessed when splitting each wind speed bin into a small (≤400 W m−2) and a large (>400 W m−2) solar radiation group. In Table 5, the number of positive and negative temperature difference observations in each wind speed bin and in each solar radiation group (smaller or larger than 400 W m−2) are presented. For low radiation values and weak winds (≤400 W m−2 and wind speed < 2 m s−1, the first 2 wind bins), there are more negative (94) than positive (57) TD values; i.e., the tower sensor is warmer than the exposed iMET-XQ in more cases. For high solar radiation values and weak winds (>400 W m−2 and < 2 m s−1), there are more positive (204) than negative (144) TD values, i.e., the exposed iMET-XQ sensor is warmer in more cases. Examining the same for wind speed bins above 2 m s−1, more negative TD values (193) than positive TD values (105) occur, no matter whether the radiation is low or high. In other words, the tower sensor is usually warmer than the exposed iMET-XQ sensor when the wind speeds are stronger (2–6 m s−1), no matter the radiation value. When the wind speeds are weaker (0–2 m s−1), low radiation (≤400 W m−2) leads to a warmer tower sensor and strong radiation (>400 W m−2) leads to a warmer exposed iMET-XQ sensor. Accordingly, in strong winds, as well as in weaker winds with low radiation, the tower sensor is warmer than an exposed iMET-XQ sensor.
The above observations for low winds speeds are explained, as follows. Even low solar radiation values can warm a radiation shield and, hence, the sensor inside warms. The exposed iMET-XQ sensor will not warm as much, because (i) even weak winds can cause aspiration because the sensor has no surrounding structure obstructing the wind flow; and, (ii) the iMET-XQ sensor’s aluminum coating prevents it from warming up when exposed to short wave radiation. In high radiation values (>400 W m−2) with sunny conditions, the exposed iMET-XQ sensor will warm up more and wind speeds below 2 m s−1 and the aluminum coating are not enough to compensate. The sensor in a radiation shield, on the other hand, has protection from direct sunlight by the radiation shield; it also warms up, but less than the exposed iMET-XQ sensor.
The observations for stronger winds can be explained, as follows. The exposed iMET-XQ sensor is almost always cooler, no matter the radiation values. The iMET-XQ sensor’s aluminum coating minimizes the heating from short-wave radiation. Additionally, the sensor is completely unobstructed and wind freely flows around it, providing optimal aspiration. However, the sensor in the radiation shield is warmed by long-wave radiation from the shield [12] and the structure of the radiation shield might slightly impede aspiration when compared to the exposed iMET-XQ sensor.
This means that an exposed iMET-XQ sensor performs well in most cases, except in very sunny and calm conditions. It must also be pointed out that, even under the least favorable conditions (wind speeds between 0 and 1 m s−1 and solar radiation larger than 400 W m−2), only 14.8% of |TD| values are larger than 0.6 °C.
3.3.2. Temperature Difference between Shielded iMET-XQ and Shielded Tower Sensor
The temperature difference between the iMET-XQ sensor in the radiation shield and the 2 m tower temperature sensor (TD=Tshield − T2m) is primarily negative (Figure 12b). For the five wind speed bins between 1.0 and 4.0 m s−1, 68.2%, 84.0%, 89.0%, 96.0%, and 100%, respectively, of the TD values are negative. Positive values are more common in weaker wind speeds. The predominance of negative TD values means that the shielded 2 m tower sensor more frequently records warmer temperatures than the iMET-XQ in a radiation shield. The iMET-XQ and the HMP-45C are housed in identical, non-aspirated radiation shields. It appears that the aluminum coating on the iMET-XQ sensor is effective in preventing the sensor from warming due to long wave radiation emitted from the radiation shield.
Figure 12b shows that the absolute value of the mean TDs between the iMET-XQ and tower sensors increases with increasing wind speed. In other words, as the wind speed increases, the shielded iMET-XQ sensor records increasingly cooler temperatures than the 2 m tower sensor. In low wind speeds, both of the sensors warm in the non-aspirated radiation shield due to long-wave radiation emitted from the shield [12]. The iMET-XQ sensor heats less because of the aluminum coating. In medium wind speeds, the lack of heating due to the aluminum coating on the iMET-XQ sensor combined with improved aspiration by stronger winds causes an increased temperature difference between the iMET-XQ and tower sensor. This effect appears to be magnified in strong wind speeds, possibly because there are more high radiation values (>400 W m−2) in the upper 3 wind speed bins than in the lower 2 bins (last column in Table 5) causing the tower sensor to warm up more by long-wave radiation emitted from the shield.
3.3.3. Temperature Difference between Shielded iMET-XQ and Exposed iMET-XQ
Figure 12c shows the temperature differences (TD = Tshield − Texposed) between a shielded iMET-XQ and an exposed iMET-XQ sensor. It can be seen that the TDs are almost exclusively negative (98.4%, 97.8%, 100%, 100%, and 100% for the five wind speed bins, respectively). Therefore, a shielded iMET-XQ always records cooler temperatures than an exposed unit. This is especially true in weak winds when the exposed iMET-XQ, as expected, heats up too much. As wind speeds increase, the spread in TDs decreases and the mean TD values decrease to within the manufacturer specified sensor accuracy (0.3 °C), even approaching zero. For wind speeds between 1.0 and 2.0 m s−1, 48.1% of the TDs are smaller than 0.3 °C; between 2.0 and 3.0 m s−1 65.4% of TDs are smaller than 0.3 °C, this percentage increases to 80% in the next wind speed bin (3.0–4.0 m s−1), and the percentage is 90% for wind speeds over 4 m s−1. This confirms that the iMET-XQ sensors do not need to be shielded in stronger winds; an exposed unit records almost identical temperatures to a shielded unit so long as the aspiration is adequate.
4. Conclusions
iMET-XQ temperature precision and accuracy was assessed in outdoor conditions, while the sensors were mounted on an instrumented tower under a range of solar radiation and wind speed conditions. Precision was assessed by comparing the sensors to one another. Accuracy was assessed by comparing the iMET-XQ temperatures to a standard reference sensor (also a thermistor) on the tower. The iMET-XQ sensors were considered to be precise and accurate when temperature differences with one another or the reference sensors were within manufacturer specified sensor accuracy. Temperature differences of less than the sum of both sensor accuracies (assuming the bias from each sensor was in the same direction) were also deemed as acceptable.
The iMET-XQ thermistors were extremely precise in optimal outdoor conditions with solar radiation values close to zero, even when limited aspiration occurred (wind speed values below 2 m s−1).
The spread and mean values of temperature differences between iMET-XQ sensor pairs both decrease with increasing wind speed, and these differences are statistically significant. Not unexpectedly, but for the first time quantified, the precision of the iMET-XQ temperature measurements in an outdoor setting increases with increasing wind speed. In lower wind speeds, any solar radiation value that is above zero can cause temperature differences between individual sensors to be large, even if they are located side-by-side facing the same direction relative to the sun. Individual sensors may randomly warm due to self-heating and/or long-wave radiation emitted from surrounding objects. Sufficient aspiration allows for the sensors to take more consistent temperature measurements.
Just like iMET-XQ temperature precision, the accuracy of iMET-XQ temperature measurements improves with an increasing windspeed. No significant improvement in accuracy is observed for wind speeds larger than 3 m s−1. Hence, this speed is recommended for optimal sensor aspiration. However, the optimal aspiration value for the iMET-XQ might well be lower, because the tower sensor’s accuracy also improves with increased wind speed (its radiation shield is naturally aspirated by wind speed), which causes the iMET-XQ and tower measurements to converge. It was also shown that the wind speed threshold value that is required for compensating for iMET-XQ sensor warming due to solar radiation appeared to depend on the magnitude of the solar radiation. This further affirms the conclusion that aspiration values lower than 3 m s−1 may be fine, except in extremely sunny conditions.
It was shown that sufficient aspiration might, in fact, occur for wind speeds of 2 m s−1, except in extremely sunny conditions. Therefore, when mounting iMET-XQ sensors on a UAV, it is recommended that, if at all possible, the UAV either fly at 3 m s−1, be embedded in winds of those speeds, or to use the propeller wash of the vehicle to aspirate the sensors. In overcast conditions, winds as low as 2 m s−1 will suffice to aspirate the iMET-XQ.
It was concluded that the aluminum coating on the iMET-XQ sensor is effective at minimizing sensor warming from both long-wave and short-wave radiation by comparing temperature measurements from shielded and unshielded iMET-XQ sensors to those of the shielded HMP-45C sensor on the tower.
In strong wind speeds, an exposed iMET-XQ sensor almost always records a cooler temperature than the shielded reference sensor on the tower, no matter the radiation values. The iMET-XQ sensor’s aluminum coating minimizes heating from short-wave radiation. Additionally, the exposed sensor is completely unobstructed and wind freely flows around it providing optimal aspiration. In weak wind speeds (<2 m s−1), the performance of the iMET-XQ depends on solar radiation values. In overcast conditions, the sensors’ temperatures converge because there is less solar radiation to warm the sensors. In sunny and calm conditions, the iMET-XQ’s aluminum coating is not sufficient to offset the lack of aspiration and, as a result, the sensor warms up more than the shielded reference sensor on the tower. This means that an exposed iMET-XQ sensor performs well in most cases, except in very sunny and calm conditions.
A shielded iMET-XQ sensor almost always records cooler temperatures than the shielded reference sensor on the tower. It is concluded that the aluminum coating on the iMET-XQ sensor is effective in preventing the sensor from warming due to the long wave radiation emitted from the radiation shield.
Not unexpectedly, a shielded iMET-XQ almost exclusively records cooler temperatures than an exposed iMET-XQ sensor. However, the spread in temperature difference decreases and temperature differences approach zero as the wind speed increases. This confirms that the iMET-XQ sensors do not need to be shielded in stronger winds; an exposed unit records almost identical temperatures to a shielded unit so long as the aspiration is adequate. For wind speeds over 2 m s−1, all of the temperature differences are within twice the manufacturer specified accuracy.
In conclusion, it can be stated that the aluminum coating on the iMET-XQ sensor works well, except in very sunny (>400 W m−2) and calm conditions (winds < 2 m s−1). Therefore, the iMET-XQ sensors with aluminum coating do not need to be shielded. However, they do need to be aspirated. When they are, they are precise and accurate.
The iMET-XQ sensors perform best at dusk, but most UAV flights are likely to occur during the day when solar radiation values are high. Thankfully, the winds also usually increase during the day time due to turbulence. Furthermore, the iMET-XQ sensors can be placed in a location on the UAV, where they are aspirated by propeller wash and will gain additional aspiration if the UAV moves vertically or flies horizontal transects.
In a follow up paper [16], an application is presented to illustrate that the uncertainties in the temperature measurements that are presented in this paper are insignificant when observing atmospheric phenomena, like morning inversions or sea breeze structure, or when measuring temperatures over an agricultural field, for example. However, when used for numerical weather model initialization or to study convective initiation, temperature accuracy should be even more accurate. An informal consensus of atmospheric scientists, National Weather Service, and other subject matter experts in the community [9] recommended that, for temperature, the measurement accuracy goal should be ±0.2 °C. When properly aspirated, the iMET-XQ temperature sensors are certainly capable of reaching this level of accuracy. The tower data that were collected in the current study were examined for this level of accuracy. It was found that, for wind speeds between 3 and 4 m s−1, 51.5% of the absolute values of TD are below 0.2 °C. For wind speeds between 4 and 6 m s−1, 84.0% of the absolute values of TD are below 0.2 °C. The rotor wash from an off-the-shelf UAV was measured in [16] and directly beneath the propellers, an inch below the propellers, was found to be between 3 and 3.5 m s−1. Accordingly, if placed under the propellers the accuracy will be at the required level at least 50% of the time. Therefore, in extremely sunny conditions, the sensors may also need to be shielded to reach this level of accuracy. Work is in progress to develop specialized UAVs with such capabilities [3,6].
Supplementary Materials
The following are available online at https://0-www-mdpi-com.brum.beds.ac.uk/2073-4433/11/4/335/s1, Figure S1. Side-by-side boxplots of temperature differences (°C) between each iMET-XQ sensor and the 1.5 m tower thermistor (TiMET − T1.5m), by date for the 16 tower experiments (including the 3 dusk days). Red stars represent relative solar radiation values, green triangles represent relative 2 m wind speed values averaged over the duration of each experiment. Actual values are given in Table 1. The means of the temperature differences are represented by blue diamonds, the medians are shown by orange lines. A temperature difference of ±0.3 °C is marked by a red dotted line. A temperature difference of ±0.6 °C is marked by a green dotted line. Figure S2. Side-by side boxplots of temperature differences (°C) for each iMET-XQ and the 1.5m tower thermistor (TiMET − T1.5m) for the daytime Tower experiments (dusk experiments excluded). The means are represented by blue diamonds, the medians are shown by orange lines. A temperature difference of ±0.3 °C is marked by a red dotted line. A temperature difference of ±0.6 °C is marked by a green dotted line. Figure S3. Side-by-side boxplots of temperature difference (TiMET − TTower in °C) distributions for all 12 iMET-XQ sensors and all 652 timesteps, by solar radiation (W m−2) bin. Sample size (N) for each bin is given above each boxplot.
Author Contributions
S.K.K. was responsible for providing resources, formal analysis, software development, visualization, and original draft preparation. C.J.M. was responsible for providing resources, as well as review and editing. M.S.M. was responsible for statistical analysis, as well as review and editing. All authors have read and agreed to the published version of the manuscript.
Funding
The South Alabama Mesonet is funded by the National Oceanic and Atmospheric Administration’s National Mesonet Program.
Acknowledgments
The authors would like to acknowledge Lisa Schibelius, Caroline Carithers, Collin Carithers, and William Sherman for assistance with analysis.
Conflicts of Interest
The authors declare no conflict of interest. The funders had no role in the design of the study; in the collection, analyses, or interpretation of data; in the writing of the manuscript, or in the decision to publish the results.
Appendix A
In this appendix, the statistical tests referenced in Section 3 are described. To assess iMET-XQ precision, the absolute temperature difference ATD = |iMETx − iMETy| is used. To assess iMET-XQ accuracy, the temperature difference TD = TiMET − TTower is used. See Section 3 for details
A.1. Wind Bins for ATD (Precision)
Statistical tests were performed to assess whether the ATD changes by wind speed bin seen in Figure 6 are significantly different. Table A1 shows various statistics (including the mean, standard deviation, median, interquartile range) of the five wind speed bins. The mean ATD levels for the different wind speed bins were compared using Welch’s ANOVA that takes into account differences in variations. Significant differences in spread or variation in ATD, as measured by the standard deviation, were observed among different wind bins (Levene’s test, p < 0.0001). Variation in ATDs as measured by standard deviation clearly decreased as the wind speed bin increased. Taking into account these differences in variation, significant difference was observed between the mean ATD of at least two wind bins (Welch’s test, p < 0.0001). Post hoc analysis using Tukey-Cramer HSD indicated the mean ATDs were significantly different for all pairs of wind speed bins. As discussed earlier, the mean ATD is observed to decrease with increasing wind speed.

Table A1.
Statistics of the Absolute Temperature Differences (°C) in five wind speed bins used to assess the precision of the iMET-XQ sensors as a function of wind speed. IQR stands for Inter-Quartile Range.
Table A1.
Statistics of the Absolute Temperature Differences (°C) in five wind speed bins used to assess the precision of the iMET-XQ sensors as a function of wind speed. IQR stands for Inter-Quartile Range.
| Wind Bin Number | Wind Bin | N | Mean | Std Dev | Min | Max | Median | IQR |
|---|---|---|---|---|---|---|---|---|
| 1 | [0,1) | 7922 | 0.30 | 0.29 | 0.00 | 2.04 | 0.21 | 0.33 |
| 2 | [1,2) | 19383 | 0.21 | 0.21 | 0.00 | 1.81 | 0.14 | 0.25 |
| 3 | [2,3) | 11219 | 0.17 | 0.17 | 0.00 | 1.28 | 0.11 | 0.21 |
| 4 | [3,4) | 4211 | 0.10 | 0.12 | 0.00 | 1.10 | 0.06 | 0.09 |
| 5 | [4,6) | 715 | 0.06 | 0.04 | 0.00 | 0.22 | 0.05 | 0.06 |
A.2. Wind Bins for TD (Accuracy)
Table A2 shows various statistics of the TD distributions by wind speed bin. Statistical analyses were performed to determine if the variance (standard deviation) and means of the distributions in Figure 7 are significantly different. Significant differences in the variation in TDs were observed among the different wind speed bins (Levene’s test, p < 0.0001). Taking into account these differences in variation, when the mean TDs were compared for different wind speed bins, significant difference was observed between the mean TDs of at least two wind bins (Welch’s test, p < 0.0001). Post hoc analysis using Tukey-Cramer HSD indicated the mean TDs are significantly different for all pairs of wind bins except the last two: (3–4 m s−1) and (4–6 m s−1).
Table A2.
Statistics of the Temperature Differences (°C) between the twelve iMET-XQs and the 1.5 m tower sensor, in five wind speed bins used to assess the accuracy of the iMET-XQ sensors as a function of wind speed. IQR stands for Inter-Quartile Range.
Table A2.
Statistics of the Temperature Differences (°C) between the twelve iMET-XQs and the 1.5 m tower sensor, in five wind speed bins used to assess the accuracy of the iMET-XQ sensors as a function of wind speed. IQR stands for Inter-Quartile Range.
| Wind Bin Number | Wind Bin | N | Mean | Std Dev | Min | Max | Median | IQR | % Abs < 0.3 °C | % Abs < 0.6 °C |
|---|---|---|---|---|---|---|---|---|---|---|
| 1 | [0,1) | 1689 | 0.41 | 0.62 | −1.03 | 3.04 | 0.36 | 0.78 | 34.22 | 61.81 |
| 2 | [1,2) | 4111 | 0.15 | 0.52 | −1.43 | 2.45 | 0.12 | 0.70 | 43.01 | 74.51 |
| 3 | [2,3) | 2318 | 0.04 | 0.45 | −1.27 | 1.72 | 0.00 | 0.59 | 50.30 | 82.83 |
| 4 | [3,4) | 806 | −0.16 | 0.26 | −1.32 | 0.75 | −0.13 | 0.36 | 66.13 | 94.04 |
| 5 | [4,6) | 131 | −0.10 | 0.09 | −0.30 | 0.11 | −0.11 | 0.13 | 100.00 | 100.00 |
A.3. Radiation Bins ATD (Precision)
Figure 9 shows the distributions (boxplots) of ATD by solar radiation bin and Table A3 shows the statistics. Statistically significant differences in variation in ATD were observed among different radiation bins (Levene’s test, p < 0.0001). Variation in ATDs as measured by standard deviation increased as the radiation bin increased, except for the last radiation bin which showed a slight decrease. Taking into account these differences in variation, when the mean ATDs were compared for different radiation bins, significant difference was observed between the mean ATDs of at least two different radiation bins (Welch’s test, p < 0.0001). Post hoc analysis using Tukey-Cramer HSD indicated no significant difference among the mean ATD for radiation bins 2 (350–450 W m−2), 3 (450–550 W m−2), and 5 (650–750 W m−2). However the mean ATDs for remaining three radiation bins are significantly different from each other as well as from these three bins.
Table A3.
Statistics of the Absolute Temperature Differences in five solar radiation bins used to assess the precision of the iMET-XQ sensors as a function of solar radiation.
Table A3.
Statistics of the Absolute Temperature Differences in five solar radiation bins used to assess the precision of the iMET-XQ sensors as a function of solar radiation.
| Radiation Bin Number | Radiation Bin | N | Mean | Std Dev | Min | Max | Median | IQR |
|---|---|---|---|---|---|---|---|---|
| 1 | [100,350) | 1162 | 0.15 | 0.11 | 0.00 | 0.75 | 0.12 | 0.15 |
| 2 | [350,450) | 2036 | 0.22 | 0.18 | 0.00 | 0.89 | 0.18 | 0.25 |
| 3 | [450,550) | 7047 | 0.22 | 0.21 | 0.00 | 1.56 | 0.16 | 0.24 |
| 4 | [550,650) | 8429 | 0.19 | 0.21 | 0.00 | 1.62 | 0.11 | 0.23 |
| 5 | [650,750) | 9192 | 0.23 | 0.27 | 0.00 | 2.04 | 0.12 | 0.27 |
| 6 | [750,900) | 9143 | 0.25 | 0.21 | 0.00 | 1.68 | 0.20 | 0.27 |
A.4. Radiation Bins TD (Accuracy)
Not much difference in spread can be visually observed between the four bins with larger radiation values, however, statistical analyses similar to the previous sections, indicate that significant differences in variation in TDs were observed among different radiation bins (Levene’s test, p < 0.0001), but there is no clear trend with increasing radiation (Table A4). Taking into account the differences in variation established in the previous paragraph, when the mean TDs were compared for different radiation bins, significant differences were observed between the mean TDs of at least two radiation bins (Welch’s test, p < 0.0001). Post hoc analysis using Tukey-Cramer HSD indicated the mean TDs are significantly different for all pairs of radiation bins except three pairs. No significant difference was observed between mean TD values for the following pairs of radiation bins (i) 2 (350–450 W m−2) and 4 (550–650 W m−2), (ii) 1 (100–350 W m−2) and 5 (650–750 W m−2), and (iii) 3 (450–550 W m−2) and 6 (750–900 W m−2). In other words, the means of bins 1, 2, and 3 are significantly different from one another, so the increase in TD mean and spread with increasing radiation across those first three bins is statistically significant and expected physically. However, the unexpected drops in mean TD from bin 3 to 4 and from bin 4 to 5 are also statistically significant. The rise in mean TD from bin 5 to bin 6 is also statistically significant, but the mean of bin 6 does not differ significantly from the mean of bin 3.
Table A4.
Statistics of the Temperature Differences between each of the iMET-XQs and the 1.5 m tower sensor (°C) in five solar radiation bins used to assess the accuracy of the iMET-XQ sensors as a function of solar radiation. IQR stands for Inter-Quartile Range.
Table A4.
Statistics of the Temperature Differences between each of the iMET-XQs and the 1.5 m tower sensor (°C) in five solar radiation bins used to assess the accuracy of the iMET-XQ sensors as a function of solar radiation. IQR stands for Inter-Quartile Range.
| Radiation Bin Number | Radiation Bin | N | Mean | Std Dev | Min | Max | Median | IQR |
|---|---|---|---|---|---|---|---|---|
| 1 | [100,350) | 293 | −0.03 | 0.42 | −0.92 | 1.10 | −0.05 | 0.56 |
| 2 | [350,450) | 465 | 0.18 | 0.43 | −0.78 | 1.35 | 0.20 | 0.58 |
| 3 | [450,550) | 1506 | 0.27 | 0.53 | −1.21 | 2.62 | 0.28 | 0.71 |
| 4 | [550,650) | 1696 | 0.10 | 0.49 | −1.32 | 1.92 | 0.05 | 0.74 |
| 5 | [650,750) | 1827 | −0.01 | 0.52 | −1.27 | 2.39 | −0.06 | 0.62 |
| 6 | [750,900) | 1867 | 0.26 | 0.55 | −1.43 | 2.18 | 0.24 | 0.74 |
References
- Jacob, J.D.; Chilson, P.B.; Houston, A.L.; Weaver Smith, S. Considerations for atmospheric measurements with small unmanned aircraft systems. Atmosphere 2018, 9, 252. [Google Scholar] [CrossRef] [Green Version]
- Lee, T.R.; Buban, M.; Dumas, E.; Baker, C.B. On the use of rotary-wing aircraft to sample near-surface thermodynamic fields: Results from recent field campaigns. Sensors 2019, 19, 10. [Google Scholar] [CrossRef] [PubMed] [Green Version]
- Greene, B.R.; Segales, A.R.; Waugh, S.; Duthoit, S.; Chilson, P.B. Considerations for temperature sensor placement on rotary-wing unmanned aircraft systems. Atmos. Meas. Tech. 2018, 11, 5519–5530. [Google Scholar] [CrossRef] [Green Version]
- Shapiro, M.A. Meteorological tower measurements of a surface cold front. Mon. Weather Rev. 1984, 112, 1634–1639. [Google Scholar] [CrossRef] [Green Version]
- Brosy, C.; Krampf, K.; Zeeman, M.; Wolf, B.; Junkermann, W.; Schafer, K.; Emeis, S.; Kunstmann, H. Simultaneous multicopter-based air sampling and sensing of meteorological variables. Atmos. Meas. Tech. 2017, 10, 2773–2784. [Google Scholar] [CrossRef] [Green Version]
- Greene, B.R.; Segales, A.R.; Bell, T.M.; Pillar-Little, E.A.; Chilson, P.B. Environmental and sensor integration influences on temperature measurements by rotary-wing unmanned aircraft systems. Sensors 2019, 19, 1470. [Google Scholar] [CrossRef] [PubMed] [Green Version]
- Barbieri, L.; Kral, S.T.; Bailey, S.C.C.; Frazier, A.E.; Jacob, J.D.; Reuder, J.; Brus, D.; Chilson, D.B.; Crick, C.; Detweiler, C.; et al. Intercomparison of small unmanned aircraft system (sUAS) measurements for atmospheric science during the LAPSE-RATE campaign. Sensors 2019, 19, 2179. [Google Scholar] [CrossRef] [PubMed] [Green Version]
- Houston, A.L.; Keeler, J.M. The impact of sensor response and airspeed on the representation of the convective boundary layer and airmass boundaries by small unmanned aircraft systems. J. Atmos. Ocean. Technol. 2018, 35, 1687–1699. [Google Scholar] [CrossRef]
- Koch, S.E.; Fengler, M.; Chilson, P.B.; Elmore, K.L.; Argrow, B.; Andra, D.L., Jr.; Lindlet, T. On the use of unmanned aircraft for sampling mesoscale phenomena in the preconvective boundary layer. J. Atmos. Ocean. Technol. 2018, 35, 2265–2288. [Google Scholar] [CrossRef]
- Schuyler, T.J.; Bailey, S.C.C.; Guzman, M.I. Monitoring tropospheric gases with small unmanned aerial systems (sUAS) during the second CLOUDMAP flight campaign. Atmosphere 2019, 10, 434. [Google Scholar] [CrossRef] [Green Version]
- Schuyler, T.J.; Iman Gohari, S.M.; Pundsack, G.; Berchoff, D.; Guzman, M.I. Using a balloon-launched unmanned glider to validate real-time WRF modeling. Sensors 2019, 19, 1914. [Google Scholar] [CrossRef] [PubMed]
- Hubbard, K.; Lin, X.; Baker, C.; Sun, B. Air temperature comparison between the MMTS and the USCRN temperature systems. J. Atmos. Ocean. Technol. 2004, 21, 1590–1597. [Google Scholar] [CrossRef]
- Jensen, M.P.; Holdridge, D.J.; Survo, P.; Lehtinen, R.; Baxter, S.; Toto, T.; Johnson, K.L. Comparison of Vaisala radiosondes RS41 and RS92 at the ARM Southern Great Plains site. Atmos. Meas. Tech. 2016, 9, 3115–3129. [Google Scholar] [CrossRef] [Green Version]
- Nash, J.; Oakley, T.; Vömel, H.; Wei, L. WMO Intercomparison of High Quality Radiosonde Systems, Yangjiang, China, 12 July–3 August 2010; IOM Report 107; World Meteorological Organization: Geneva, Switzerland, 2010; p. 248. [Google Scholar]
- Kimball, S.K.; Mulekar, M.S.; Cummings, S.; Stamates, J. The University of South Alabama Mesonet and coastal observing system: A technical and statistical overview. J. Atmos. Oceanic Technol. 2010, 27, 1417–1439. [Google Scholar] [CrossRef]
- Kimball, S.K.; Montalvo, C.J.; Mulekar, M.S. Assessing iMET-XQ performance and optimal placement on a small off-the-shelf rotary-wing UAV, as a function of atmospheric conditions. Atmosphere 2010. (in review). [Google Scholar]
Figure 1.
Photo of all 12 iMET-XQ sensors mounted side-by-side on the 2 m cross-arm of the South Alabama Mesonet tower. Bottom right, below the cross-arm, is the radiation shield containing the model 107 thermistor probe from Campbell Scientific Inc. The HMP-45C Temperature/Relative Humidity probe is installed in the radiation shield on the top right. The identical radiation shield on the left contains an iMET-XQ sensor in the Radiation Shield experiments.

Figure 2.
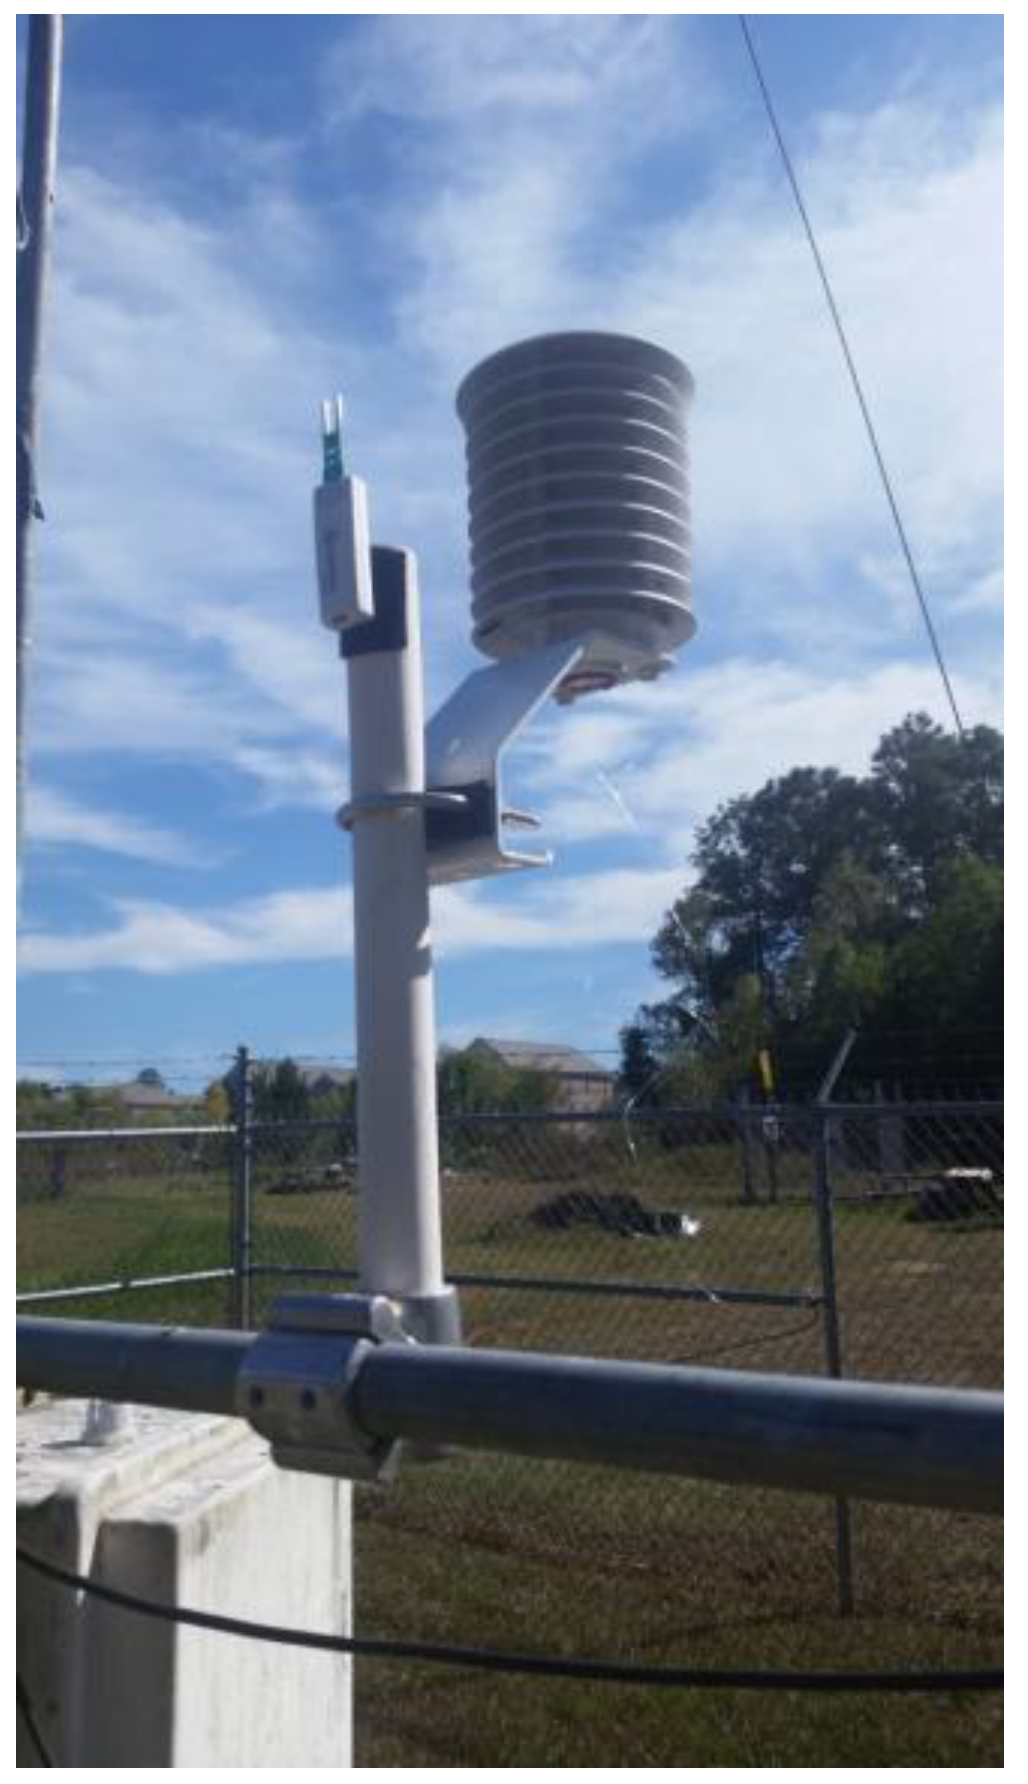
Close-up of iMET-XQ sensors used in the Radiation Shield experiment configuration. The radiation shield contains an iMET-XQ sensor. An exposed iMET-XQ is mounted beside the radiation shield.
Figure 2.
Close-up of iMET-XQ sensors used in the Radiation Shield experiment configuration. The radiation shield contains an iMET-XQ sensor. An exposed iMET-XQ is mounted beside the radiation shield.

Figure 3.
Boxplots of temperature differences (°C) for all iMET-XQ pairs by date for the 16 Tower experiments (including the 3 dusk days). Red stars represent relative solar radiation values averaged over the duration of each experiment. Green triangles represent relative 2 m wind speed values averaged over the duration of each experiment. Table 1 provides the actual values of mean solar radiation and mean 2 m wind speed values. The temperature difference means are represented by blue diamonds, the medians are shown by orange lines. A temperature difference of 0.3 °C is marked by a red dotted line. A temperature difference of 0.6 °C is marked by a green dotted line.

Figure 4.
Temperature difference (°C) boxplots for each iMET-XQ sensor (x-axis) with all the other iMET-XQ sensors for the day-time tower experiments (i.e., the dusk experiments were excluded). The means are represented by blue diamonds, the medians are shown by orange lines. A temperature difference of ±0.3 °C is marked by a red dotted line. A temperature difference of ±0.6 °C is marked by a green dotted line.

Figure 5.
Absolute temperature difference (°C) of all iMET-XQ pairs on all experiment days by 2 m wind speed (m s−1, x-axis) and solar radiation (color), for the daytime Tower experiments (i.e., dusk experiments excluded).
Figure 5.
Absolute temperature difference (°C) of all iMET-XQ pairs on all experiment days by 2 m wind speed (m s−1, x-axis) and solar radiation (color), for the daytime Tower experiments (i.e., dusk experiments excluded).

Figure 6.
Side-by-side boxplots of absolute temperature differences (°C) of all iMET-XQ pairs by 1.0 m s−1 sized wind bins, for the daytime Tower experiments (i.e., dusk experiments excluded). The sample size (N) for each bin is given above each boxplot.
Figure 6.
Side-by-side boxplots of absolute temperature differences (°C) of all iMET-XQ pairs by 1.0 m s−1 sized wind bins, for the daytime Tower experiments (i.e., dusk experiments excluded). The sample size (N) for each bin is given above each boxplot.

Figure 7.
Side-by-side boxplots of the absolute values of the temperature differences (°C) between the iMET-XQ and 1.5 m tower temperature thermistor (TiMET − TTower), for each timestep and each iMET-XQ, by 1 m s−1 wind speed bins. Sample size (N) for each bin is given above each boxplot.
Figure 7.
Side-by-side boxplots of the absolute values of the temperature differences (°C) between the iMET-XQ and 1.5 m tower temperature thermistor (TiMET − TTower), for each timestep and each iMET-XQ, by 1 m s−1 wind speed bins. Sample size (N) for each bin is given above each boxplot.

Figure 8.
Side-by-side boxplots of solar radiation (W m−2) by 1 m s−1 wind speed bin, for the day-time Tower experiments (i.e., dusk experiments excluded). Sample size (N) for each bin is given above each boxplot.
Figure 8.
Side-by-side boxplots of solar radiation (W m−2) by 1 m s−1 wind speed bin, for the day-time Tower experiments (i.e., dusk experiments excluded). Sample size (N) for each bin is given above each boxplot.

Figure 9.
Absolute Temperature Difference of iMET-XQ pairs by solar radiation bin. Sample size (N) for each bin is given above each boxplot.
Figure 9.
Absolute Temperature Difference of iMET-XQ pairs by solar radiation bin. Sample size (N) for each bin is given above each boxplot.

Figure 10.
Side-by-side boxplots of wind speed distributions, by solar radiation bin for the daytime Tower experiments. Sample size (N) for each bin is given above each boxplot.
Figure 10.
Side-by-side boxplots of wind speed distributions, by solar radiation bin for the daytime Tower experiments. Sample size (N) for each bin is given above each boxplot.

Figure 11.
Temperature difference (°C) between the 2 m and 1.5 m temperature sensors (T2m–T1.5m) on the Mesonet tower as a function of 2 m wind speed (m s−1, x-axis) and solar radiation (W m−2, colors).
Figure 11.
Temperature difference (°C) between the 2 m and 1.5 m temperature sensors (T2m–T1.5m) on the Mesonet tower as a function of 2 m wind speed (m s−1, x-axis) and solar radiation (W m−2, colors).

Figure 12.
Side-by-side boxplot by 2 m wind speed bins (m s−1, labeled on x-axis) of temperature difference (°C) between between (a) the exposed iMET-XQ sensor and HMP-45C (Texposed − T2m); (b) the shielded iMET-XQ sensor and HMP-45C (Tshielded − T2m); and (c) the shielded and exposed iMET-XQ sensors (Tshielded − Texposed). Sample size (N) for each bin is given above each boxplot. The means are represented by blue diamonds, the medians are shown by orange lines. A temperature difference of ±0.3 °C is marked by a red dotted line. A temperature difference of ±0.6 °C is marked by a green dotted line.

Table 1.
Tower experiments by date with solar conditions, meteorological conditions, and experiment time averaged over the length of the experiment. Experiment duration, sample size (N), and missing values are also listed.
Table 1.
Tower experiments by date with solar conditions, meteorological conditions, and experiment time averaged over the length of the experiment. Experiment duration, sample size (N), and missing values are also listed.
| Date | Radiation (W m−2) | Solar Elevation (Degrees) | Solar Azimuth (Degrees) | 2 m Wind Speed (m s−1) | 2 m Wind Dir. (Degrees) | 10 m Vert. Wind Speed (m s−1) | 1.5 m Temperature (°C) | 2 m Dew Point (°C) | Experiment Time (m) | N | Missing |
|---|---|---|---|---|---|---|---|---|---|---|---|
| 4 April 2018 | 644.46 | 44.58 | 243.28 | 2.23 | 29.29 | 0.59 | 19.37 | 1.36 | 104 | 6502 | 362 |
| 11 April 2018 | 828.87 | 64.63 | 205.39 | 1.87 | 33.65 | 0.33 | 22.79 | 5.22 | 76 | 4871 | 145 |
| 25 April 2018 | 709.48 | 54.63 | 246.99 | 1.63 | 319.52 | 0.37 | 25.77 | 11.10 | 56 | 3407 | 289 |
| 7 May 2018 | 837.53 | 73.96 | 208.69 | 1.67 | 308.99 | 0.43 | 30.58 | 9.58 | 46 | 2070 | 966 |
| 18 January 2019 | - | 17.66 | 231.55 | 1.59 | 87.62 | 0.19 | 18.86 | 14.40 | 39 | 1396 | 1178 |
| 8 February 2019 | - | 29.38 | 226.03 | 3.12 | 35.99 | 0.54 | 13.68 | −1.18 | 61 | 3908 | 118 |
| 28 March 2019 | 534.97 | 39.12 | 244.99 | 1.53 | 111.49 | 0.29 | 22.67 | 2.89 | 60 | 3122 | 838 |
| 1 April 2019 | 554.80 | 37.32 | 249.14 | 1.38 | 91.81 | 0.15 | 19.56 | −3.48 | 87 | 4513 | 1229 |
| 29 April 2019 | 640.01 | 45.14 | 258.91 | 1.26 | 113.86 | 0.19 | 27.55 | 14.85 | 56 | 2996 | 700 |
| 6 May 2019 | 514.48 | 36.04 | 268.45 | 1.07 | 244.19 | 0.03 | 29.89 | 10.98 | 67 | 2662 | 1760 |
| 21 May 2019 | 0.20 | −7.76 | 299.10 | 0.58 | 103.95 | 0.12 | 24.95 | 21.62 | 61 | 3056 | 970 |
| 23 May 2019 | 0.75 | −4.47 | 297.17 | 0.84 | 220.98 | 0.13 | 27.95 | 21.61 | 53 | 2581 | 917 |
| 25 July 2019 | 0.02 | −14.98 | 304.40 | 0.43 | 252.67 | 0.00 | 24.63 | 20.89 | 66 | 2528 | 1828 |
| 27 July 2019 | 507.66 | 39.30 | 89.67 | 2.12 | 68.25 | 0.12 | 28.09 | 22.66 | 71 | 3177 | 1509 |
| 8 August 2019 | 479.82 | 55.51 | 107.75 | 2.12 | 261.60 | 0.18 | 30.48 | 24.87 | 62 | 1827 | 2265 |
| 16 August 2019 | 661.79 | 55.03 | 247.09 | 1.30 | 45.76 | 0.13 | 35.06 | 20.01 | 86 | 2999 | 2677 |
Table 2.
Radiation Shield experiments by date with solar conditions, meteorological conditions, and experiment time averaged over the length of the experiment. Experiment duration, sample size (N), and missing values are also listed.
Table 2.
Radiation Shield experiments by date with solar conditions, meteorological conditions, and experiment time averaged over the length of the experiment. Experiment duration, sample size (N), and missing values are also listed.
| Date | Radiation (W m−2) | Solar Elevation (Degrees) | Solar Azimuth (Degrees) | 2 m Wind Speed (m s−1) | 2 m Wind Dir. (Degrees) | Vert. Wind Speed (m s−1) | 1.5 m Temperature (°C) | 2 m Dew Point (°C) | Experiment Time (m) |
|---|---|---|---|---|---|---|---|---|---|
| 8 March 2018 | 697.89 | 51.16 | 202.55 | 2.26 | 310.99 | 0.62 | 14.82 | −5.33 | 52 |
| 15 March 2018 | 687.48 | 48.17 | 220.00 | 2.19 | 232.26 | 0.59 | 19.66 | −0.21 | 99 |
| 22 March 2018 | 778.55 | 57.69 | 191.26 | 2.07 | 20.76 | 0.51 | 17.75 | 0.30 | 123 |
| 26 April 2018 | 475.76 | 35.52 | 264.42 | 2.74 | 273.52 | 0.37 | 22.87 | 10.19 | 71 |
| 8 May 2018 | 535.67 | 61.02 | 245.73 | 1.31 | 53.72 | 0.17 | 30.91 | 10.27 | 125 |
| 6 February 2019 | - | 31.13 | 222.58 | 0.86 | 180.70 | 0.28 | 23.74 | 20.13 | 30 |
| 13 February 2019 | 466.71 | 29.88 | 228.35 | 1.59 | 57.99 | 0.15 | 16.52 | −1.81 | 21 |
| 27 February 2019 | 537.88 | 38.84 | 224.49 | 1.34 | 122.37 | 0.14 | 24.95 | 14.37 | 26 |
| 6 March 2019 | 551.14 | 34.51 | 235.57 | 1.62 | 23.62 | 0.29 | 13.27 | -8.05 | 24 |
| 12 March 2019 | 322.22 | 41.29 | 230.91 | 1.41 | 72.13 | 0.08 | 23.34 | 10.23 | 26 |
| 14 March 2019 | 162.06 | 34.64 | 240.67 | 1.26 | 142.96 | 0.40 | 23.23 | 21.81 | 20 |
| 25 March 2019 | 237.40 | 34.07 | 248.16 | 2.25 | 227.83 | 0.37 | 24.43 | 16.41 | 22 |
| 27 March 2019 | 557.51 | 38.08 | 245.53 | 1.89 | 52.40 | 0.02 | 22.97 | 5.82 | 35 |
| 3 April 2019 | 551.32 | 42.32 | 245.85 | 1.87 | 118.41 | 0.49 | 22.91 | 4.01 | 25 |
| 17 April 2019 | 598.90 | 50.78 | 246.17 | 1.36 | 153.78 | 0.25 | 24.99 | 12.79 | 26 |
| 23 April 2019 | 235.94 | 33.02 | 264.77 | 1.54 | 226.55 | 0.30 | 22.63 | 10.11 | 25 |
| 26 April 2019 | 523.72 | 35.64 | 264.44 | 1.91 | 25.68 | 0.37 | 25.98 | 8.01 | 24 |
| 3 May 2019 | 831.07 | 73.95 | 199.32 | 1.19 | 157.35 | 0.42 | 29.14 | 18.55 | 24 |
| 9 May 2019 | 378.96 | 76.31 | 173.34 | 2.33 | 113.93 | 0.40 | 27.13 | 22.52 | 32 |
| 14 May 2019 | 755.62 | 57.68 | 255.66 | 2.00 | 30.13 | 0.40 | 26.57 | 11.88 | 30 |
| 16 May 2019 | 408.99 | 44.74 | 266.86 | 1.56 | 219.14 | 0.31 | 29.36 | 17.14 | 34 |
| 27 June 2019 | 629.02 | 50.25 | 89.62 | 1.29 | 223.45 | 0.23 | 29.67 | 22.09 | 17 |
| 1 August 2019 | 418.20 | 76.76 | 194.83 | 1.17 | 210.69 | 0.13 | 32.67 | 19.88 | 21 |
Table 3.
Upper and lower limits for the automated range tests.
| Variable | Lower Limit | Upper Limit |
|---|---|---|
| Temperature (°C) | −15.0 | 50.0 |
| Wind Direction (degrees) | 0 | 360.0 |
| Wind speed (m s−1) | 0 | 20.0 |
| Solar Radiation (W m−2) | 0 | 1500 |
Table 4.
Statistics of temperature differences (TD) between each iMET-XQ sensor and all other iMET-XQ sensors.
Table 4.
Statistics of temperature differences (TD) between each iMET-XQ sensor and all other iMET-XQ sensors.
| iMET | min TD (°C) | max TD (°C) | % TD < 0.0 °C | % |TD| < 0.3 °C | % |TD| < 0.6 °C | Median TD (°C) | N |
|---|---|---|---|---|---|---|---|
| 7 | −1.81 | 1.89 | 31.92 | 75.15 | 92.34 | 0.08 | 7321 |
| 10 | −1.84 | 1.62 | 40.00 | 75.13 | 91.85 | 0.04 | 6418 |
| 11 | −1.26 | 1.43 | 23.41 | 78.74 | 94.83 | 0.11 | 7235 |
| 12 | −1.40 | 2.04 | 24.01 | 68.00 | 90.50 | 0.10 | 8059 |
| 13 | −1.82 | 1.38 | 63.87 | 76.47 | 94.81 | −0.04 | 8163 |
| 15 | −1.62 | 1.84 | 62.07 | 80.04 | 95.51 | −0.03 | 8131 |
| 17 | −1.55 | 1.49 | 73.10 | 76.93 | 95.16 | −0.07 | 7725 |
| 18 | −1.68 | 0.83 | 78.17 | 76.70 | 93.81 | −0.09 | 7825 |
| 19 | −2.04 | 1.68 | 62.72 | 77.53 | 94.13 | −0.03 | 7258 |
| 20 | −1.84 | 1.46 | 44.00 | 76.50 | 94.98 | 0.02 | 6729 |
| 21 | −1.64 | 0.65 | 67.85 | 83.76 | 96.31 | −0.03 | 3904 |
| 22 | −1.89 | 1.28 | 48.84 | 74.43 | 92.90 | 0.01 | 8132 |
Table 5.
Number of positive, negative, and total Temperature Difference (TD = TiMET − T2m) observations in each wind speed bin (m s−1) and solar radiation group (W m−2). Note: to construct Table 5, zero values of TD were not counted (there were very few).
Table 5.
Number of positive, negative, and total Temperature Difference (TD = TiMET − T2m) observations in each wind speed bin (m s−1) and solar radiation group (W m−2). Note: to construct Table 5, zero values of TD were not counted (there were very few).
| Wind Bin Number | Wind Bin (m s−1) | Solar Radiation (W m−2) | Number of Negative TD | Number of Positive TD | Total Number of Observations |
|---|---|---|---|---|---|
| 1 | 0–1 | ≤400 | 31 | 20 | 51 (35.7%) |
| >400 | 22 | 70 | 92 (64.3%) | ||
| 2 | 1–2 | ≤400 | 63 | 37 | 100 (28.1%) |
| >400 | 122 | 134 | 256 (71.9%) | ||
| 3 | 2–3 | ≤400 | 32 | 11 | 43 (21.1%) |
| >400 | 87 | 74 | 161 (78.9%) | ||
| 4 | 3–4 | ≤400 | 7 | 1 | 8 (9.5%) |
| >400 | 57 | 19 | 76 (90.5%) | ||
| 5 | 4–6 | ≤400 | 2 | 0 | 2 (20%) |
| >400 | 8 | 0 | 8 (80%) |
© 2020 by the authors. Licensee MDPI, Basel, Switzerland. This article is an open access article distributed under the terms and conditions of the Creative Commons Attribution (CC BY) license (http://creativecommons.org/licenses/by/4.0/).
Share and Cite
MDPI and ACS Style
Kimball, S.K.; Montalvo, C.J.; Mulekar, M.S. Evaluating Temperature Measurements of the iMET-XQ, in the Field, under Varying Atmospheric Conditions. Atmosphere 2020, 11, 335. https://0-doi-org.brum.beds.ac.uk/10.3390/atmos11040335
AMA Style
Kimball SK, Montalvo CJ, Mulekar MS. Evaluating Temperature Measurements of the iMET-XQ, in the Field, under Varying Atmospheric Conditions. Atmosphere. 2020; 11(4):335. https://0-doi-org.brum.beds.ac.uk/10.3390/atmos11040335
Chicago/Turabian StyleKimball, Sytske K., Carlos J. Montalvo, and Madhuri S. Mulekar. 2020. "Evaluating Temperature Measurements of the iMET-XQ, in the Field, under Varying Atmospheric Conditions" Atmosphere 11, no. 4: 335. https://0-doi-org.brum.beds.ac.uk/10.3390/atmos11040335
Note that from the first issue of 2016, this journal uses article numbers instead of page numbers. See further details here.