A Comparison of Meteor Radar Observation over China Region with Horizontal Wind Model (HWM14)

 ,
, 
Abstract
:1. Introduction
2. Data Set and HWM14
3. Results and Analysis
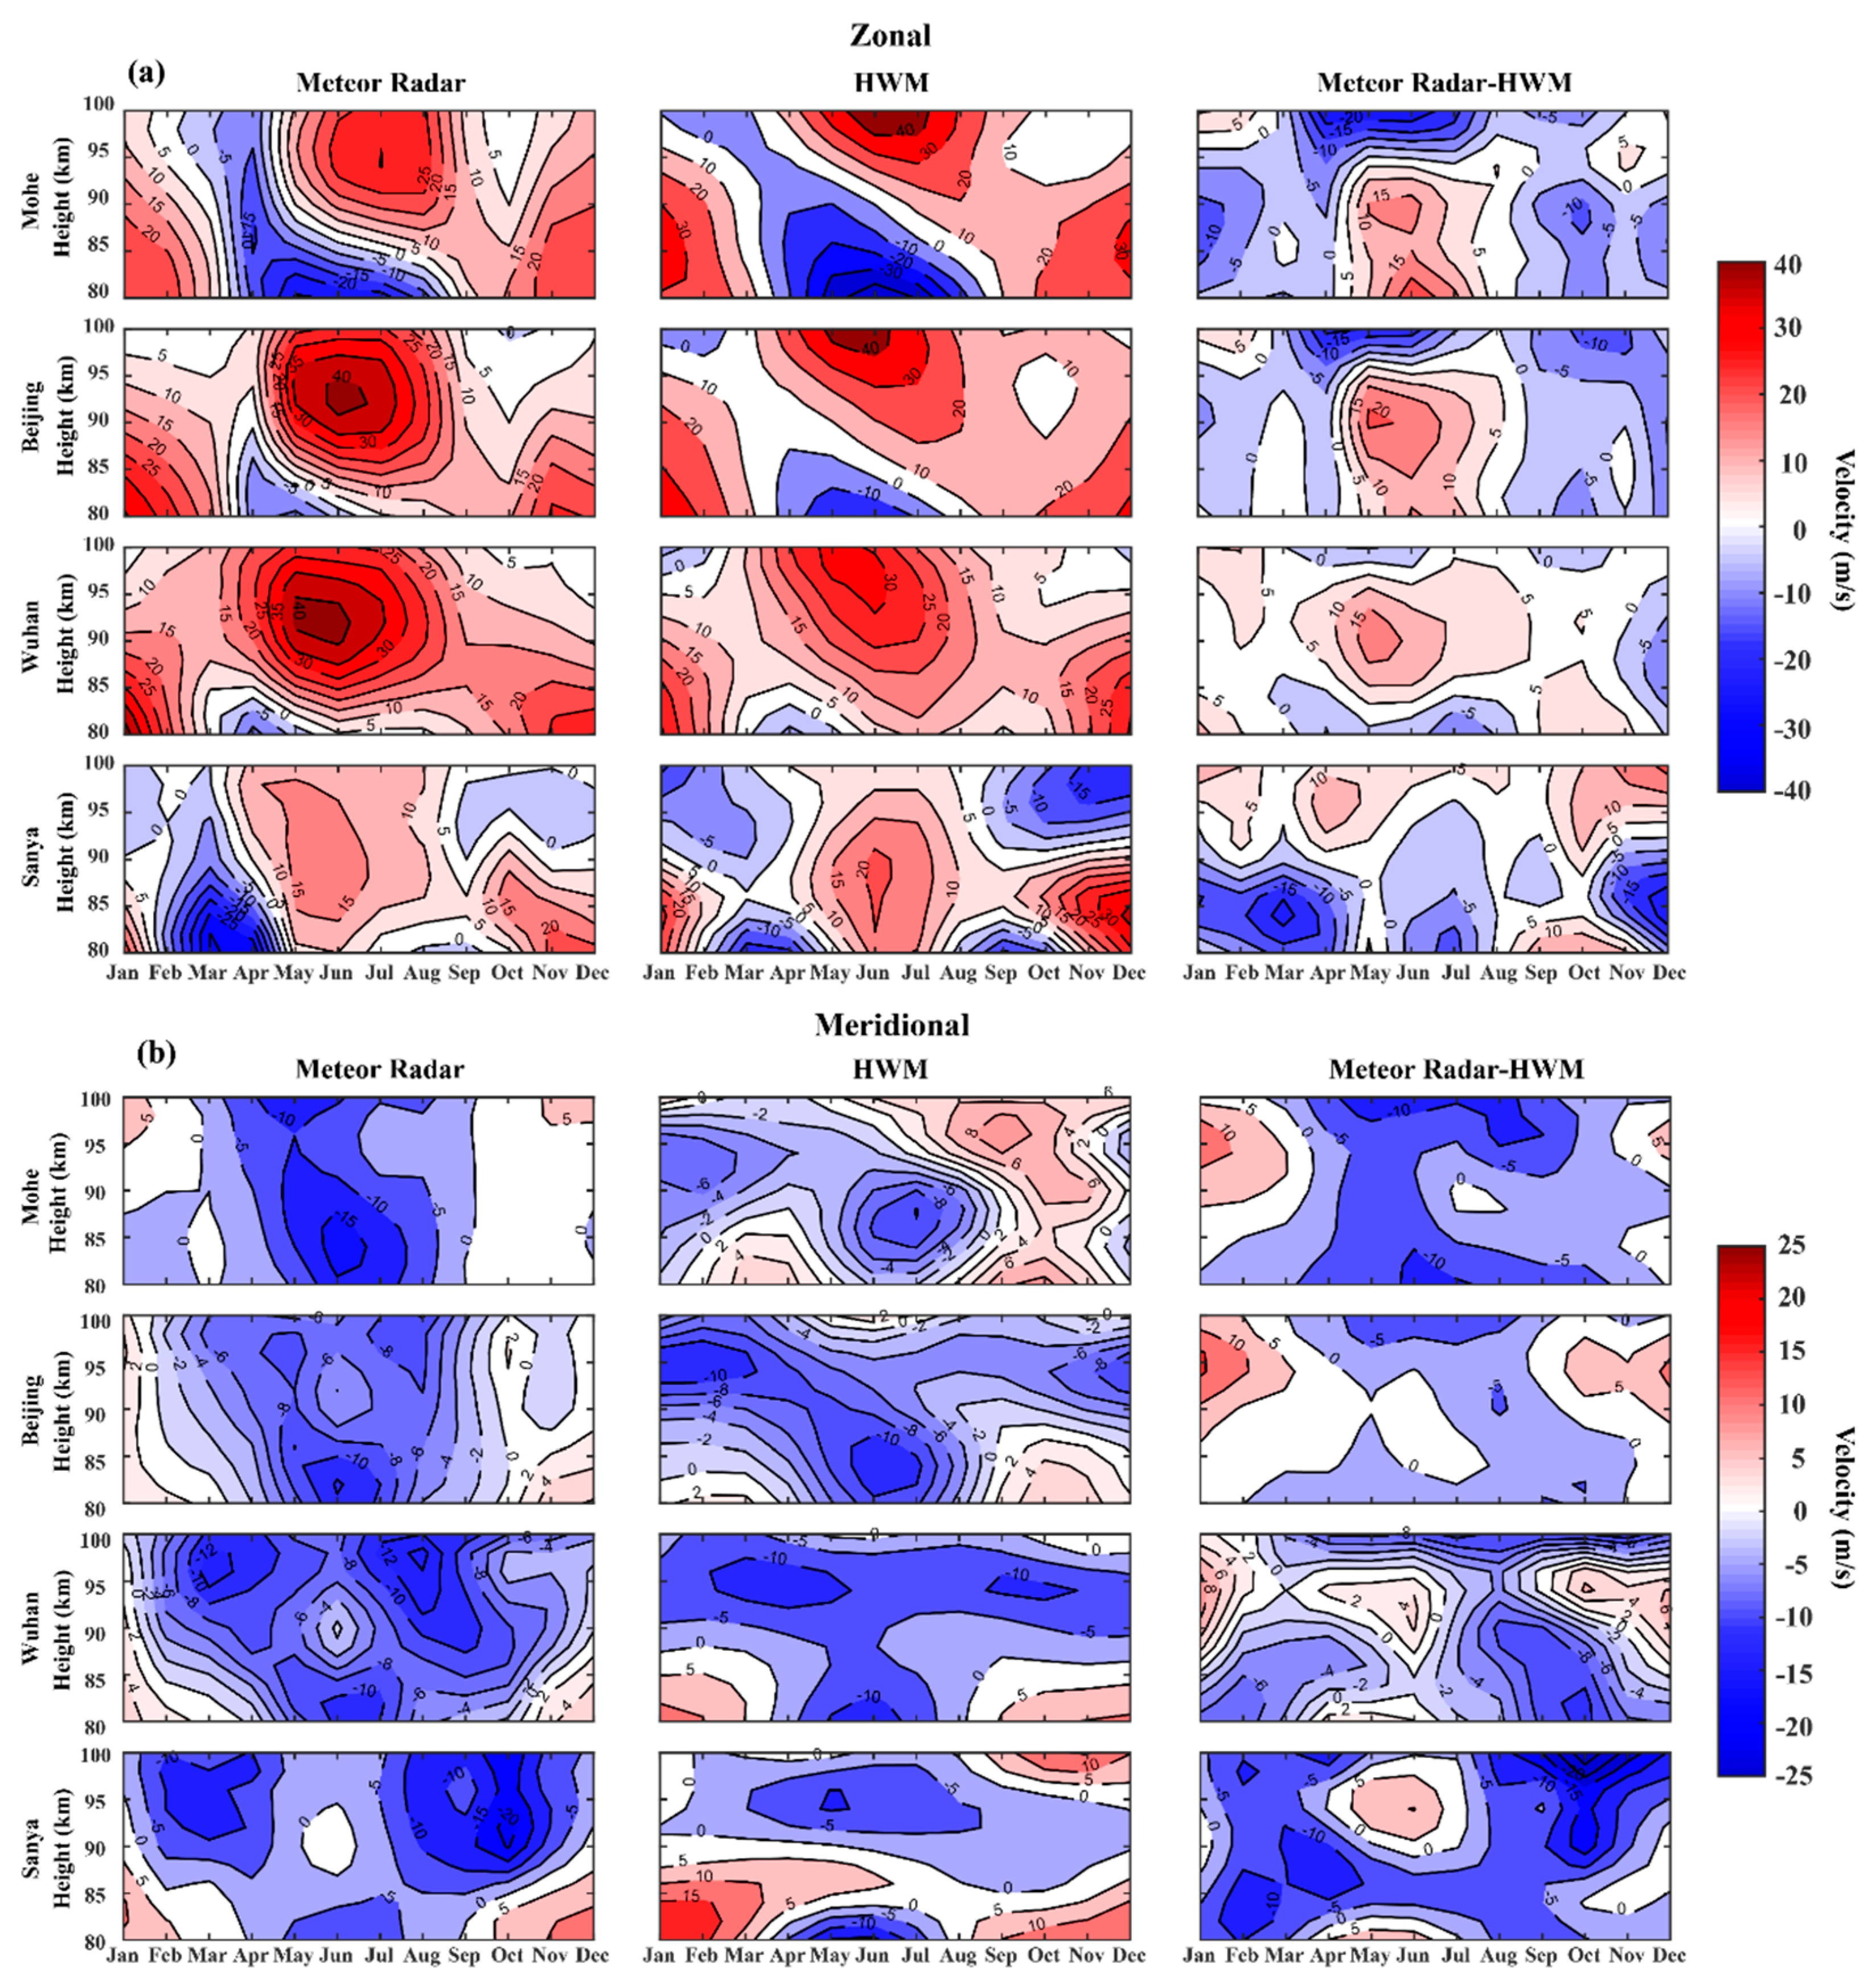
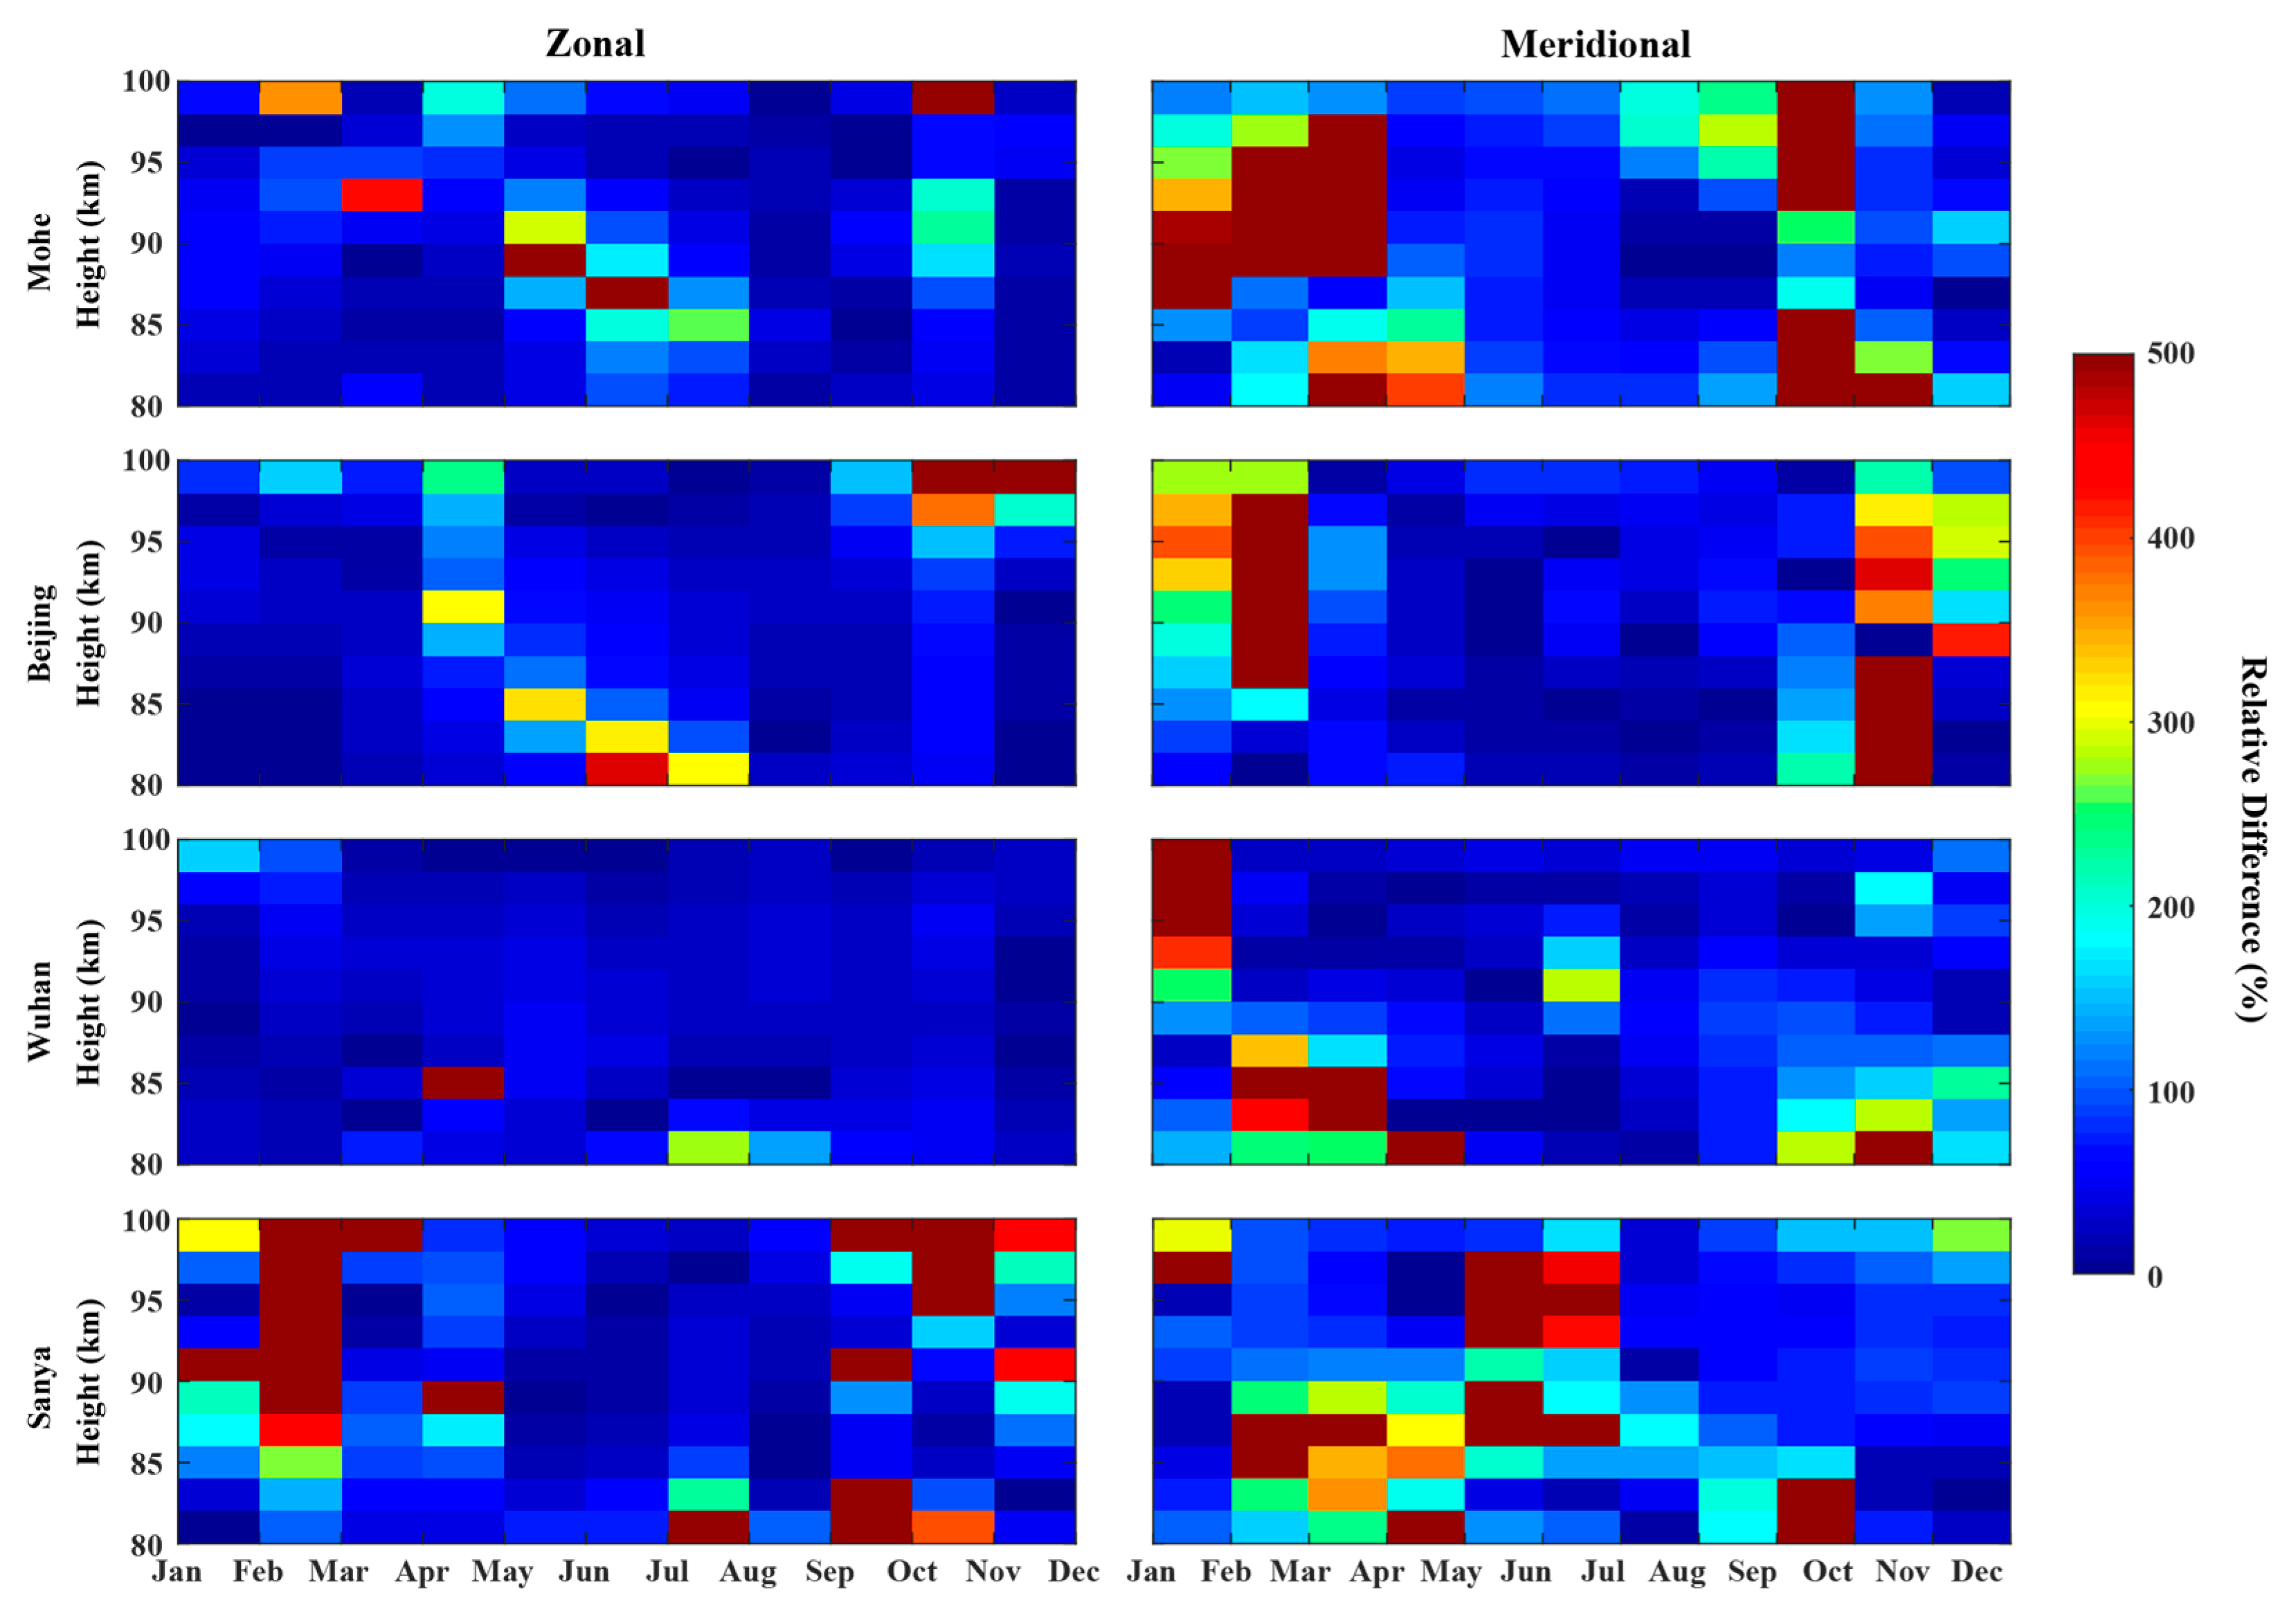
3.1. Mean Winds
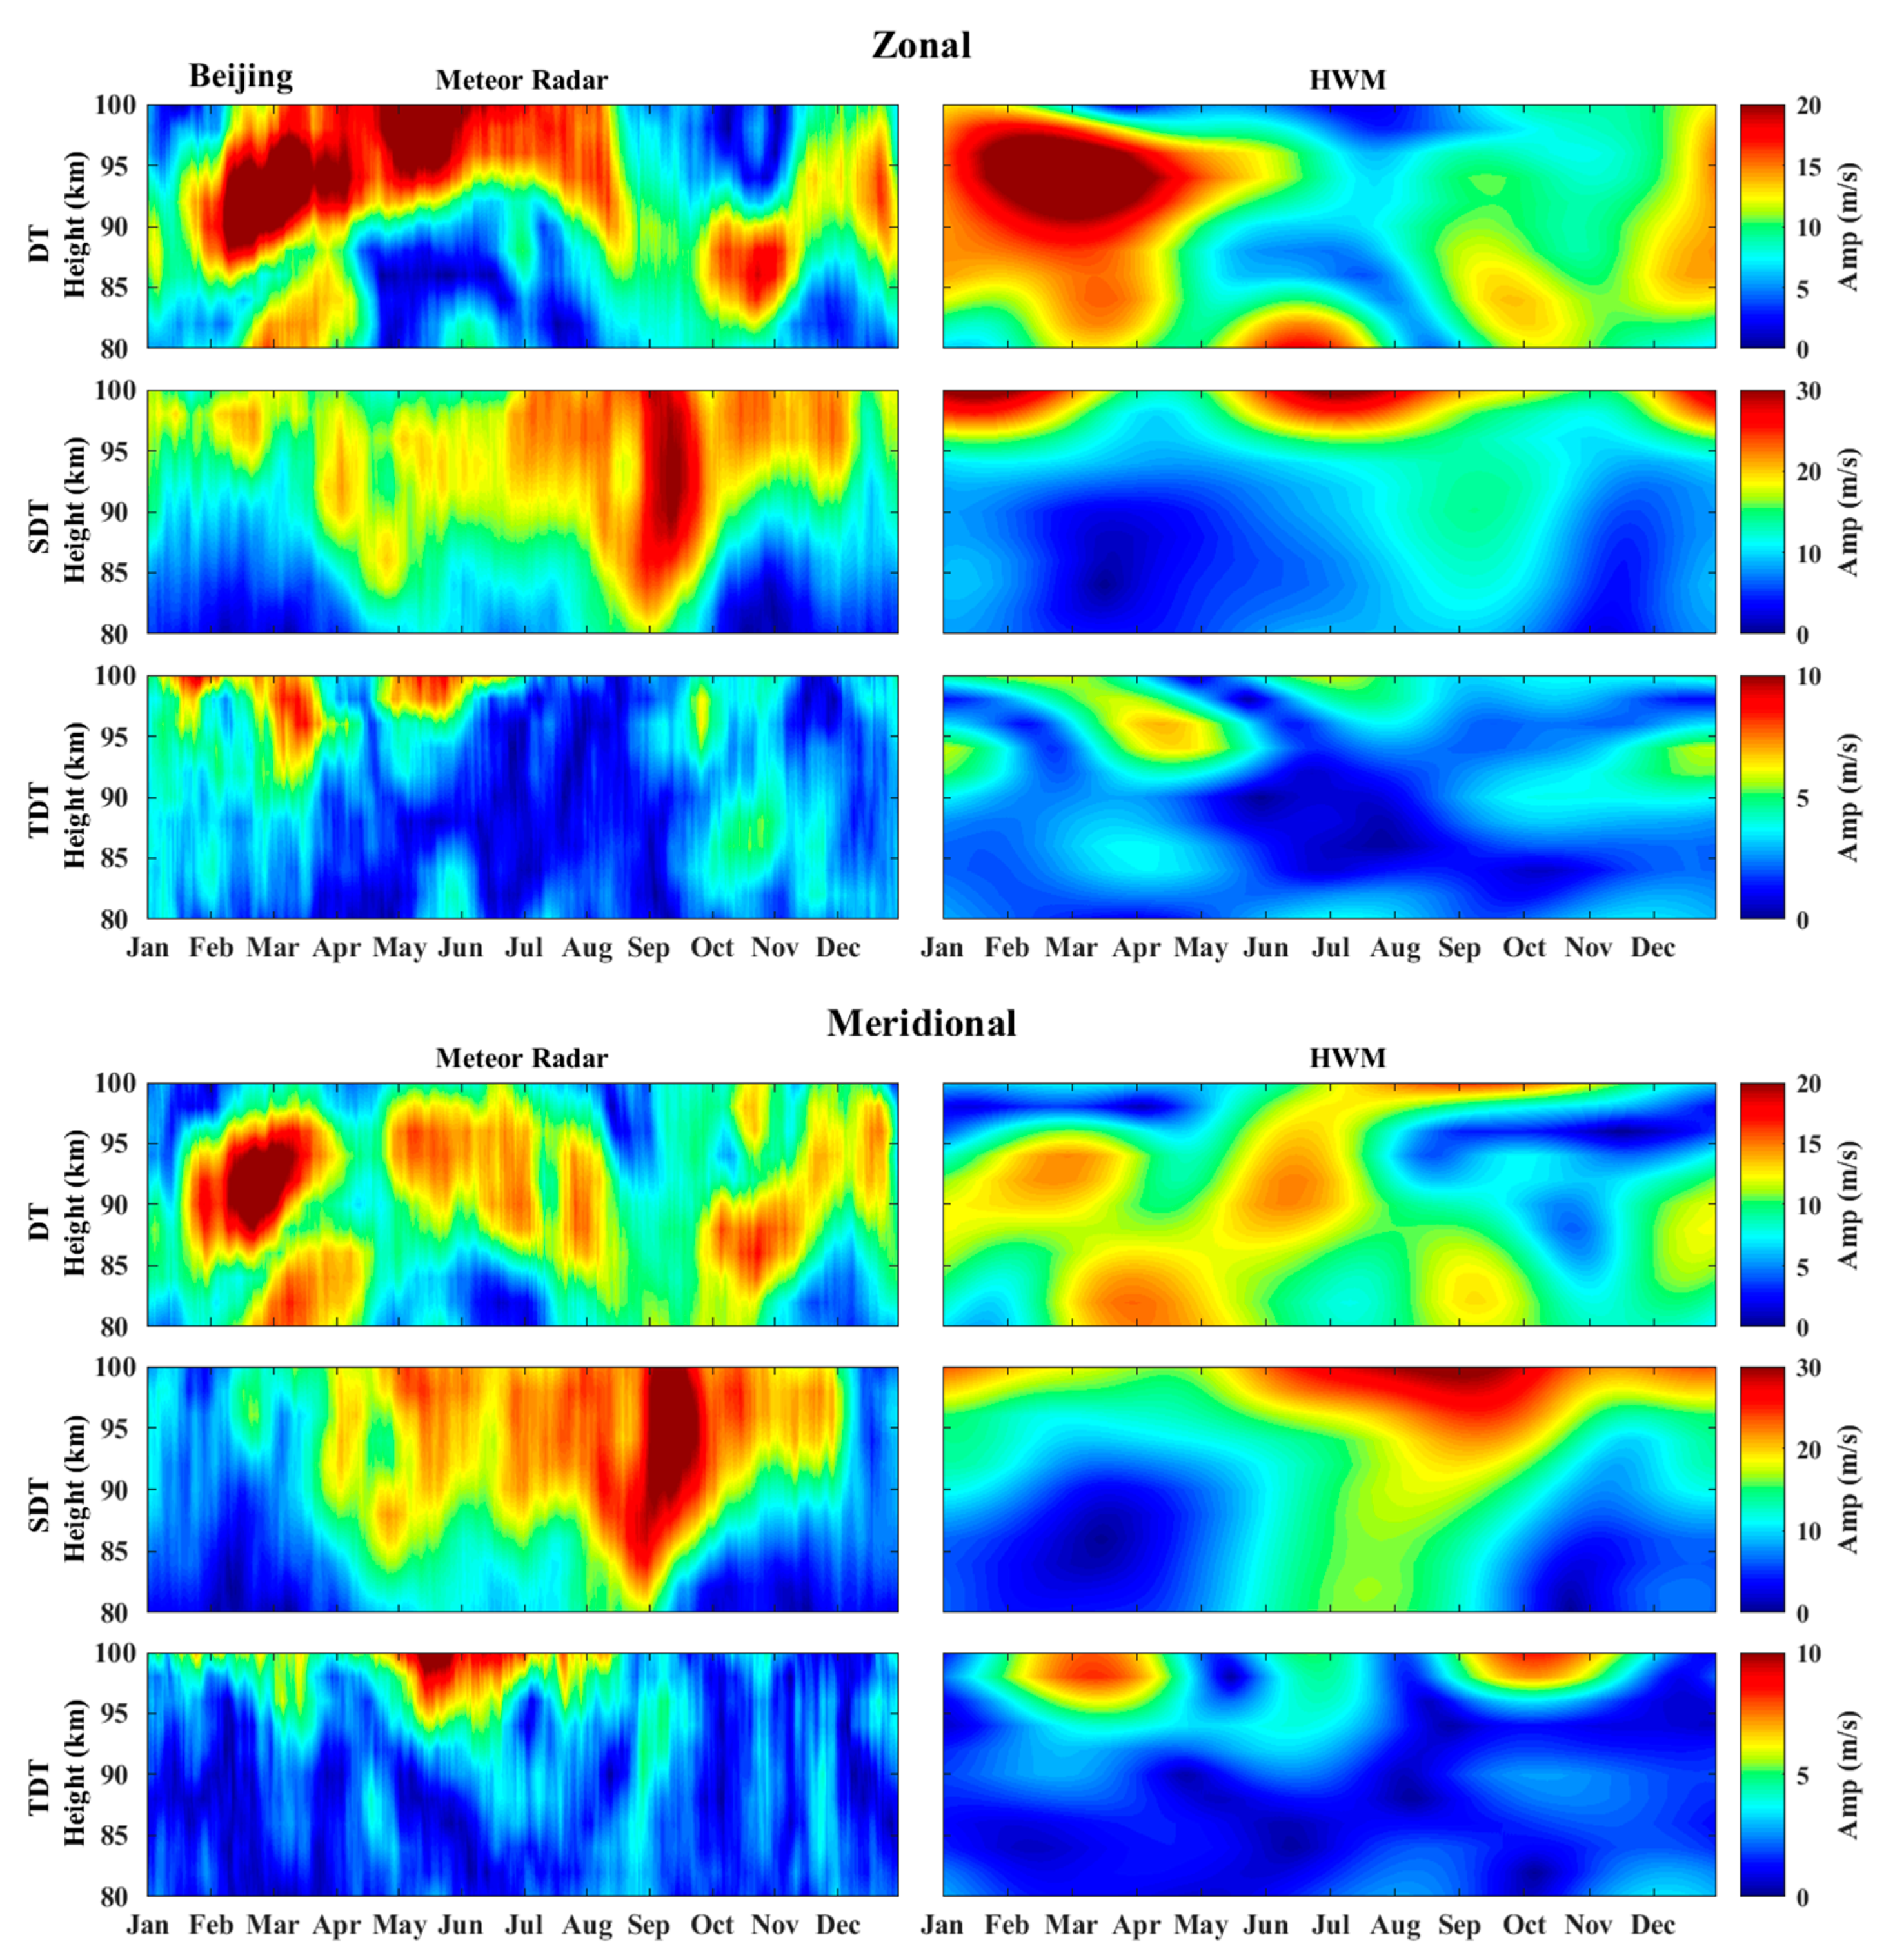
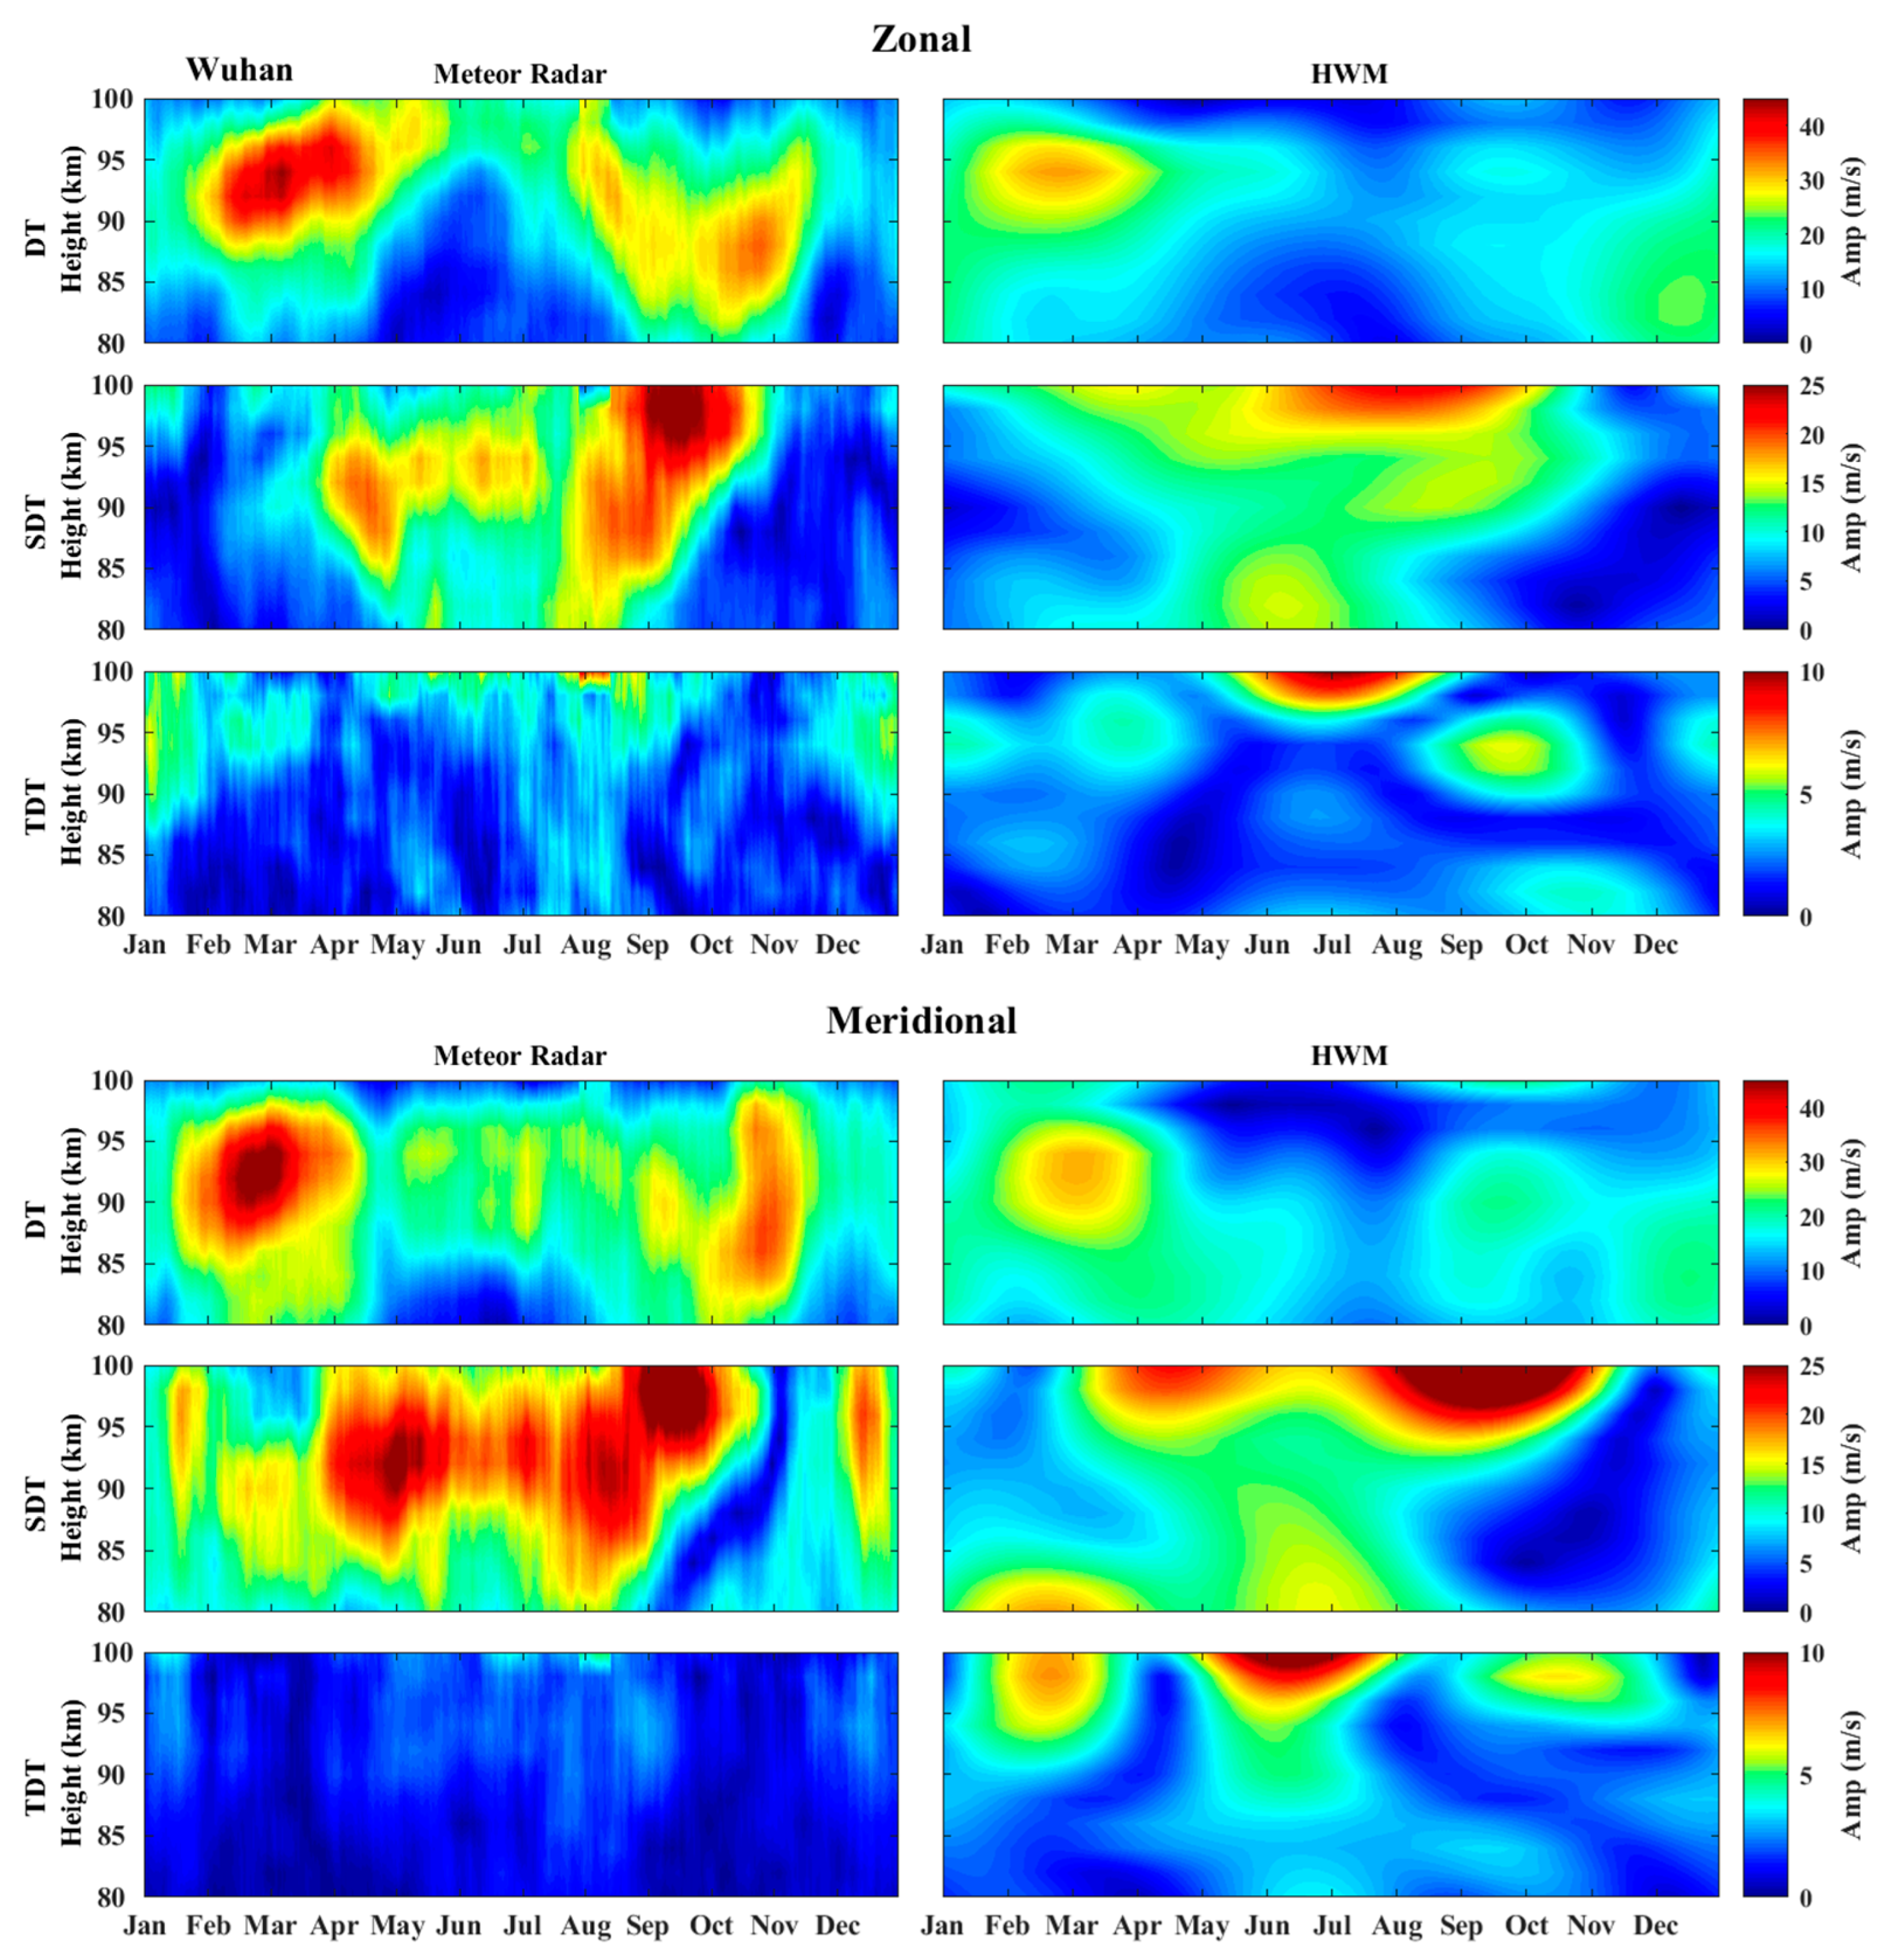
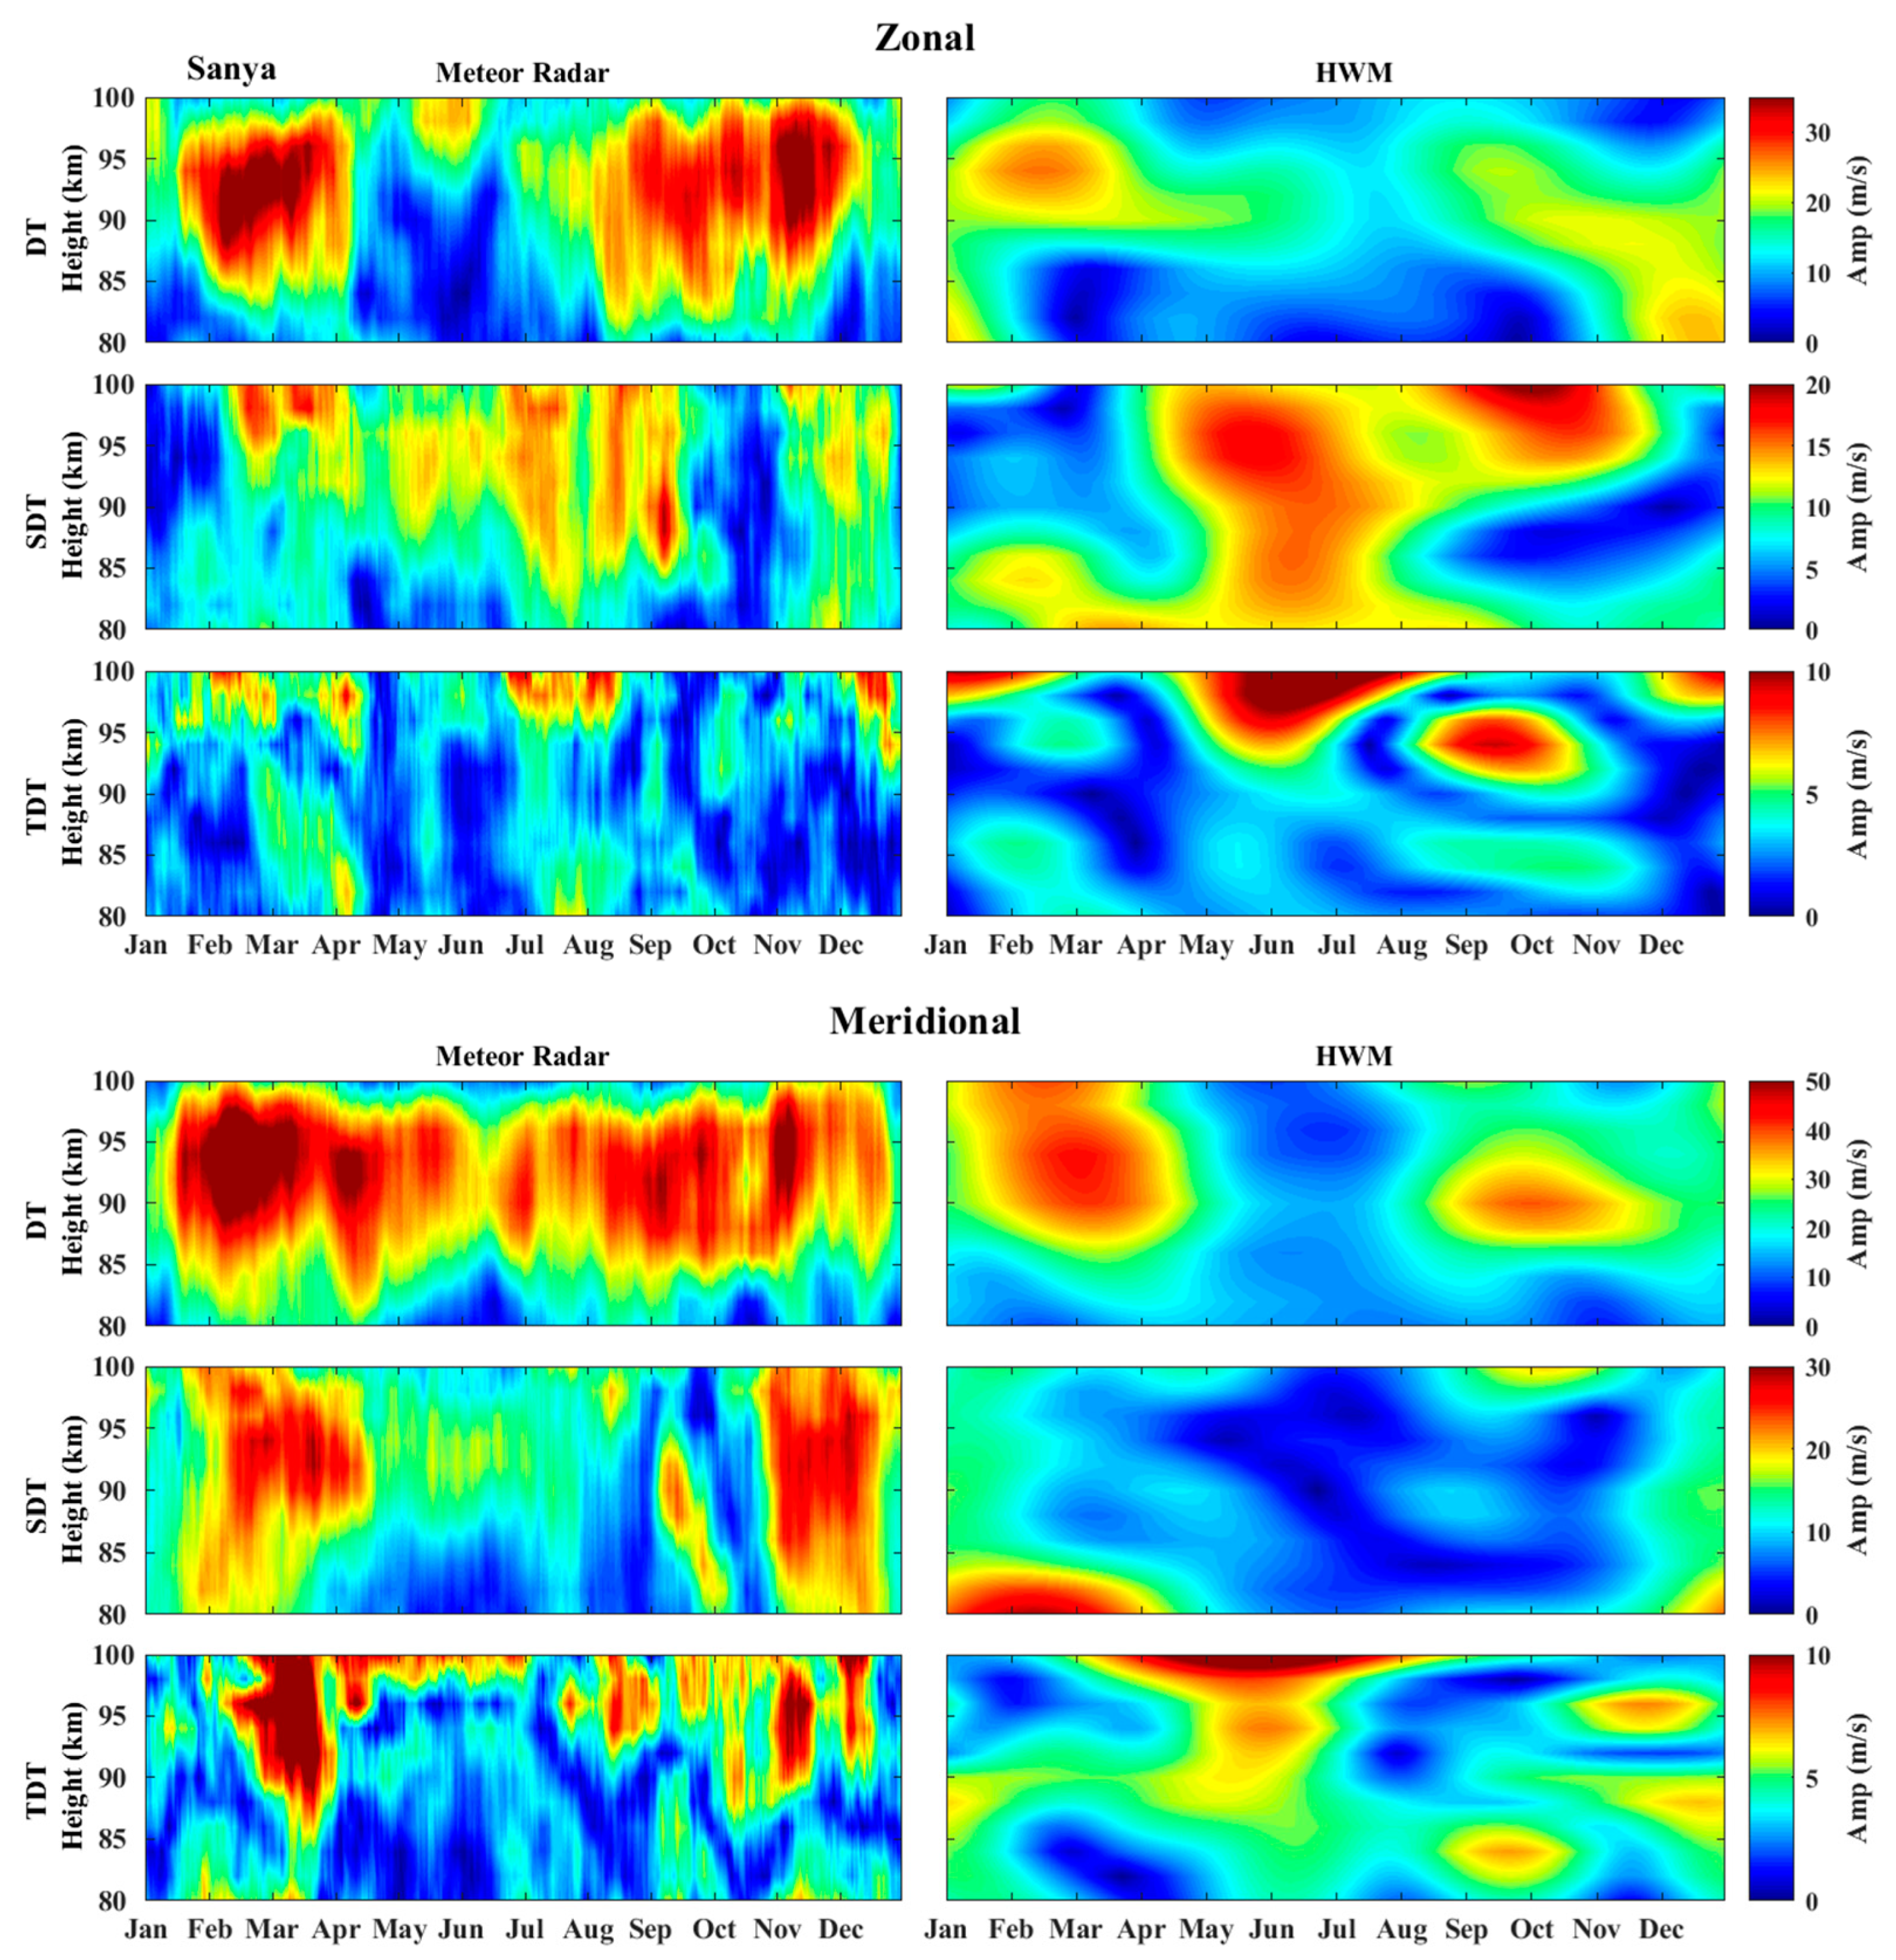
3.2. Tides
4. Discussion and Summary
Author Contributions
Funding
Institutional Review Board Statement
Informed Consent Statement
Data Availability Statement
Acknowledgments
Conflicts of Interest
References
- Hedin, A.E.; Spencer, N.; Killeen, T. Empirical global model of upper thermosphere winds based on atmosphere and dynamics explorer satellite data. J. Geophys. Res. 1988, 93, 9959–9978. [Google Scholar] [CrossRef]
- Hedin, A.E.; Biondi, M.A.; Burnside, R.G.; Hernandez, G.; Johnson, R.M.; Killeen, T.L.; Mazaudier, C.; Meriwether, J.; Salah, J.E.; Sica, R.J.; et al. Revised global model of thermosphere winds using satellite and ground-based observations. J. Geophys. Res. 1991, 96, 7657–7688. [Google Scholar] [CrossRef] [Green Version]
- Hedin, A.E.; Fleming, E.L.; Manson, A.H.; Schmidlin, F.J.; Avery, S.K.; Clark, R.R.; Franke, S.J.; Fraser, G.J.; Tsuda, T.; Vial, F.; et al. Empirical wind model for the upper middle and lower atmosphere. J. Atmos. Terr. Phys. 1996, 58, 1421–1447. [Google Scholar] [CrossRef]
- Drob, D.P.; Emmert, J.T.; Crowley, G.; Picone, J.M.; Shepherd, G.G.; Skinner, W.; Hays, P.; Niciejewski, R.J.; Larsen, M.; She, C.Y.; et al. An empirical model of the Earth’s horizontal wind fields: HWM07. J. Geophys. Res. 2008, 113, A12304. [Google Scholar] [CrossRef]
- Emmert, J.; Drob, D.; Shepherd, G.; Hernandez, G.; Jarvis, M.J.; Meriwether, J.; Niciejewski, R.; Sipler, D.; Tepley, C. DWM07 global empirical model of upper thermospheric storm-induced disturbance winds. J. Geophys. Res. 2008, 113, A11319. [Google Scholar] [CrossRef]
- Drob, D.P.; Emmert, J.T.; Meriwether, J.W.; Makela, J.J.; Doornbos, E.; Conde, M.; Hernandez, G.; Noto, J.; Zawdie, K.A.; McDonald, S.E.; et al. An update to the horizontal wind model (HWM): The quiet time thermosphere. Earth Space Sci. 2015, 2, 301–319. [Google Scholar] [CrossRef]
- Huba, J.; Ossakow, S.; Joyce, G.; Krall, J.; England, S. Three-dimensional equatorial spread F modeling: Zonal neutral wind effects. Geophys. Res. Lett. 2009, 36, L19106. [Google Scholar] [CrossRef]
- Kelly, M.; Comberiate, J.; Miller, E.; Paxton, J. Progress toward forecasting of space weather effects on UHF SATCOM after operation Anaconda. Space Weather 2014, 12, 601–611. [Google Scholar] [CrossRef]
- Pi, X.; Wang, C.; Hajj, G.A.; Rosen, G.; Wilson, B.D.; Bailey, G.J. Estimation of ExB drift using a global assimilative ionospheric model: An observation system simulation experiment. J. Geophys. Res. 2003, 108, 1075. [Google Scholar] [CrossRef]
- Schunk, R.W.; Scherliess, L.; Sojka, J.J.; Thompson, D.C.; Anderson, D.N.; Codrescu, M.; Minter, C.; Fuller-Rowell, T.J.; Heelis, R.A.; Hairston, M.; et al. Global assimilation of ionospheric measurements (GAIM). Radio Sci. 2004, 39, RS1S02. [Google Scholar] [CrossRef]
- Drob, D.P.; Picone, J.M.; Garce’s, M. Global morphology of infrasound propagation. J. Geophys. Res. 2003, 108, 4680. [Google Scholar] [CrossRef]
- Hibbins, R.E.; Freeman, M.P.; Milan, S.E.; Ruohoniemi, J.M. Winds and tides in the mid-latitude Southern Hemisphere uppermesosphere recorded with the Falkland islands SuperDARN radar. Ann. Geophys. 2011, 29, 1985–1996. [Google Scholar] [CrossRef] [Green Version]
- Day, K.A.; Taylor, M.J.; Mitchell, N.J. Mean winds, temperatures and the 16- and 5-day planetary waves in the mesosphere and lower thermosphere over bear lake Observatory (42° N, 111° W). Atmos. Chem. Phys. 2012, 12, 1571–1585. [Google Scholar] [CrossRef] [Green Version]
- Su, C.L.; Chen, H.C.; Chu, Y.H.; Chung, M.Z.; Kuong, R.M.; Lin, T.H.; Tzeng, K.J.; Wang, C.Y.; Wu, K.H.; Yang, K.F. Meteor radar wind over Chung-Li (24.9° N, 121° E), Taiwan, for the period 10-25 November 2012 which includes Leonid meteor shower: Comparison with empirical model and satellite measurements. Radio Sci. 2014, 49, 597–615. [Google Scholar] [CrossRef] [Green Version]
- Namboothiri, S.P.; Kishore, P.; Igarashi, K.; Nakamura, T.; Tsuda, T. MF radar observations of mean winds over Yamagawa (31.2° N, 130.6° E) and Wakkanai (45.4° N, 141.7° E). J. Atmos. Sol. Terr. Phys. 2000, 62, 1177–1187. [Google Scholar] [CrossRef]
- Manson, A.; Meek, C.; Hall, C.; Nozawa, S.; Mitchell, N.; Pancheva, D.; Singer, W.; Hoffmann, P. Mesopause dynamics from the Scandinavian triangle of radars within the PSMOSDAT AR Project. Ann. Geophys. 2004, 22, 367–386. [Google Scholar] [CrossRef]
- Hall, C.M.; Aso, T.; Tsutsumi, M.; Nozawa, S.A.; Manson, H.; Meek, C.E. A comparison of mesosphere and lower thermosphere neutral winds as determined by meteor and medium-frequency radar at 70° N. Radio Sci. 2005, 40, RS4001. [Google Scholar] [CrossRef]
- Engler, N.; Singer, W.; Latteck, R.; Strelnikov, B. Comparison of wind measurements in the troposphere and mesosphere by VHF/MF radars and in-situ techniques. Ann. Geophys. 2008, 26, 3693–3705. [Google Scholar] [CrossRef] [Green Version]
- Korotyshkin, D.; Merzlyakov, E.; Jacobi, C.; Lilienthal, F.; Wu, Q. Longitudinal MLT wind structure at higher mid-latitudes as seen by meteor radars at Central and Eastern Europe (13° E/49° E). Adv. Space Res. 2019, 63, 3154–3166. [Google Scholar] [CrossRef]
- Matsuno, T. A dynamical model of the stratospheric sudden warming. J. Atmos. Sci. 1971, 28, 1479–1494. [Google Scholar] [CrossRef]
- Chau, J.L.; Hoffmann, P.; Pedatella, N.M.; Matthias, V.; Stober, G. Upper mesospheric lunar tides over middle and high latitudes during sudden stratospheric warming events. J. Geophys. Res. 2015, 120, 3084–3096. [Google Scholar] [CrossRef]
- Mbatha, N.; Sivakumar, V.; Malinga, S.B.; Bencherif, H.; Pillay, S.R. Study on the impact of sudden stratosphere warming in the upper mesosphere-lower thermosphere regions using satellite and HF radar measurements. Atmos. Chem. Phys. 2010, 10, 3397–3404. [Google Scholar] [CrossRef] [Green Version]
- Stray, N.H.; Orsolini, Y.J.; Espy, P.J.; Limpasuvan, V.; Hibbins, R.E. Observations of planetary waves in the mesosphere-lower thermosphere during stratospheric warming events. Atmos. Chem. Phys. 2015, 15, 4997–5005. [Google Scholar] [CrossRef] [Green Version]
- Ma, Z.; Gong, Y.; Zhang, S.; Zhou, Q.; Huang, C.; Huang, K.; Yu, Y.; Li, G.; Ning, B.; Li, C. Responses of quasi 2 day waves in the MLT region to the 2013 SSW revealed by a meteor radar chain. Geophys. Res. Lett. 2017, 44, 9142–9150. [Google Scholar] [CrossRef]
- Hu, X.; Zhang, X.; Igarashi, K.; Zhang, D. A preliminary comparison of observations with MF radars in Wuhan and Yamagawa at 30–31° N. J. Atmos. Sol. Terr. Phys. 2006, 68, 1036–1042. [Google Scholar] [CrossRef]
- Jacobi, Ch.; Hoffmann, P.; Liu, R.Q.; Merzlyakov, E.G.; Portnyagin, Yu.I.; Manson, A.H.; Meek, C.E. Long-term trends, their changes, and interannual variability of Northern Hemisphere midlatitude MLT winds. J. Atmos. Sol. Terr. Phys. 2012, 75, 81–91. [Google Scholar] [CrossRef]
- Day, K.A.; Mitchell, N.J. Mean winds in the MLT, the SQBO and MSAO over Ascension Island (8° S, 14° W). Atmos. Chem. Phys. 2013, 13, 9515–9523. [Google Scholar] [CrossRef] [Green Version]
- Venkateswara Rao, N.; Tsuda, T.; Riggin, D.M.; Gurubaran, S.; Reid, I.M.; Vincent, R.A. Long-term variability of mean winds in the mesosphere and lower thermosphere at low latitudes. J. Geophys. Res. 2012, 117, A10312. [Google Scholar] [CrossRef] [Green Version]
- Li, N.; Chen, J.; Ding, Z.; Zhao, Z. Mean winds observed by the Kunming MF radar in 2008–2010. J. Atmos. Sol. Terr. Phys. 2015, 122, 58–65. [Google Scholar] [CrossRef]
- Sharma, A.K.; Rokade, M.V.; Rao, R.K.; Gurubaran, S.; Patil, P.T. Comparative study of MLT mean winds using MF radars located at 16.8° N and 8.7° N. J. Earth Syst. Sci. 2010, 119, 461–470. [Google Scholar] [CrossRef]
- Sridharan, S.; Tsuda, T.; Gurubaran, S. Radar observations of long-term variability of mesosphere and lower thermosphere winds over Tirunelveli (8.7° N, 77.8° E). J. Geophys. Res. 2007, 112, D23105. [Google Scholar] [CrossRef] [Green Version]
- Manson, A.H.; Luo, Y.; Meek, C. Global distributions of diurnal and semi-diurnal tides: Observations from HRDI-UARS of the MLT region. Ann. Geophys. 2002, 20, 1877–1890. [Google Scholar] [CrossRef] [Green Version]
- Forbes, J.M.; Zhang, X.; Talaat, E.R.; Ward, W. Nonmigrating diurnal tides in the thermosphere. J. Geophys. Res. 2003, 108, 1033. [Google Scholar] [CrossRef]
- Forbes, J.M.; Garrett, H.B. Theoretical studies of atmospheric tides. Rev. Geophys. 1979, 17, 1951–1981. [Google Scholar] [CrossRef]
- Kato, S. Dynamics of the Upper Atmosphere; Kluwer Academy: Norwell, MA, USA, 1980. [Google Scholar]
- Forbes, J.M. Middle atmosphere tides. J. Atmos. Terr. Phys. 1984, 46, 1049–1067. [Google Scholar] [CrossRef]
- Volland, H. Atmospheric Tidal and Planetary Waves; Kluwer Academy: Norwell, MA, USA, 1988. [Google Scholar]
- Vial, F. Tides in the middle atmosphere. J. Atmos. Terr. Phys. 1989, 51, 3–17. [Google Scholar] [CrossRef]
- Vial, F.; Forbes, J.M. Recent progress in tidal modeling. J. Atmos. Terr. Phys. 1989, 51, 663–671. [Google Scholar] [CrossRef]
- Forbes, J.M.; Makarov, N.A.; Portnyagin, Y.I. First results from a meteor radar at South Pole: A large 12-hour oscillation with zonal wavenumber one. Geophys. Res. Lett. 1995, 22, 3247–3250. [Google Scholar] [CrossRef]
- Hagan, M.E. Atmospheric tidal propagation across the stratopause. In Atmospheric Science Across the Stratopause; Siskind, D.E., Eckermann, S.D., Summers, M.E., Eds.; AGU: Washington, DC, USA, 2000; Volume 123. [Google Scholar]
- Gardner, C.S.; Zhao, Y.; Liu, A.Z. Atmospheric stability and gravity wave dissipation in the mesopause region. J. Atmos. Sol. Terr. Phys. 2002, 64, 923–929. [Google Scholar] [CrossRef] [Green Version]


Publisher’s Note: MDPI stays neutral with regard to jurisdictional claims in published maps and institutional affiliations. |
© 2021 by the authors. Licensee MDPI, Basel, Switzerland. This article is an open access article distributed under the terms and conditions of the Creative Commons Attribution (CC BY) license (http://creativecommons.org/licenses/by/4.0/).
Share and Cite
Tang, Q.; Zhou, Y.; Du, Z.; Zhou, C.; Qiao, J.; Liu, Y.; Chen, G. A Comparison of Meteor Radar Observation over China Region with Horizontal Wind Model (HWM14). Atmosphere 2021, 12, 98. https://0-doi-org.brum.beds.ac.uk/10.3390/atmos12010098
Tang Q, Zhou Y, Du Z, Zhou C, Qiao J, Liu Y, Chen G. A Comparison of Meteor Radar Observation over China Region with Horizontal Wind Model (HWM14). Atmosphere. 2021; 12(1):98. https://0-doi-org.brum.beds.ac.uk/10.3390/atmos12010098
Chicago/Turabian StyleTang, Qiong, Yufeng Zhou, Zhitao Du, Chen Zhou, Jiandong Qiao, Yi Liu, and Guanyi Chen. 2021. "A Comparison of Meteor Radar Observation over China Region with Horizontal Wind Model (HWM14)" Atmosphere 12, no. 1: 98. https://0-doi-org.brum.beds.ac.uk/10.3390/atmos12010098