
Impacts of Aerosol Loading in the Hindu Kush Himalayan Region Based on MERRA-2 Reanalysis Data


 , ,
, ,
Abstract
:1. Introduction
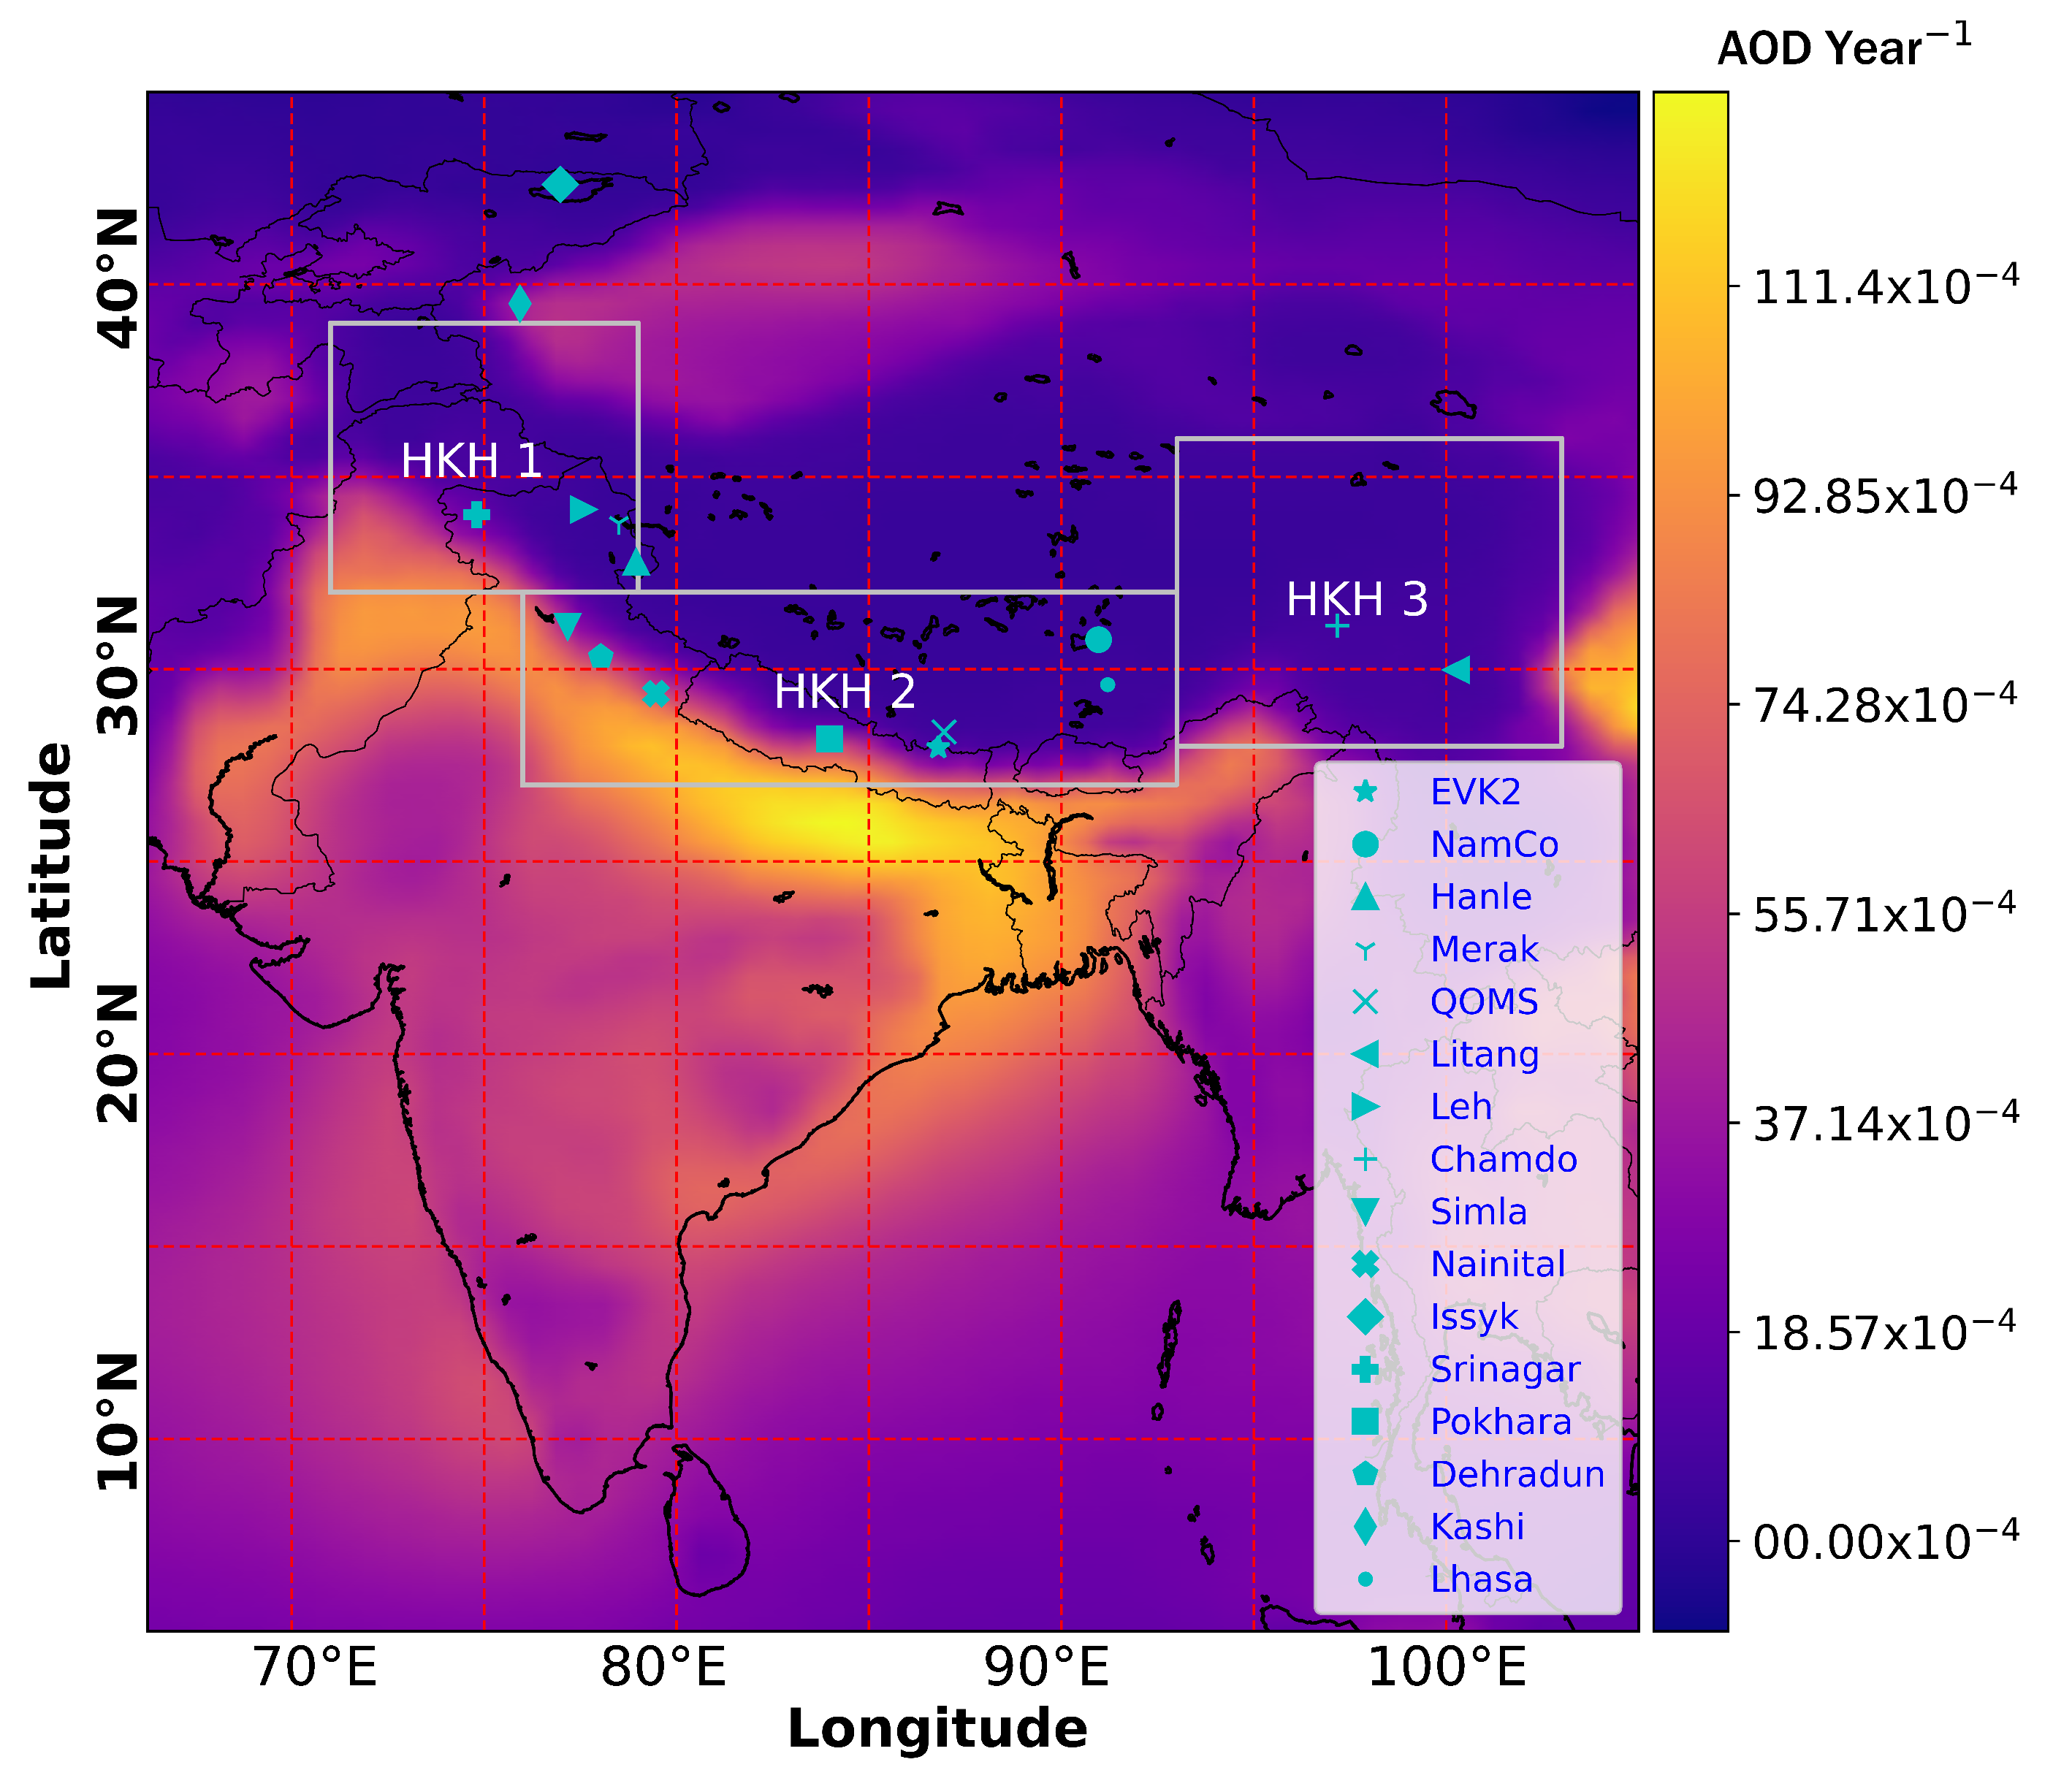
2. Observational Sites
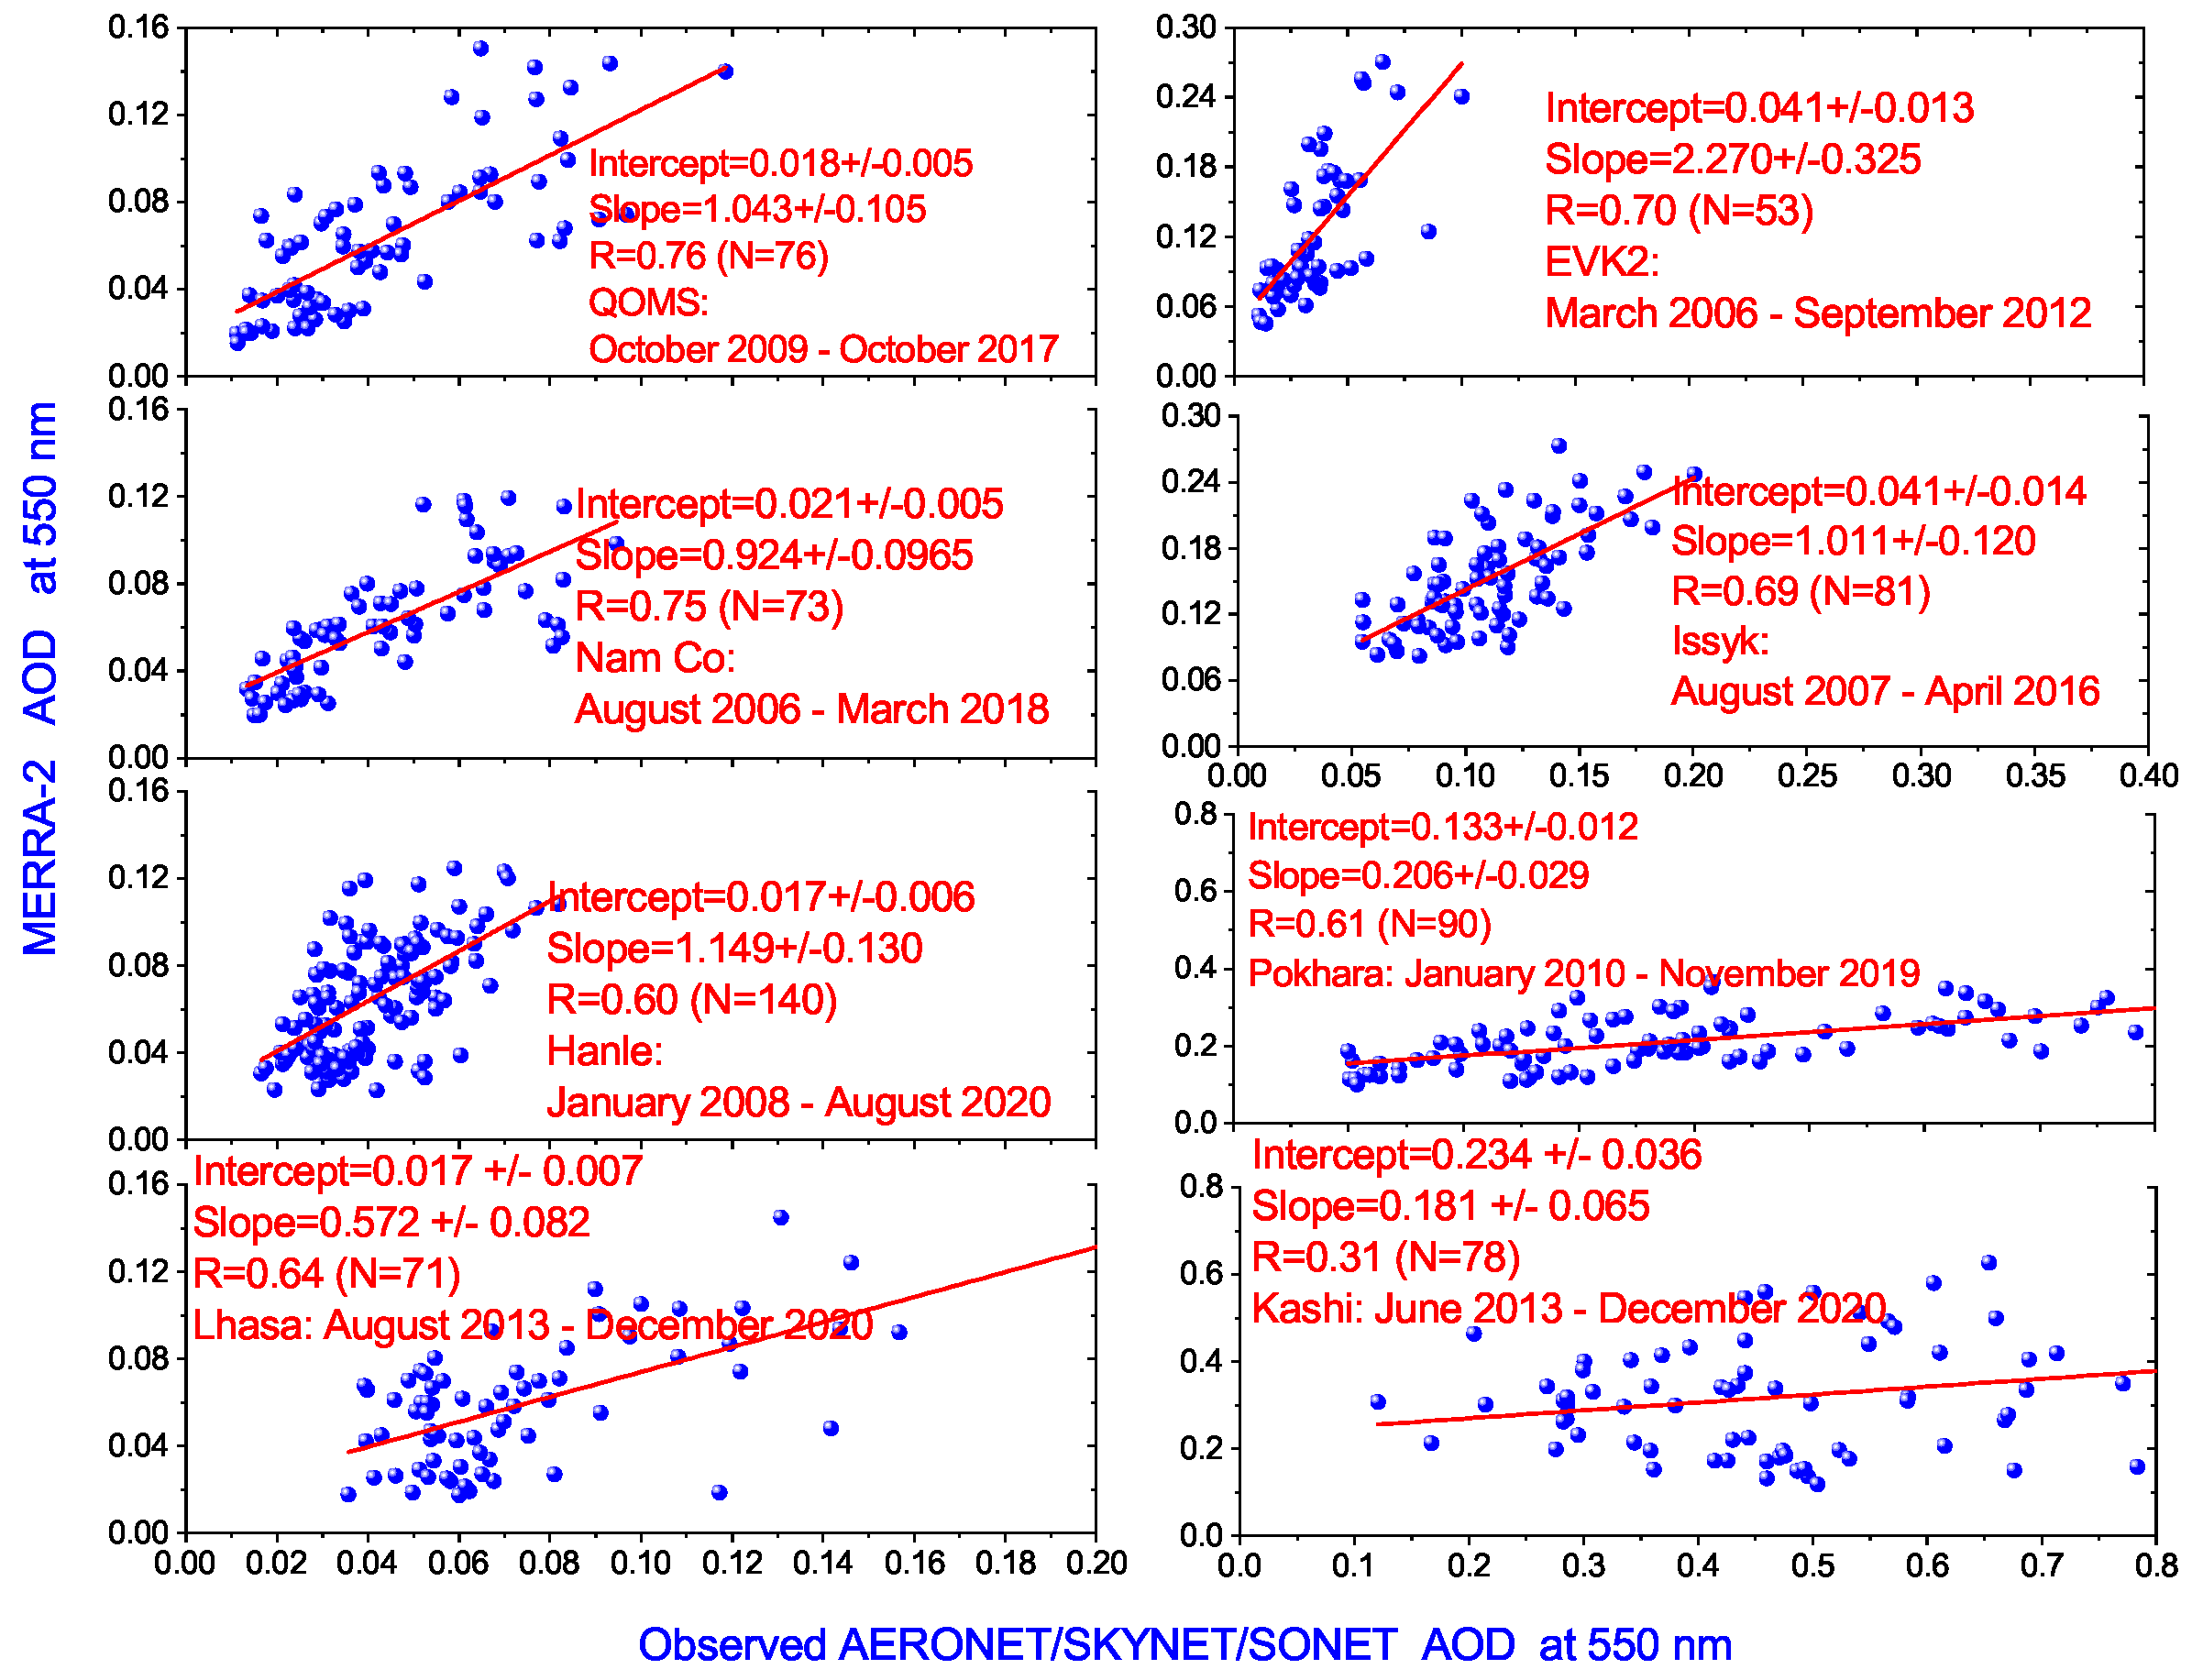
3. Data Analysis
4. Results and Discussion
4.1. AOD Trend in the Indian Sub-Continent
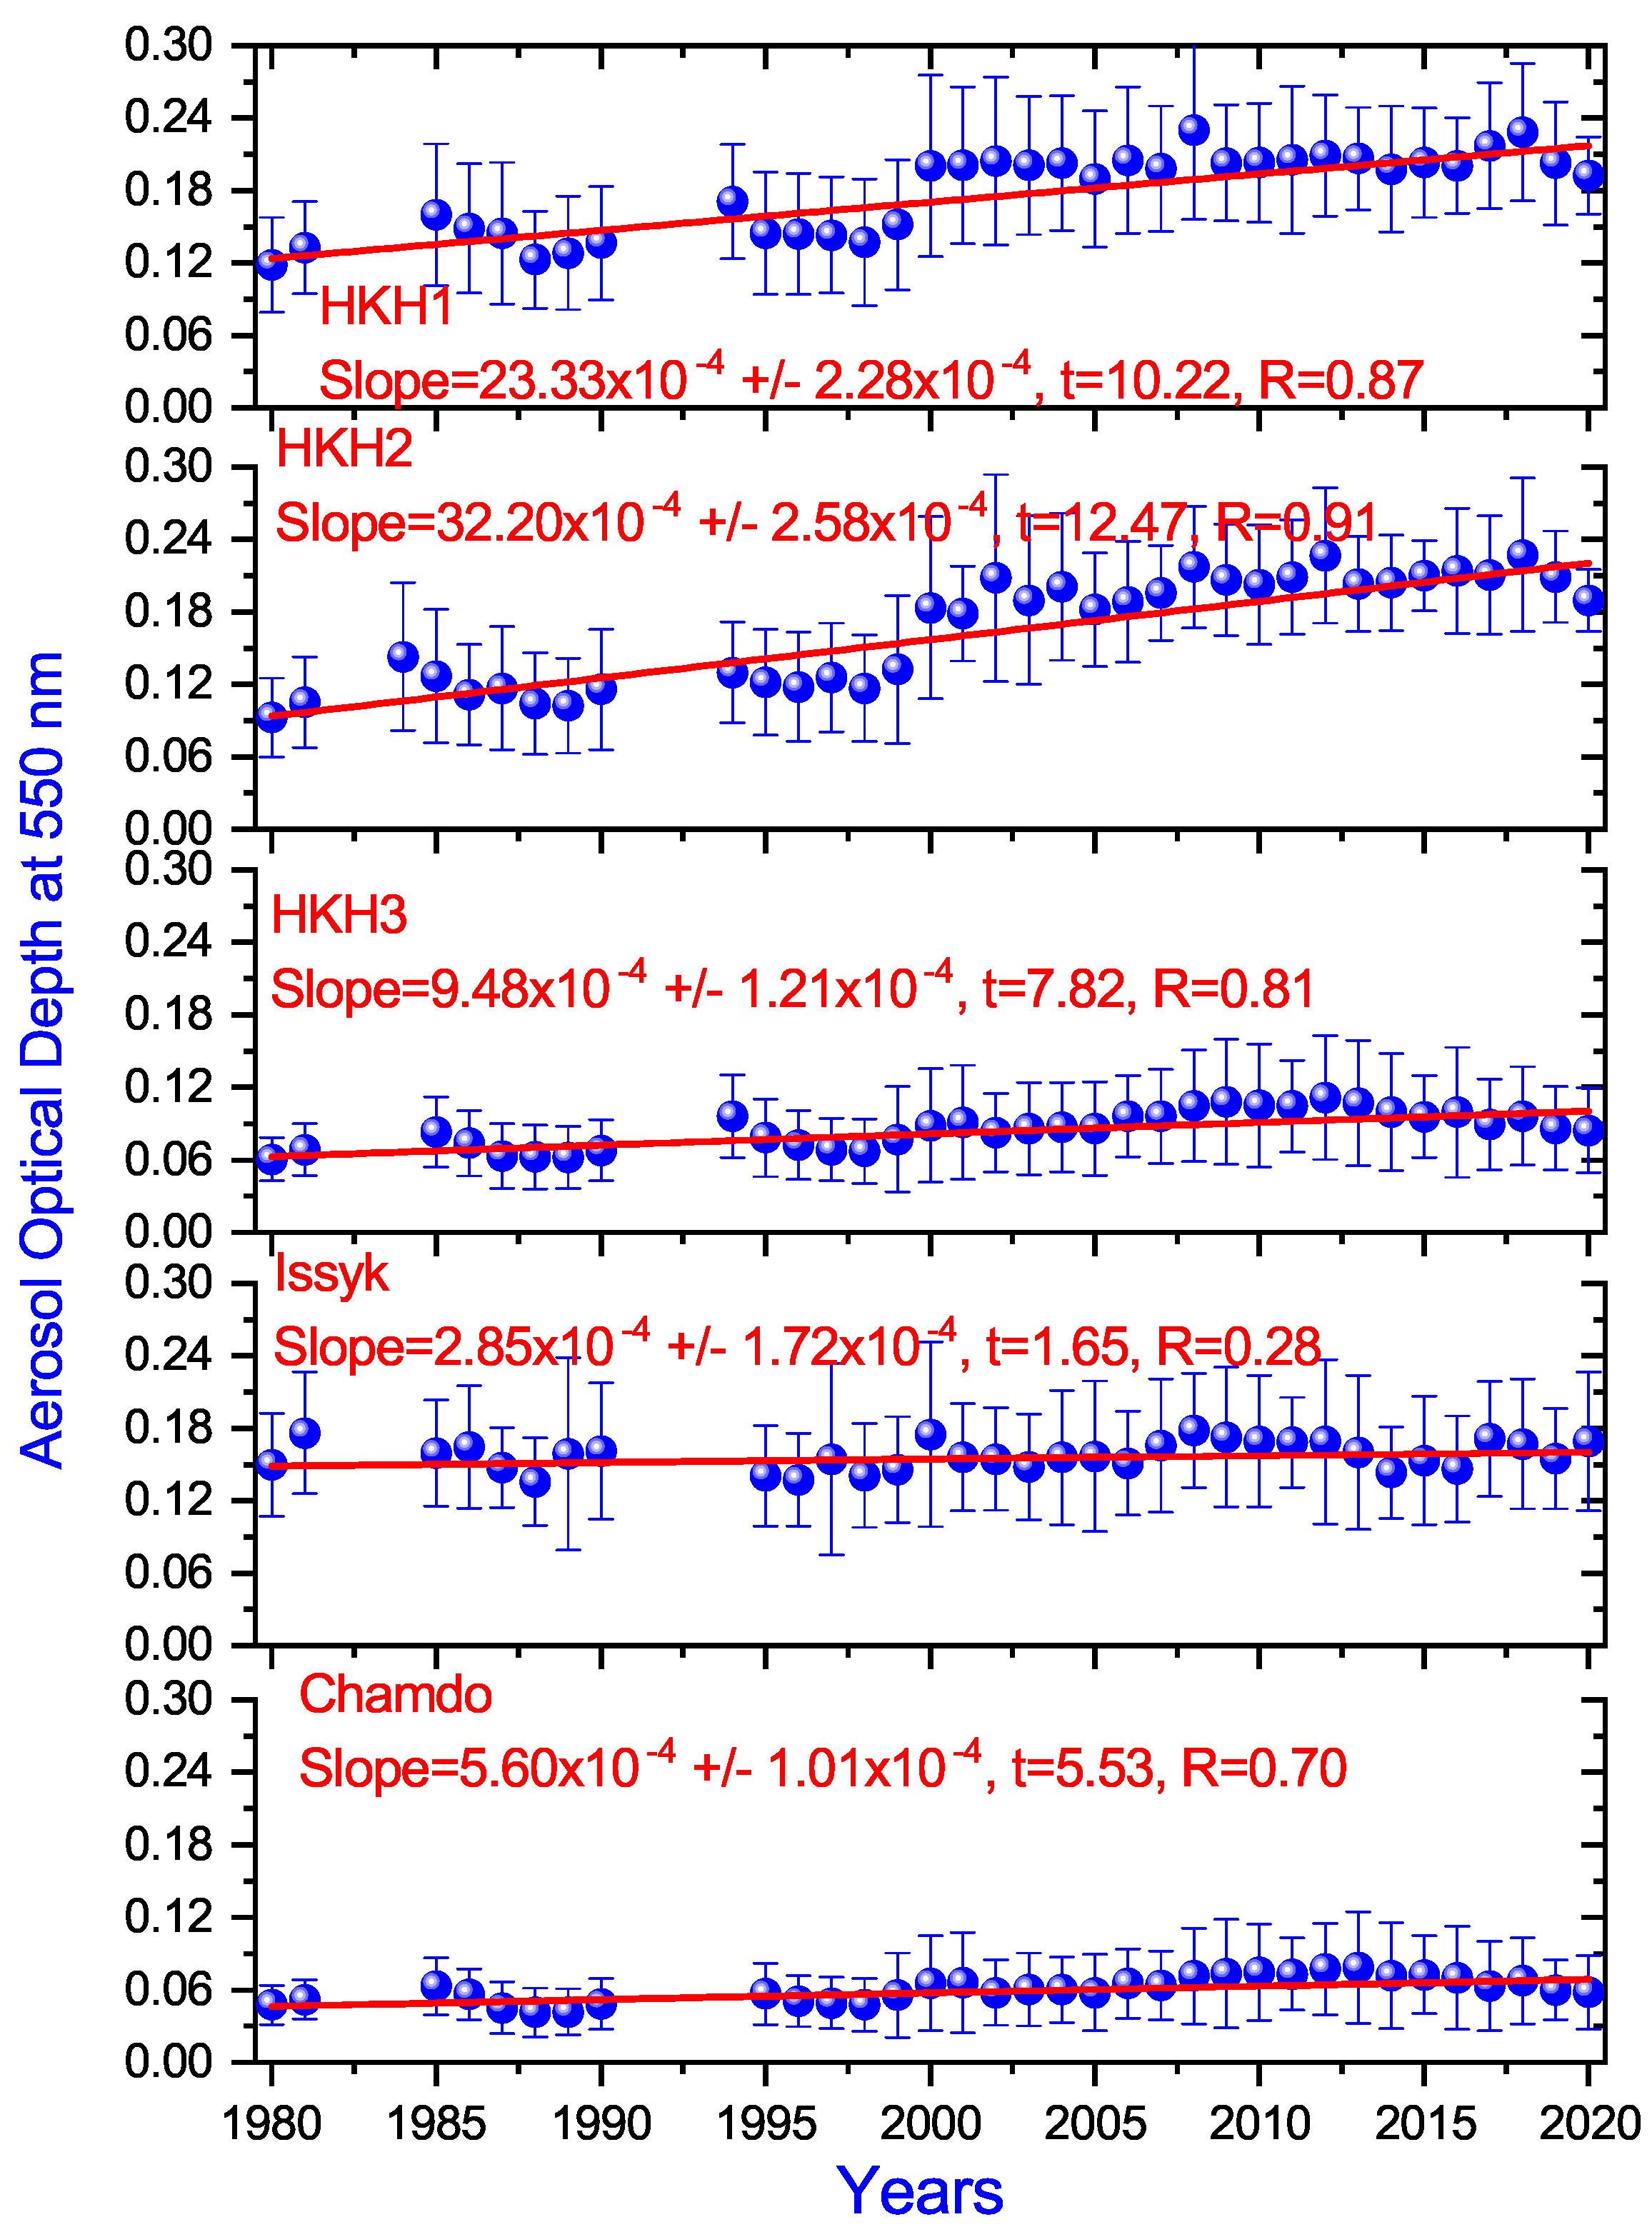
4.2. AOD Trend in the HKH Region
4.2.1. HKH1
4.2.2. HKH2
4.2.3. HKH3
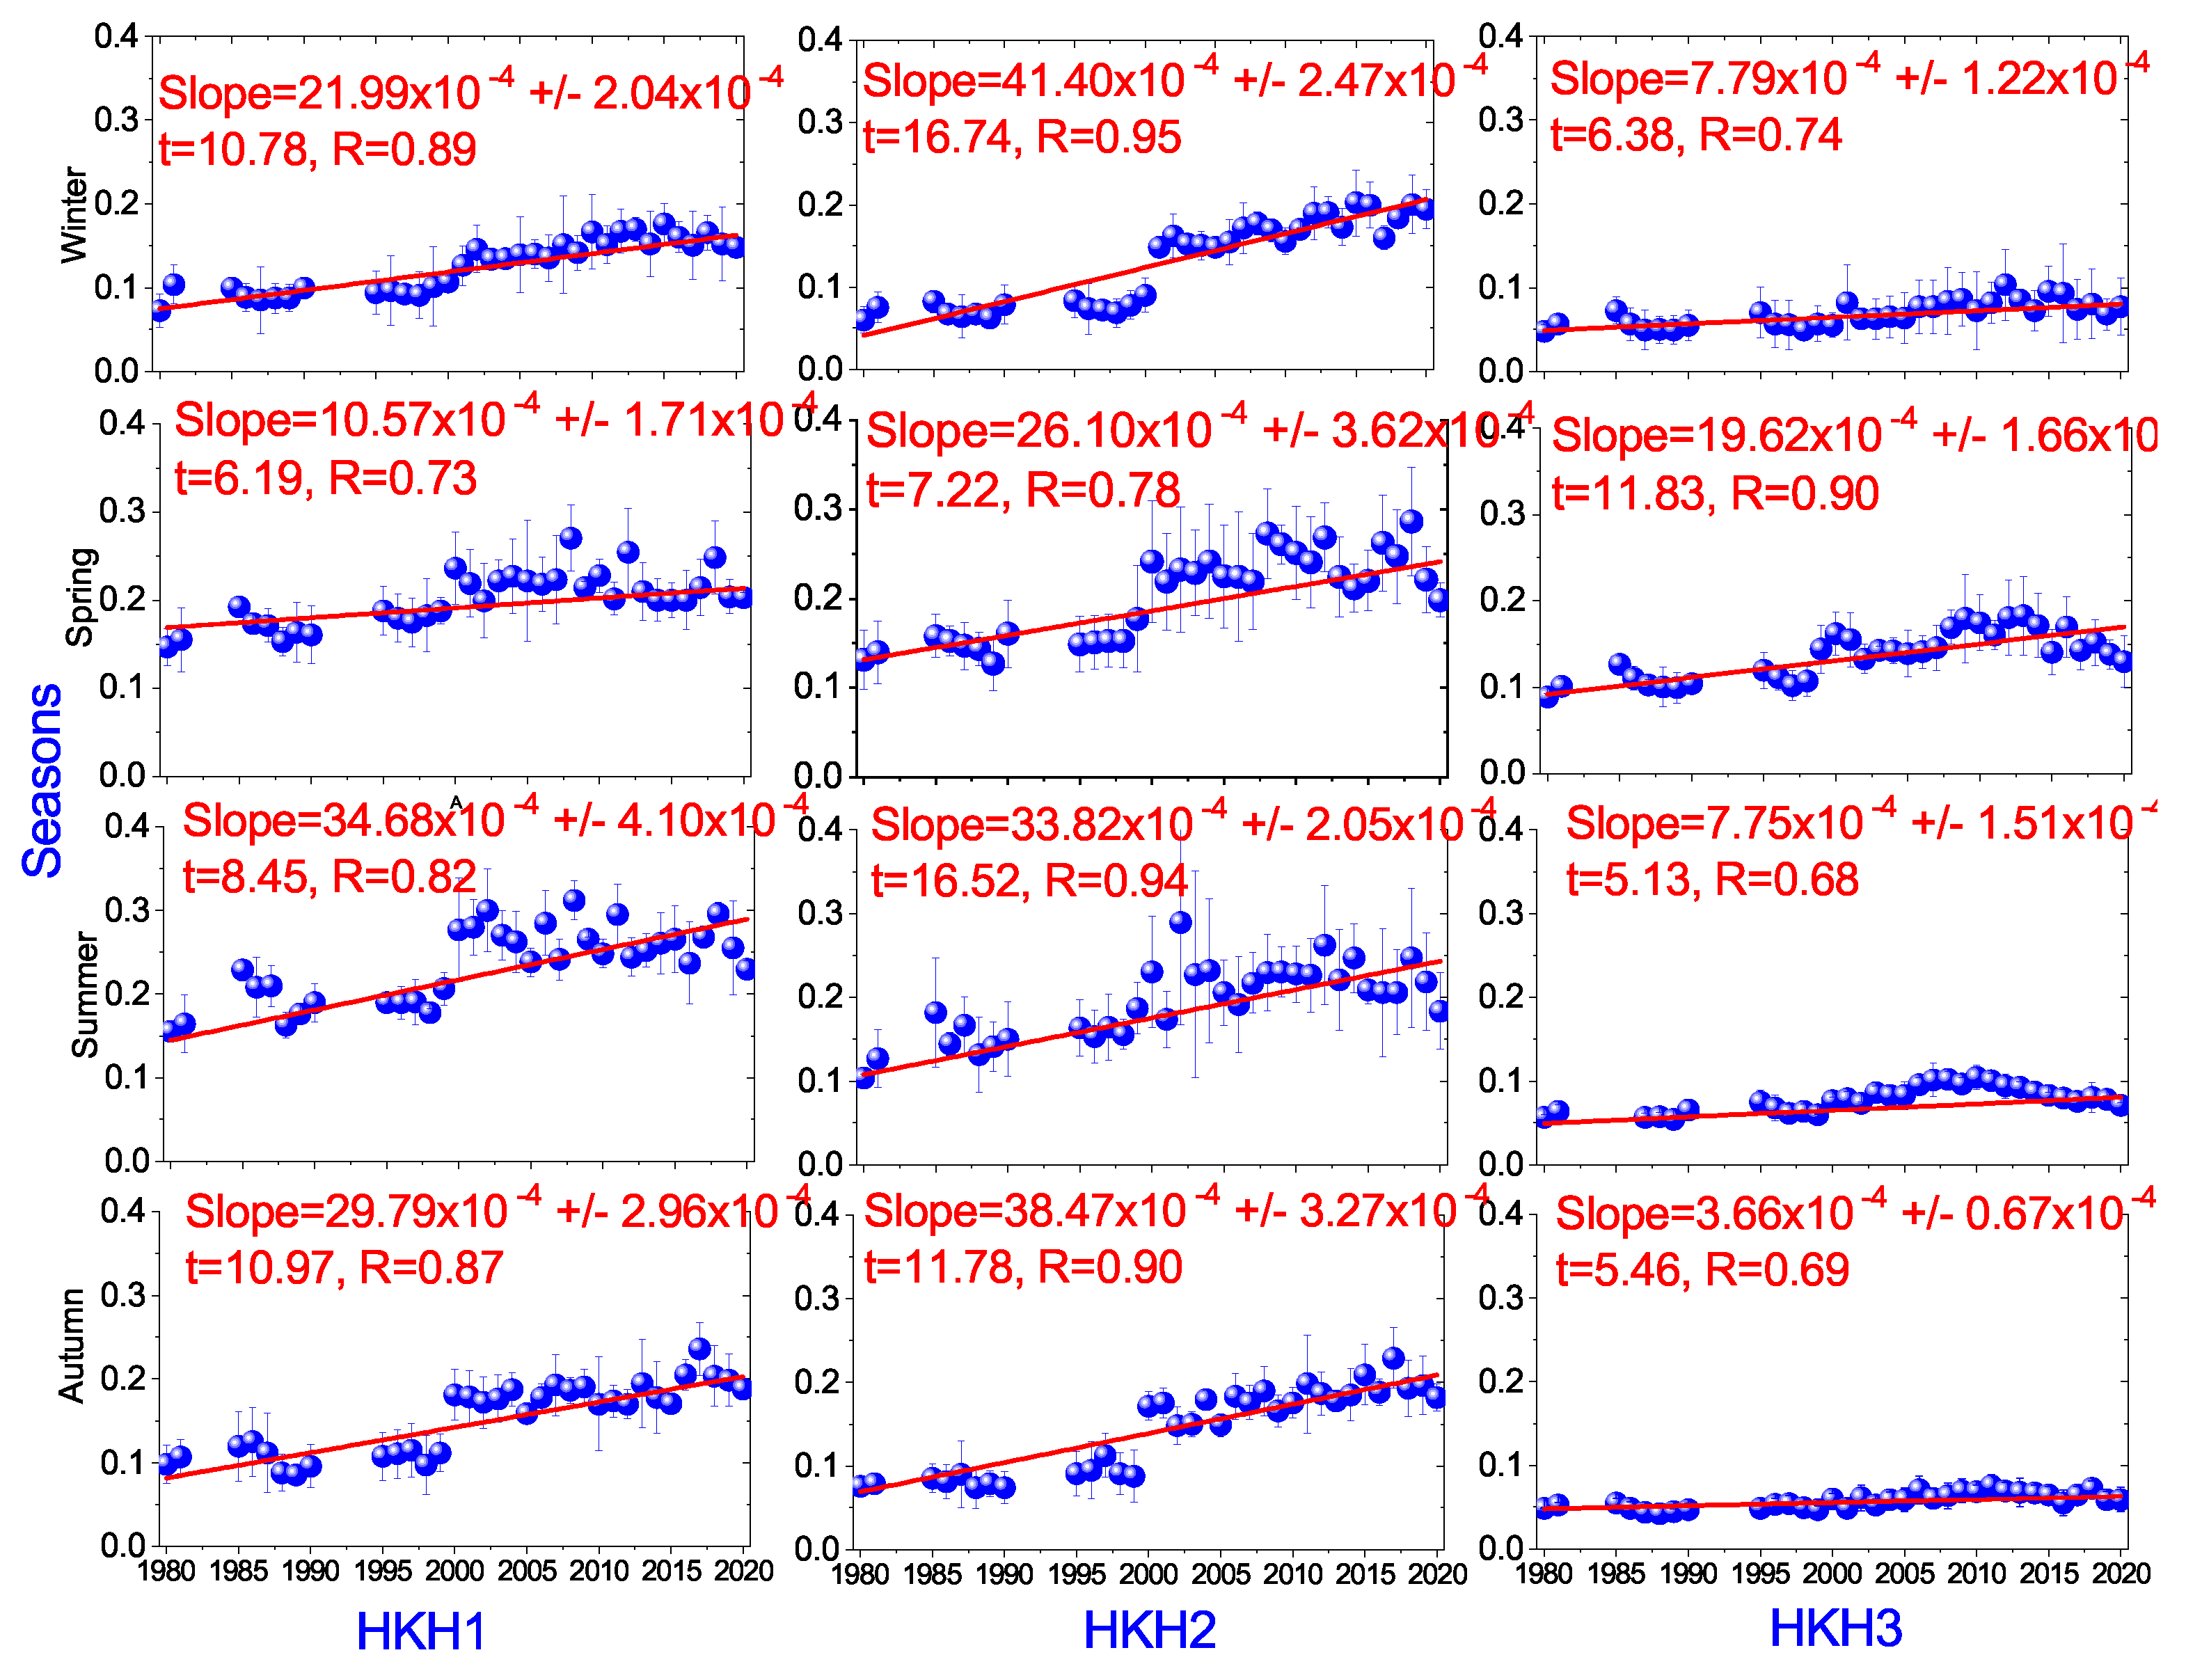
4.2.4. Seasonal Long-Term AOD Trend
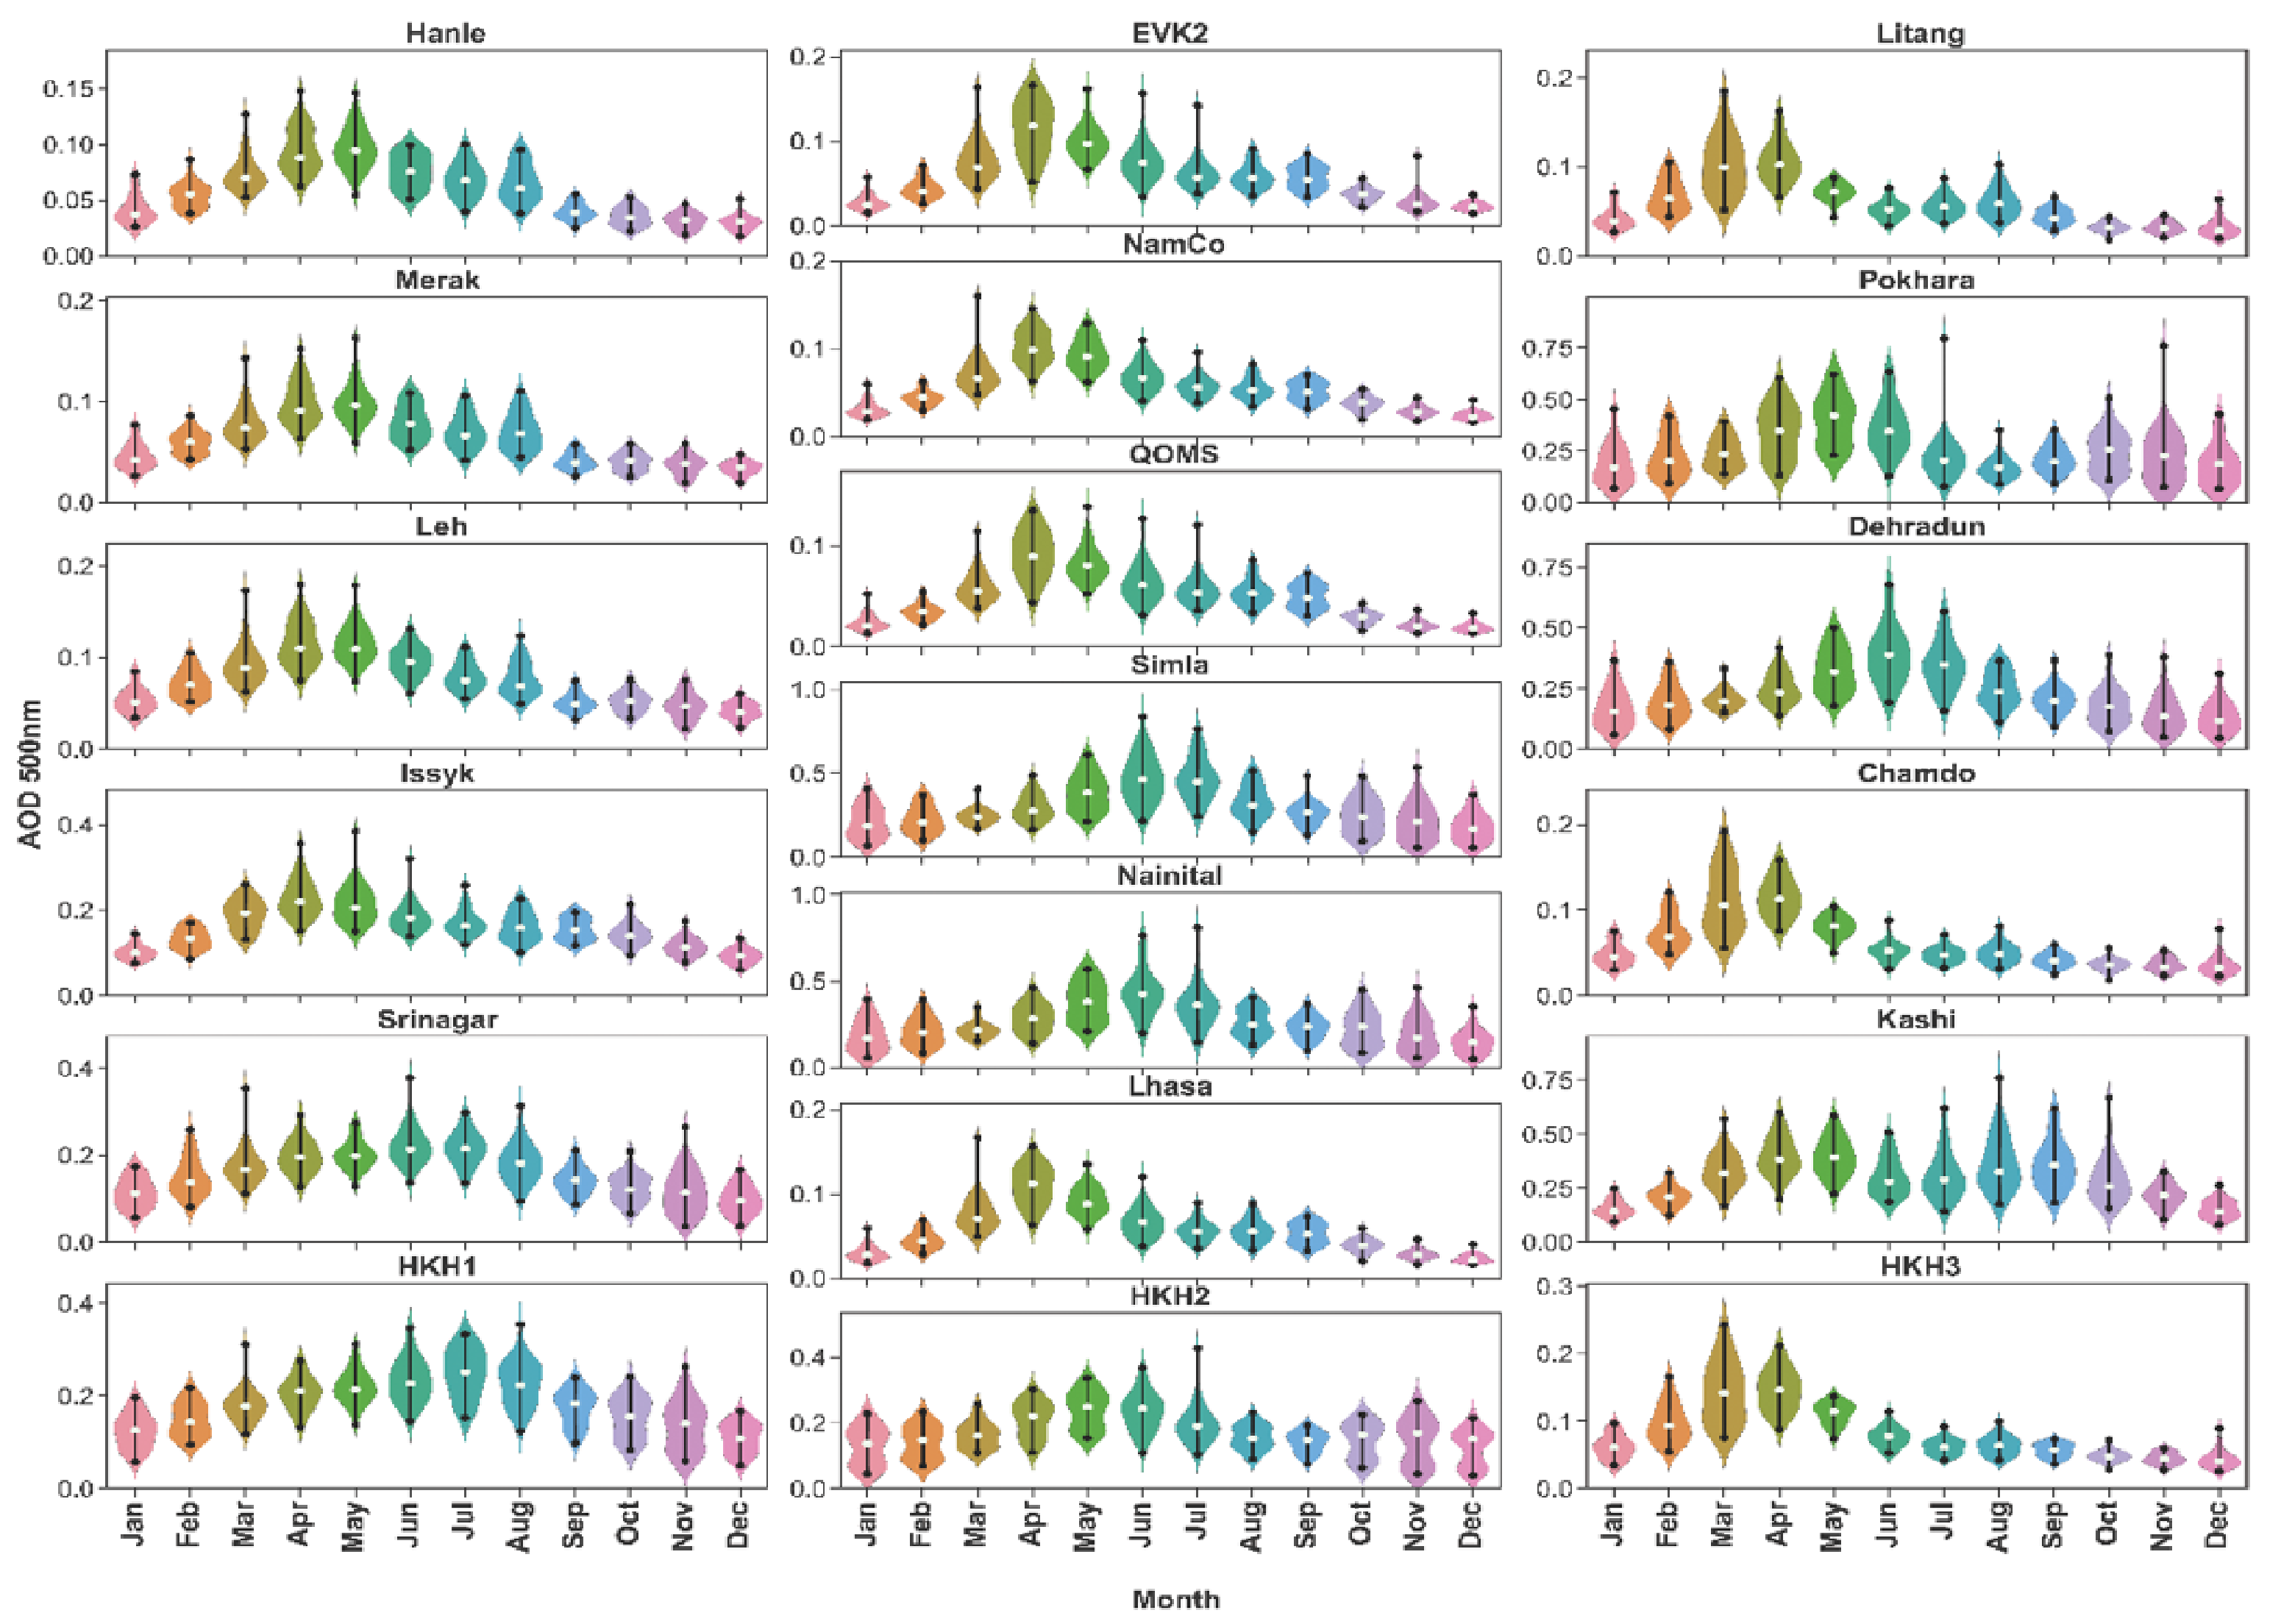
4.3. Climatological AOD
5. Conclusions
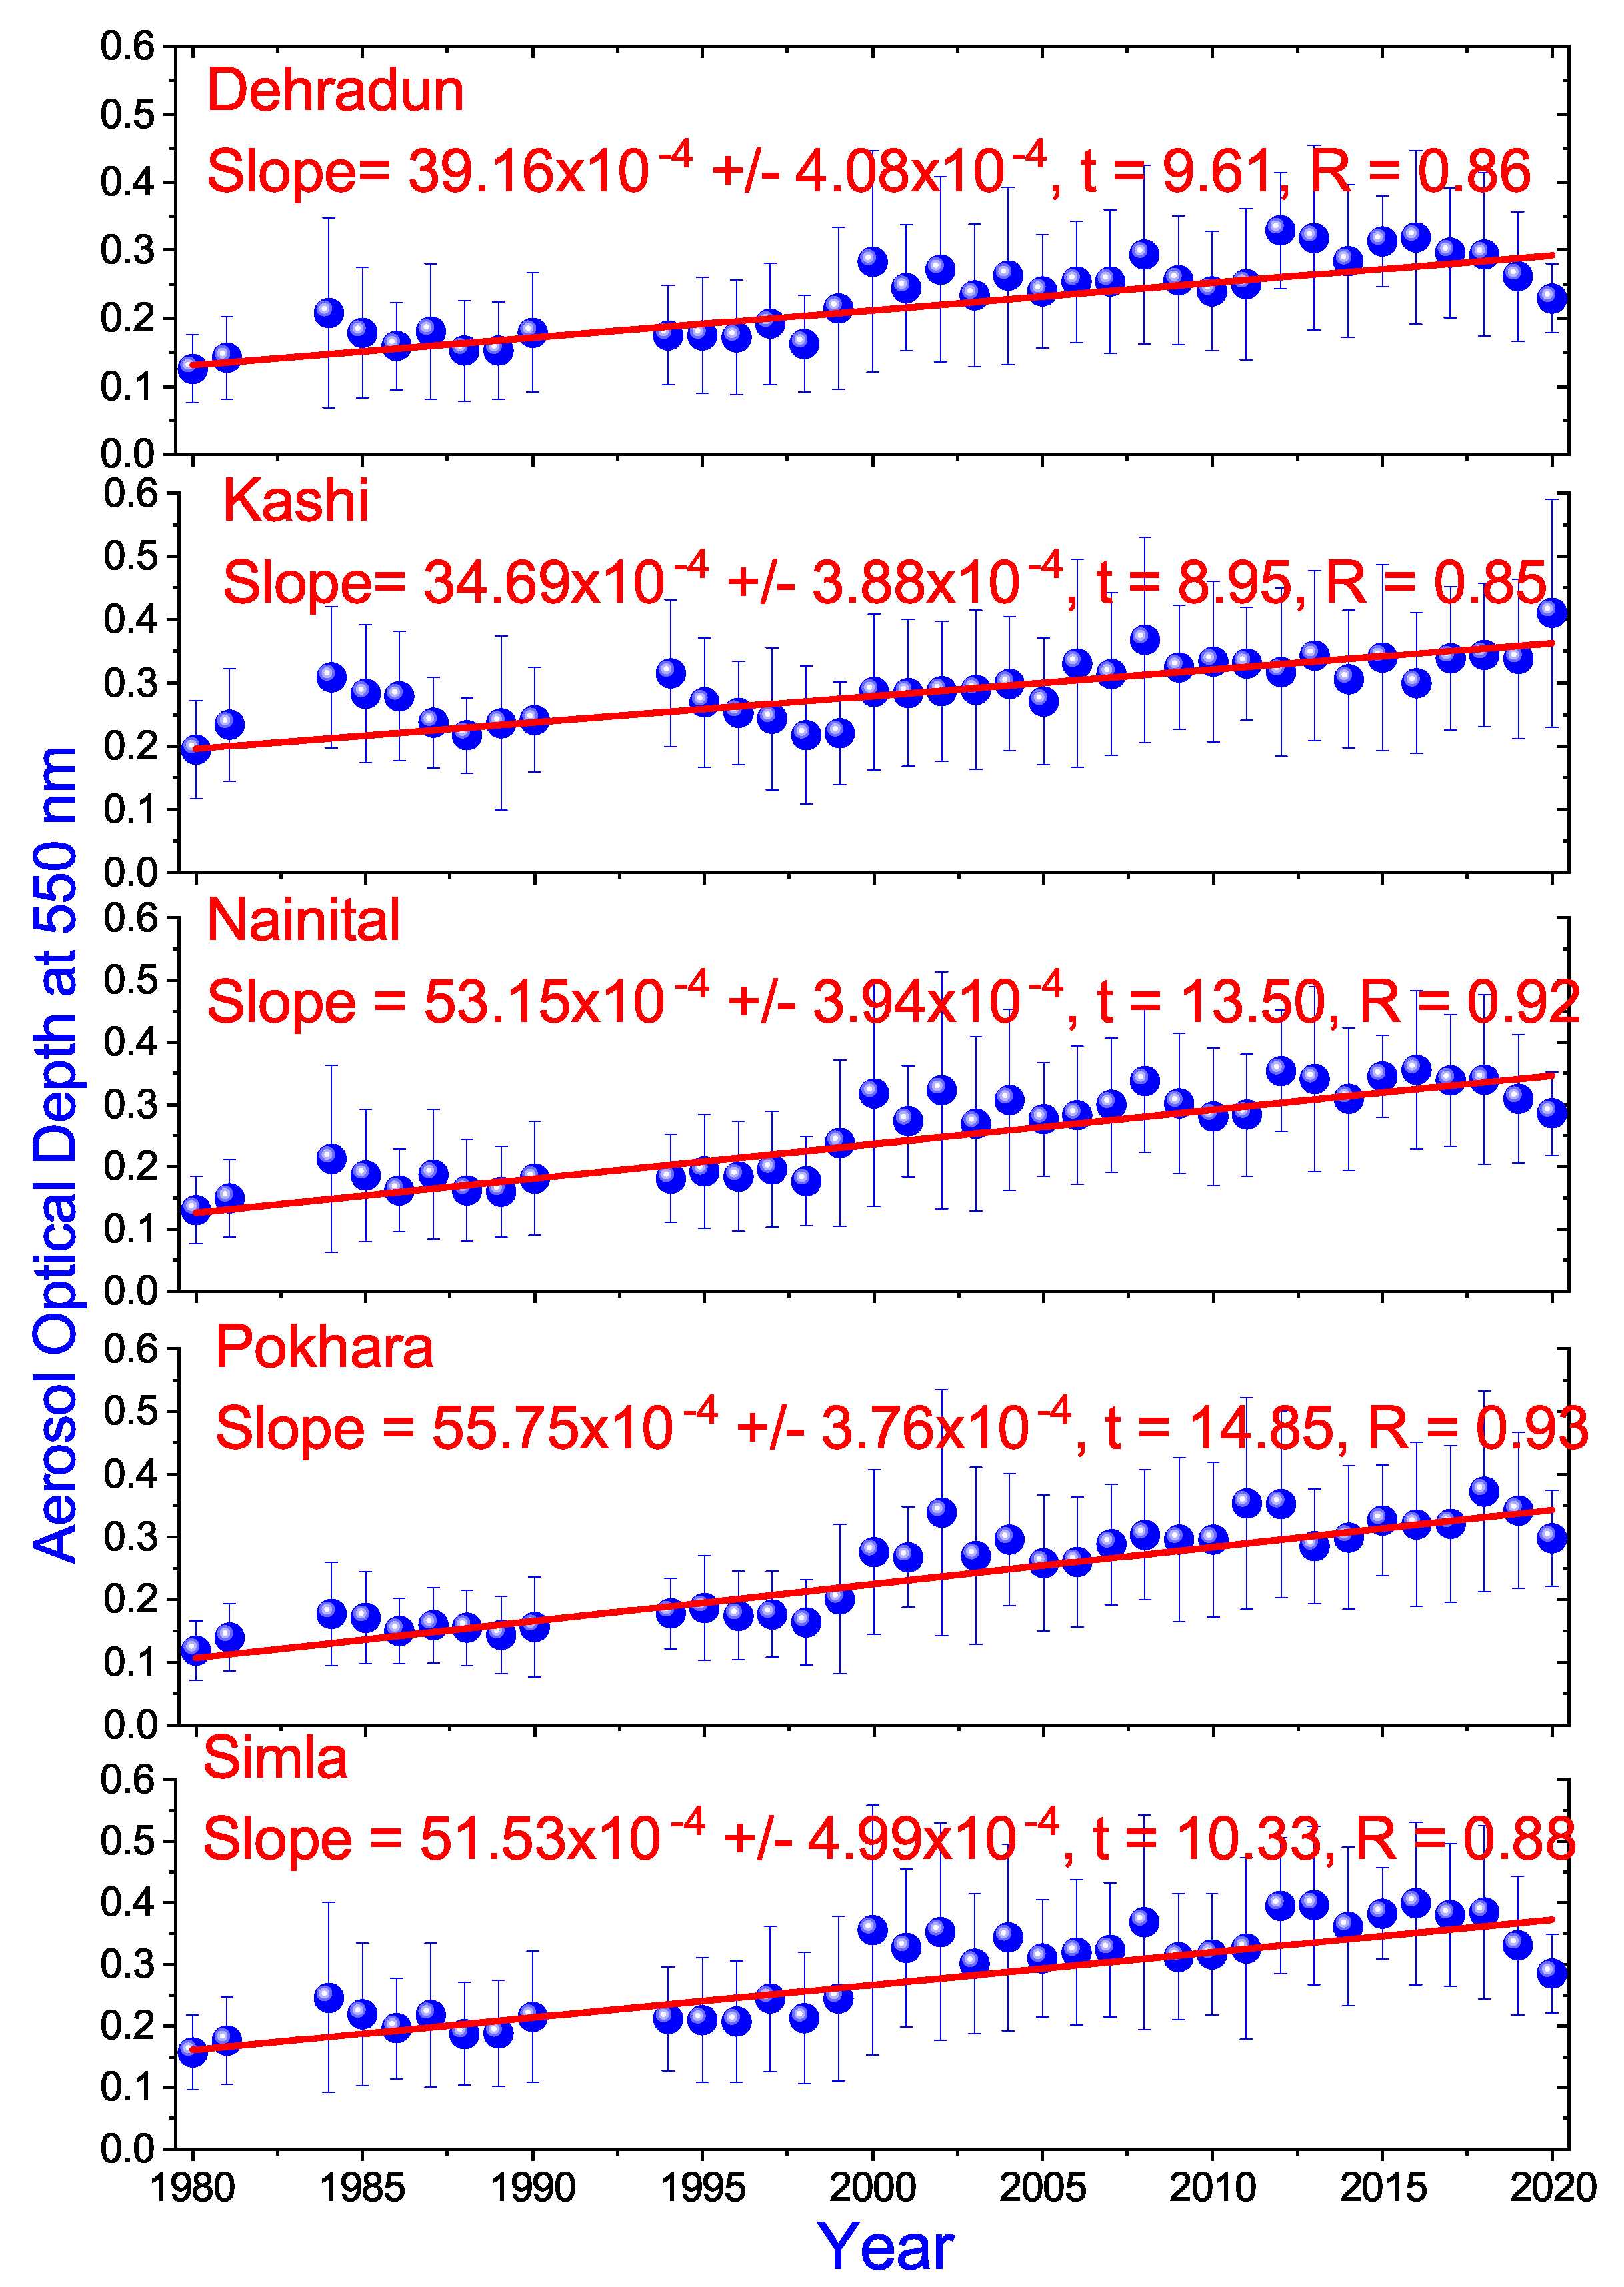
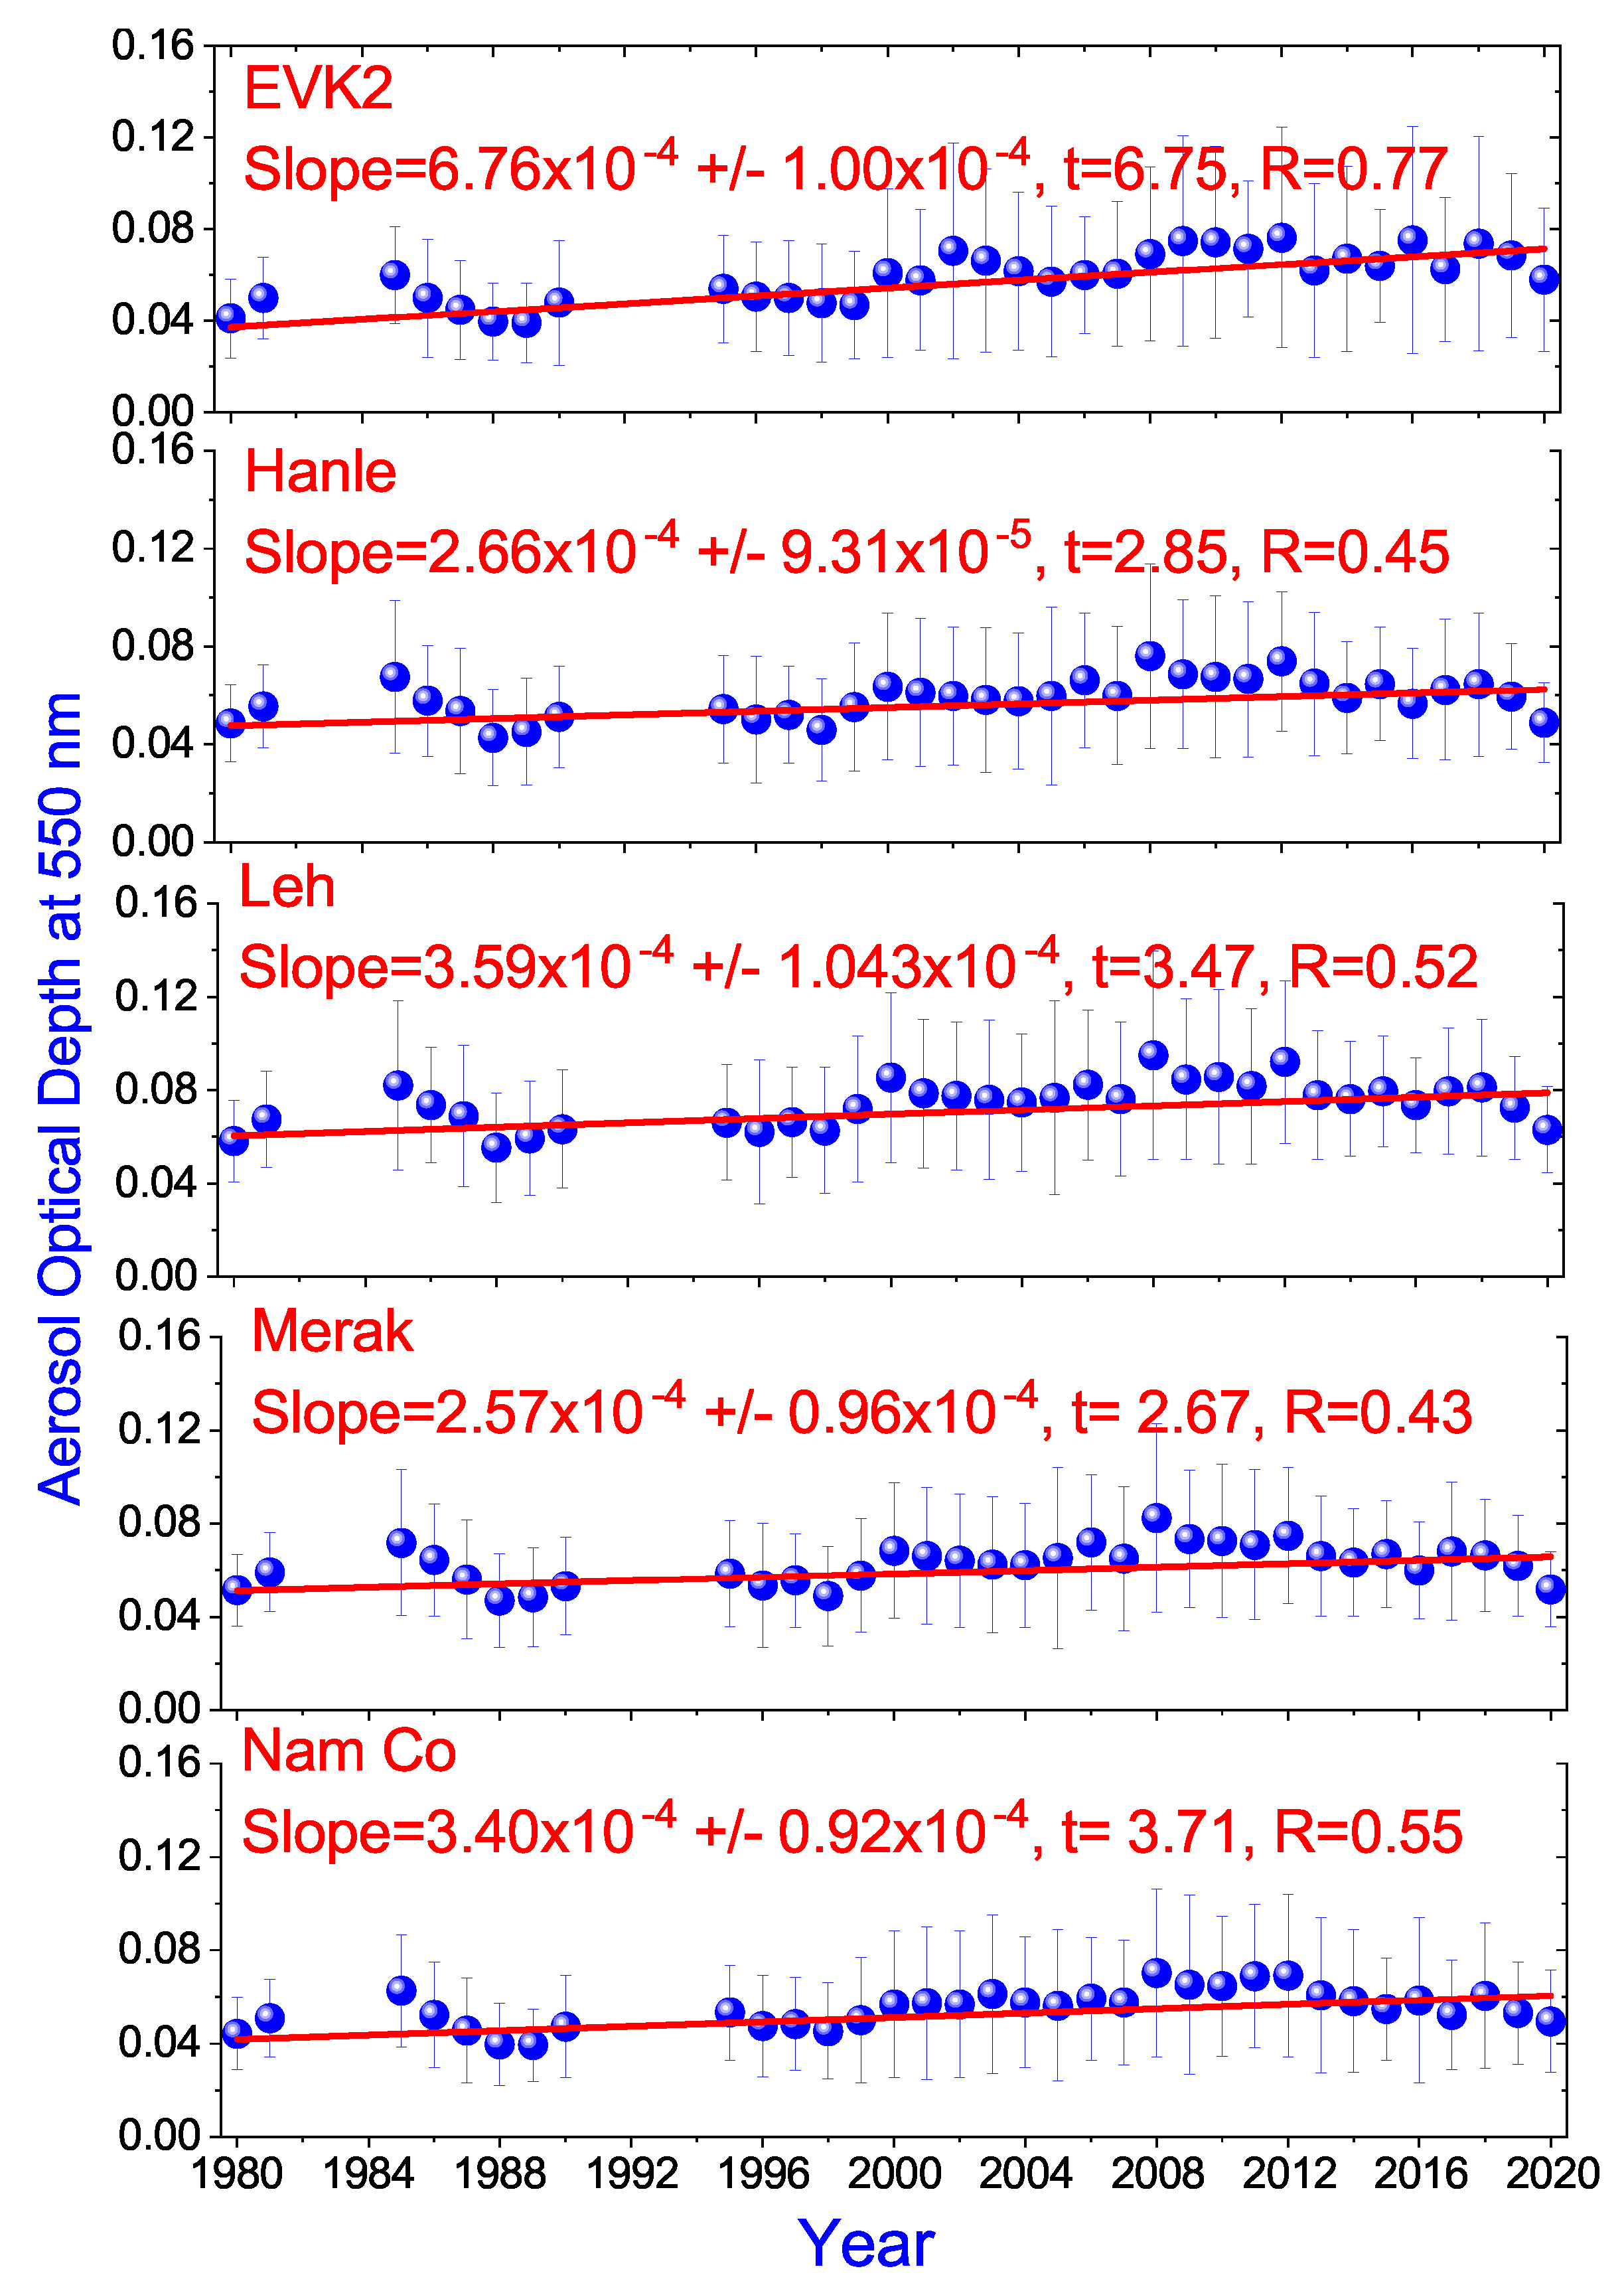
- The estimated AOD trends over the HKH1 varied from a minimum 2.57 × 10 ± 0.96 × 10 AOD year at Merak (Ladakh) to a maximum 34.69 × 10 ± 3.88 × 10 AOD year at Kashi. Among the HKH2 sites, significant enhancement of AOD is observed at many stations, namely, Dehradun, Shimla, Nainital and Pokhera by 39.16 × 10 ± 4.08 × 10, 51.53 × 10 ± 4.99 × 10, 53.15 × 10 ± 3.94 × 10 and 55.75 × 10 ± 3.76 × 10 AOD year, respectively. However, the estimated AOD trends at HKH3 varied from minimum 4.76 × 10 ± 0.95 × 10 at Lhasa to maximum 5.70 × 10 ± 0.90 × 10 AOD year at Litang with statistical significance.
- At the sub-regional scale, HKH1, HKH2 and HKH3 exhibit 23.33 × 10 ± 2.28 × 10, 32.20 × 10 ± 2.58 × 10 and 9.48 × 10 ± 1.21 × 10. AOD year, respectively, with correlation (R) of 0.81 to 0.91. The estimated trends are statistically significant, and the high AOD trends in the HKH1 and HKH2 region are due to long-range transported anthropogenic sources from the IGP region.
- On a seasonal basis, Pokhara, Nainital, Shimla and Dehradun show strong positive AOD trends with minimum 19.82 × 10 ± 3.38 × 10 to maximum 72.95 × 10 ± 4.88 × 10 AOD year, during all the seasons, with statistical significance. In addition, there are also increasing AOD trends at all the high-altitude background sites. However, the estimated trends are weak and statistically insignificant in several cases. Such weak trends in the high-altitude sites could be due to slight improvement of air quality during the national lockdown period coupled with the decreasing AOD trend in the previous few years. However, such variation is not significant at the sites located in the close vicinity of the IGP region. Further, the impacts of two major volcanic eruptions happening during 1982 and 1991 at El Chichn and Mt. Pinatubo, respectively, shows weakening of the trend estimation, particularly at high-altitude sites.
- The weakening AOD trends at the high-altitude sites in particular, which are attributed to a slight reduction in AOD during the last 5–6 years, may need to be re-examined with a longer and homogeneous data sets in future.
Supplementary Materials
Author Contributions
Funding
Institutional Review Board Statement
Informed Consent Statement
Data Availability Statement
Acknowledgments
Conflicts of Interest
References
- Krishnan, R.; Shrestha, A.B.; Ren, G.; Rajbhari, R.; Saeed, S.; Sanjay, J.; Syed, M.A.; Vellore, R.; Xu, Y.; You, Q.; et al. Unravelling Climate Change in the Hindu Kush Himalaya: Rapid Warming in the Mountains and Increasing Extremes. In The Hindu Kush Himalaya Assessment; Springer International Publishing: Cham, Switzerland, 2019; Wester, P., Mishra, A., Mukherji, A., Shrestha, A.B., Eds.; Springer International Publishing: Cham, Switzerland, 2019; pp. 57–97. [Google Scholar]
- Sharma, E.; Molden, D.; Rahman, A.; Khatiwada, Y.R.; Zhang, L.; Singh, S.P.; Yao, T.; Wester, P. Introduction to the Hindu Kush Himalaya Assessment. In The Hindu Kush Himalaya Assessment; Wester, P., Mishra, A., Mukherji, A., Shrestha, A.B., Eds.; Springer International Publishing: Cham, Switzerland, 2019; pp. 1–16. [Google Scholar]
- Gautam, R.; Hsu, N.C.; Lau, W.K.M.; Yasunari, T.J. Satellite observations of desert dust-induced himalayan snow darkening. Geophys. Res. Lett. 2013, 40, 988–993. [Google Scholar] [CrossRef] [Green Version]
- Sanjay, J.; Krishnan, R.; Shreshtha, A.B.; Rajbhari, R.; Ren, G.Y. Downscaled climate change projections for the Hindu Kush Himalayan region using CORDEX South Asia regional climate models. Adv. Clim. Chang. Res. 2017, 8, 185–198. [Google Scholar] [CrossRef]
- Arun, B.S.; Aswini, A.R.; Gogoi, M.M.; Hegde, P.; Kompalli, S.K.; Sharma, P.S.; Babu, S.S. Physico-chemical and optical properties of aerosols at a background site (∼4 km a.s.l.) in the western Himalayas. Atmos. Environ. 2019, 218, 117017. [Google Scholar] [CrossRef]
- Babu, S.S.; Chaubey, J.P.; Moorthy, K.K.; Gogoi, M.M.; Kompalli, S.K.; Sreekanth, V.; Bagare, S.P.; Bhatt, B.C.; Gaur, V.K.; Prabhu, T.P.; et al. High altitude (∼4520 m amsl) measurements of black carbon aerosols over western trans-Himalayas: Seasonal heterogeneity and source apportionment. J. Geophys. Res. Atmos. 2011, 116, D24201. [Google Scholar] [CrossRef] [Green Version]
- Dumka, U.C.; Kaskaoutis, D.G.; Francis, D.; Chaboureau, J.-P.; Rashki, A.; Tiwari, S.; Singh, S.; Liakakou, E.; Mihalopoulos, N. The Role of the Intertropical Discontinuity Region and the Heat Low in Dust Emission and Transport Over the Thar Desert, India: A Premonsoon Case Study. J. Geophys. Res. Atmos. 2019. [Google Scholar] [CrossRef]
- Sarangi, C.; Qian, Y.; Rittger, K.; Leung, L.R.; Chand, D.; Bormann, K.J.; Painter, T.H. Dust dominates high-altitude snow darkening and melt over high-mountain Asia. Nat. Clim. Chang. 2020, 10, 1045–1051. [Google Scholar] [CrossRef]
- Wester, P.; Mishra, A.; Mukherji, A.; Shrestha, A.B. (Eds.) The Hindu Kush Himalaya Assessment-Mountains, Climate Change, Sustainability and People; Springer Nature: Cham, Switzerland, 2019. [Google Scholar]
- Ming, J.; Du, Z.; Ziao, C.; Xu, X.; Zhang, D. Darkening of the mid-Himalaya glaciers since 2000 and the potential causes. Environ. Res. Lett. 2012, 7, 014021. [Google Scholar] [CrossRef] [Green Version]
- Svensson, J.; Ström, J.; Honkanen, H.; Asmi, E.; Dkhar, N.B.; Tayal, S.; Sharma, V.P.; Hooda, R.; Leppäranta, M.; Jacobi, H.-W.; et al. Deposition of light-absorbing particles in glacier snow of the Sunderdhunga Valley, the southern forefront of the central Himalayas. Atmos. Chem. Phys. 2021, 21, 2931–2943. [Google Scholar] [CrossRef]
- Zhang, Y.; Kang, S.; Cong, Z.; Schmale, J.; Sprenger, M.; Li, C.; Yang, W.; Gao, T.; Sillanpää, M.; Li, X.; et al. Light-absorbing impurities enhance glacier albedo reduction in the southeastern Tibetan Plateau. J. Geophys. Res. Atmos. 2017, 122, 6915–6933. [Google Scholar] [CrossRef]
- Rowe, P.M.; Cordero, R.R.; Warren, S.G.; Stewart, E.; Doherty, S.J.; Pankow, A.; Schrempf, M.; Casassa, G.; Carrasco, J.; Pizarro, J.; et al. Black carbon and other light-absorbing impurities in snow in the Chilean Andes. Sci. Rep. 2019, 9, 4008. [Google Scholar] [CrossRef] [Green Version]
- Bond, T.C.; Doherty, S.J.; Fahey, D.W.; Forster, P.M.; Berntsen, T.; DeAngelo, B.J.; Flanner, G.M.; Ghan, S.; Kärcher, B.; Koch, D.; et al. Bounding the role of black carbon in the climate system: A scientific assessment. J. Geophys. Res. Atmos. 2013, 118, 5380–5552. [Google Scholar] [CrossRef]
- Arctic Monitoring and Assessment Programme (AMAP). Black Carbon and Ozone as Arctic Climate Forcers; AMAP Assessment: Oslo, Norway, 2015. [Google Scholar]
- Dumka, U.C.; Ningombam, S.S.; Kaskaoutis, D.G.; Madhavan, B.L.; Song, H.-J.; Angchuk, D.; Jorphail, S. Long-term (2008–2018) aerosol properties and radiative effect at high-altitude sites over western trans-Himalayas. Sci. Total Environ. 2020, 734, 139354. [Google Scholar] [CrossRef]
- Dumka, U.C.; Kaskaoutis, D.G.; Srivastava, M.K.; Devara, P.C.S. Scattering and absorption properties of near-surface aerosol over Gangetic-Himalayan region: The role of boundary-layer dynamics and long-range transport. Atmos. Chem. Phys. 2015, 15, 1555–1572. [Google Scholar] [CrossRef] [Green Version]
- Ningombam, S.S.; Bagare, S.P.; Khatri, P.; Sohn, B.J.; Song, H.-J. Estimation of aerosol radiative forcing over an aged-background aerosol feature during advection and non-advection events using a ground-based data obtained from a Prede Skyradiometer observation. Atmos. Res. 2015, 164–165, 76–83. [Google Scholar] [CrossRef]
- Ningombam, S.S.; Bagare, S.P.; Srivastava, A.K.; Sohn, B.J.; Song, H.-J.; Larson, E. Aerosol radiative forcing over a high-altitude station Merak, in the trans-Himalayan region during advection of anthropogenic events from the Indo-Gangetic Plain. Atmos. Environ. 2014, 98, 253–259. [Google Scholar] [CrossRef]
- Badarinath, K.V.S.; Kharol, S.K.; Sharma, A.R. Long-range transport of aerosols from agriculture crop residue burning in Indo-Gangetic Plains-A study using LIDAR, ground measurements and satellite data. J. Atmos. Sol. Terr. Phys. 2009, 71, 112–120. [Google Scholar] [CrossRef]
- Hooda, R.K.; Kivekäs, N.; O’Connor, E.J.; Collaud Coen, M.; Pietikäinen, J.P.; Vakkari, V.; Backman, J.; Henriksson, S.V.; Asmi, E.; Komppula, M.; et al. Driving factors of aerosol properties over the foothills of central Himalayas based on 8.5 years continuous measurements. J. Geophys. Res. Atmos. 2018, 123, 13421–13422. [Google Scholar] [CrossRef]
- Kumar, R.; Naja, M.; Satheesh, S.K.; Ojha, N.; Joshi, H.; Sarangi, T.; Pant, P.; Dumka, U.C.; Hegde, P.; Venkataramani, S. Influences of the springtime northern Indian biomass burning over the central Himalayas. J. Geophys. Res. Atmos. 2011, 116, D19302. [Google Scholar] [CrossRef]
- Sebastian, M.; Kanawade, V.P.; Soni, V.K.; Asmi, E.; Westervelt, D.M.; Vakkari, V.; Hyvärinen, A.P.; Pierce, J.R.; Hooda, R.K. New Particle Formation and Growth to Climate-Relevant Aerosols at a Background Remote Site in the Western Himalaya. J. Geophys. Res. Atmos. 2021, 126. [Google Scholar] [CrossRef]
- Srivastava, A.K.; Singh, S.; Pant, P.; Dumka, U.C. Characteristics of black carbon over Delhi and Manora Peak-a comparative study. Atmos. Sci. Lett. 2012, 13, 223–230. [Google Scholar] [CrossRef]
- Ren, G.; Shrestha, A.B. Climate change in the Hindu Kush Himalaya. Adv. Clim. Chang. Res. 2017, 8, 130–140. [Google Scholar] [CrossRef]
- Lau, W.K.M.; Kim, K.-M. Fingerprinting the impacts of aerosols on long-term trends of the Indian summer monsoon regional rainfall. Geophys. Res. Lett. 2010, 37, L16705. [Google Scholar] [CrossRef] [Green Version]
- Cho, C.; Li, R.; Wang, S.Y.; Ho, J.; Robert, Y. Anthropogenic footprint of climate change in the June 2013 Northern India flood. Clim. Dyn. 2016, 46, 797–805. [Google Scholar] [CrossRef] [Green Version]
- Babu, S.S.; Manoj, M.M.; Moorthy, K.K.; Gogoi, M.M.; Nair, V.S.; Kompalli, S.B.; Satheesh, S.K.; Niranjan, K.; Ramagopal, K.; Bhuyan, P.K.; et al. Trends in aerosol optical depth over Indian region: Potential causes and impact indicators. J. Geophys. Res. Atmos. 2013, 118, 11794–11806. [Google Scholar] [CrossRef]
- Kaskaoutis, D.G.; Singh, R.P.; Gautam, R.; Sharma, M.; Kosmopoulos, P.G.; Tripathi, S.N. Variability and trends of aerosol properties over Kanpur, northern India using AERONET data (2001–10). Environ. Res. Lett. 2012, 7, 024003. [Google Scholar] [CrossRef] [Green Version]
- Ramachandran, S.; Kedia, S.; Srivastava, R. Aerosol optical depth trends over different regions of India. Atmos. Environ. 2012, 49, 338–347. [Google Scholar] [CrossRef]
- Srivastava, A.; Saran, S. Comprehensive study on AOD trends over the Indian subcontinent: A statistical approach. Int. J. Remote Sens. 2017, 38, 5127–5149. [Google Scholar] [CrossRef]
- Collaud Coen, M.; Andrews, E.; Alastuey, A.; Arsov, T.P.; Backman, J.; Brem, B.T.; Bukowiecki, N.; Couret, C.; Eleftheriadis, K.; Flentje, H.; et al. Multidecadal trend analysis of in situ aerosol radiative properties around the world. Atmos. Chem. Phys. 2020, 20, 8867–8908. [Google Scholar] [CrossRef]
- Ningombam, S.S.; Larson, E.J.L.; Dumka, U.C.; Victor, E.; Campanelli, M.; Steve, C. Long-term (1995–2018) aerosol optical depth derived using ground based AERONET and SKYNET measurements from aerosol aged-background sites. Atmos. Pol. Res. 2019, 10, 608–620. [Google Scholar] [CrossRef]
- Holben, B.N.; Eck, T.F.; Slutsker, I.; Tanré, D.; Buis, J.P.; Setzer, A.; Vermote, E.; Reagan, J.A.; Kaufman, Y.J.; Nakajima, T.; et al. AERONET-A federated instrument network and data archive for aerosol characterization. Remote Sens. Environ. 1998, 66, 1–16. [Google Scholar] [CrossRef]
- Nakajima, T.; Tonna, G.; Rao, R.; Boi, P.; Kaufman, Y.; Holben, B. Use of sky brightness measurements from ground for remote sensing of particulate poly-dispersions. Appl. Opt. 1996, 35, 2672–2686. [Google Scholar] [CrossRef]
- Gelaro, R.; McCarty, W.; Suárez, M.J.; Todling, R.; Molod, A.; Takacs, L.; Randles, C.A.; Darmenov, A.; Bosilovich, M.G.; Reichle, R.; et al. MERRA-2 overview: The modern-Era Retrospective analysis for research and Applications, version 2 (MERRA-2). J. Clim. 2017. [Google Scholar] [CrossRef]
- Li, Z.Q.; Xu, H.; Li, K.T.; Li, H.D.; Xie, Y.S.; Li, L.; Zhang, Y.; Gu, X.F.; Zhao, W.; Tian, Q.J.; et al. Comprehensive Study of Optical, Physical, Chemical, and Radiative Properties of Total Columnar Atmospheric Aerosols over China: An Overview of Sun–Sky Radiometer Observation Network (SONET) Measurements. Bull. American Meteo. Soc. 2018, 99, 739–755. [Google Scholar] [CrossRef]
- Levy, R.C.; Remer, L.A.; Kleidman, R.G.; Mattoo, S.; Ichoku, C.; Kahn, R.; Eck, T.F. Global evaluation of the Collection 5 MODIS dark-target aerosol products over Land. Atmos. Chem. Phys. 2010, 10, 10399–10420. [Google Scholar] [CrossRef] [Green Version]
- He, T.; Liang, S.; Wang, D.; Wu, H.; Yu, Y.; Wang, J. Estimation of surface albedo and directional reflectance from Moderate Resolution Imaging Spectroradiometer (MODIS) observations. Remote Sens. Environ. 2012, 119, 286–300. [Google Scholar] [CrossRef] [Green Version]
- Li, D.; Qin, K.; Wu, L.; Mei, L.; de Leeuw, G.; Xue, Y.; Shi, Y.; Li, Y. Himawari-8-Derived Aerosol Optical Depth Using an Improved Time Series Algorithm Over Eastern China. Remote Sens. 2020, 12, 978. [Google Scholar] [CrossRef]
- You, Y.; Zhao, T.; Xie, Y.; Zheng, Y.; Zhu, J.; Xia, J.; Cao, L.; Wang, C.; Che, H.; Liao, Y.; et al. Variation of the aerosol optical properties and validation of MODIS AOD products over the eastern edge of the Tibetan Plateau based on ground-based remote sensing in 2017. Atmos. Env. 2020, 223, 117257. [Google Scholar] [CrossRef]
- Heidinger, A.K.; Foster, M.J.; Walther, A.; Zhao, X. The Pathfinder Atmospheres-Extended AVHRR climate dataset. Bull. Am. Meteor. Soc. 2014, 95, 909–922. [Google Scholar] [CrossRef]
- Kahn, R.A.; Gaitley, B.J.; Martonchik, J.V.; Diner, D.J.; Crean, K.A.; Holben, B. Multiangle Imaging Spectroradiometer (MISR) global aerosol optical depth validation based on 2 years of coincident Aerosol Robotic Network (AERONET) observations. J. Geophys. Res. Atmos. 2005, 110, D10S04. [Google Scholar] [CrossRef] [Green Version]
- Randles, C.A.; da Silva, A.M.; Buchard, V.; Colarco, P.R.; Darmenov, A.; Govindaraju, R.; Smirnov, A.; Holben, B.; Ferrare, R.; Hair, J.; et al. The MERRA-2 Aerosol Reanalysis, 1980 Onward. Part I: System Description and Data Assimilation Evaluation. J. Clim. 2017, 30, 6823–6850. [Google Scholar] [CrossRef] [PubMed]
- Gueymard, C.A.; Yang, D. Worldwide validation of CAMS and MERRA-2 reanalysis aerosol optical depth products using 15 years of AERONET observations. Atmos. Environ. 2020, 225, 117216. [Google Scholar] [CrossRef]
- Sun, E.; Che, H.; Xu, X.; Wang, Z.; Lu, C.; Gui, K.; Zhao, H.; Zheng, Y.; Wang, Y.; Wang, H.; et al. Variation in MERRA-2 aerosol optical depth over the Yangtze River Delta from 1980 to 2016. Theor. Appl. Climatol. 2019, 136, 363–375. [Google Scholar] [CrossRef]
- Song, H.-J.; Sohn, B.J.; Chun, H.W.; Chun, Y.; Lee, S.S. Improved Cloud Screening Method for the Analysis of Sky Radiometer Measurements and Application to Asian Dust Detection. J. Meteorol. Soc. Jpn. 2014, 92A, 167–183. [Google Scholar] [CrossRef] [Green Version]
- Nakajima, T.; Campanelli, M.; Che, H.; Estellés, V.; Irie, H.; Kim, S.W.; Kim, J.; Liu, D.; Nishizawa, T.; Pandithurai, G.; et al. An overview of and issues with sky radiometer technology and SKYNET. Atmos. Meas. Tech. 2020, 13, 4195–4218. [Google Scholar] [CrossRef]
- Ningombam, S.S.; Bagare, S.P.; Rajendra, B.S.; Campanelli, M.; Khatri, P.; Dorje, N. Calibration of a Sky radiometer (Prede) using observations obtained from Hanle and Merak high-altitude stations in Ladakh. Atmos. Res. 2014, 143, 118–128. [Google Scholar] [CrossRef]
- Yang, X.; Zhao, C.; Yang, Y.; Fan, H. Long-term multi-source data analysis about the characteristics of aerosol optical properties and types over Australia. Atmos. Chem. Phys. 2021, 21, 3803–3825. [Google Scholar] [CrossRef]
- Ningombam, S.S.; Song, H.-J.; Mugil, S.K.; Dumka, U.C.; Larson, E.J.L.; Kumar, B.; Sagar, R. Evaluation of fractional clear sky over potential astronomical sites. Mon. Not. R. Astron. Soc. 2021, 507, 3745–3760. [Google Scholar] [CrossRef]
- Bryhn, A.C.; Dimberg, P.H. An operational definition of a statistically meaningful trend. PLoS ONE 2011, 6, e19241. [Google Scholar] [CrossRef] [Green Version]
- Dumka, U.C.; Kaskaoutis, D.G.; Verma, S.; Ningombam, S.S.; Kumar, S.; Ghosh, S. Silver linings in the dark clouds of COVID-19: Improvement of air quality over India and Delhi metropolitan area from measurements and WRF-CHIMERE model simulations. Atmos. Pollut. Res. 2021, 12, 225–242. [Google Scholar] [CrossRef]
- Lal, P.; Kumar, A.; Kumar, S.; Kumari, S.; Saikia, P.; Dayan, A.; Adhikari, D.; Khan, M.L. The dark cloud with a silver lining: Assessing the impact of the SARS COVID-19 pandemic on the global environment. Sci. Total Environ. 2020, 732, 139297. [Google Scholar] [CrossRef]
- Singh, V.; Singh, S.; Biswal, A.; Kesarkar, A.P.; Mor, S.; Ravindra, K. Diurnal and temporal changes in air pollution during COVID-19 strict lockdown over different regions of India. Environ. Pol. 2020, 115368. [Google Scholar] [CrossRef] [PubMed]
- Ningombam, S.S.; Dumka, U.C.; Srivastava, A.K.; Song, H.-J. Optical and physical properties of aerosols during active fire events occurring in the Indo-Gangetic Plains: Implications for aerosol radiative forcing. Atmos. Environ. 2020, 223, 117225. [Google Scholar] [CrossRef]
- Raatikainen, T.; Hyvärinen, A.P.; Hatakka, J.; Panwar, T.S.; Hooda, R.K.; Sharma, V.P.; Lihavainen, H. The effect of boundary layer dynamics on aerosol properties at the Indo-Gangetic plains and at the foothills of the Himalayas. Atmos. Environ. 2014, 89, 548–555. [Google Scholar] [CrossRef]
- Zhu, J.; Xia, X.; Che, H.; Wang, J.; Cong, Z.; Zhao, T.; Kang, S.; Zhang, X.; Yu, X.; Zhang, Y. Spatiotemporal variation of aerosol and potential long-range transport impact over the Tibetan Plateau, China. Atmos. Chem. Phys. 2019, 19, 14637–14656. [Google Scholar] [CrossRef] [Green Version]
- Dumka, U.C.; Satheesh, S.K.; Sagar, R.; Pant, P. Short-Period Modulations in Aerosol Optical Depths over the Central Himalayas: Role of Mesoscale Processes. J. Appl. Meteorol. Climatol. 2008, 47, 1467–1475. [Google Scholar] [CrossRef] [Green Version]
- Prasad, A.K.; Singh, R.P. Changes in Aerosol Parameters during Major Dust Storm Events (2001–2005) over the Indo-Gangetic Plains Using AERONET and MODIS Data. J. Geophys. Res. Atmos. 2007, 112, D09208. [Google Scholar] [CrossRef] [Green Version]
- Sagar, R.; Kumar, B.; Dumka, U.C.; Moorthy, K.K.; Pant, P. Characteristics of aerosol spectral optical depthsover Manora Peak: A high-altitude station in the central Himalayas. J. Geophys. Res. Atmos. 2004, 109, D06207. [Google Scholar] [CrossRef] [Green Version]
- Ningombam, S.S.; Bagare, S.P.; Srivastava, A.K.; Kanawade, V.P.; Singh, R.B.; Padhy, S.K. Temporal asymmetry in aerosol optical characteristics: A case study at a high-altitude station, Hanle, in Ladakh region. J. Atmos. Solar-Terr. Phys. 2014, 121, 123–131. [Google Scholar] [CrossRef]


| Site Name | Type of Sites | Lat. | Long. | Elevation (m) |
|---|---|---|---|---|
| HKH1 | background & non-background | 32–39 | 71–79 | ∼1000–5000 |
| Hanle | background | 32.78 | 78.95 | 4500 |
| Merak | background | 33.80 | 78.62 | 4310 |
| Leh | background | 34.15 | 77.58 | 3500 |
| Issyk | non-background | 42.60 | 76.98 | 1650 |
| Srinagar | non-background | 34.01 | 74.80 | 1590 |
| Kashi | non-background | 39.50 | 75.93 | 1320 |
| HKH2 | background & non-background | 27–32 | 76–93 | ∼300–5000 |
| EVK2 | background | 27.96 | 86.80 | 5080 |
| Nam Co | background | 30.77 | 90.96 | 4750 |
| QOMS | background | 28.37 | 86.95 | 4280 |
| Lhasa | background | 29.60 | 91.20 | 3680 |
| Shimla | non-background | 31.11 | 77.17 | 2280 |
| Nainital | non-background | 29.36 | 79.46 | 1940 |
| Pokhara | non-background | 28.19 | 83.97 | 800 |
| Dehradun | non-background | 30.32 | 78.03 | 430 |
| HKH3 | mostly background | 28–36 | 93–103 | ∼1000–5000 |
| Litang | background | 29.98 | 100.26 | 3930 |
| Chamdo | background | 31.13 | 97.17 | 3240 |
| Stations | Mean AOD | Trend ( × 10) | R | t |
|---|---|---|---|---|
| HKH1 | 0.18 ± 0.05 | 23.33 ± 2.28 | 0.87 | 10.22 |
| Hanle | 0.06 ± 0.02 | 2.66 ± 0.93 | 0.45 | 2.85 |
| Merak | 0.06 ± 0.02 | 2.57 ± 0.96 | 0.43 | 2.67 |
| Leh | 0.08 ± 0.03 | 3.59 ± 1.04 | 0.52 | 3.47 |
| Issyk | 0.16 ± 0.04 | 2.85 ± 1.72 | 0.28 | 1.65 |
| Srinagar | 0.16 ± 0.04 | 15.85 ± 2.21 | 0.78 | 7.16 |
| Kashi | 0.29 ± 0.09 | 34.69 ± 3.88 | 0.85 | 8.95 |
| HKH2 | 0.17 ± 0.04 | 32.20 ± 2.58 | 0.91 | 12.47 |
| EVK2 | 0.06 ± 0.03 | 6.76 ± 1.00 | 0.77 | 6.74 |
| Nam Co | 0.06 ± 0.02 | 3.40 ± 0.92 | 0.55 | 3.71 |
| QOMS | 0.05 ± 0.02 | 4.28 ± 0.87 | 0.66 | 4.91 |
| Lhasa | 0.06 ± 0.03 | 4.76 ± 0.95 | 0.66 | 4.99 |
| Shimla | 0.29 ± 0.10 | 51.53 ± 4.99 | 0.88 | 10.33 |
| Nainital | 0.26 ± 0.09 | 53.15 ± 3.94 | 0.92 | 13.50 |
| Pokhara | 0.25 ± 0.08 | 55.75 ± 3.76 | 0.93 | 14.85 |
| Dehradun | 0.23 ± 0.08 | 39.16 ± 4.08 | 0.86 | 9.61 |
| HKH3 | 0.09 ± 0.03 | 9.48 ± 1.21 | 0.81 | 7.82 |
| Litang | 0.06 ± 0.03 | 5.70 ± 0.90 | 0.75 | 6.34 |
| Chamdo | 0.06 ± 0.03 | 5.60 ± 1.01 | 0.70 | 5.53 |
| Winter | Autumn | |||||
|---|---|---|---|---|---|---|
| Stations | Trend ( × 10) | R | t | Trend ( × 10) | R | t |
| HKH1 | 21.99 ± 2.04 | 0.89 | 10.78 | 29.79 ± 2.96 | 0.87 | 10.97 |
| Hanle | 1.40 ± 0.69 | 0.34 | 2.02 | 0.90 ± 0.71 | 0.22 | 1.29 |
| Merak | 0.24 ± 0.49 | 0.09 | 0.48 | 0.44 ± 0.72 | 0.11 | 0.61 |
| Leh | 2.17 ± 0.78 | 0.44 | 2.79 | 2.36 ± 0.76 | 0.48 | 3.09 |
| Issyk | 1.88 ± 2.29 | 0.15 | 0.82 | 5.74 ± 1.47 | 0.57 | 3.91 |
| Srinagar | 23.68 ± 1.92 | 0.91 | 12.32 | 20.57 ± 3.16 | 0.76 | 6.52 |
| Kashi | 29.03 ± 4.88 | 0.72 | 5.94 | 37.75 ± 5.79 | 0.76 | 6.52 |
| HKH2 | 41.40 ± 2.47 | 0.95 | 16.74 | 38.47 ± 3.27 | 0.90 | 11.78 |
| EVK2 | 0.36 ± 0.85 | 0.08 | 0.43 | 3.47 ± 0.92 | 0.55 | 3.77 |
| Nam Co | –0.36 ± 0.58 | –0.11 | –0.61 | 2.41 ± 0.97 | 0.40 | 2.48 |
| QOMS | –0.56 ± 0.68 | –0.15 | –0.83 | 1.90 ± 0.54 | 0.53 | 3.51 |
| Shimla | 55.91 ± 4.02 | 0.93 | 13.90 | 51.30 ± 5.35 | 0.86 | 9.59 |
| Nainital | 50.80 ± 3.50 | 0.93 | 14.48 | 54.27 ± 7.97 | 0.77 | 6.81 |
| Pokhara | 63.56 ± 5.53 | 0.90 | 11.51 | 48.97 ± 4.33 | 0.90 | 11.32 |
| Dehradun | 40.65 ± 3.54 | 0.89 | 11.47 | 36.61 ± 4.16 | 0.84 | 8.79 |
| HKH3 | 7.79 ± 1.22 | 0.74 | 6.38 | 3.66 ± 0.67 | 0.69 | 5.46 |
| Litang | 3.80 ± 0.71 | 0.69 | 5.35 | 0.97 ± 0.68 | 0.24 | 1.43 |
| Lhasa | 0.18 ± 0.70 | 0.05 | 0.26 | 2.90 ± 1.03 | 0.45 | 2.82 |
| Chamdo | 4.28 ± 1.06 | 0.58 | 4.03 | 2.98 ± 0.75 | 0.58 | 3.99 |
| Spring | Summer | |||||
|---|---|---|---|---|---|---|
| Stations | Trend ( × 10) | R | t | Trend ( × 10) | R | t |
| HKH1 | 10.57 ± 1.71 | 0.73 | 6.19 | 34.68 ± 4.10 | 0.82 | 8.45 |
| Hanle | –0.35 ± 1.25 | –0.05 | –0.28 | 0.30 ± 1.77 | 0.03 | 0.17 |
| Merak | 1.76 ± 1.62 | 0.19 | 1.08 | 5.82 ± 1.99 | 0.47 | 2.93 |
| Leh | 1.80 ± 1.89 | 0.17 | 0.95 | 7.13 ± 0.85 | 0.83 | 8.37 |
| Issyk | 9.63 ± 4.25 | 0.37 | 2.27 | –1.90 ± 2.97 | –0.11 | –0.64 |
| Srinagar | 1.64 ± 2.59 | 0.11 | 0.63 | 22.18 ± 2.54 | 0.84 | 8.72 |
| Kashi | 32.19 ± 4.10 | 0.81 | 7.85 | 23.56 ± 6.04 | 0.57 | 3.90 |
| HKH2 | 26.10 ± 3.62 | 0.78 | 7.22 | 33.82 ± 2.05 | 0.94 | 16.52 |
| EVK2 | 14.09 ± 2.06 | 0.77 | 6.83 | 9.05 ± 1.14 | 0.81 | 7.95 |
| Nam Co | 6.37 ± 1.62 | 0.57 | 3.93 | 5.92 ± 0.81 | 0.80 | 7.31 |
| QOMS | 9.14 ± 1.82 | 0.67 | 5.04 | 7.65 ± 0.90 | 0.83 | 8.46 |
| Shimla | 27.89 ± 3.91 | 0.78 | 7.14 | 70.56 ± 6.33 | 0.89 | 11.13 |
| Nainital | 34.95 ± 4.39 | 0.82 | 7.97 | 72.95 ± 4.88 | 0.94 | 14.93 |
| Pokhara | 65.80 ± 7.45 | 0.84 | 8.84 | 41.45 ± 5.14 | 0.82 | 8.06 |
| Dehradun | 19.82 ± 3.38 | 0.72 | 5.86 | 53.31 ± 5.87 | 0.85 | 9.09 |
| HKH3 | 19.62 ± 1.66 | 0.90 | 11.83 | 7.75 ± 1.51 | 0.68 | 5.13 |
| Litang | 11.67 ± 1.33 | 0.83 | 8.73 | 8.17 ± 1.04 | 0.81 | 7.86 |
| Lhasa | 6.54 ± 1.34 | 0.65 | 4.89 | 5.98 ± 0.90 | 0.76 | 6.63 |
| Chamdo | 11.26 ± 1.16 | 0.86 | 9.71 | 2.75 ± 1.12 | 0.40 | 2.45 |
Publisher’s Note: MDPI stays neutral with regard to jurisdictional claims in published maps and institutional affiliations. |
© 2021 by the authors. Licensee MDPI, Basel, Switzerland. This article is an open access article distributed under the terms and conditions of the Creative Commons Attribution (CC BY) license (https://creativecommons.org/licenses/by/4.0/).
Share and Cite
Ningombam, S.S.; Dumka, U.C.; Mugil, S.K.; Kuniyal, J.C.; Hooda, R.K.; Gautam, A.S.; Tiwari, S. Impacts of Aerosol Loading in the Hindu Kush Himalayan Region Based on MERRA-2 Reanalysis Data. Atmosphere 2021, 12, 1290. https://0-doi-org.brum.beds.ac.uk/10.3390/atmos12101290
Ningombam SS, Dumka UC, Mugil SK, Kuniyal JC, Hooda RK, Gautam AS, Tiwari S. Impacts of Aerosol Loading in the Hindu Kush Himalayan Region Based on MERRA-2 Reanalysis Data. Atmosphere. 2021; 12(10):1290. https://0-doi-org.brum.beds.ac.uk/10.3390/atmos12101290
Chicago/Turabian StyleNingombam, Shantikumar S., Umesh Chandra Dumka, Sivasamy Kalamani Mugil, Jagdish Chandra Kuniyal, Rakesh K. Hooda, Alok Sagar Gautam, and Suresh Tiwari. 2021. "Impacts of Aerosol Loading in the Hindu Kush Himalayan Region Based on MERRA-2 Reanalysis Data" Atmosphere 12, no. 10: 1290. https://0-doi-org.brum.beds.ac.uk/10.3390/atmos12101290