
Estimation of Biogas Generated in Two Landfills in South-Central Ecuador
by
 , and
, and
Paulina Poma
1, 
Marco Usca
2,
María Polanco
1,
Theofilos Toulkeridis
3,4 and
Carlos Mestanza-Ramón
5,6,7,*
1
Department of Chemical Engineering and Environmental Technology, University of Valladolid, 47013 Valladolid, Spain
2
Department of GeoInformatics—Z_GIS, University of Salzburg, 56479 Salzburg, Austria
3
Department of Earth Sciences and Construction, Universidad de las Fuerzas Armadas ESPE, Sangolqui 171101, Ecuador
4
Department of Tourism, University of Tourism Specialties (UDET), Quito 170143, Ecuador
5
Department of Environmental Engineering, University of Calabria, 87036 Rende, Italy
6
Research Group YASUNI-SDC, Escuela Superior Politécnica de Chimborazo, Sede Orellana, El Coca 220001, Ecuador
7
Instituto Superior Tecnológico Universitario Oriente, La Joya de los Sachas 220101, Ecuador
*
Author to whom correspondence should be addressed.
Atmosphere 2021, 12(10), 1365; https://0-doi-org.brum.beds.ac.uk/10.3390/atmos12101365
Submission received: 7 September 2021
/
Revised: 10 October 2021
/
Accepted: 14 October 2021
/
Published: 19 October 2021
(This article belongs to the Special Issue Long-Term Research on the Quality of Air and the Trends of Its Variability)
Abstract
:The landfill is a final disposal technique to confine municipal solid waste (MSW), where organic matter is degraded generating leachate and biogas composed of methane gases (CH4), carbon dioxide (CO2) and other gases that contribute to global warming. The objective of the current research was to estimate the amount of biogas generated through the LandGEM 3.03 mathematical model to determine the amount of electrical energy generated and the number of homes that would be supplied with electrical energy from 2021 to 2144. As a result of the application, it was estimated that in the Pichacay landfill, the highest point of biogas generation in 2053 would be 76,982,177 (m3/year) that would generate 81,226,339.36 (kWh/year), and would supply 5083 homes with electricity. Similarly, in the Las Iguanas landfill, the highest point would be 693,975,228 (m3/year) of biogas that produces 73,223,5296.7 (kWh/year) and would supply electricity to 45,825 homes. Of the performed gas analyses in the Pichacay landfill in 2020, an average of 51.49% CH4, 40.35% CO2, 1.75% O2 and 17.8% H2S was presented, while in the Las Iguanas landfill, for 2020 and 2021, we obtained an average of 51.88/CH4, 36.62% CO2, 1.01% O2 and 187.58 ppm H2S. Finally, the biogas generated by being harnessed minimizes the impacts related to global warming and climate change and would contribute electricity to the nearby communities.
1. Introduction
Anthropic activities have caused the generation of greenhouse gases (GHG), increasing in environmental temperatures, leading to increased rainfall, thawing, altering the hydrological system and acidification of the oceans [1,2]. One of the predominant factors that contribute to climate change is the generation of municipal solid waste (MSW), hence the World Bank indicates that 2.01 trillion tons of urban solid waste is generated per year worldwide, of which only 33% is managed in an environmentally safe way. The per Capita Production of solid waste (PPP) worldwide oscillates at approximately 0.74 (kg/inhab/day).
In effect, global waste is expected to increase to 3.40 billion tons of annual waste in 2050, of which 19% would be distributed in high-income countries while 40% would occur in low- and middle-income countries [3]. Likewise, the World Biogas Association (WBA), estimated that worldwide, more than 105,000 billion tons of organic waste is generated per year, which releases gases such as methane (CH4), carbon dioxide (CO2) and other gases (GHG) which are products of the degradation of organic matter [4,5,6]. Currently, 2% of organic waste is recycled and 98% is mixed with MSW; however, this waste could be managed to reduce GHG by 10% between 2021 and 2030, following one of the main objectives of the Agreement on Paris Sustainable Development of the United Nations (UN) [1,7,8]. The Intergovernmental Group of Experts on Climate Change (IPCC), in the 2014 report, indicated that natural changes will depend on past and future anthropogenic emissions, with the prediction that the average annual temperature of the planet will increase several degrees by the end of the 21st century, while intense rainfall events continue to be more frequent, and if gas emissions (GHG) do not decrease [9,10].
In Ecuador, according to reports from the National Institute of Statistics and Census (INEC) and the National Municipal Information System (SMIN) in 2018, an average of 12,739.01 tons of municipal solid waste (MSW) was collected daily, of which 45% was disposed of in sanitary landfills, 35% in emergent cells and 20% in landfills. Of the generated MSW, 84.7% was collected in an undifferentiated way, 15.3% in a differentiated way, hence, 67% of the collected waste was inorganic and 33% organic [10,11,12]. Currently, in Ecuador, the Per Capita Production of solid waste (PPP) at the urban level reaches 0.84 (kg/inhab/day). The degradation of organic matter is through biochemical reactions divided into phases: hydrolysis, acidogenic fermentation, acetogenic and methanogenic [13,14,15]. Hence, the composition and quantity of gas produced depend on the characteristics of the sanitary landfill such as age, area, temperature (T°), rainfall, type and quantity of MSW, coverage and compaction density [16,17].
As a result of the degradation of organic waste in sanitary landfills, it gives rise to the production of biogas composed of methane gases CH4 50–60%, carbon dioxide CO2 40–50%, carbon monoxide CO traces, nitrogen N2 2–3%, hydrogen sulfide H2S 1–2%, Hydrogen H2 < 1, oxygen O2 < 1, ammonia NH3 traces, aromatic and cyclic hydrocarbons and volatile organic compounds [18,19,20,21]. CH4 and CO2 are the main components of biogas, and most of Ecuador’s sanitary landfills lack a biogas recovery system, therefore, causes a serious problem for the environment. Hence, between 2015 and 2030, emissions from final disposal sites of MSW are projected to increase by 30% compared to 14% from leachate during the same time period. Emissions are projected by global losses generated by the decomposition of MSW, increasing by 23% and reaching 1905 MtCO2 eq [22,23,24].
Thus, the main objectives of the current study were to estimate the amount of biogas produced in two landfills in Ecuador, in order to determine the amount of electricity generated from the total biogas and the number of houses that would be supplied with the amount of the produced electricity. To accomplish these objectives, we reviewed the given literature and applied the mathematical model “Landfill Gas Emissions Model” LandGEM, version 3.03, in order to obtain the biogas production. Consequently, the current study will allow for informing municipal governments of the importance of solid waste management and the construction of biogas utilization systems, reducing pollutants that emit greenhouse gases (GHG) and contributing energy to the nearby communities.
2. Materials and Methods
2.1. Study Area
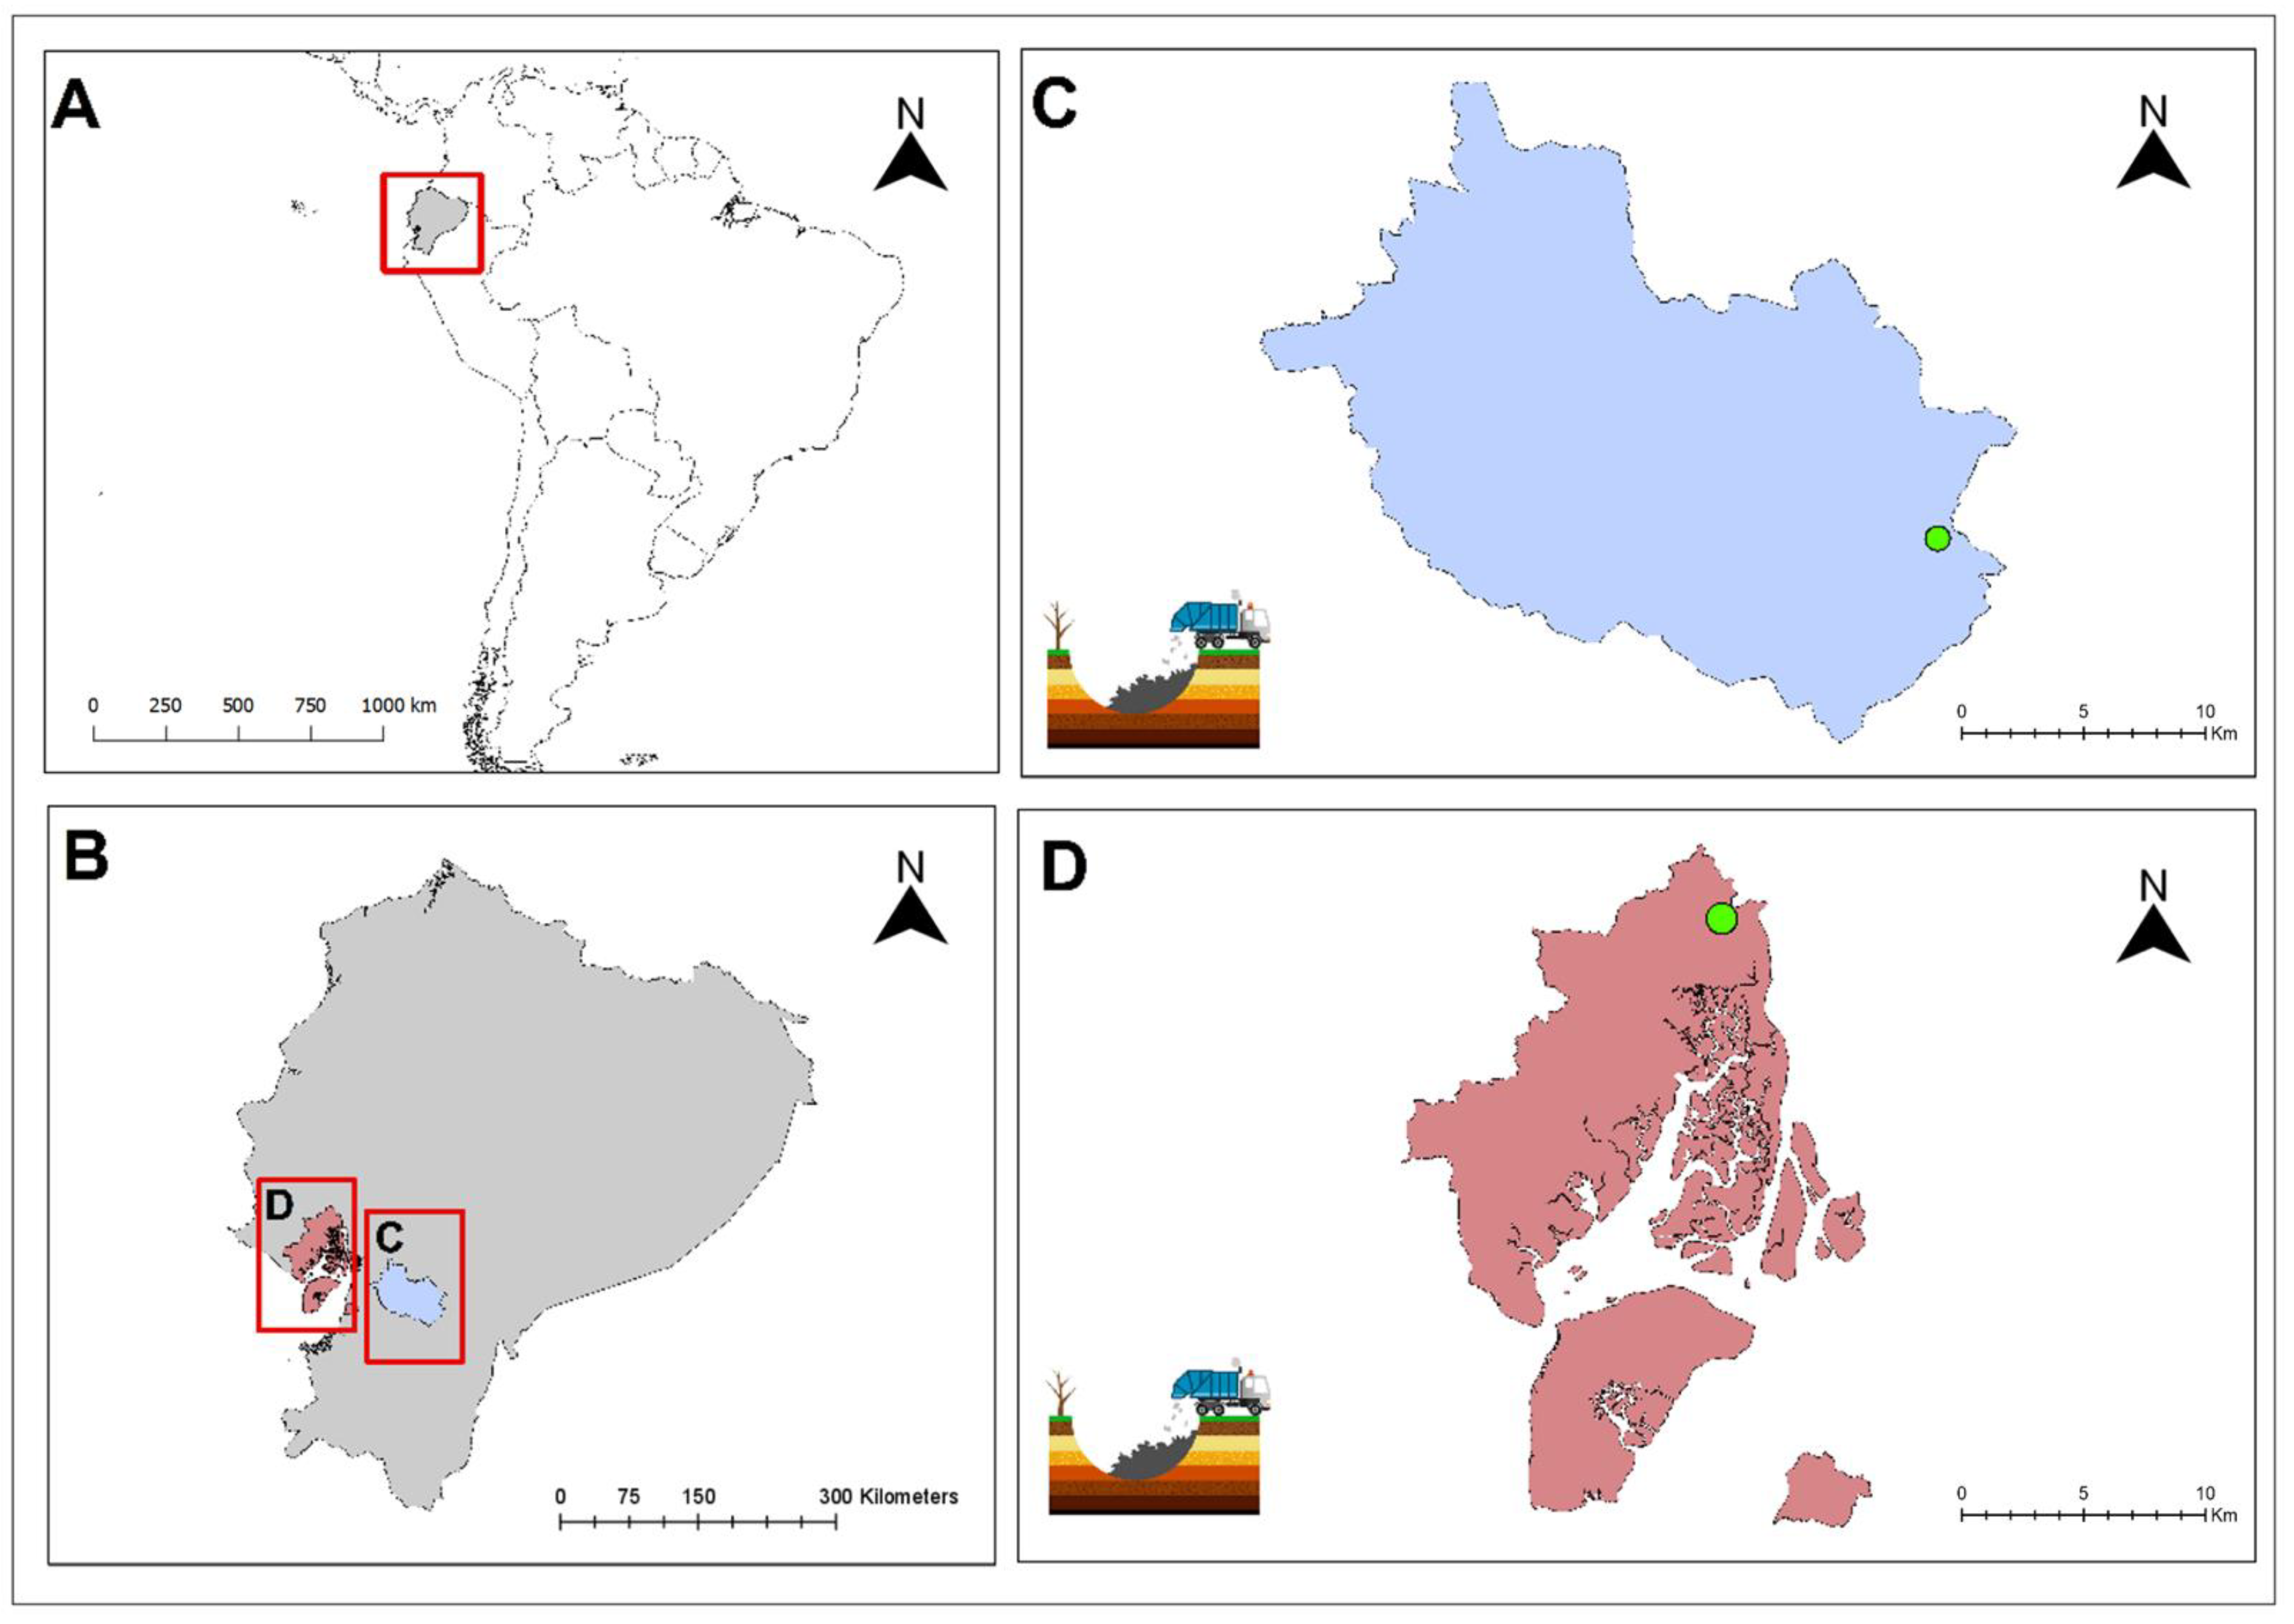
The study was performed in two landfills in Ecuador’s territory (Figure 1), belonging to two of a total of 221 cantons. The first, called “Pinchacay”, with a biogas system, is located in the central-south Andean zone of Ecuador, in the province of Azuay, canton Cuenca, which serves a population of 417,632 inhabitants distributed across 24 parishes. This landfill is managed by the Municipal Public Company EMAC EP (Cuenca, Ecuador) and the company BGP ENERGY CEM (Cuenca, Ecuador), which are in charge of drilling the wells and capturing the biogas, whose project started production in 2016. The occupied area for its operation is approximately 140 hectares and its construction was projected with a useful life of approximately 20 years.
The second landfill, called “Las Iguanas”, is characterized by a lack of a biogas system. It is located in the southern coastal area, in the province of Guayas, Guayaquil canton, Km 14.5 Vía Guayaquil—Daule, and serves 2,350,915 inhabitants. This landfill has been managed by the ILM-LAS IGUANAS Consortium (Guayaquil, Ecuador) since 1994 and consists of four sectors, where the first comprises 28.69 ha, the second serves for the deposit of inert material, the third occupies 13.63 ha, while the fourth extends to 40.71 ha, giving a total surface area of 190 hectares.
2.2. Methods
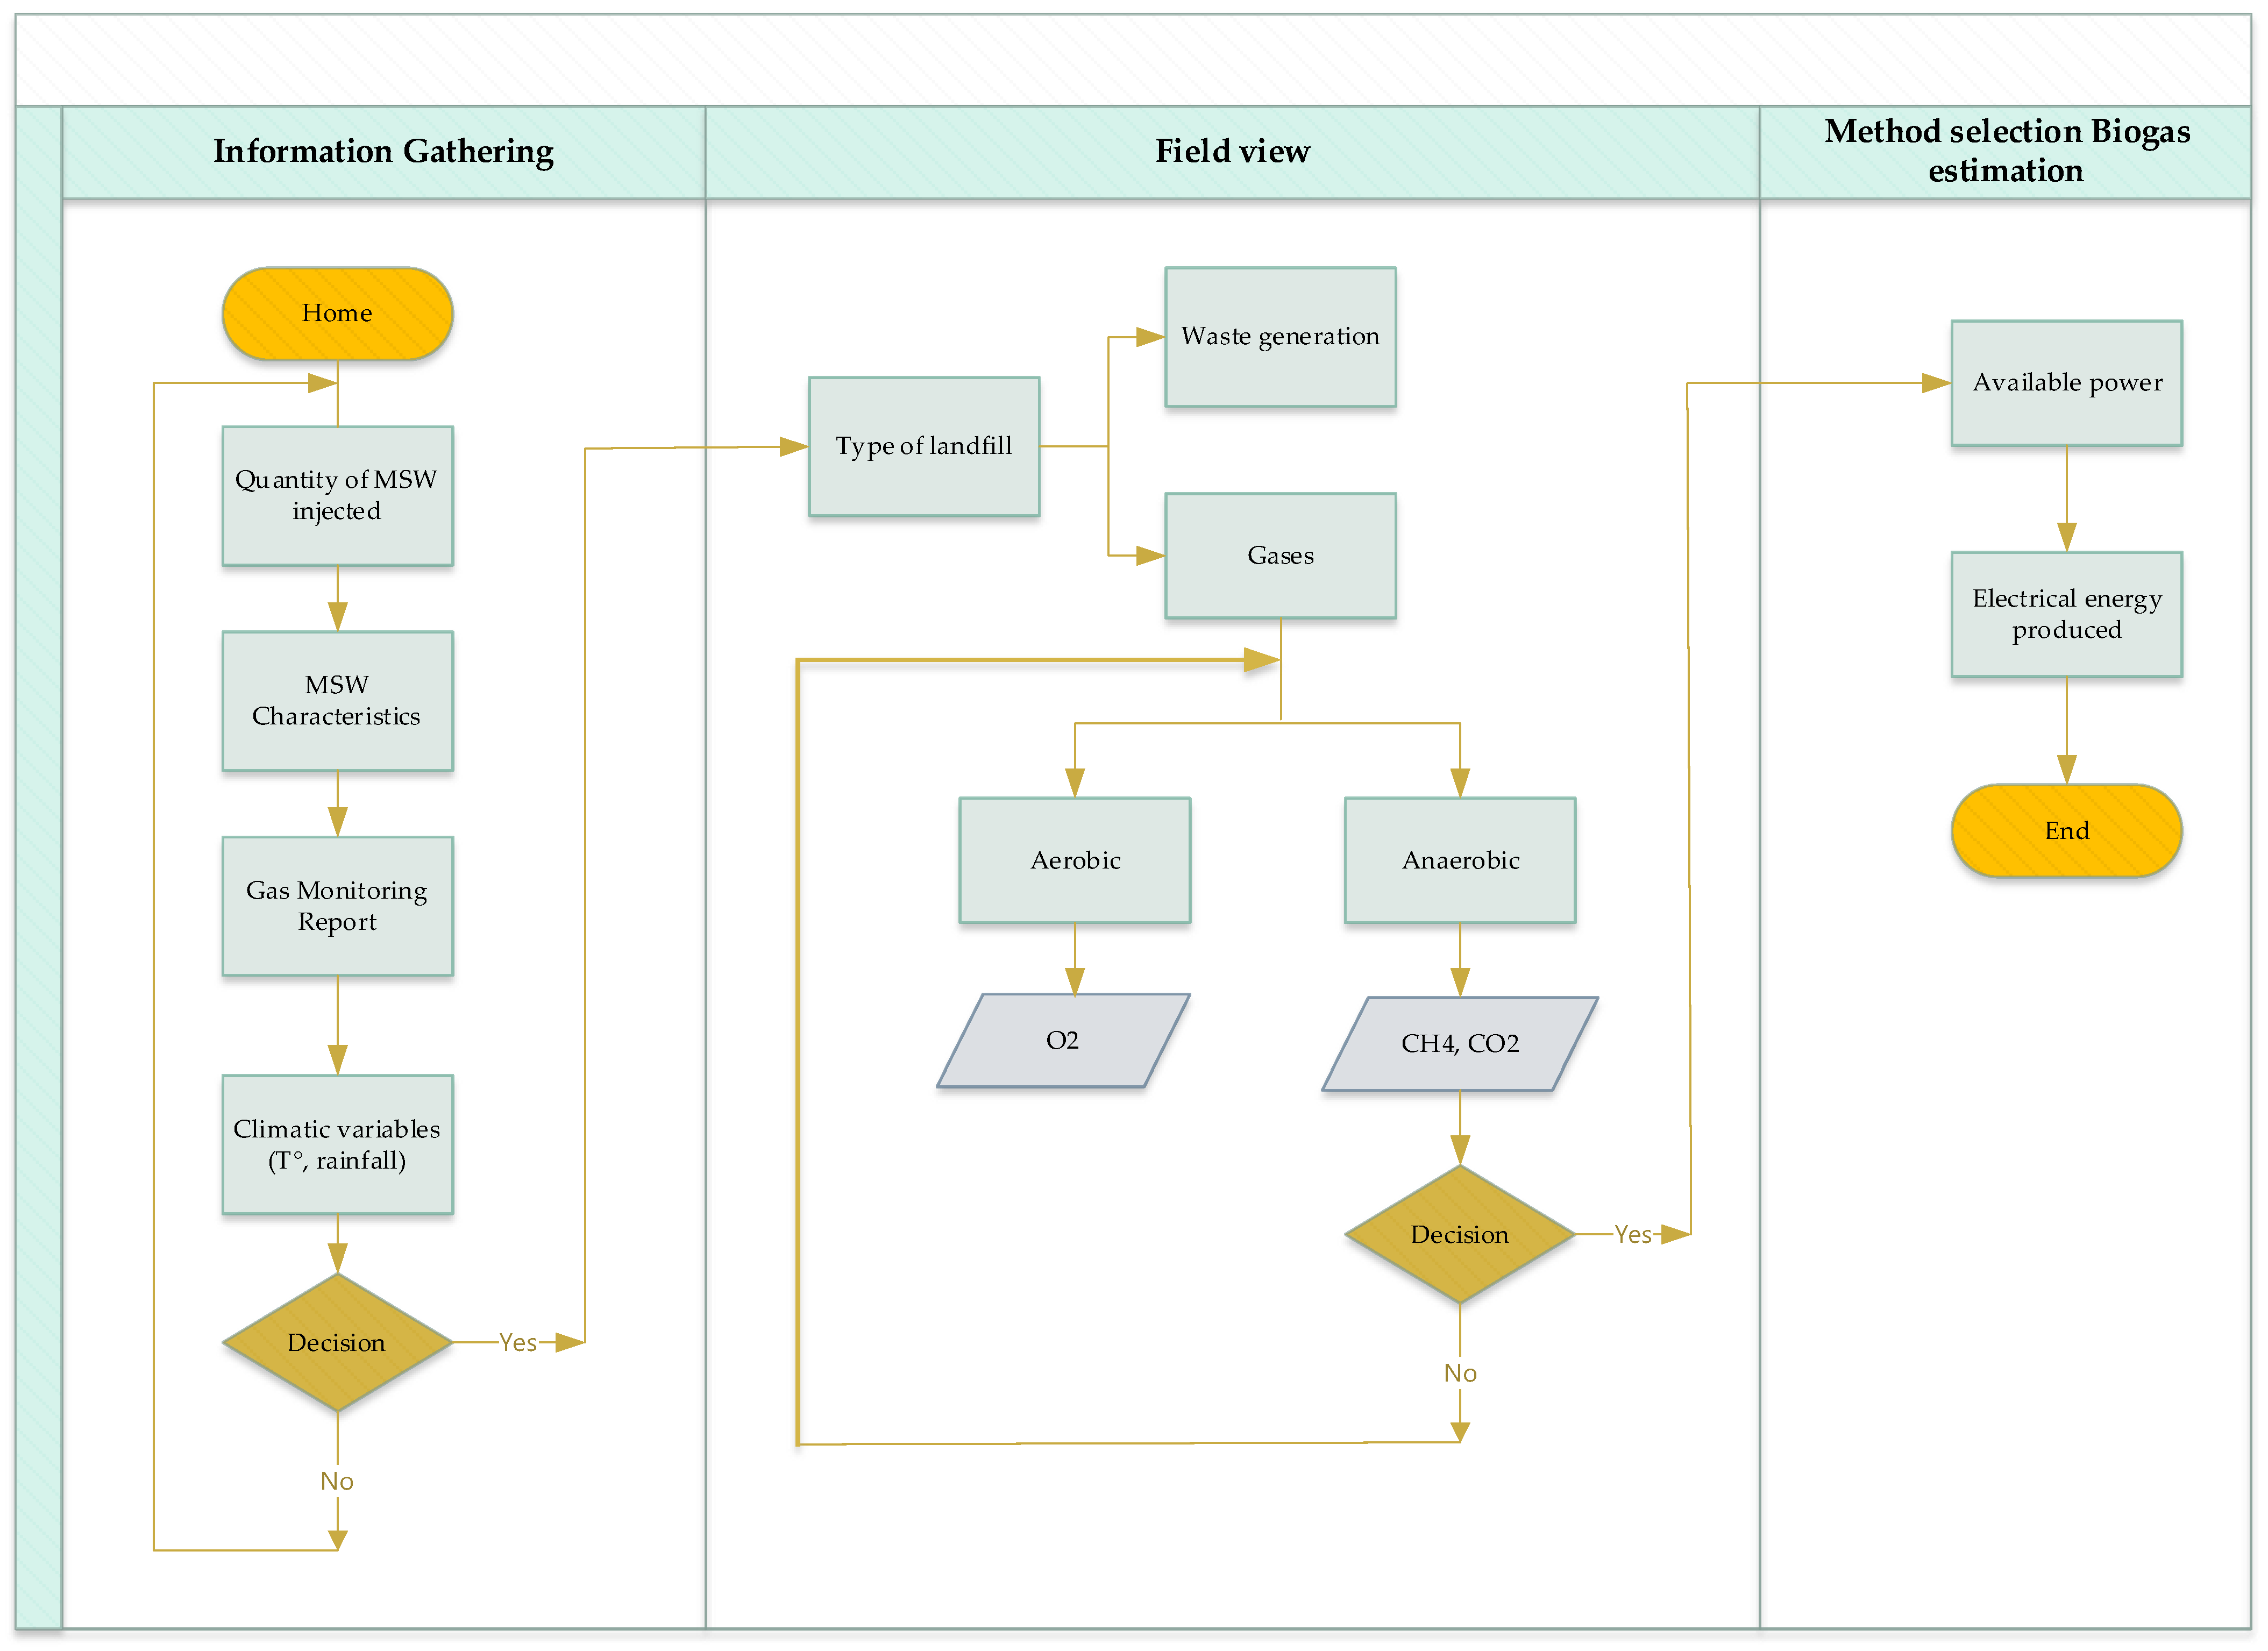
For the estimation of biogas from the Pichacay and Las Iguanas landfills, descriptive research was conducted consisting of a field visit to the landfills and the collection of information on the amount of MSW entering the landfills from 2004 to 2020, the projection of the amount of waste from 2021 to 2052. Moreover, 2052 will be the last year in which it is estimated that MSW will be deposited in the sanitary landfills, to obtain the percentage of CH4, CO2 and H2S as given by the gas analysis reports of EMAC EP and the ILM-LAS Consortium in 2020. Based on these considerations, the mathematical model, Landfill Gas Emission Model version 3.03 of the United States Environmental Protection Agency (EPA), was selected. Likewise, the model is limited to calculate the amount of gases up to 2144, where the concentration will depend on the amount of organic waste disposed of in the landfill and the climatic conditions [16,25,26,27]. Finally, the amount of electricity generated from the total biogas and the number of houses that would be supplied with the amount of electricity produced will be estimated, considering the use of cogeneration by means of internal combustion engines, as illustrated in Figure 2, which describes the methodology used to estimate biogas and electricity production [5,25,28].
2.3. LandGEM Biogas Model Version 3.03
The LandGEM biogas model version 3.0, is a Microsoft Excel application that uses a first-order equation to estimate the total volume of biogas, CH4, CO2 and other NMOC gases generated [18,29,30,31,32,33,34,35]. The equation used by the model is detailed below in Equation (1):
where:
- = annual methane generation in the year of calculation (m3/year).
- I = 1-year increments.
- n = (year of time calculation)—(initial year of waste acceptance).
- j = 0.1-year time increment.
- k = methane generation rate (1/year).
- L0 = potential methane generation capacity (m3/mg).
- Mi = mass of waste deposited in the year ith (mg/year).
- tij = age of the jth section of waste mass Mi accepted in the ith year (decimal years, e.g., 3.2 years).
Thus, the emission estimation model is based on the following parameters:
- Year of opening and closing of the landfill.
- Landfill operating capacity.
- CH4 generation rate (k).
- CH4 generation power (L0).
- Concentration of other gases (NMOC).
- Percentage of CH4.
- The amount of (MSW) (ton/year).
Hence, if the value of k is higher, the CH4 rate will increase and then decline with time. The value of k depends on four factors: moisture content of the waste mass, availability of nutrients for microorganisms, the pH, and the temperature (T°) of the waste mass. In Table 1 and Table 2, the indices for the k and L0 values are indicated. The model assumes that emissions from landfills are composed of 50% CH4 and 50% CO2 and other atmospheric pollutants. Therefore, if the CH4 content is outside the 40 to 60 percent range, the use of the LandGEM model is not recommended [29,30,31].
2.4. Estimation of the Electricity Production Potential
In order to calculate the power to produce electrical energy, the principle of cogeneration using internal combustion engines (ICM) was used, due to its low cost per kW/USD and high efficiency [15,20,32]. It has a biogas flow rate of approximately 300 to 1100 cfm, and it is calculated by the following equation [20,21,22,32,33]:
where:
- Edispo. = available electrical power.
- PCIbiogas = internal calorific value of biogas.
- Qb.r. = recoverable biogas flow (m3/year).
- = biogas energy efficiency, 38% of energy per m3 of biogas was considered, an assumed yield of 50%, which depends on the technical specifications of the ICM.
- = conversion factor from MJ to kWh (1 MJ = 0.28 kWh).
Conversion factor
- 1000 kcal = 1.163 kWh
- = 20 MJ = 4775 kcal/m3
- Kcal = 0.000001163 MWh
The lower calorific value of the biogas will be defined by the following equation:
where:
- % = concentration (56 and 58%).
- = internal calorific value of CH4 (internal calorific value 35.8 (MJ/m3), superior 39.8 (MJ/m3) or 35,846.071 [kJ/m3].
Therefore, to determine the number of homes that would be supplied with the amount of electricity obtained from biogas, average energy consumption of 143,730.00 (kWh/year) was considered, which is the annual consumption of an average family per month.
3. Results and Discussion
3.1. Amount of Municipal Solid Waste Disposed of in Sanitary Landfills
From 2004 to 2020, a total of 2,131,077.23 tons were disposed of in the Pichacay landfill, with a monthly average of 10,895.04 tons (MSW). This corresponded to 12.03% of waste from markets, 6.41% from industry, 80.75% of homes, 0.32% from sterilized biohazard, 0.09% from organic, and 0.39% from recycled. On the other hand, in the Las Iguanas landfill from 1994 to 2020, 28,714,041.14 tons of waste were disposed of, of which 92% was organic waste, and 8% inert waste.
3.2. Characterization of Municipal Solid Waste
The Pichacay sanitary landfill has performed the characterization of the MSW during the years 1985, 1990, 1995, 2001, 2007, 2012, 2015 and 2018, where the physical composition of the household solid waste was identified. The characterization was conducted by stratifying the population by electrical energy consumption that allowed to distinguish between the generation of solid waste per household per capita and per capita of urban solid waste at 0.47 (kg/inhab/day) [19,34,35]. Hence, in recent years the characteristics of the MSW of the Cuenca canton, presented 60.91% organic matter, amongst others, as detailed in Table 3.
Likewise, the ILM Consortium performed the characterization of the MSW of the Las Iguanas landfill in 2012, 2016 and 2017, which, depending on the economic conditions, established five groups with per capita production (PPC) of 0.87 (kg/inhab/day) conditions: economic low, medium-low 0.96 (kg inhab/day), medium 0.98 (kg/inhab/day), medium-high 1.27 (kg/inhab/day) and high 1.56 (kg/inhab/day) [9,36]. Therefore, the characterization conducted in 2017 indicates 67% organic matter, amongst others, as detailed in Table 4.
3.3. Production of Biogas Generated from the Sanitary Landfill
The main gases of biogas are CH4 and CO2, where CH4 presents the global warming potential (GWP) from 28 to 36 years for 100 years. It is a precursor of ozone, as CO2 emissions cause an increase in atmospheric CO2 concentration which lasts thousands of years [14,37,38]. There are also several sources of obtaining biogas such as animal, plant, human, agro-industrial, forestry, aquatic crops and wastewater sources that can be used by reducing the factor 21 of CH4, one of the most potential gases responsible for the warming by greenhouse gases. Hence, the importance of taking advantage of these gases in the production of electrical energy is demonstrated in the studies performed at the global and national level as detailed in Table 5 [9,39,40,41].
Therefore, to minimize the impacts related to global warming and climate change, the biogas generated in landfills may be used as an energy source to produce electricity [22,32,33]. Therefore, regarding the biogas produced from the decomposition of MSW, it is fundamental to calculate the amount and concentration of biogas, through the application of the LandGEM Landfill Gas Emission model version 3.03, in order to estimate the volume and the concentration of biogas generated in the Pichacay and Las Iguanas sanitary landfill over a period of 32 years. This generates information that will allow for calculating the production of electrical energy considering its available power and to publicize the importance of reducing GHG, using biogas as a raw material in the production of electrical energy.
3.4. Estimation of the Biogas Produced LandGEM Version 3.03
In order to estimate the amount of biogas produced in the Pichacay and Las Iguanas landfills, the LandGEM landfill gas model version 3.03 was used, where the starting year 2004 and the closure year 2052 were considered, with a methane generation index k = 0. 05 (1/year), potential methane generation L0 = 170 (m3/Mg), and other NMOC gases with a concentration of 600 ppm. We considered a CH4 concentration of 56% for the Pichacay landfill and 58% for the Las Iguanas landfill. Likewise, to enter the amount of MSW in the model, a projection of the amount of MSW generated from 2021 to 2052 was performed, where for the Pichacay landfill, we considered the urban PPC of 0.47 (kg/inhab/day), a projected population of Cuenca of 997,373 inhabitants and an average annual generation of MSW of 12,925. 337 (tons/year). On the other hand, for the Las Iguanas sanitary landfill, the PPC was considered to be 1.56 (kg/inhab/day), a population of Guayaquil of approximately 3,231,735 inhabitants, and an average annual MSW generation of 129,784.217 (tons/year).
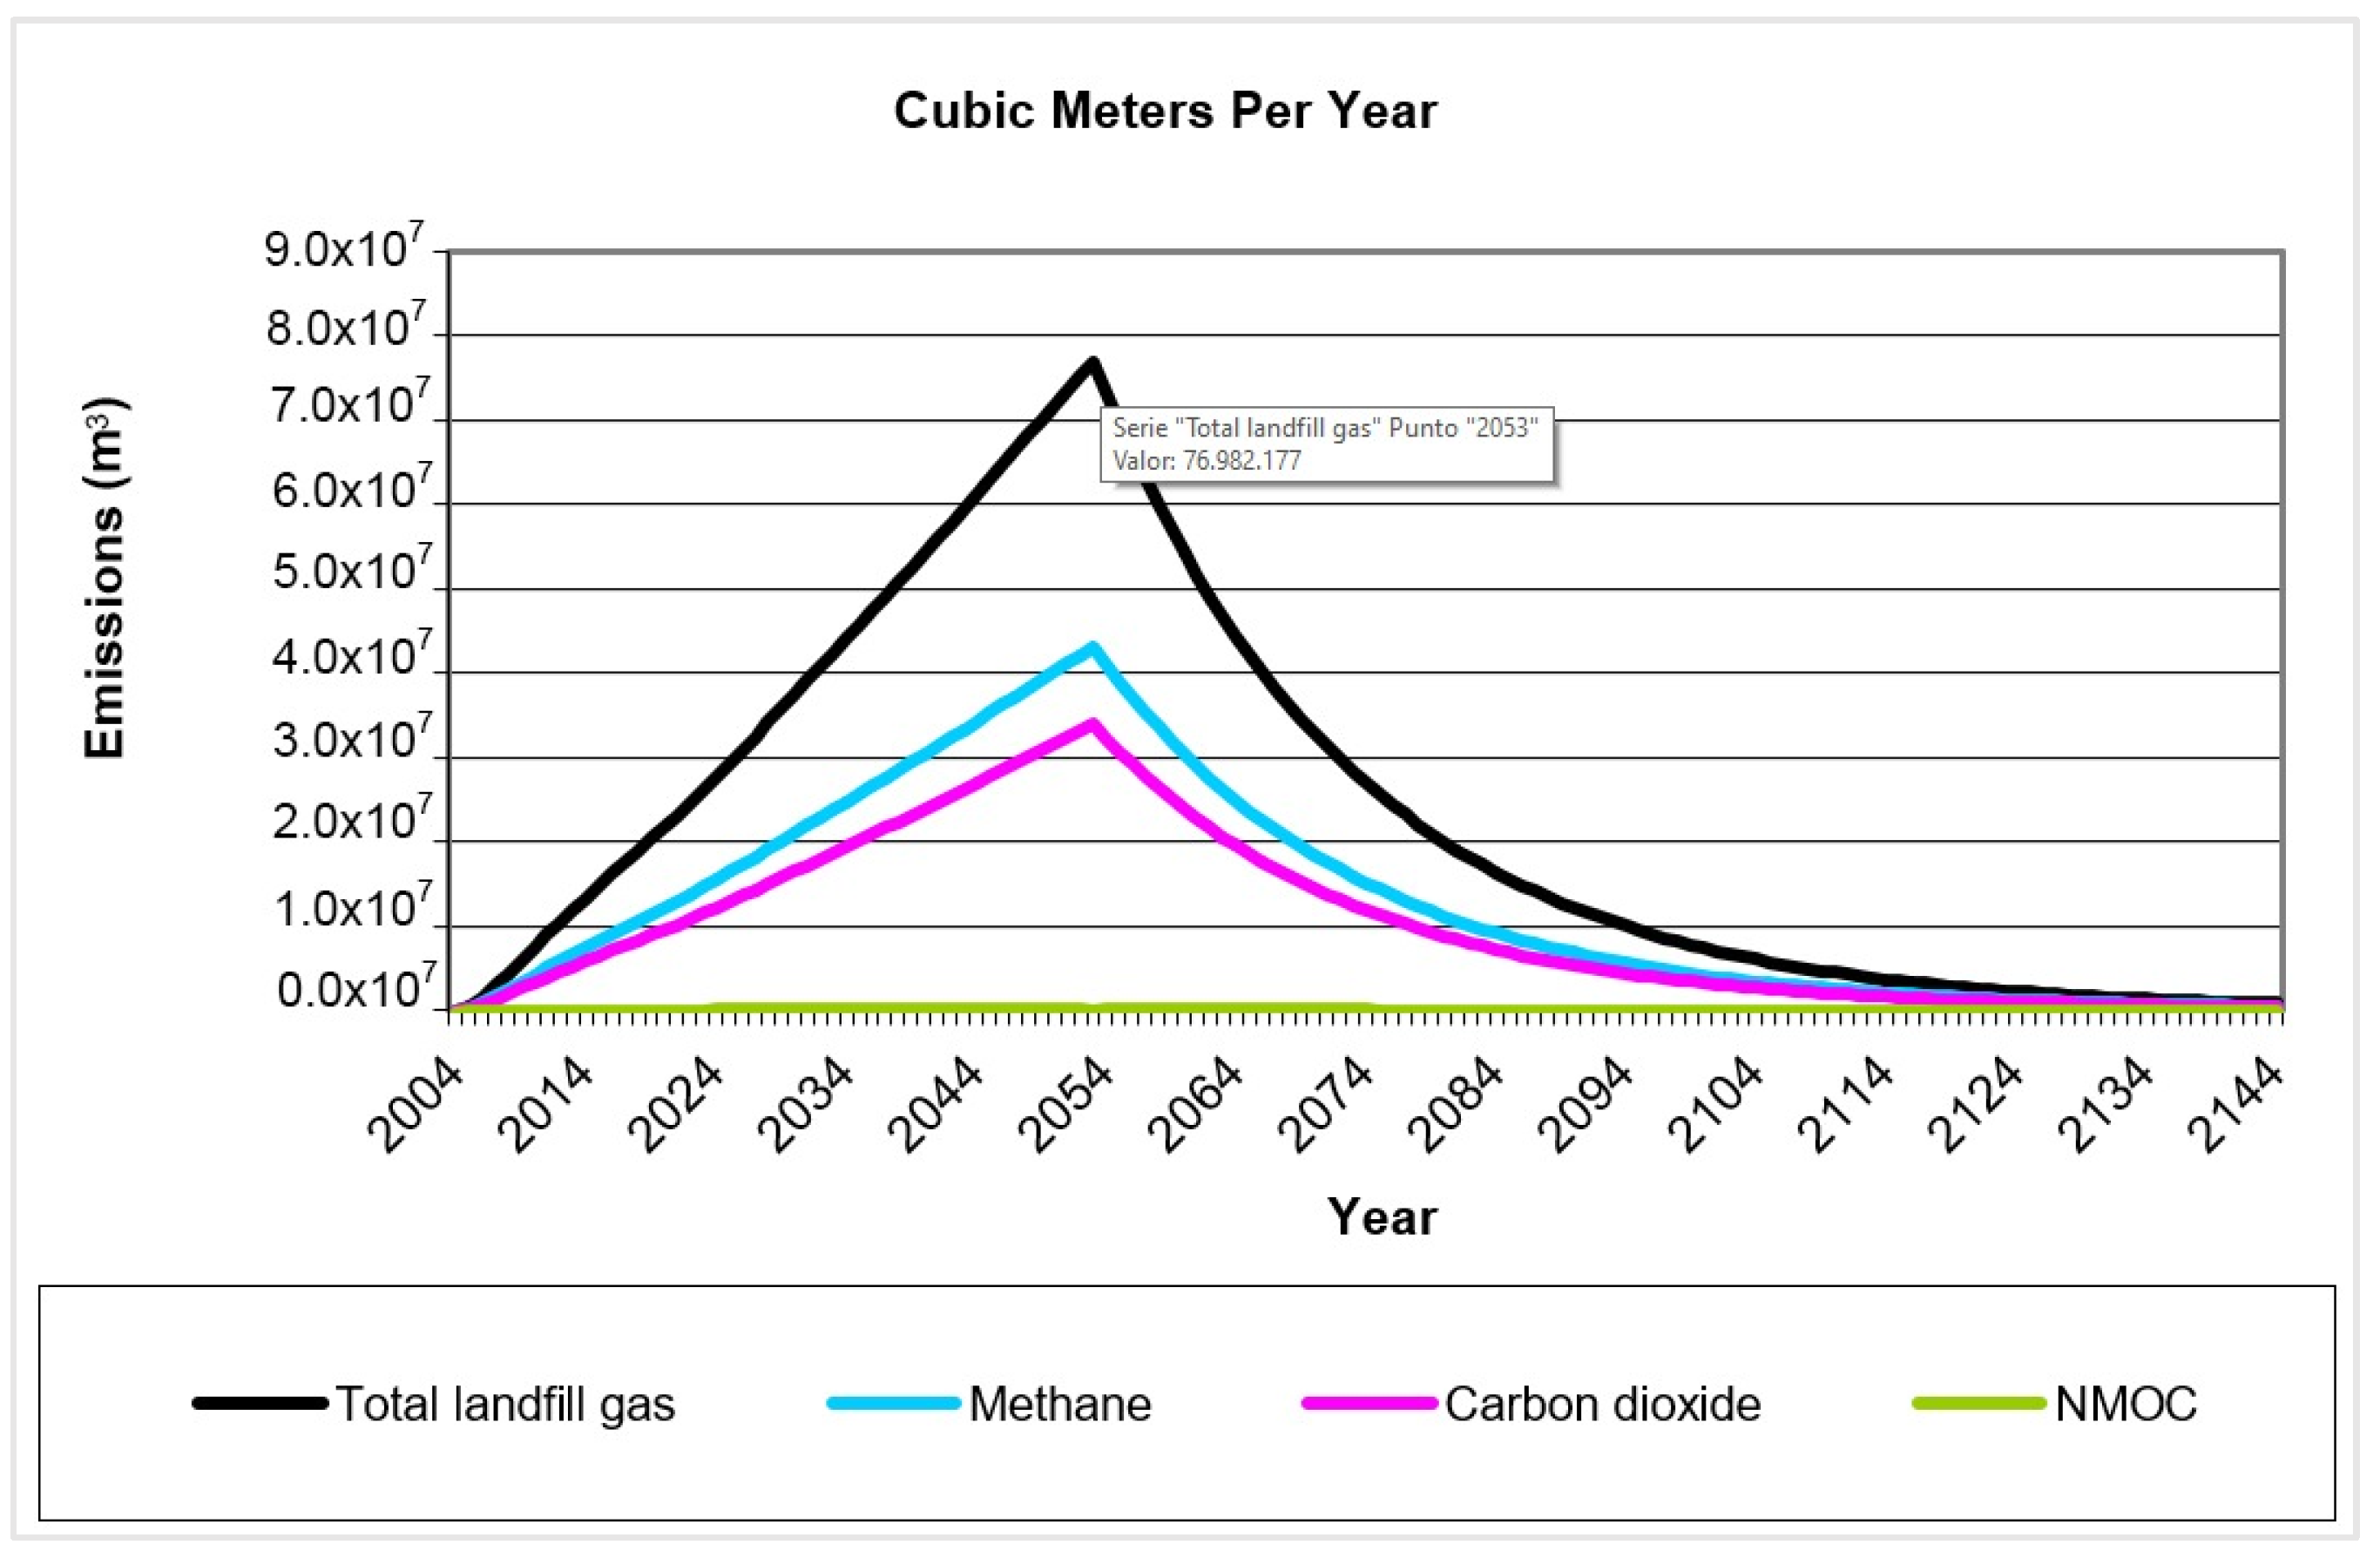
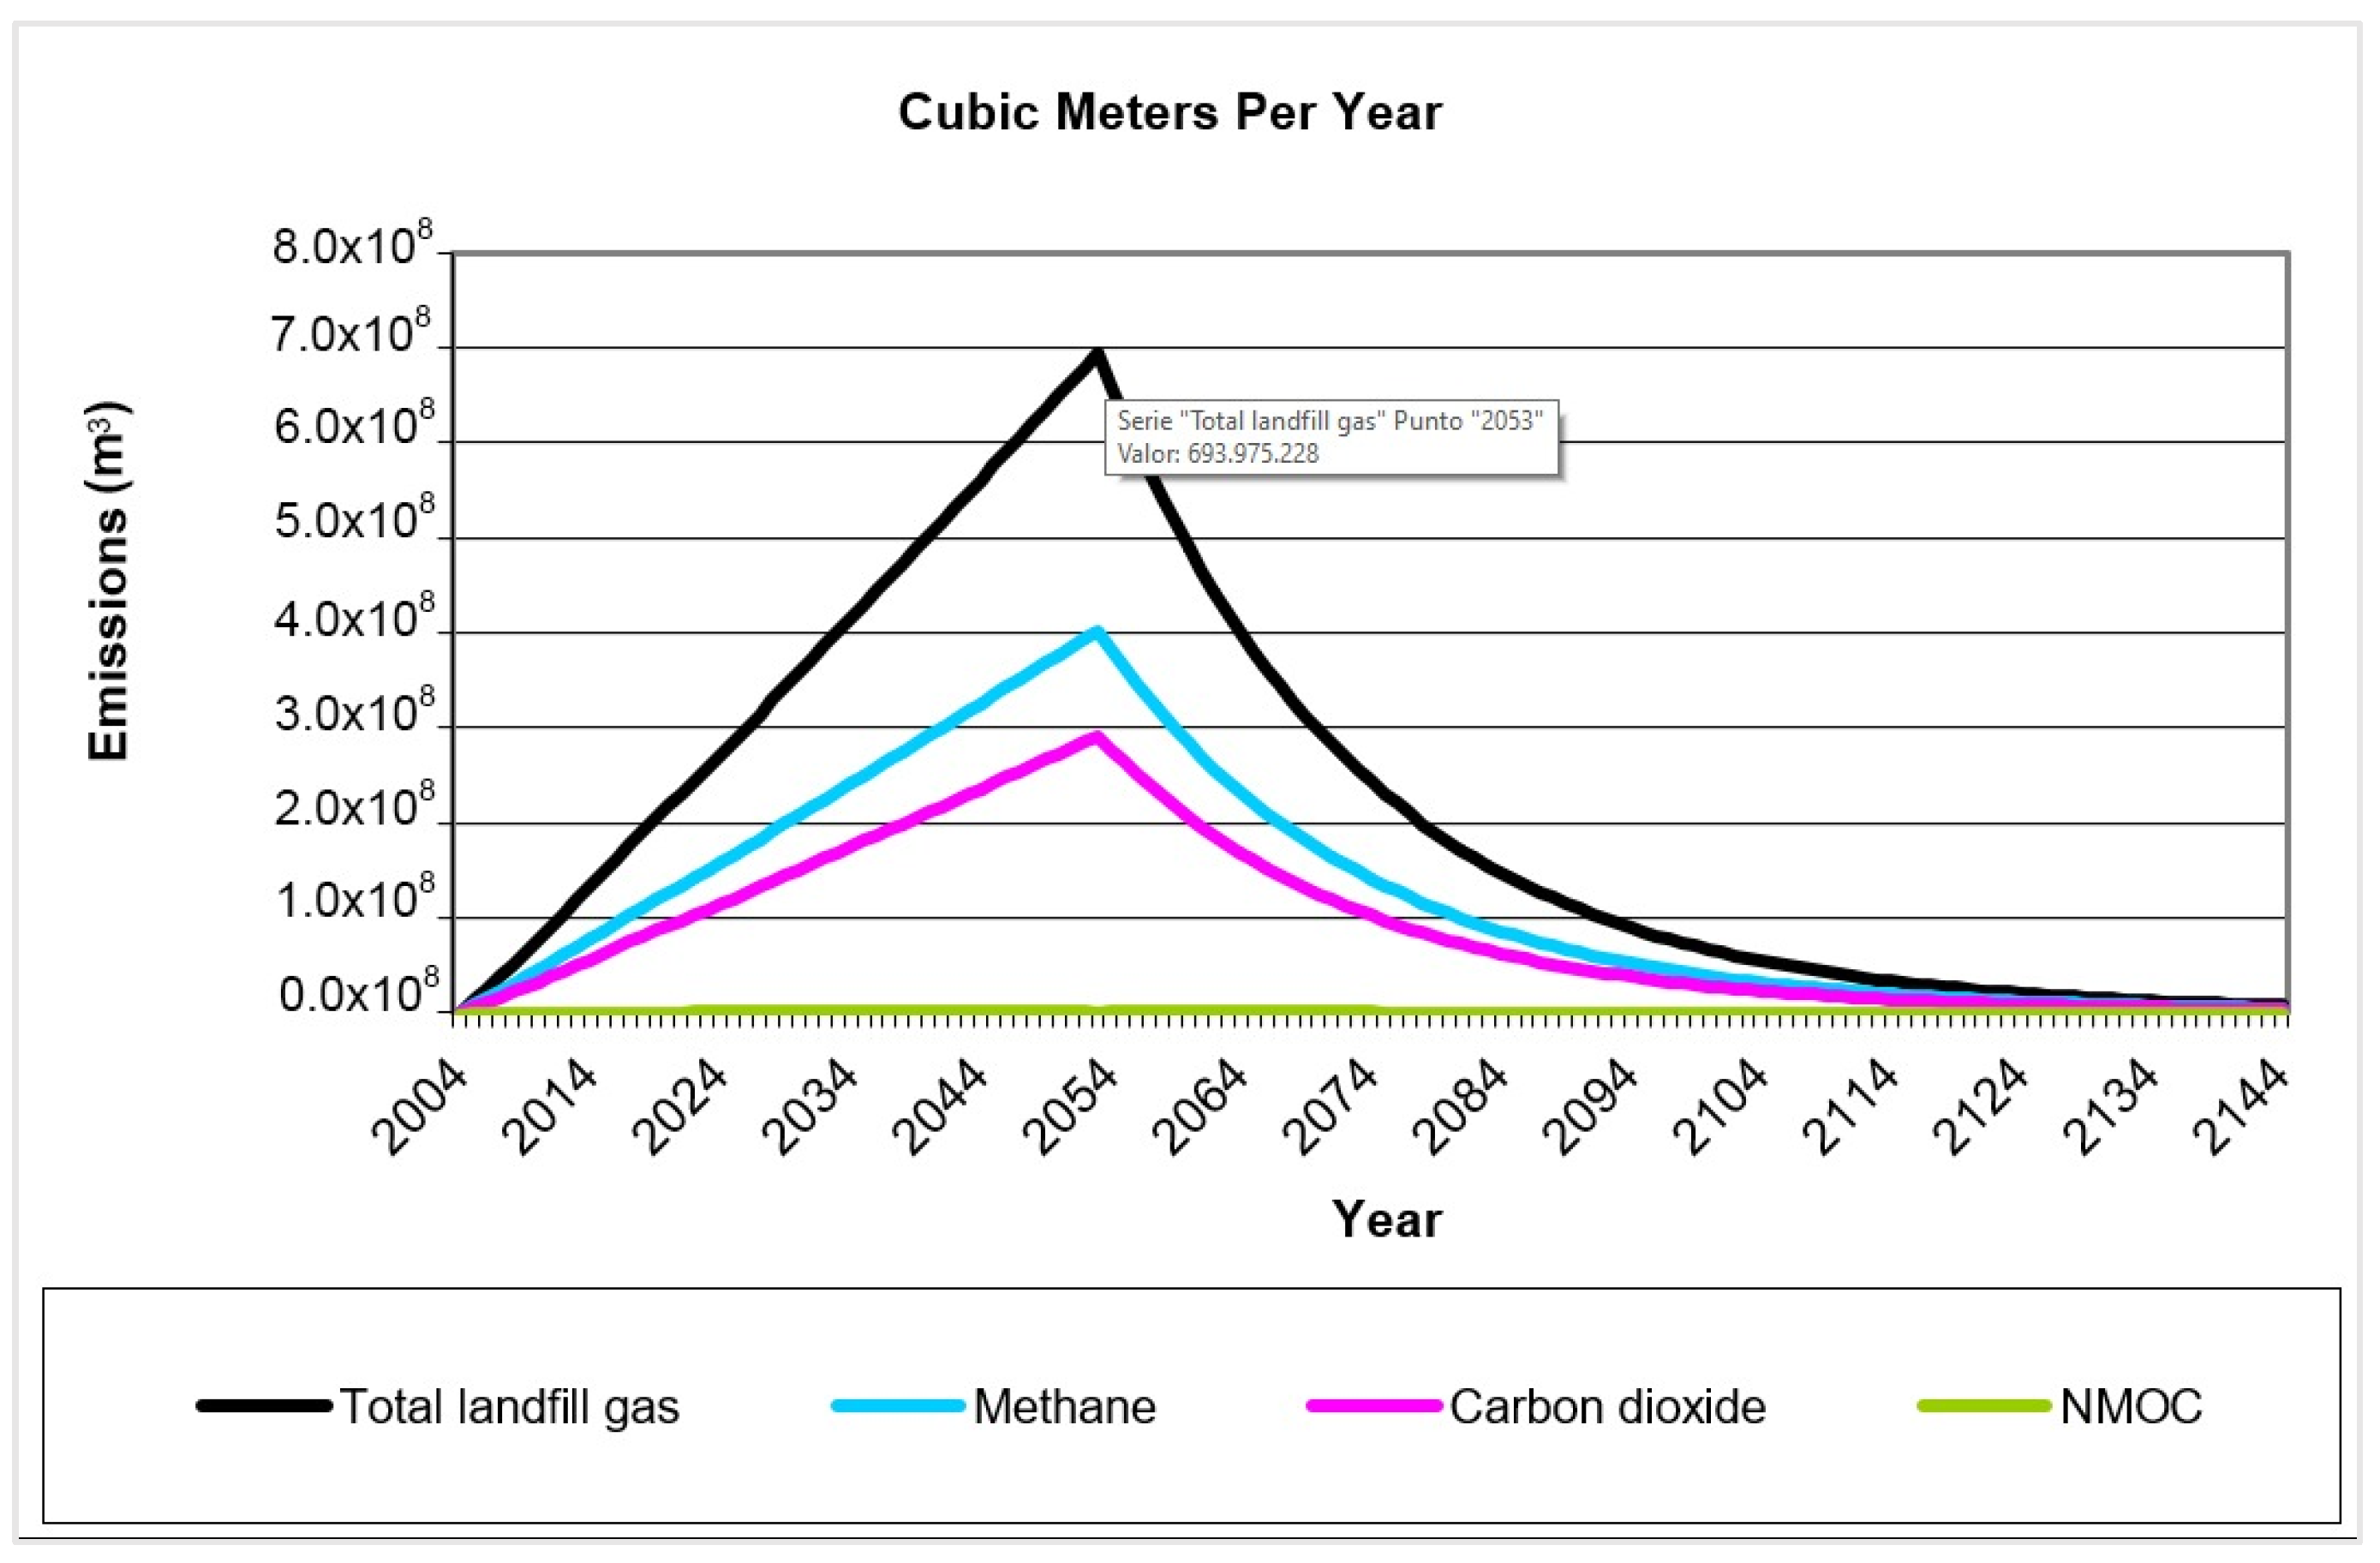
Based on the considerations and estimation of MSW, it was possible to calculate the total volume of biogas, CH4, CO2, and NMOC in (m3/year), hence, in the Pichacay landfill, it is estimated that the total biogas will reach its highest point one year after closure, that is, in 2053 with 76,982.177 (m3/year). Afterward, it will decrease exponentially as the amount of organic matter consumed decreases until 2144, which will generate 813.48 (m3/year) of biogas. In the case of CH4, the highest volume will be two years after decommissioning, that is, in 2054 when it will generate 41,007,519 (m3/year). The highest volume of CO2 will be in 2054 with 32,220.193 (m3/year) and the highest value of NMOC will be in 2053 with 46,189.306 (m3/year), as illustrated in Figure 3 [2,4,19,22]. In the same way, the total amount of biogas estimated for the Las Iguanas landfill will reach the highest point in 2053 with 693,975.228 (m3/year), one year after the closure of the landfill. Later it will decrease exponentially as the amount of organic matter consumed decreases until 2144 which will generate 416,385 (m3/year). In 2053, the highest value of CH4 will be with 402,505,632 (m3/year), CO2 with 291,469,596 (m3/year) and NMOC with 416,385 (m3/year), as demonstrated in Figure 4.
3.5. Estimated Electricity Production from Biogas
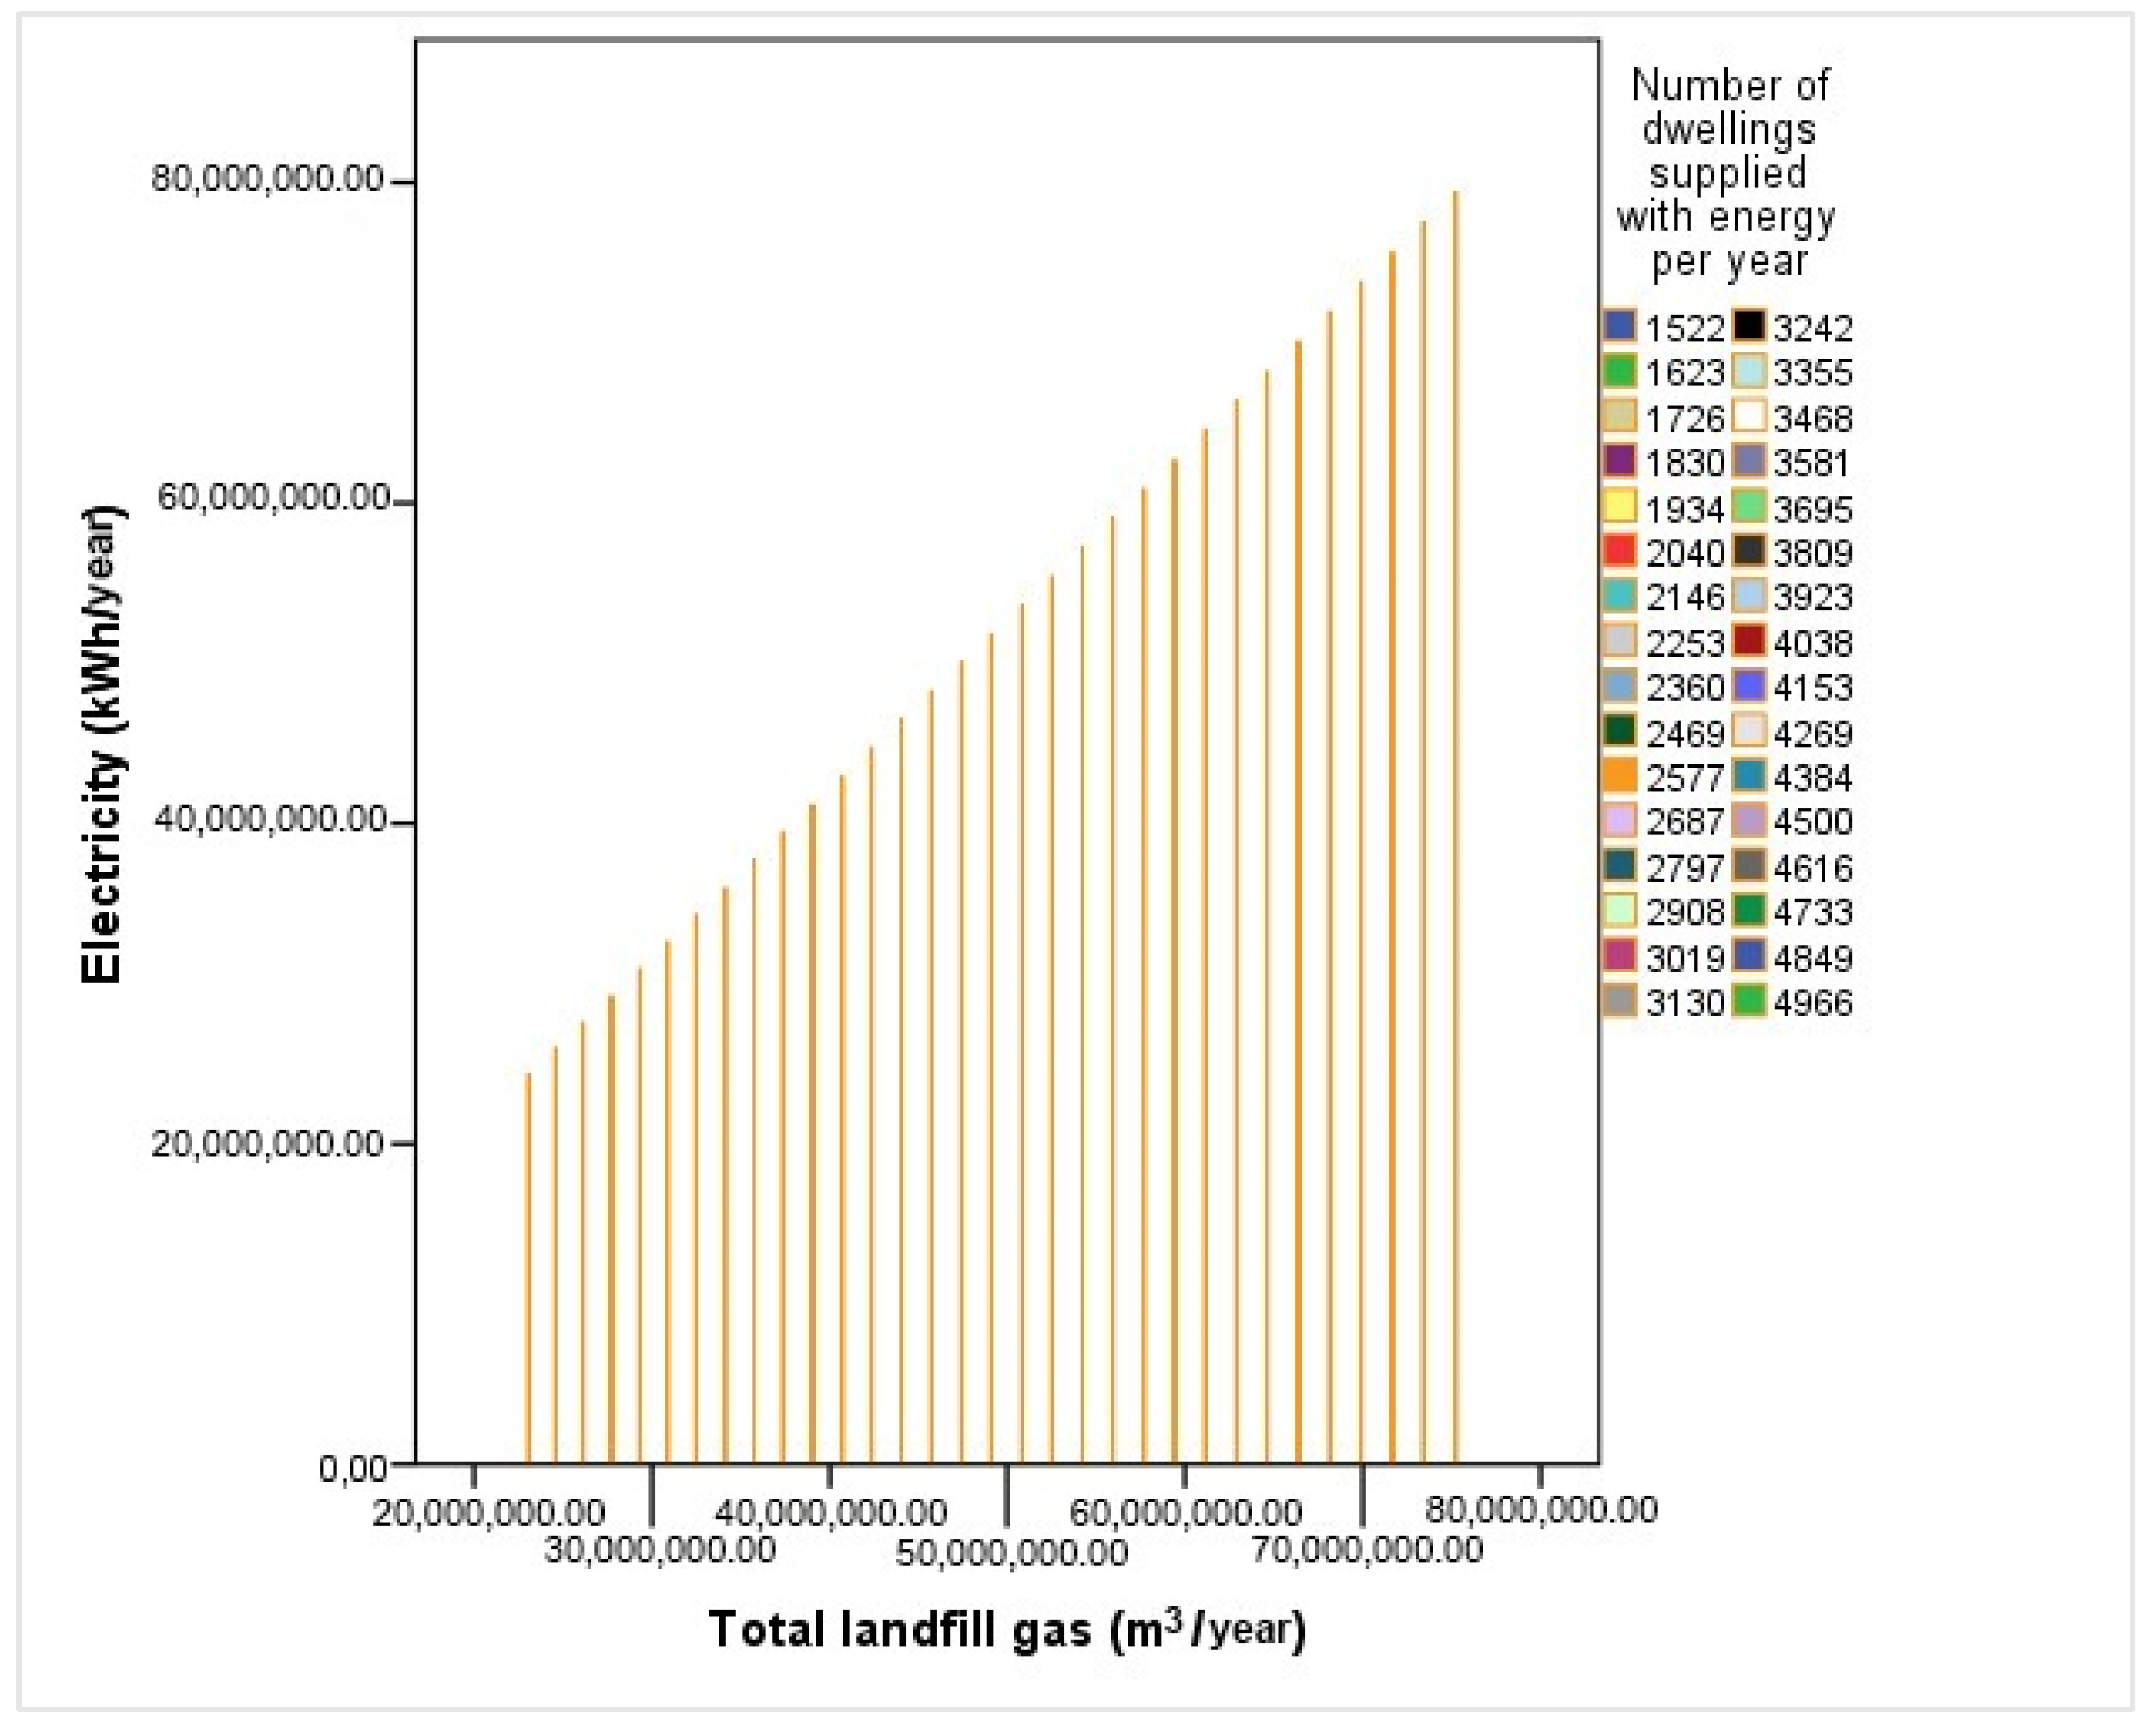
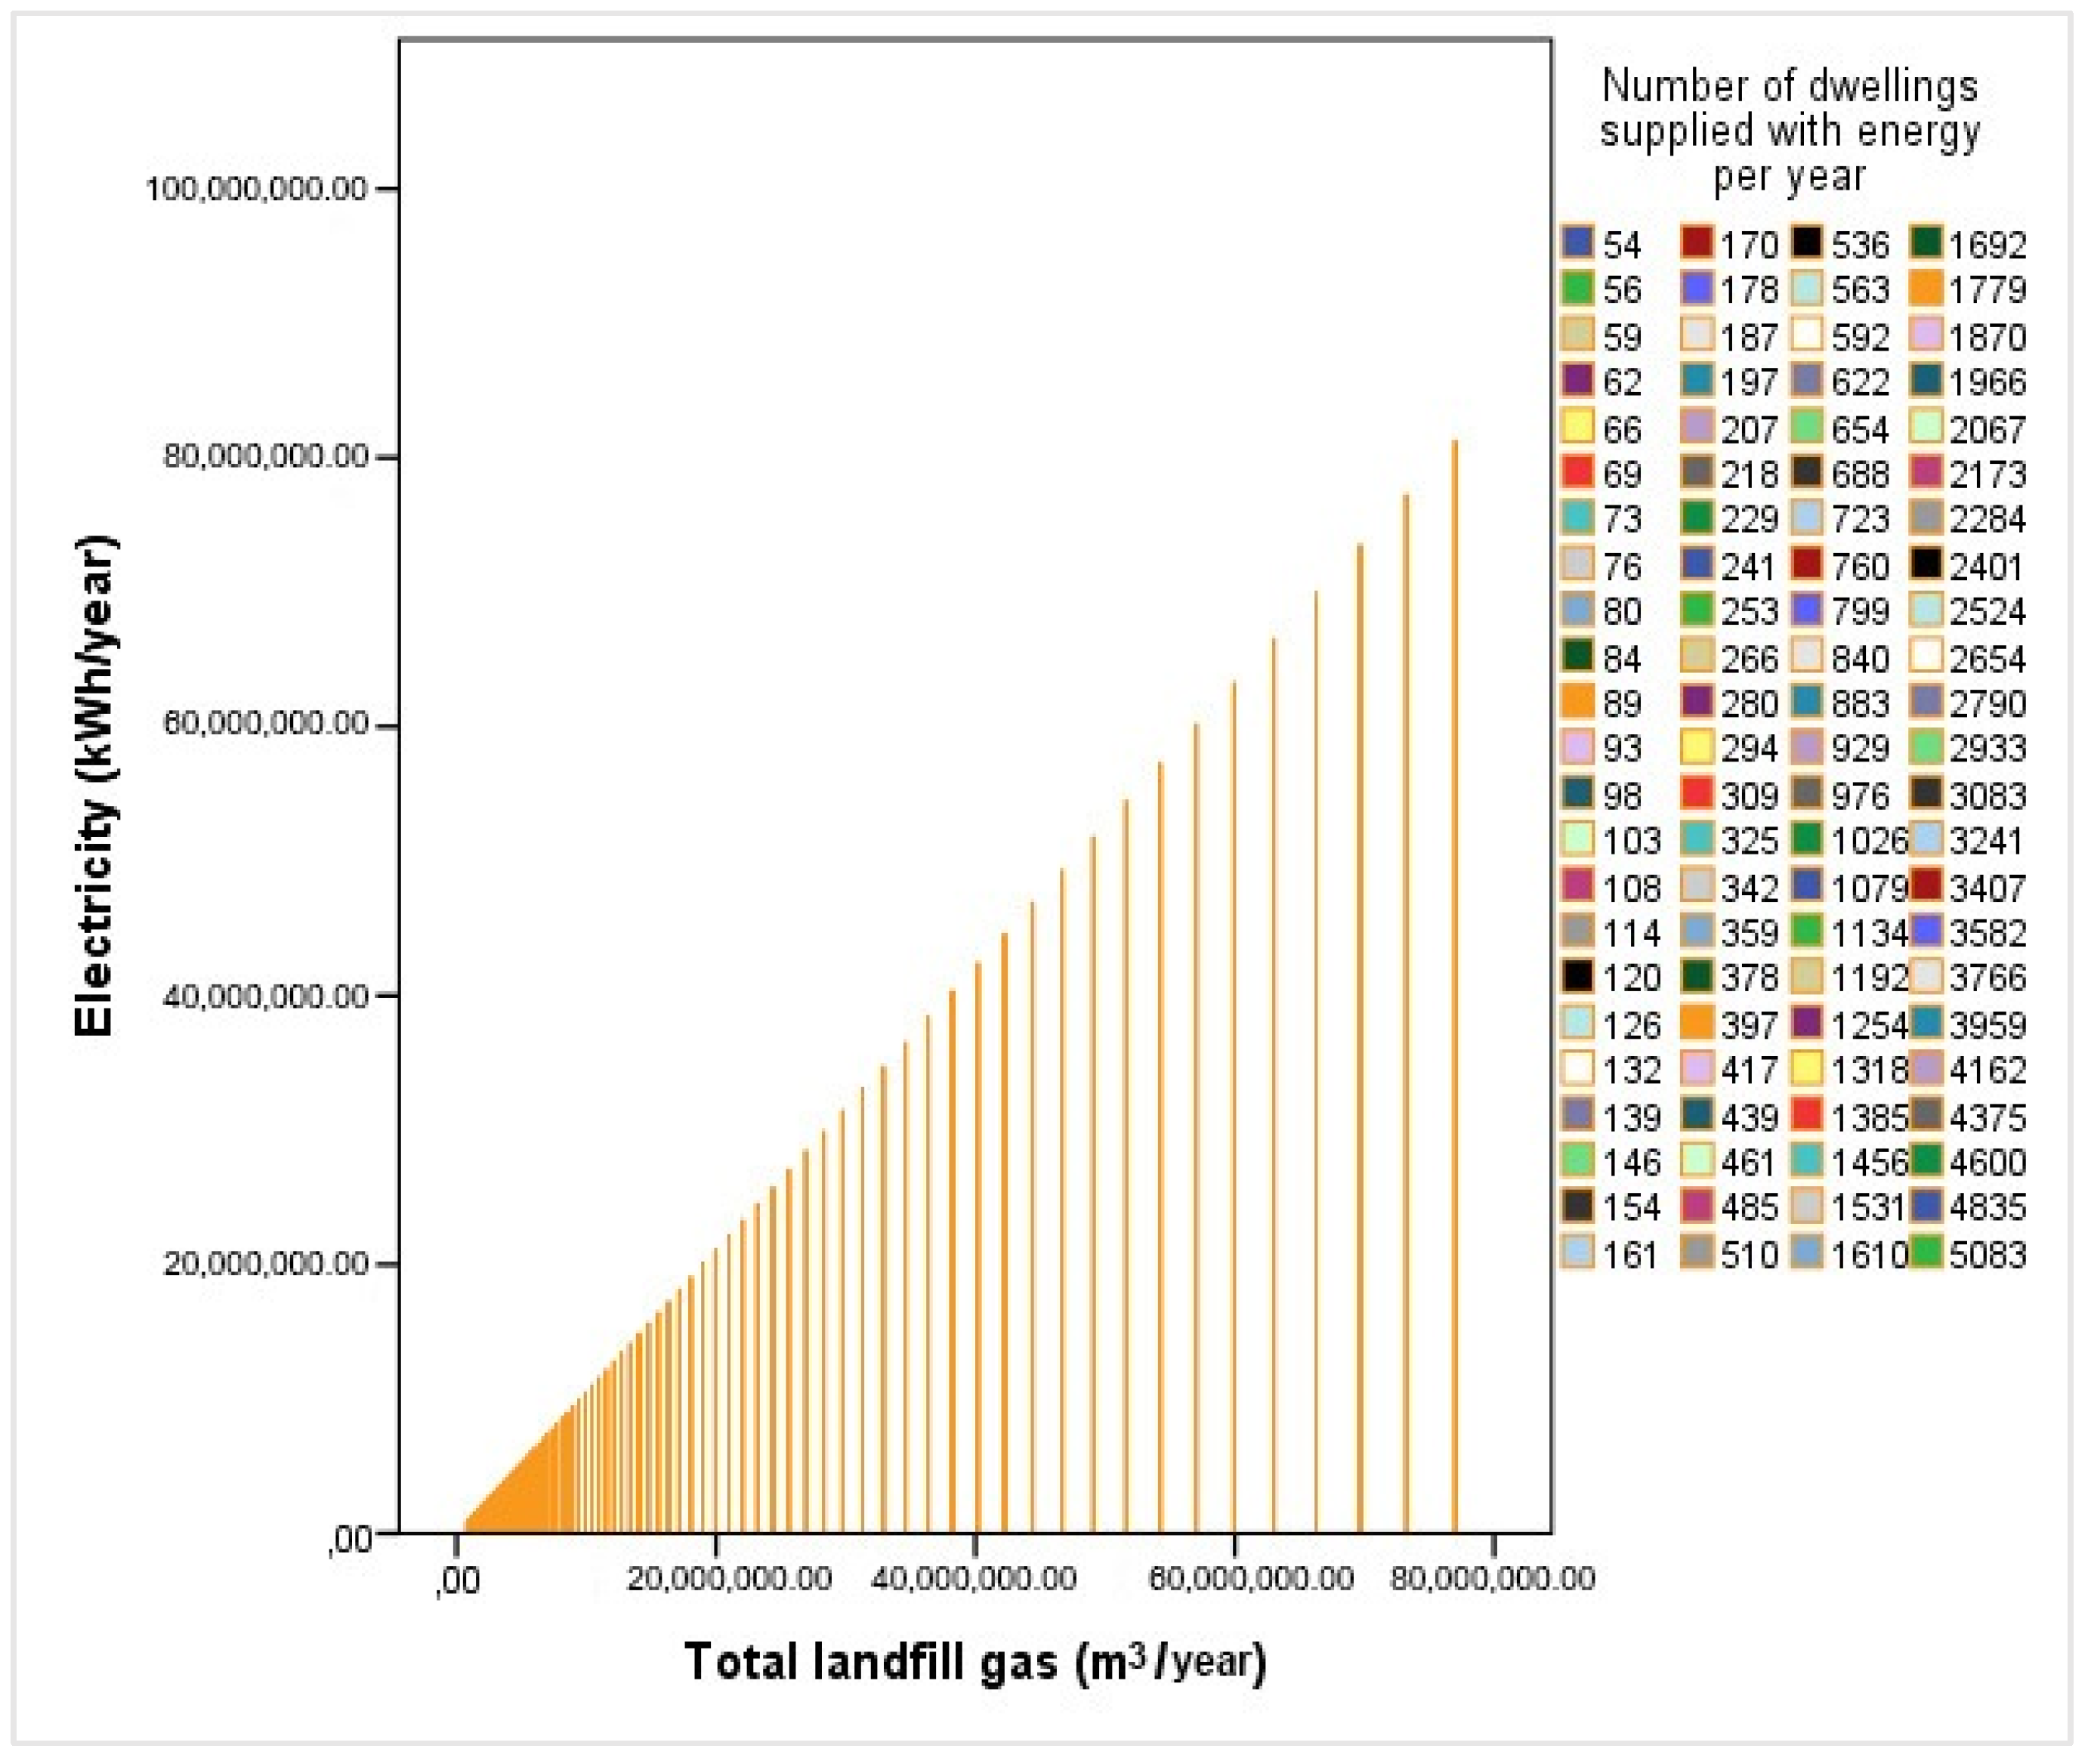
In order to determine the amount of electricity generated from the total biogas in (m3/year) and the number of homes that would be supplied with the amount of electricity produced, the years 2021 to 2144 were considered. The year 2144 is the estimated year where the landfill would cease to produce biogas, as calculated by applying Equations (2) and (3). The aforementioned conversion factors were applied, given that it is estimated that the Pichacay and Las Iguanas landfills will close in 2052. For explanatory purposes, it was categorized into two groups of analyses where the first group covered the period 2021 to 2052, and the second from 2053 to 2144. Thus, in the first group, the electricity available from the biogas generated in the Pichacay landfill in 2021 will reach 24,313,579.99 (kWh/year) that would supply 1522 homes as demonstrated in Figure 5. The second group corresponds to the period from 2053 to 2144. The largest energy production with 81,226,339.36 (kWh/year) will be in 2053, which would supply 5083 homes within the area of influence (Figure 6).
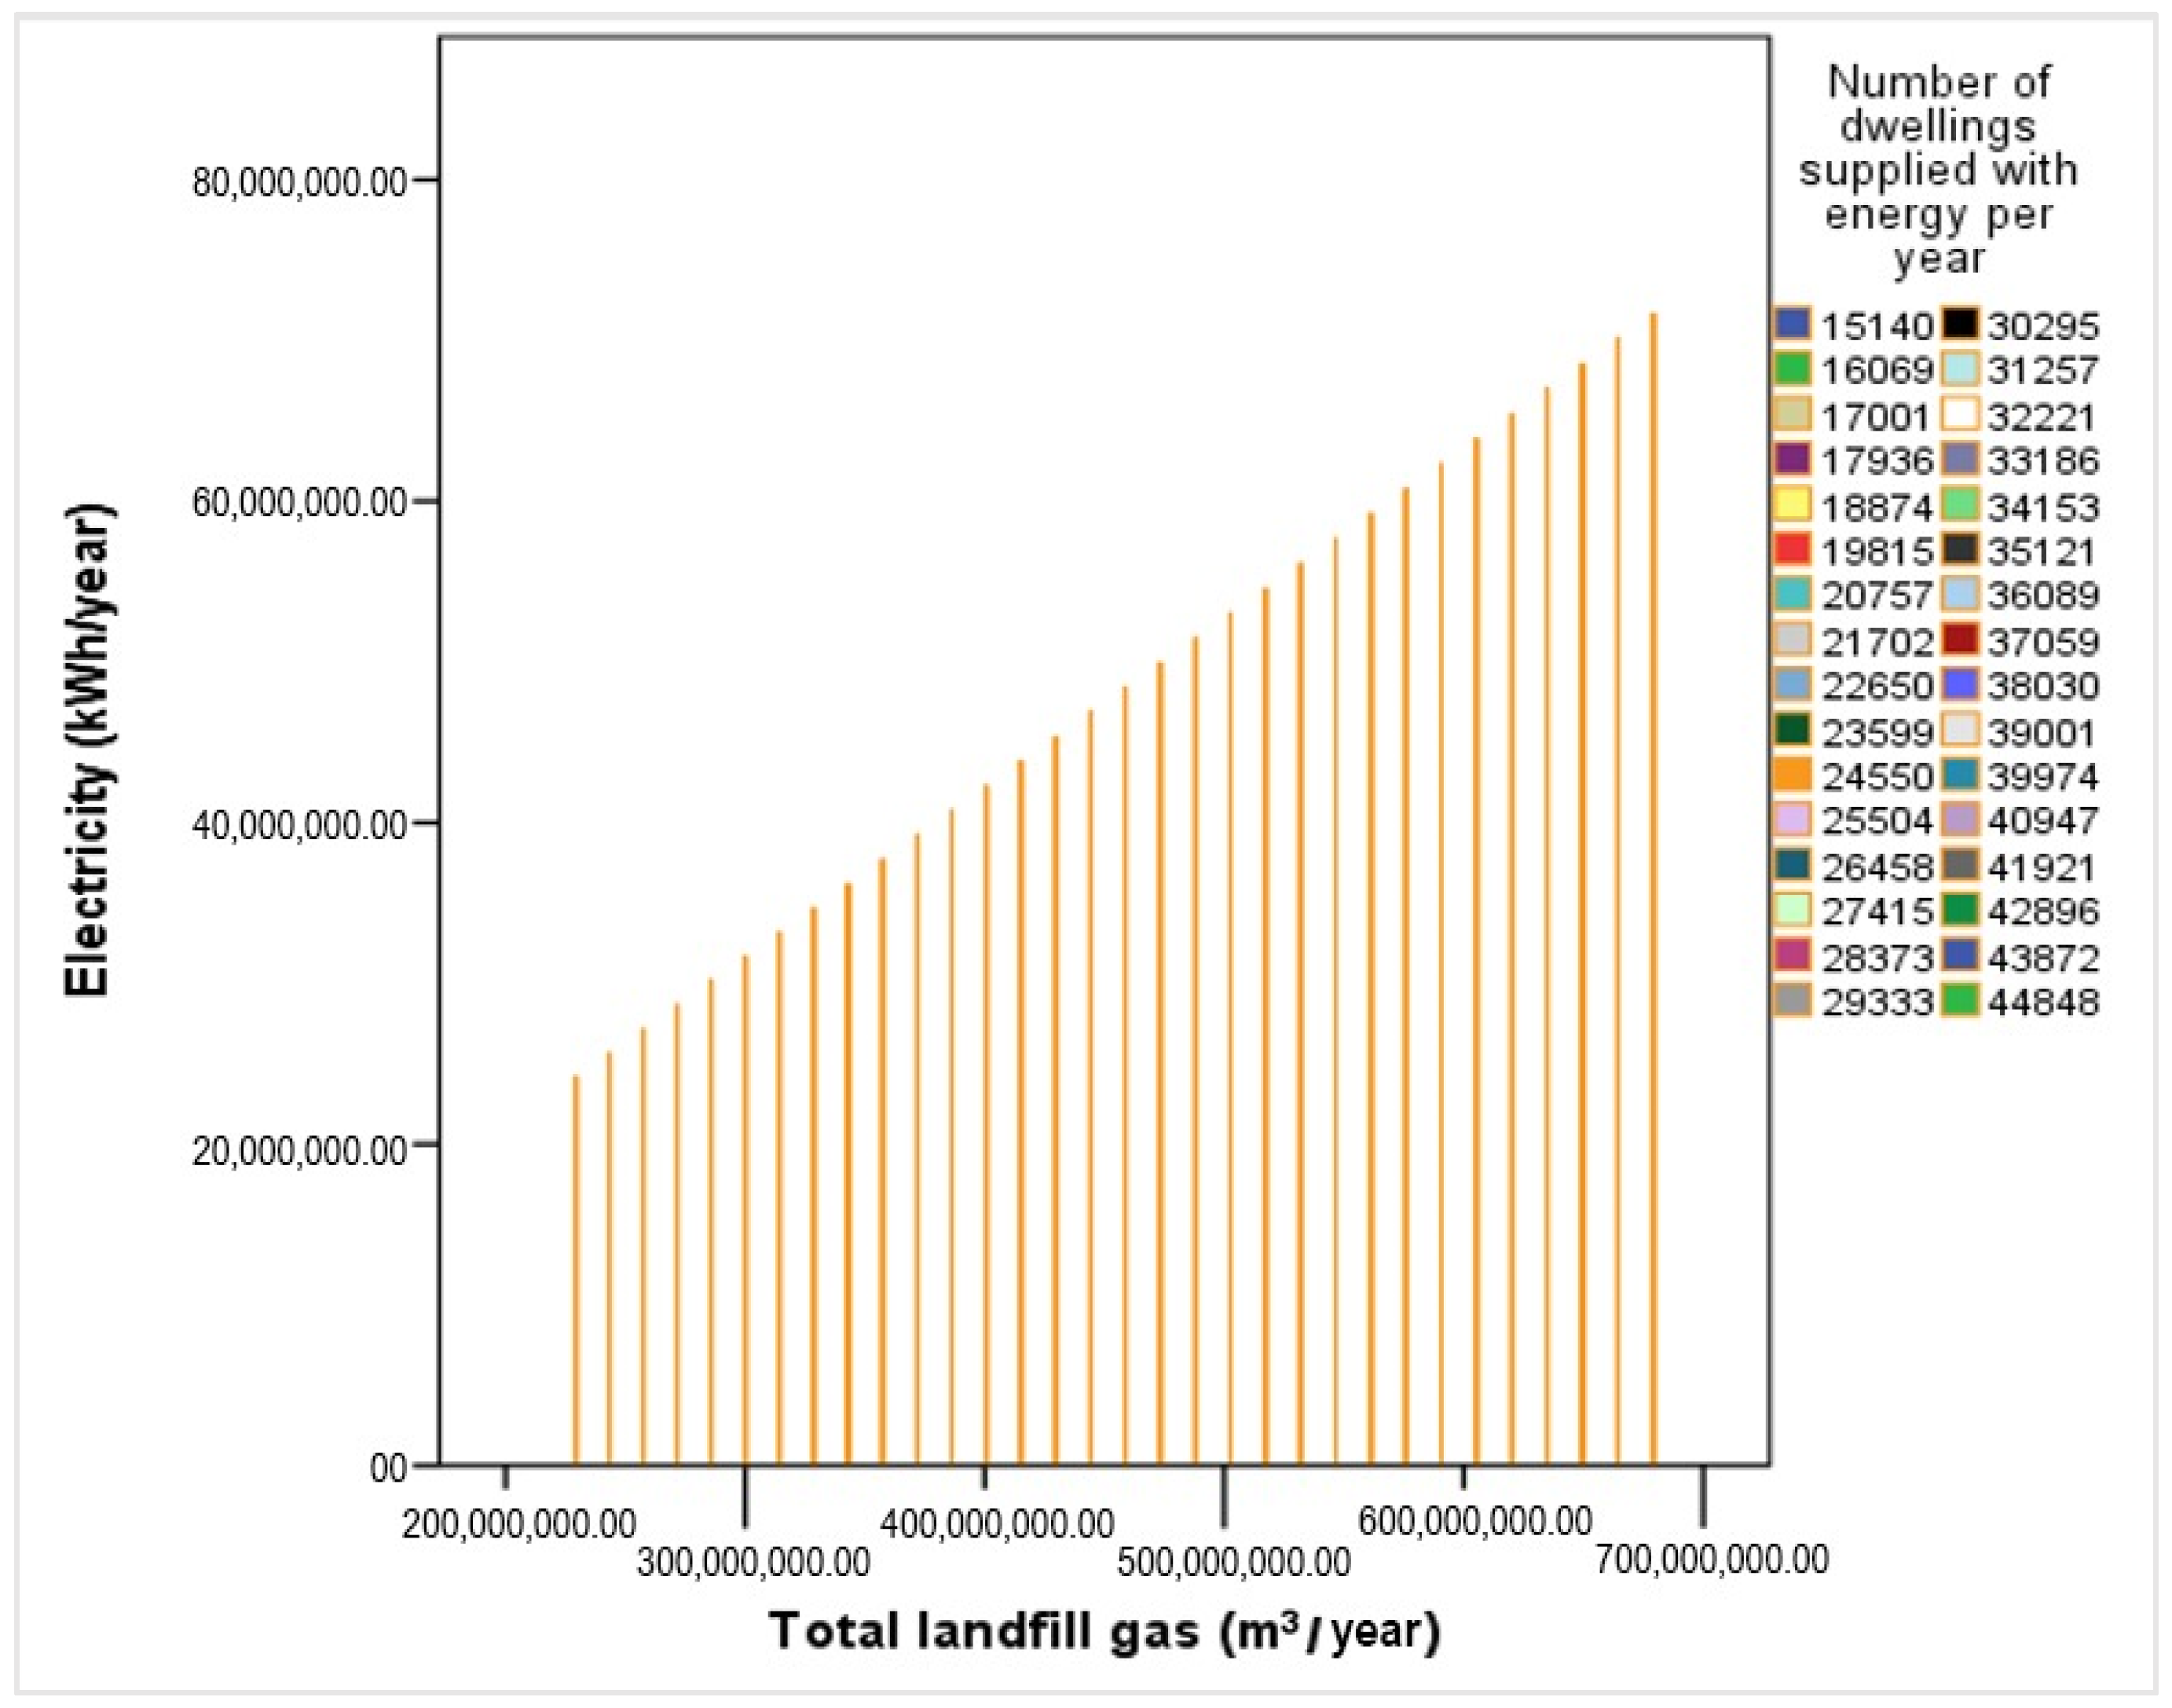
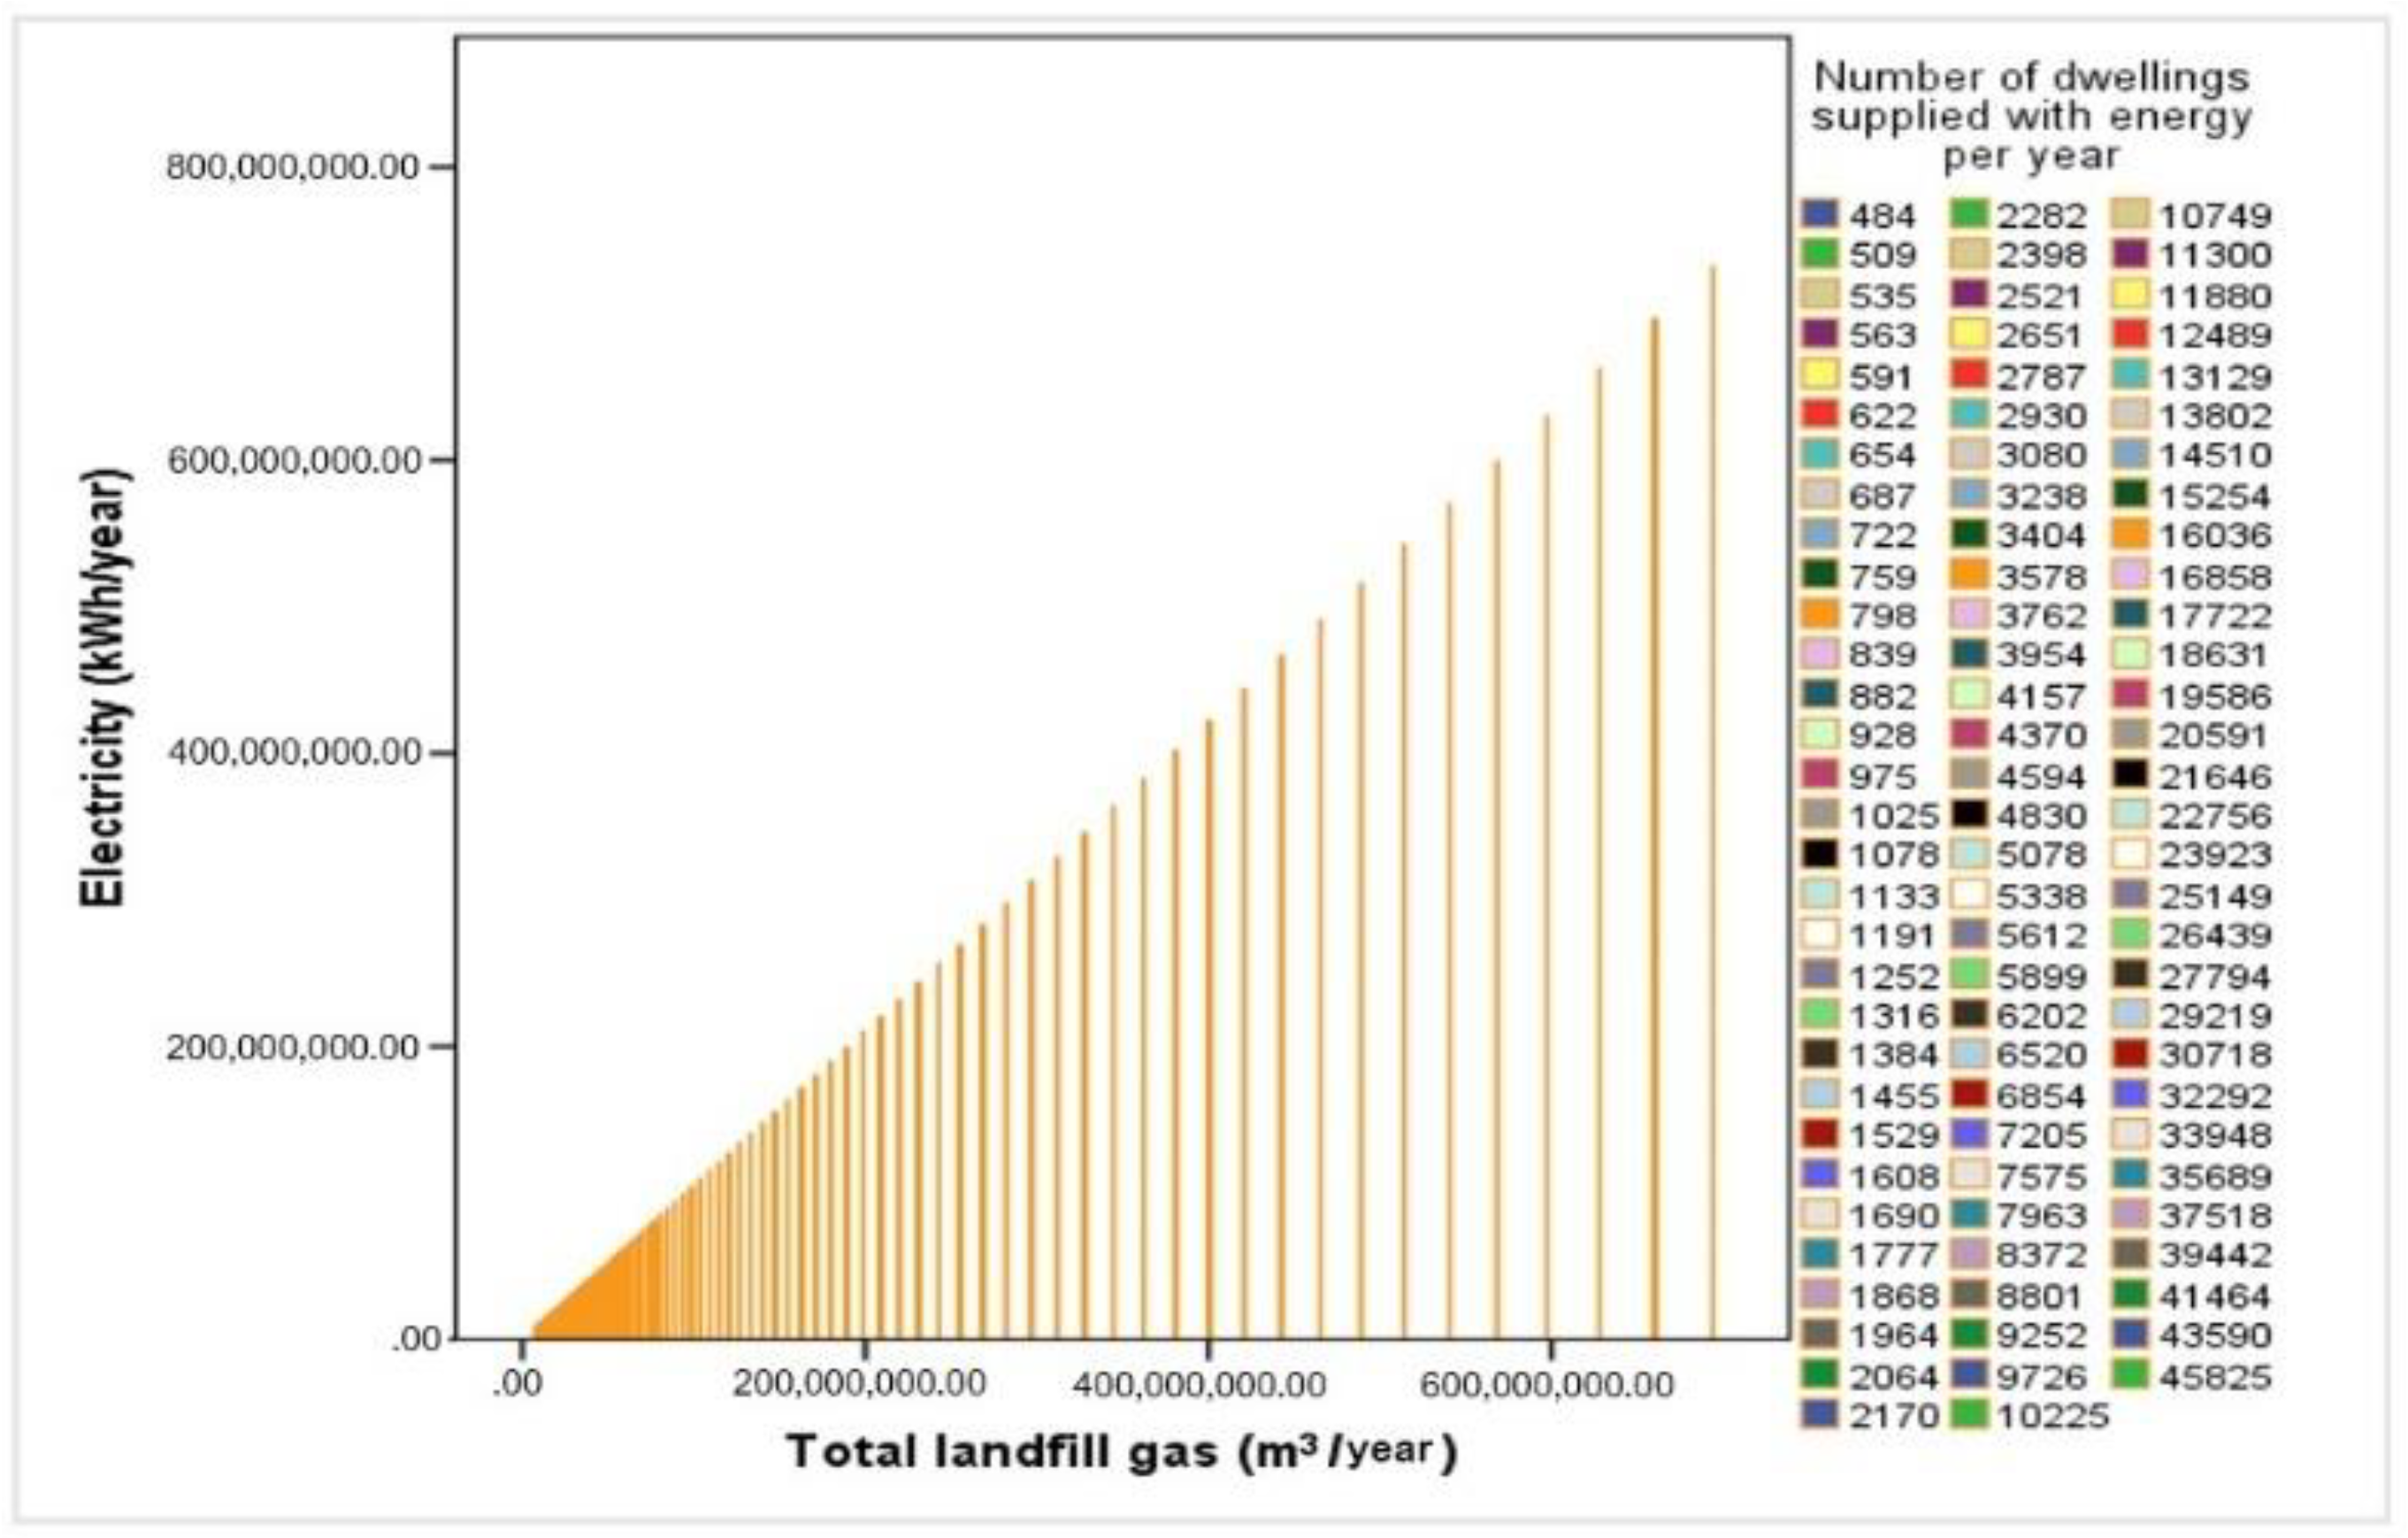
Similarly, the amount of electricity generated in the Las Iguanas landfill in 2021 produces 229,272,368.53 (kWh/year), which is an amount of energy that would be supplied if biogas was used to feed 15,140 homes in the first group (Figure 7). In the second group, in 2053, it will be the highest point of energy with 732,235,296.74 (kWh/year) that would supply electricity to 45,825 homes (Figure 8).
3.6. Pichacay and Las Iguanas Landfill Gas Analysis
The company BGP ENERGY CEM is in charge of monitoring the biogas from the wells, located in the Pichacay landfill on a monthly basis. From the monitoring carried out in 2020, the gases present an average percentage of 51.49% CH4, 40.35% CO2, 1.75% O2 and 17.8% H2S. In the same way, the ILM Consortium monitors the gases that are generated in the Las Iguanas landfill, which present an average of 51.88% CH4, 36.62% CO2, 1.01% O2 and 187.58 ppm H2S as listed in Table 6. It was observed that the Pichacay and Las Iguanas landfills presented concentrations of CH4 staying outside the range from 40 to 60% as required by the LandGEM model, values that are highlighted in red in Table 6. Therefore, the model may not be valid since the concentrations are out of the given range. However, for future biogas estimates, we will compare with other models to develop our own model considering the climatic conditions, the characteristics of the waste and concentrations of the gases typical of the sector where the landfill is located [16,32,53,54].
Hence, in the results of works performed in 2011, the potential for electrical production of biogas, generated in the Pichacay landfill, calculated through theoretical models conducted by the (EPA), assuming a concentration of 50% CH4 and 50% CO2 starting in 2009, it has been estimated that it will reach a higher point of biogas generation in 2019, with 1152 m3/h with a maximum capacity of 1.90 MW. Subsequently, it will decrease year after year until reaching 0.10 MW in 2012, when the sanitary landfill will produce approximately 864 m3/h of biogas, which is estimated to produce 2 MW of electrical energy [18].
Likewise, studies of the Las Iguanas landfill were performed in 2018 where it presented a biogas value of 1,542,119.39 tons of CH4, which would generate 110,376.00 MWh of electricity. This is a value that could cover the demand of 1512% of residential, 2.87% of commercial, 2.24% of public lighting, and some 9.10% with the electricity demand of the city of Guayaquil [22,55,56]. Therefore, they recommend that a system be implemented to take advantage of the biogas that would generate 14 MW [41,57,58]. That is why the importance of knowing the potential that a landfill has to generate biogas through theoretical models to estimate the production of biogas according to the national balance of electrical energy with a cut to March 2021. The installed power in the generation of renewable electrical energy reaches biomass of 176.05 GWh which corresponds to 0.69%, 44.14 GWh of biogas (0.17%), 34.25 GWh photovoltaic (0.15%), 70.53 GWh wind (0.27%), and 23,126.92 GWh hydraulic (91.31%) of all the electrical energy delivered to the public service.
The implication for theoretical models presenting biogas production estimates is that they do not consider the efficiency of the conversion equipment that depends on the altitude above sea level where the generation plant needs to be installed. The stoichiometric mixture of fuel and oxygen are not in the exact concentrations [7,59], as it lacks historical information on the MSW entered into the landfill. These would have been fundamental values for technical and economic viability for biogas training, since the LandGEM model was developed to estimate the amount of biogas generated in sanitary landfills based on approximate data of acceptance of the amount of MSW entered, for the subsequent characterization of waste and monitoring of biogas [42,43].
Based on the data obtained from the estimation of biogas generated at sanitary landfills, it is possible to demonstrate the technical feasibility of using MSW as feedstock for biogas production and electricity generation, and the number of homes that would be supplied with electricity from the generated energy, improving air quality and reducing risks to health and the environment. However, for the application of the model, the following parameters need to be considered, such as year of opening, closing, operating capacity, CH4 (k), CH4 generation power (L0), and CH4 percentage. Finally, the climatic variables of precipitation, temperature, humidity and others must be considered. For future research, it is proposed to determine the cost-benefit ratio of biogas use.
4. Conclusions
According to the data obtained, through the application of the LandGEM version 3.03 model, the opening year 2004 and the closing year 2052 were considered, with a methane generation index k = 0.05 (1/year), potential generation of methane L0 = 170 (m3/Mg), other NMOC gases with a concentration of 600 ppm, and CH4 concentration of 56% for the Pichacay landfill and 58% for the Las Iguanas landfill. Where it was estimated that in the Pichacay landfill, the highest point of biogas generation will be one year after its closure, that is, in 2053 with 76,982.177 (m3/year). In the same way, in the Las Iguanas landfill, the highest point is in 2053 with 693,975,228 (m3/year), one year after the closure of the landfill. Subsequently, it will decrease exponentially as the amount of organic matter consumed decreases.
Based on the calculated biogas, the amount of electricity from the years 2021 to 2144 (when it is estimated that the landfill will stop producing biogas) was determined, and the electricity available from the landfill of Pichacay in 2021 generated will be 24,313,579.99 (kWh/year) which would supply 1522 homes, while the largest energy production with 81,226,339.36 (kWh/year) would supply 5083 homes. In the case of the Las Iguanas landfill in 2021, it will produce 229,272,368.53 (kWh/year), which is an amount of energy that would be supplied if biogas was used for 15,140 homes. Likewise, 2053 will have the highest point of energy with 732,235,296.74 that would supply electricity to 45.825 homes.
Finally, the model may present limitations that may affect the accuracy of the projection in the adequate and economical design in projects for the recovery of electrical energy from biogas. Factors that can affect precision are considering inaccurate assumptions, limited data, poor model calibration, atypical residue composition, change in k or L0 values, and CH4 concentrations outside the 40–60% range.
Author Contributions
Conceptualization, P.P. and M.P.; methodology C.M.-R. and M.U.; software P.P. and M.U.; validation, P.P. and T.T.; formal analysis, P.P. and T.T.; investigation, P.P. and T.T.; resources, P.P.; data curation, M.U. and P.P.; writing—original draft preparation, P.P. and C.M.-R.; writing—review and editing, T.T. and C.M.-R.; visualization, C.M.-R.; supervision, T.T.; project administration, P.P. All authors have read and agreed to the published version of the manuscript.
Funding
This research was funded by Instituto Tecnológico Superior Universitario Oriente (Grant No. 34323674).
Institutional Review Board Statement
Not applicable.
Informed Consent Statement
Not applicable.
Data Availability Statement
The data presented in this study are available upon request from the corresponding author.
Acknowledgments
The authors would like to thank the Municipal Public Cleaning Company of Cuenca EMAC, the Environmental Directorate to the company BGP-ENERGY, the Municipality of Guayaquil, Cantonal Cleaning, Markets and Special Services Directorate, as well as the ILM-Guayaquil Consortium for the facilities granted during the current study.
Conflicts of Interest
The authors declare no conflict of interest. The funders had no role in the design of the study; in the collection, analyses, or interpretation of data; in the writing of the manuscript; or in the decision to publish the results.
References
- IPCC. Climate Change 2014: Synthesis Report. Contribution of Working Groups I, II and III to the Fifth Assessment Report of the Intergovernmental Panel on Climate Change; Core Writing Team, Pachauri, R.K., Meyer, L.A., Eds.; IPCC: Geneva, Switzerland, 2014; p. 151. [Google Scholar]
- Piñas, J.A.V.; Venturini, O.J.; Lora, E.E.S.; de Oliveira, M.A.; Roalcaba, O.D.C. Aterros sanitários para geração de energia elétrica a partir da produção de biogás no Brasil: Comparação dos modelos LandGEM (EPA) e Biogás (Cetesb). Rev. Bras. Estud. Popul. 2016, 33, 175–188. [Google Scholar] [CrossRef] [Green Version]
- Kaza, S.; Yao, L.; Tata, P.; Woerden, F. A Global Snapshot of Solid Waste Management to 2050; Primera; The World Bank Group: Washington, DC, USA, 2018; ISBN 978-1-4648-1347-4. [Google Scholar]
- Río, P.; Resch, G.; Ortner, A.; Liebmann, L.; Busch, S.; Panzer, C. A techno-economic analysis of EU renewable electricity policy pathways in 2030. Energy Policy 2017, 104, 484–493. [Google Scholar] [CrossRef]
- Sun, W.; Wang, X.; DeCarolis, J.F.; Barlaz, M.A. Evaluation of optimal model parameters for prediction of methane generation from selected U.S. landfills. Waste Manag. 2019, 91, 120–127. [Google Scholar] [CrossRef] [PubMed]
- Lima, R.M.; Santos, A.H.M.; Pereira, C.R.S.; Flauzino, B.K.; Pereira, A.C.O.S.; Nogueira, F.J.H.; Valverde, J.A.R. Spatially distributed potential of landfill biogas production and electric power generation in Brazil. Waste Manag. 2018, 74, 323–334. [Google Scholar] [CrossRef] [PubMed]
- Chickering, G.W.; Krause, M.J.; Townsend, T.G. Determination of as-discarded methane potential in residential and commercial municipal solid waste. Waste Manag. 2018, 76, 82–89. [Google Scholar] [CrossRef] [PubMed]
- Martínez, E.; Rodríguez, J. Aplicación de las metodologías EPA, mexicano e IPCC para la estimación de biogás, caso de estudio relleno sanitario Doña Juana, Bogotá-Colombia. Univ. Salud 2016, 18, 338. [Google Scholar] [CrossRef]
- Imbiriba, B.C.d.O.; Ramos, J.R.d.S.; de Sousa Silva, R.; Cattanio, J.H.; do Couto, L.L.; Mitschein, T.A. Estimates of methane emissions and comparison with gas mass burned in CDM action in a large landfill in Eastern Amazon. Waste Manag. 2020, 101, 28–34. [Google Scholar] [CrossRef]
- Halliday, M.A.K.; Matthiessen, C.M.I.M.; Santosa, R.; Priyanto, A.D.; Nuraeni, A.; Ellyawati, H.C.; Rohmawati, I.; Alvionita, R.; Iedema, R.; Feez, S.; et al. Análisis y actualización del sistema de gestión ambiental mediante los rquisistos de la NTC ISO 14001:2015. Nusa 2016, 5, 1689–1699. [Google Scholar] [CrossRef]
- Solíz, F.; Durango, S.; Solano, J.; Yépez, M. Cartografía de los Residuos Sólidos en Ecuador 2020; Solíz, M., Ed.; Primera; Pato Chávez: Quito, Ecuador, 2020; ISBN 9789942837295. [Google Scholar]
- Fallahizadeh, S.; Rahmatinia, M.; Mohammadi, Z.; Vaezzadeh, M.; Tajamiri, A.; Soleimani, H. Estimation of methane gas by LandGEM model from Yasuj municipal solid waste landfill, Iran. MethodsX 2019, 6, 391–398. [Google Scholar] [CrossRef]
- Jeyaseelan, S. A simple mathematical model for anaerobic digestion process. Water Sci. Technol. 1997, 35, 185–191. [Google Scholar] [CrossRef]
- Paulina Rebeca, C.M.; Fabián, R.M.; Francisco José, C.M.; Ana Belem, P.G. Herramientas para la evaluación de riesgos sobre el ambiente y salud, por la disposición final de residuos sólidos urbanos. Rev. Int. Contam. Ambient. 2016, 32, 47–62. [Google Scholar] [CrossRef]
- Yuridia, S.G.; Rene, C.C.; Ana, J.L.; María, S.R.; José, R.A.; Julio, R.A. Emisiones de Gases de Efecto Invernadero en Vertederos de Residuos Sólidos Urbanos. Parte B: Mitigación de Biogás en Acapulco, México. Rev. Iberoam. Cienc. 2017, 4, 12. [Google Scholar]
- Hosseini, S.S.; Yaghmaeian, K.; Yousefi, N.; Mahvi, A.H. Estimation of landfill gas generation in a municipal solid waste disposal site by LandGEM mathematical model. Glob. J. Environ. Sci. Manag. 2018, 4, 493–506. [Google Scholar] [CrossRef]
- Rentería, G.; Fernando, F.; García, A.; Alberto, R. Determinación de la emisión de sustancias tóxicas gaseosas en el relleno sanitario Curva de Rodas de la ciudad de Medellín. Rev. Fac. Ing. Univ. Antioq. 2005, 33, 70–83. [Google Scholar]
- Reinhart, D. A review of recent studies on the sources of Hazardous compounds emitted from solid waste Landfills: A U.S. Experience. Waste Manag. Res. 1993, 11, 257–268. [Google Scholar] [CrossRef]
- Andrade, A.; Tibaquirá, J.E.; Restrepo, A. Estimación de biogás de relleno sanitario, caso de estudio: Colombia. Entre Cienc. Ing. 2018, 12, 40. [Google Scholar] [CrossRef] [Green Version]
- Mokhtari, M.; Ebrahimi, A.A.; Rezaeinia, S. Prediction of Greenhouse Gas Emissions in Municipal Solid Waste Landfills Using LandGEM and IPCC Methods in Yazd, Iran. J. Environ. Health Sustain. Dev. 2020, 5, 1145–1154. [Google Scholar]
- Durango, J.; Saqalli, M.; Laplanche, C.; Locquet, M.; Elger, A. Spatial analysis of accidental oil spills using heterogeneous data: A case study from the North-Eastern Ecuadorian Amazon. Sustainability 2018, 10, 4719. [Google Scholar] [CrossRef] [Green Version]
- Madrigal, G.; Quispe, J.; Vargas, Y. Calculo de la generación de biogás para el relleno sanitario de la ciudad de Juliaca, utilizando el modelo LandGEM Versión 3.02 de la USEPA y estimación del potencial de producción eléctrica. Rev. Investig. Cienc. Tecnol. Desarro. 2018, 4, 42–55. [Google Scholar] [CrossRef]
- Cesari, D.; Merico, E.; Grasso, F.M.; Decesari, S.; Belosi, F.; Manarini, F.; de Nuntiis, P.; Rinaldi, M.; Volpi, F.; Gambaro, A.; et al. Source apportionment of PM2.5 and of its oxidative potential in an industrial suburban site in South Italy. Atmosphere 2019, 10, 758. [Google Scholar] [CrossRef] [Green Version]
- Mukai, S.; Sano, I.; Nakata, M. Improved algorithms for remote sensing-based aerosol retrieval during extreme biomass burning events. Atmosphere 2021, 12, 403. [Google Scholar] [CrossRef]
- Pillai, J.; Riverol, C. Estimation of gas emission and derived electrical power generation from landfills. Trinidad and Tobago as study case. Sustain. Energy Technol. Assess. 2018, 29, 139–146. [Google Scholar] [CrossRef]
- Rodrigue, K.A.; Essi, K.; Cyril, K.M.; Albert, T. Estimation of Methane Emission from Kossihouen Sanitary Landfill and Its Electricity Generation Potential. J. Power Energy Eng. 2018, 06, 22–31. [Google Scholar] [CrossRef] [Green Version]
- Aguilar, Q.; González, P.; Benítez, S. Modelo mexicano para la estimación de la generación de biogás Mexican model for the estimation of the generation of biogas. Ingenieria 2011, 15, 37–45. [Google Scholar]
- Lattanzi, I.; Prata, D.; Quelhas, O. Modelagem da geração de biogás aplicando metodologia CDM para redução de emissões de gases de efeito estufa: Estudo de caso do Aterro MTR Santa Maria Madalena, RJ, Brasil. Sist. Gestão 2020, 14, 483–491. [Google Scholar] [CrossRef]
- Rodrigo IIarri, J.; Rodrigo Clavero, M.E. Optimal Management of Municipal Solid Waste Landfill Leachate Using Mathematical Modeling: A Case Study in Valencia; Springer: Singapore; Nat. Pte Ltd.: Singapore, 2021. [Google Scholar] [CrossRef]
- Rodrigo-Ilarri, J.; Rodrigo-Clavero, M.E. Mathematical modeling of the biogas production in msw landfills. Impact of the implementation of organic matter and food waste selective collection systems. Atmosphere 2020, 11, 1306. [Google Scholar] [CrossRef]
- Rodrigo-Ilarri, J.; Rodrigo-clavero, M.E.; Cassiraga, E. Bioleach: A new decision support model for the real-time management of municipal solid waste bioreactor landfills. Int. J. Environ. Res. Public Health 2020, 17, 1675. [Google Scholar] [CrossRef] [Green Version]
- Huo, J.; Qu, X.; Zhu, D.; Yuan, Z.; Tang, Y. Impacts of Climate Change on Blue and Green Water Resources in the Middle and Upper Yarlung Zangbo River, China. Atmosphere 2021, 12, 1280. [Google Scholar] [CrossRef]
- Saghir, M.; Chbihi, M.; Tahiri, M.; Naimi, Y. Estimated Production of Electrical Energy for the Controlled Landfill in Fez ( Morocco ) by the Land-GEM Model of US EPA. Am. J. Earth Sci. Eng. 2018, 1, 137–142. [Google Scholar] [CrossRef]
- Muñoz, E.; Solano, L. Informe de Caracterización de Residuos Sólidos en el cantón Cuenca; Universidad Católica de Cuenca: Cuenca, Spain, 2018. [Google Scholar]
- Pazmiño, J.P.W.; Arévalo, L.F.C. Análisis Estadístico De Los Residuos Sólidos Domésticos De La Parroquia San Sebastian Del Coca Del Cantón Joya De Los Sachas. Eur. Sci. J. ESJ 2018, 14, 7. [Google Scholar] [CrossRef]
- Hidalgo, J.; Coello, S.; Crespo, T.; Amaya, J.; Soto, M.; Jervis, F.; Moreira, C. Waste to energy potential of domestic waste cooking oil in guayaquil: A review. LACCEI Int. Multi-Conf. Eng. Educ. Technol. 2020, 1–7. [Google Scholar] [CrossRef]
- Espinosa, J.; Moreno, J.; Bernal, G. World Soils Book Series Series Editor; Espinosa, J., Moreno, J., Bernal, G., Eds.; Springer International Publishing AG: Quito, Ecuador, 2018; ISBN 978-3-319-25317-6. [Google Scholar]
- Marín, J.C.; Pozo, L.; Colina, G.; Rincón, N.; Behling, E.; Díaz, A.; Fernández, N. Optimización de un método para la determinación simultánea de H2 y CH4 por cromatografía gas-sólido en biorreactores anaeróbicos Optimization of a Method for Simultaneous Determination of H2 and CH4 in Anaerobic Bioreactors Using Solid-Gas Chromatogra. Multiciencias 2007, 7, 266–275. [Google Scholar]
- Bakkaloglu, S.; Lowry, D.; Fisher, R.; France, J.; Brunner, D.; Chen, H.; Nisbet, E. Quantification of methane emissions.pdf. Waste Manag. 2021, 83–93. [Google Scholar] [CrossRef]
- Ohnmacht, B.; Lemmer, A.; Oechsner, H.; Kress, P. Demand-oriented biogas production and biogas storage in digestate by flexibly feeding a full-scale biogas plant. Bioresour. Technol. 2021, 332, 125099. [Google Scholar] [CrossRef] [PubMed]
- Barragán-Escandón, A.; Ruiz, J.M.O.; Tigre, J.D.C.; Zalamea-León, E.F. Assessment of power generation using biogas from landfills in an equatorial tropical context. Sustainability 2020, 12, 2669. [Google Scholar] [CrossRef] [Green Version]
- Cárdenas-Moreno, P.R.; Piña-Guzmán, A.B.; Robles-Martínez, F. Estimación del Biogás Generado en Sitios de Disposición Final del Estado de México. Rev. Int. Contam. Ambient. 2020, 37, 27–38. [Google Scholar] [CrossRef]
- Aguilar-Virgen, Q.; Taboada-González, P.; Ojeda-Benítez, S. Analysis of the feasibility of the recovery of landfill gas: A case study of Mexico. J. Clean. Prod. 2014, 79, 53–60. [Google Scholar] [CrossRef]
- Barragán, E.A.; Arias, P.D.; Terrados, J. Fomento Del Metabolismo Energético Circular Mediante Generación Eléctrica Proveniente De Rellenos Sanitarios. Ingenius 2016, 36–42. [Google Scholar] [CrossRef] [Green Version]
- Moya, D.; Aldás, C.; Jaramillo, D.; Játiva, E.; Kaparaju, P. Waste-To-Energy Technologies: An opportunity of energy recovery from Municipal Solid Waste, using Quito-Ecuador as case study. Energy Procedia 2017, 134, 327–336. [Google Scholar] [CrossRef]
- Johari, A.; Ahmed, S.I.; Hashim, H.; Alkali, H.; Ramli, M. Economic and environmental benefits of landfill gas from municipal solid waste in Malaysia. Renew. Sustain. Energy Rev. 2012, 16, 2907–2912. [Google Scholar] [CrossRef]
- Shen, Y.; Linville, J.L.; Urgun-Demirtas, M.; Mintz, M.M.; Snyder, S.W. An overview of biogas production and utilization at full-scale wastewater treatment plants (WWTPs) in the United States: Challenges and opportunities towards energy-neutral WWTPs. Renew. Sustain. Energy Rev. 2015, 50, 346–362. [Google Scholar] [CrossRef] [Green Version]
- Shenai-Tirodkar, P.S.; Gauns, M.U.; Ansari, Z.A. Evaluation of surface water and sediment quality in Chicalim Bay, Nerul Creek, and Chapora Bay from Goa coast, India—A statistical approach. Environ. Monit. Assess. 2016, 188, 1–13. [Google Scholar] [CrossRef] [PubMed]
- Briceño, I.; Valencia, J.; Posso, M. Potencial de generación de energía de ka agroindustria de la palma de aceite Colombia. Palma 2015, 36, 43–53. [Google Scholar]
- Venegas, J.; Aryal, D.; Ruíz, R. Biogás, la energía renovable para el desarrollo de granjas porcícolas en el estado de Chiapas. Análisis Económico 2018, 34, 169–187. [Google Scholar] [CrossRef]
- Martínez, C.; García, Y. Use of basic and specific pre-treatments for the biogas production. Revision and analysis. Rev. Ciencias Técnicas Agropecu. 2016, 25, 81–92. [Google Scholar] [CrossRef]
- Andrea, L.; García, M.; David, Á.; Vargas, R.; Enrique, H.; Cubides, R. Computational Model of An Electric Power Generation System Based on Biogas Obtained From Cattle Manureodelo. Pist. Educ. 2020, 42, 1091–1110. [Google Scholar]
- Das, D.; Majhi, B.; Pal, S.; Jash, T. Estimation of Land-fill Gas Generation from Municipal Solid Waste in Indian Cities. Energy Procedia 2016, 90, 50–56. [Google Scholar] [CrossRef]
- Opio, R.; Mugume, I.; Nakatumba-nabende, J. Understanding the Trend of NO2, SO2 and CO over East Africa from 2005 to 2020. Atmosphere 2021, 12, 1283. [Google Scholar] [CrossRef]
- Villacres, A. Estudio Técnico de un Sistema para Producir Energía Eléctrica a partir del Biogás Generado por la Descomposición de la Basura en la Ciudad de Guayaquil; Universidad de Guayaquil: Guayaquil, Ecuador, 2018. [Google Scholar]
- Cairampoma, G. Propuesta de generación de energía eléctrica mediante biogás obtenido por la materia orgánica del Relleno Sanitario “Santa Cruz”-Concepción. Ingenium 2017, 2, 21–33. [Google Scholar] [CrossRef] [Green Version]
- Ayodele, T.; Ogunjuyigbe, A. Effect of collection efficiency and oxidation factor on greenhouse gas emission and life cycle cost of landfill distributed energy generation. Sustain. Cities Soc. 2019, 52, 1–10. [Google Scholar] [CrossRef]
- Vera, I.; Martínez, J.; Estrada, M.; Ortiz, A. Potencial de generación de biogás y energía eléctrica. Parte II: Residuos sólidos urbanos Potential of Power Generation from Biogas. Part II: Municipal Solid Waste. Ing. Investig. Tecnol. 2015, 16, 471–478. [Google Scholar]
- Andrei, F.; Barbieri, M.; Sappa, G. Application of2h and18o isotopes for tracing municipal solid waste landfill contamination of groundwater: Two Italian case histories. Water 2021, 13, 1065. [Google Scholar] [CrossRef]
Figure 1.
(A) Ecuador’s location, with (B) the two specific study areas of both landfills; (C) “Las Iguanas” Landfill—Guayaquil; (D) “Pinchacay” Landfill—Cuenca.
Figure 1.
(A) Ecuador’s location, with (B) the two specific study areas of both landfills; (C) “Las Iguanas” Landfill—Guayaquil; (D) “Pinchacay” Landfill—Cuenca.

Figure 2.
Biogas estimation methodology and electrical energy production.

Figure 3.
Prediction of the total quantity of biogas, CH4, CO2, and other NMOC gases (m3/year) Pichacay-Cuenca landfill.
Figure 3.
Prediction of the total quantity of biogas, CH4, CO2, and other NMOC gases (m3/year) Pichacay-Cuenca landfill.

Figure 4.
Prediction of the total amount of biogas, CH4, CO2, and other NMOC gases (m3/year) landfill of Las Iguanas-Guayaquil.
Figure 4.
Prediction of the total amount of biogas, CH4, CO2, and other NMOC gases (m3/year) landfill of Las Iguanas-Guayaquil.

Figure 5.
Group 1. Pichacay electricity produced and number of dwellings supplied with energy period 2021–2052.
Figure 5.
Group 1. Pichacay electricity produced and number of dwellings supplied with energy period 2021–2052.

Figure 6.
Group 2. Pichacay electricity produced and number of dwellings supplied with energy period 2053–2144.
Figure 6.
Group 2. Pichacay electricity produced and number of dwellings supplied with energy period 2053–2144.

Figure 7.
Group 1. Las Iguanas electricity produced and number of homes supplied with energy period 2021–2052.
Figure 7.
Group 1. Las Iguanas electricity produced and number of homes supplied with energy period 2021–2052.

Figure 8.
Group 2. Las Iguanas electricity produced and number of homes supplied with energy period 2053–2144.
Figure 8.
Group 2. Las Iguanas electricity produced and number of homes supplied with energy period 2053–2144.


Table 1.
LandGEM model methane generation index -EPA [36].
Table 1.
LandGEM model methane generation index -EPA [36].
| Emissions Concentration Type | Landfill Type | K (1/Year) | L0 (m3/mg) |
|---|---|---|---|
| CAA | Conventional | 0.05 | 170 |
| CAA | Arid zone | 0.02 | 170 |
| Inventory | Conventional | 0.04 | 100 |
| Inventory | Arid zone | 0.02 | 100 |
| Inventory | Wet (Bioreactor) | 0.7 | 96 |
Table 2.
Methane generation rate and power [36].
Table 2.
Methane generation rate and power [36].
| Precipitation (mm/Year) | K | L0 | ||
|---|---|---|---|---|
| ≤50% | ≥60% | ≤50% | ≥60% | |
| 0–249 | 0.04 | 0.043 | 60 | 62 |
| 250–499 | 0.05 | 0.053 | 80 | 83 |
| 500–999 | 0.065 | 0.69 | 84 | 87 |
| 1000–1999 | 0.08 | 0.085 | 84 | 87 |
| 2000 + saturated | 0.08 | 0.085 | 84 | 87 |
Table 3.
Characteristics of Pichacay MSW.
| Components | Weight % |
|---|---|
| Year 2018 | |
| Organic material | 61.22 |
| Cardboard paper | 5.81 |
| Metals | 1.14 |
| Plastic White | 7.57 |
| Rigid Plastic | 4.13 |
| Rubber | 1.37 |
| Inert matter | 1.21 |
| Glass | 2.0 |
| Wood | 0.38 |
| Textiles | 3.12 |
| Toilet paper, towels and diapers | 10.67 |
| Tetrapak | 0.36 |
| Others | 1.02 |
| Total | 100 |
Source: Relleno Sanitaria Pichacay 2021.
Table 4.
Characteristics of MSW of Las Iguanas.
| Components | Weight (%) |
|---|---|
| Year 2017 | |
| Organic material | 67 |
| Tetra pack | 0.6 |
| Toilet paper | 1.2 |
| Notebook paper | 1.2 |
| Newspaper | 0.8 |
| Paperboard | 2.6 |
| Plastic household line | 1.2 |
| Pet plastic | 1.6 |
| Plastic cases | 10.6 |
| Plastic wrap | 1.6 |
| Glass | 1.4 |
| Metal | 0.4 |
| Rubber | 0.2 |
| Wood, plant residues | 3.2 |
| Stone | 1.0 |
| Others (diaper, clothes, leather) | 5.4 |
Table 5.
Electric energy production from biogas.
| Nr. | Source | Country | City | Electric Energy (MWh/año) | Year | Reference |
|---|---|---|---|---|---|---|
| 1 | Sanitary landfill | Mexico | Ensenada | 19,000 | 2004 | [16] |
| Sanitary landfill | Mexico | Baja California | 760,492.8 | 2014 | [42] | |
| 2 | Sanitary landfill | Peru | Puno | 5980.728 | 2018 | [19] |
| 3 | Sanitary landfill | Ecuador | Cuenca | 5844.3 | 2016 | [21] |
| 4 | Sanitary landfill | Colombia | Pereira | 60,000 | 2018 | [43] |
| 5 | Sanitary landfill | Ecuador | Quito | 5.97 | 2017 | [22] |
| 6 | Sanitary landfill | Malaysia | Putrajaya | 1,900,000 | 2016 | [44] |
| 7 | Sanitary landfill | Austria | Vienna | 0.0235 | 2017 | [45] |
| 8 | Agricultural industry | Colombia | Bogotá | 340 | 2012 | [46] |
| 9 | Agricultural industry | Mexico | Chiapas | 7593 | 2018 | [47,48] |
| 10 | Agricultural industry | Argentina | Buenos Aires | 0.0021 | 2015 | [49] |
| 11 | Animal | Colombia | Antioquia | 2952 | 2019 | [50] |
| 12 | Sanitary landfill | Bolivia | Santa Cruz | 0.00928 | 2017 | [51] |
| 13 | Sanitary landfill | Colombia | Cúcuta | 3.000 | 2017 | [52] |
Table 6.
Analysis of sanitary landfill gases.
| Pichacay-Cuenca | Las Iguanas-Guayaquil | ||||||||
|---|---|---|---|---|---|---|---|---|---|
| Pozos | %CH4 | %CO2 | %O2 | %H2S | Wells/Chimney | %CH4 | %CO2 | %O2 | H2S (ppm) |
| 1 | 54.5 | 45.5 | 0 | 37 | 1 | 60.2 | 39.8 | 0.0 | 656 |
| 2 | 55.8 | 44.2 | 0 | 63 | 2 | 56.7 | 3.2 | 0.8 | 485 |
| 3 | 55.4 | 44.2 | 0 | 16 | 9 | 57.6 | 38.8 | 1.0 | 258 |
| 4 | 51.9 | 37.9 | 2.5 | 27 | 9 | 53.9 | 39.2 | 1.0 | 45 |
| 5 | 55.7 | 44.1 | 0 | 24 | 9 | 58.6 | 37.6 | 1.1 | 136 |
| 6 | 56.2 | 43.9 | 0 | 31 | 10EB | 52.1 | 39.9 | 2.1 | 380 |
| 7 | 58.6 | 41.5 | 0 | 20 | 10EC | 52.8 | 37.1 | 2.0 | 120 |
| 8 | 42.6 | 30 | 5.7 | 13 | 10ED | 51.2 | 35.4 | 3.2 | 101 |
| 9 | 36.8 | 28.5 | 6.4 | 11 | 11EC | 52.9 | 37.1 | 2.4 | 67 |
| 10 | 55.1 | 44.8 | 0.2 | 29 | 12EF | 50.1 | 39.2 | 2.2 | 55 |
| 11 | 54.2 | 42.7 | 0 | 20 | 10 | 35,6 | 22.6 | 7.4 | 191 |
| 12 | 54.4 | 45.7 | 0 | 11 | 10 | 60.9 | 39.1 | 0 | 225 |
| 13 | 54.8 | 45.2 | 0 | 39 | 10 | 47.9 | 29.7 | 1.7 | 142 |
| 14 | 53.6 | 46.4 | 0 | 21 | 11 | 50.1 | 30.6 | 3.2 | 262 |
| 15 | 53.8 | 46.1 | 6 | 6 | 21 | 59.2 | 39.9 | 0.0 | 169 |
| 16 | 56.4 | 43 | 0.5 | 13 | 22 | 53.7 | 36.8 | 1.3 | 158 |
| 17 | 45.0 | 37.1 | 0.9 | 1 | 25 | 56.7 | 43.3 | 0.0 | 100 |
| 18 | 55.5 | 44.2 | 0 | 24 | 26 | 56.7 | 47.2 | 0.0 | 226 |
| 19 | 55.4 | 44.5 | 0 | 13 | 28 | 58.8 | 39.4 | 0.3 | 222 |
| 20 | 56.5 | 43.1 | 0.5 | 11 | 30 | 58.3 | 41.7 | 0.0 | 142 |
| 21 | 57.2 | 40.7 | 0.9 | 4 | 31 | 57.5 | 42.1 | 0.0 | 253 |
| 22 | 54 | 45.9 | 0 | 18 | 32 | 56.7 | 43.3 | 0.0 | 172 |
| 23 | 56 | 43.7 | 0 | 3 | 33 | 57.5 | 42.5 | 0,0 | 82 |
| 24 | 56.3 | 43.1 | 0.8 | 33 | 36 | 58.3 | 41.7 | 0.0 | 107 |
| 25 | 56.2 | 43.2 | 0.5 | 15 | 37 | 59.5 | 40.5 | 0.0 | 408 |
| 26 | 25.3 | 19.1 | 10.7 | 2 | 38 | 60.5 | 39.2 | 0.0 | 392 |
| 27 | 49.1 | 36.4 | 3.2 | 1 | 39 | 57.9 | 41.9 | 0.2 | 228 |
| 28 | 45.2 | 33.1 | 4.8 | 10 | 40 | 58.7 | 41.3 | 0.1 | 103 |
| 29 | 45.4 | 35 | 3.6 | 6 | 41 | 57.4 | 42.6 | 0.0 | 132 |
| 30 | 55.4 | 44 | 0.7 | 33 | 42 | 57.2 | 42.7 | 0.0 | 198 |
| 31 | 51.6 | 38.5 | 2.4 | 2.6 | 43 | 41.3 | 31.3 | 4.6 | 42 |
| 32 | 33.9 | 26.1 | 6.0 | 12 | 44 | 57.5 | 42.5 | 0.0 | 121 |
| BIO | 51.49 | 40.35 | 1.75 | 17.8 | BIO | 51.88 | 36.62 | 1.01 | 187.58 |
Source: BGP ENERGY CEM-2021 Company and ILM Consortium-2021-Report Nos. 183-20, 060-20, 029-21, 200-20, 201-20, 202-20, 203-20, 30-20, 31-20.
Publisher’s Note: MDPI stays neutral with regard to jurisdictional claims in published maps and institutional affiliations. |
© 2021 by the authors. Licensee MDPI, Basel, Switzerland. This article is an open access article distributed under the terms and conditions of the Creative Commons Attribution (CC BY) license (https://creativecommons.org/licenses/by/4.0/).
Share and Cite
MDPI and ACS Style
Poma, P.; Usca, M.; Polanco, M.; Toulkeridis, T.; Mestanza-Ramón, C. Estimation of Biogas Generated in Two Landfills in South-Central Ecuador. Atmosphere 2021, 12, 1365. https://0-doi-org.brum.beds.ac.uk/10.3390/atmos12101365
AMA Style
Poma P, Usca M, Polanco M, Toulkeridis T, Mestanza-Ramón C. Estimation of Biogas Generated in Two Landfills in South-Central Ecuador. Atmosphere. 2021; 12(10):1365. https://0-doi-org.brum.beds.ac.uk/10.3390/atmos12101365
Chicago/Turabian StylePoma, Paulina, Marco Usca, María Polanco, Theofilos Toulkeridis, and Carlos Mestanza-Ramón. 2021. "Estimation of Biogas Generated in Two Landfills in South-Central Ecuador" Atmosphere 12, no. 10: 1365. https://0-doi-org.brum.beds.ac.uk/10.3390/atmos12101365
Note that from the first issue of 2016, this journal uses article numbers instead of page numbers. See further details here.