Article

Spatial Distributions of Atmospheric Ammonia in a Rural Area in South Korea and the Associated Impact on a Nearby Urban Area

1
Department of Environment and Energy, Jeonbuk National University, Jeonju 54896, Korea
2
Innovative System Safety Research Division, Korea Atomic Energy Research Institute, Deajeon 34057, Korea
3
Research Center for Atmospheric Environment, Hankuk University of Foreign Studies, Yongin 17035, Korea
4
Department of Rural and Biosystems Engineering, Chonnam National University, Gwangju 61186, Korea
5
Animal Environment Division, National Institute of Animal Science, Sejong 55365, Korea
6
Department of Earth and Environmental Sciences, Jeonbuk National University, Jeonju 54896, Korea
*
Author to whom correspondence should be addressed.
Submission received: 5 October 2021 / Revised: 17 October 2021 / Accepted: 19 October 2021 / Published: 27 October 2021
(This article belongs to the Special Issue Atmospheric Pollution of Agriculture-Dominated Cities)

Abstract

:
Ammonia (NH3) plays an important role in air quality and atmospheric chemistry, yet studies on the characteristics and impacts of NH3 are limited. Herein, we revealed the spatial distribution of atmospheric NH3, as measured by passive samplers, at three different sites (R1, R2, and R3) in the rural area (livestock environment) of Jeongeup, South Korea, from September 2019 to August 2020. At site R1, the boundary of a large-scale pig farm, dramatically high daily mean concentrations of NH3 were observed (118.7 ppb), whereas sites R2 and R3, located ~1 km from R1, exhibited lower concentrations of 18.2 and 30.4 ppb, respectively. In the rural environment, the monthly NH3 variations showed a peak in June (34.2 ppb), which was significantly higher than in the urban and remote areas. To examine the impact of NH3 from the rural area on a nearby urban area in June 2020, simultaneous measurements were performed using a real-time instrument in Jeonju. When high NH3 events occurred in the urban area in June, the results for the NH3 concentrations and observed meteorological conditions in the rural and urban areas showed that the rural area influenced the NH3 levels in the adjacent urban area.

1. Introduction

Ammonia (NH3) is a base gas that reacts with acidic species in the atmosphere, such as sulfuric acid (H2SO4) and nitric acid (HNO3), to produce secondary inorganic aerosols (SIAs). These SIAs contribute to the degradation of visibility and air quality, and have adverse effects on human health [1,2,3].
Global NH3 emissions have increased from 1.9 to 16.7 Tg between the 1960s and 2010s [4]; southern Asia, including China and India, accounts for more than 50% of the total global NH3 emissions since the 1980s. More than 90% of the total NH3 emissions derive from the livestock industry, agricultural activities, and domestic animal fertilizer use [5,6]. Additionally, some studies have shown that industrial and traffic emissions may be a source of NH3 in urban environments [7,8]. Recently, effective controls have significantly reduced the emissions of some gaseous pollutants, including NOx and SO2 [9,10], but NH3 emissions have continued to increase [11,12].
Field measurements have shown that variations in NH3 concentrations depend on the location and season. Due to elevated emissions from livestock husbandry and agricultural actives, higher concentrations of ambient NH3 are typically recorded in rural areas [13,14]. For example, the atmospheric NH3 concentrations measured from April 2009 to August 2011 near the boundary of a pig farm in China ranged between 46.6 and 674.7 ppb [13]. Additionally, Kubota (2020) reported that NH3 concentrations in high emissions areas (i.e., adjacent to livestock sources) were greater in winter (~71 ppb) than those in summer (~56 ppb), which is not a typical seasonal variation pattern [14]. In contrast, lower concentrations of ambient NH3 have been reported in urban areas [15,16]. For instance, the NH3 concentration measured in Seoul, South Korea, was ~11.6 ppb from 2010 to 2011; the mean seasonal value of NH3 was ~14.0 and ~9.0 ppb in the summer and winter, respectively [15]. Meng (2011) and Zhou (2019) suggested that NH3 emitted from livestock activities could influence the ambient NH3 concentrations in nearby urban areas [17,18]. Although atmospheric NH3 has a significant impact on the air quality in rural areas and adjacent urban areas, data on spatial distributions and characteristics of atmospheric NH3 are, at present, limited (there are especially limited data available for atmospheric NH3 measurements in South Korea).
In this study, to explore spatial distributions of atmospheric NH3 in a rural area, we conducted a one-year measurement (from September 2019 to August 2020) at three different monitoring sites in Jeongeup, a rural site in South Korea. Jeongeup is a typical agricultural area characterized by large- and small-scale livestock farms and facilities. Moreover, to investigate whether the NH3 emitted from the agricultural source influenced the atmospheric NH3 in the urban area, simultaneous measurements for atmospheric NH3 were carried out in both the rural area (Jeongeup) and a nearby urban area (Jeonju) during summer in June 2020.

2. Materials and Methods

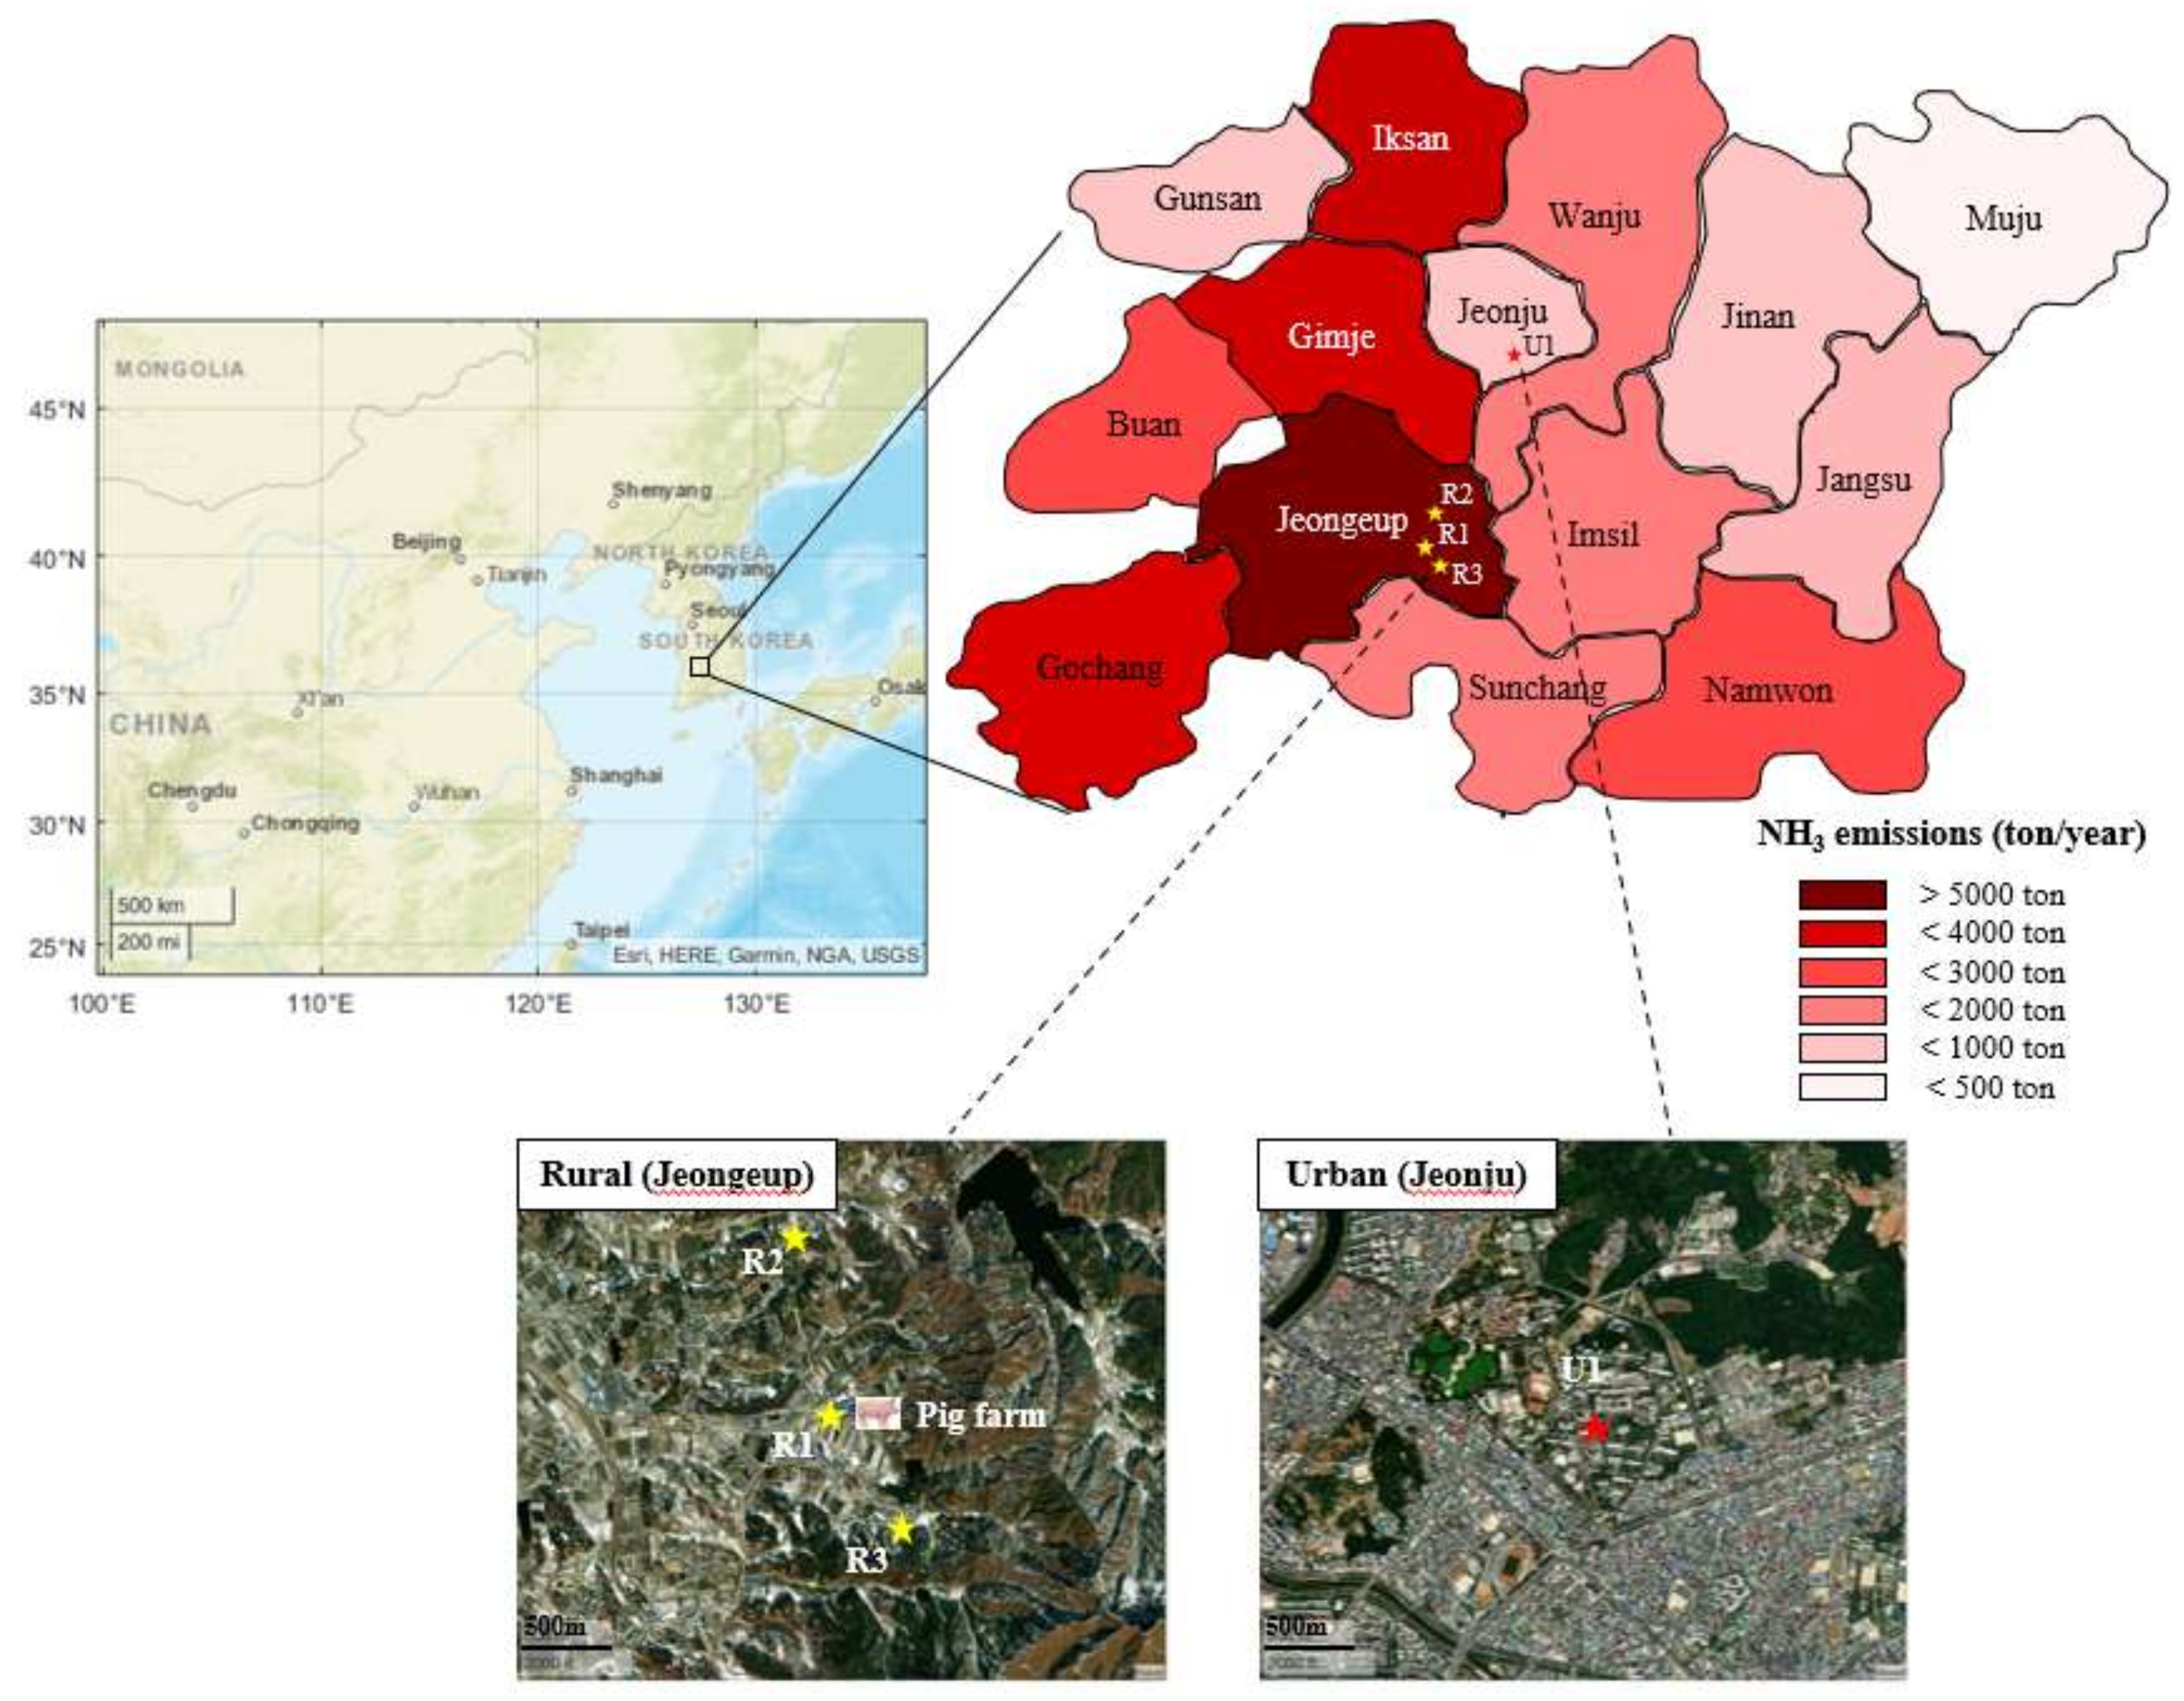
2.1. Monitoring Sites

Atmospheric NH3 concentrations were measured in the rural area of Ongdong-myeon, Jeongeup (35.655° N, 126.987° E) from September 2019 to August 2020. Jeongeup is an agricultural area of approximately 692.7 km2, characterized by the largest NH3 emissions in Jeollabuk-do [19] (Figure 1). Significant livestock populations (such as pigs, cows, and chickens, etc.) are located within the region of Jeongeup (i.e., ~393,000 pigs, ~89,000 cows, and ~823,000 chickens in 2021 [20]). Based on the Clean Air Policy Support System (CAPSS), the main NH3 source among the livestock in the rural area is pigs [19]. Three different sites in Ongdong-myeon, Jeongeup, were selected: one site at the boundary (R1) of a large-scale mechanically ventilated pig breeding farm (~12,000 pigs in 2020) and two sites located ~1 km from the farm (R2 and R3). Sites R2 and R3 are located to the north and south of the pig farm, respectively (Figure 1).
Additionally, NH3 concentrations were measured on the second floor of the Natural Science Building at Jeonbuk National University, Jeonju, which is the capital of Jeollabuk-do, South Korea (35.847° N, 127.129° E). Jeonju is an urban area located approximately 40 km from the monitoring sites in the rural area of Jeongeup. This site is surrounded by business offices, residential buildings, and roads. Major livestock areas emit NH3 in the western vicinity of this region (Jeongeup, Iksan, and Gimje). Figure 1 shows the locations of the monitoring sites in both the rural and urban areas.

2.2. Atmospheric NH3 Measurements

Passive samplers (RAD 168, Radiello, Italy) were employed to obtain the NH3 concentrations over the rural sites of R1-R3 at a height of ~3 m from the ground from September 2019 to August 2020, with the aim of analyzing their spatial distribution. A passive sampler is consisted of an outer porous cylindrical diffusive body, which controlled the diffusion rate, and a cylindrical inner polyethylene tube coated by phosphorous acid, leading to NH3 adsorption. This is a widely used instrument to collect atmospheric NH3 [14,18,21,22,23]. In this study, atmospheric NH3 was collected over a one-day period from 09:00 a.m. to 08:00 a.m. local time the following day during the entire sampling period; however, NH3 was collected over a two-day period in June (because of the rainy season). Sampling could not be conducted in October and November 2019 owing to limited access in the area owing to African swine fever virus (ASF) and in July 2020 during the monsoon season. After NH3 collection, samples were stored at −18 °C before extraction. The samples were extracted in 6 mL of deionized water (18.2 MΩ·cm, Merck Milli-Q®, Millipore, Burlington, MA, USA) and sonicated for 45 min. Subsequently, the extracts were analyzed as an NH4+ concentration using ion chromatography (Aquion, Thermo Scientific, USA). The NH4+ concentrations obtained were then converted to NH3 using a previously reported equation [24,25]. Based on the field blanks, the detection limit of NH3 was calculated to be ~0.85 µg/m3 (~1.2 ppb). A total of 95 samples were analyzed from R1 (32 samples), R2 (32 samples) and R3 (31 samples), as listed in Table 1. After collection, all samples were analyzed within two weeks.
To obtain the temporal variations in the atmospheric NH3 concentrations in Jeonju (the urban area), NH3 was measured on the second floor of Jeonbuk National University using a cavity ring-down spectroscopy (CRDS) analyzer (Picarro Inc., model G2103, Santa Clara, CA, USA) at 1 s intervals from 1–30 June 2020. The detailed methods and calibration of the instrument describes in Park (2020) [26]. Briefly, the detection limit of the NH3 analyzer was less than 0.09 ppb and the average precision was 0.3 ppb for 300 s with a response time of less than 1 s [27]. In principle, the NH3 analyzer does not require additional external calibration; however, in this study, mixtures of a standard NH3 gas (9.2 ppm, with an accuracy of ±2%; Airkorea, Korea) and N2 (Airkorea, Korea, 99.999%) were used to confirm the calibration performance of the analyzer. Calibration was conducted using five different NH3 concentrations (150, 100, 50, 30, and 0 ppb); the resulting R2 was 0.9997. Hourly averaged data were used for data analysis. Data that exceeded the hourly amount of precipitation of 5 mm were excluded from data analysis to reduce the effect of precipitation.
Hourly averaged meteorological parameters, including air temperature, relative humidity, wind speed, wind direction, and precipitation, were collected at Jeongeup (rural; station id: 47245, ~16.5 km from R1) and Jeonju (urban; station id: 47146, ~1.5 km from U1) using the automated synoptic observing system (ASOS) from the Weather Data Service of the Korea Meteorological Administration (Available online: https://data.kma.go.kr) (accessed on 13 May 2021).

2.3. Modeling of NH3 Origin

To identify the relative concentrations of the pollutants contributing to the potential source regions at the receptor site, we performed a concentration weighted trajectory (CWT) analysis [28,29]. The study field covering a geographical area from 90° E to 150° E and from 20° N to 60° N includes 2400 grid cells with a spatial resolution of 1° × 1°. The CWT analysis was combined with a 72-h air mass backward trajectory using the National Oceanic and Atmospheric Administration Hybrid Single-Particle Lagrangian Trajectory (HYSPLIT4) model at four times; 00:00, 06:00, 12:00, and 24:00 UTC at 100 m above ground level (AGL). The meteorological data used for backward trajectory calculating were the GDAS (Global Data Assimilation System) with a resolution of 1° × 1° data and were downloaded from the web server of NOAA Air Resources Laboratory. Additionally, to access the regional scale transport and local pollution source emissions, a conditional probability function (CPF) analysis was performed using NH3 concentrations, wind direction, and wind speed data obtained from ASOS. The threshold criterion of the 90th percentile was selected to indicate the directionality of the sources.

3. Results and Discussion

3.1. Spatial Distributions of Atmospheric NH3 in the Rural Area

During the observation period from September 2019 to August 2020, the monthly averaged temperature, relative humidity, and wind speed were 13.1 ± 9.8 °C and 71.4 ± 17.8 %, and 1.5 ± 1.8 m/s, respectively; the prevailing wind direction was north in the rural area (Figure S1). A total of 95 passive samplers were used at the three different sites within the rural area during the entire study period. Table 1 presents a description of each monitoring site and the average seasonal NH3 concentrations.
Figure 2 shows the variation in the daily average NH3 concentration at R1, R2, and R3 in the rural area. At site R1 (boundary of a large-scale pig farm), dramatically high NH3 concentrations were recorded, with a daily average of 118.7 ± 51.7 ppb, which varied from a minimum of 40.3 ppb to a maximum of 272.2 ppb (Figure 2a). For the seasonal variation, the average NH3 concentrations at R1 were 100.5, 128.6, 60.3, and 141.6 ppb in spring, summer, autumn, and winter, respectively (Table 1). Average NH3 concentrations over 100 ppb were recorded during all seasons, except in autumn owing to frequent heavy rain and typhoons (Figure S1b) in September 2019 (Figure S2a). As listed in Table 1, in winter, the average seasonal NH3 concentration at site R1 was approximately two-fold higher than that in autumn.
Ammonia is temperature-dependent [30]; high concentrations have been generally reported during summer in various environments [15,21,30,31,32,33]. However, at the NH3 point source observed at the boundary of the large-scale pig farm (R1), the NH3 concentrations were insensitive to the ambient temperature, instead recording a high NH3 level in winter (Figure 2 and Table 1). This is possibly due to ventilation differences at a mechanically ventilated pig farm depending on the season. The ventilation system usually operates at a significantly higher frequency in summer and a lower frequency in winter to maintain the internal temperature [34,35,36,37,38,39]. Increased ventilation rates can easily diffuse NH3 into the atmosphere under high ambient temperatures, producing relatively lower concentrations of atmospheric NH3 in summer. In contrast, reduced ventilation rates can diffuse concentrated NH3 under low ambient temperatures, resulting in relatively high concentrations of atmospheric NH3 in winter [37,38,39]. Additionally, high concentrations of ambient NH3 at R1 may have also been driven by the livestock industry environments and activities of such a large-scale pig farm. In Asia, large-scale farms are usually equipped with open manure storage facilities; in these facilities, farmers actively store manure and produce fertilizer during winter for use on farmland in spring with the start of agricultural activity [40]. The NH3 emitted from intensive manure production in open storage facilities in winter increases the atmospheric NH3 concentration. Previous studies have reported similar results: ambient NH3 concentrations were higher in winter months than in other months with active fertilization in agricultural areas [14,41,42,43]. Kubota (2020) conducted atmospheric NH3 measurements with a passive sampler at the near livestock sources from October 2018 to January 2020, finding that the average NH3 concentration in winter was higher than that in summer, which is consistent with our results [14]. Additionally, García-Gómez (2016) and Loftus (2016) showed that the highest seasonal NH3 concentrations occurred in winter, which is related to the presence of livestock in the vicinity [41,42].
At R2 (~1 km north of R1), the atmospheric NH3 concentration reached 56.1 ppb, with a daily average of 18.2 ± 11.5 ppb during the observation period (Figure 2b and Table 1). Compared with the NH3 level observed at R1 and R3, significantly lower atmospheric NH3 concentrations were recorded at R2 (Figure 2). This is because the monitoring site is windward of the pig farm at R1, with no surrounding farms. The atmospheric seasonal NH3 concentration at R2 peaked at 28.5 ± 13.6 ppb in summer, and in June at 30.1 ± 15.0 ppb (Figure S2b), which was approximately two-fold higher than that in the other seasons (15.8 ppb for spring, 11.2 ppb for autumn, and 13.6 ppb for winter), as listed in Table 1. The seasonal variation at R2 was comparable to the variation observed for the peak concentration in winter at the point source of R1, as described above.
At R3 (~1 km south of R1), the daily average NH3 concentration was 30.4 ± 12.1 ppb ranging from 15.6 to 56.3 ppb (Figure 2c). Seasonally, the average NH3 concentrations were 27.5, 38.2, 38.7, and 25.0 ppb in spring, summer, autumn, and winter, respectively, yielding negligible seasonal variations compared with R2 (Table 1). There are several small-scale mechanically ventilated pig farms near small households at R3. Continuous sources from mechanically ventilated small farms likely caused such stable variation. In addition, a higher average daily NH3 concentration was observed at R3 (30.4 ppb) than at R2 (18.2 ppb) during the entire period, as listed in Table 1.
Sites R2 and R3 are located only ~1 km from the NH3 point source at R1, but significantly lower NH3 levels were observed (Figure 2). Previous studies have also observed this pattern of decreasing NH3 concentrations with increasing distance from NH3 emission sources [44,45,46]. For example, López-Aizpún (2018) reported that NH3 concentrations decreased from 74.7 ppb at 30 m to 2.1 ppb at 1000 m distance from livestock [46].

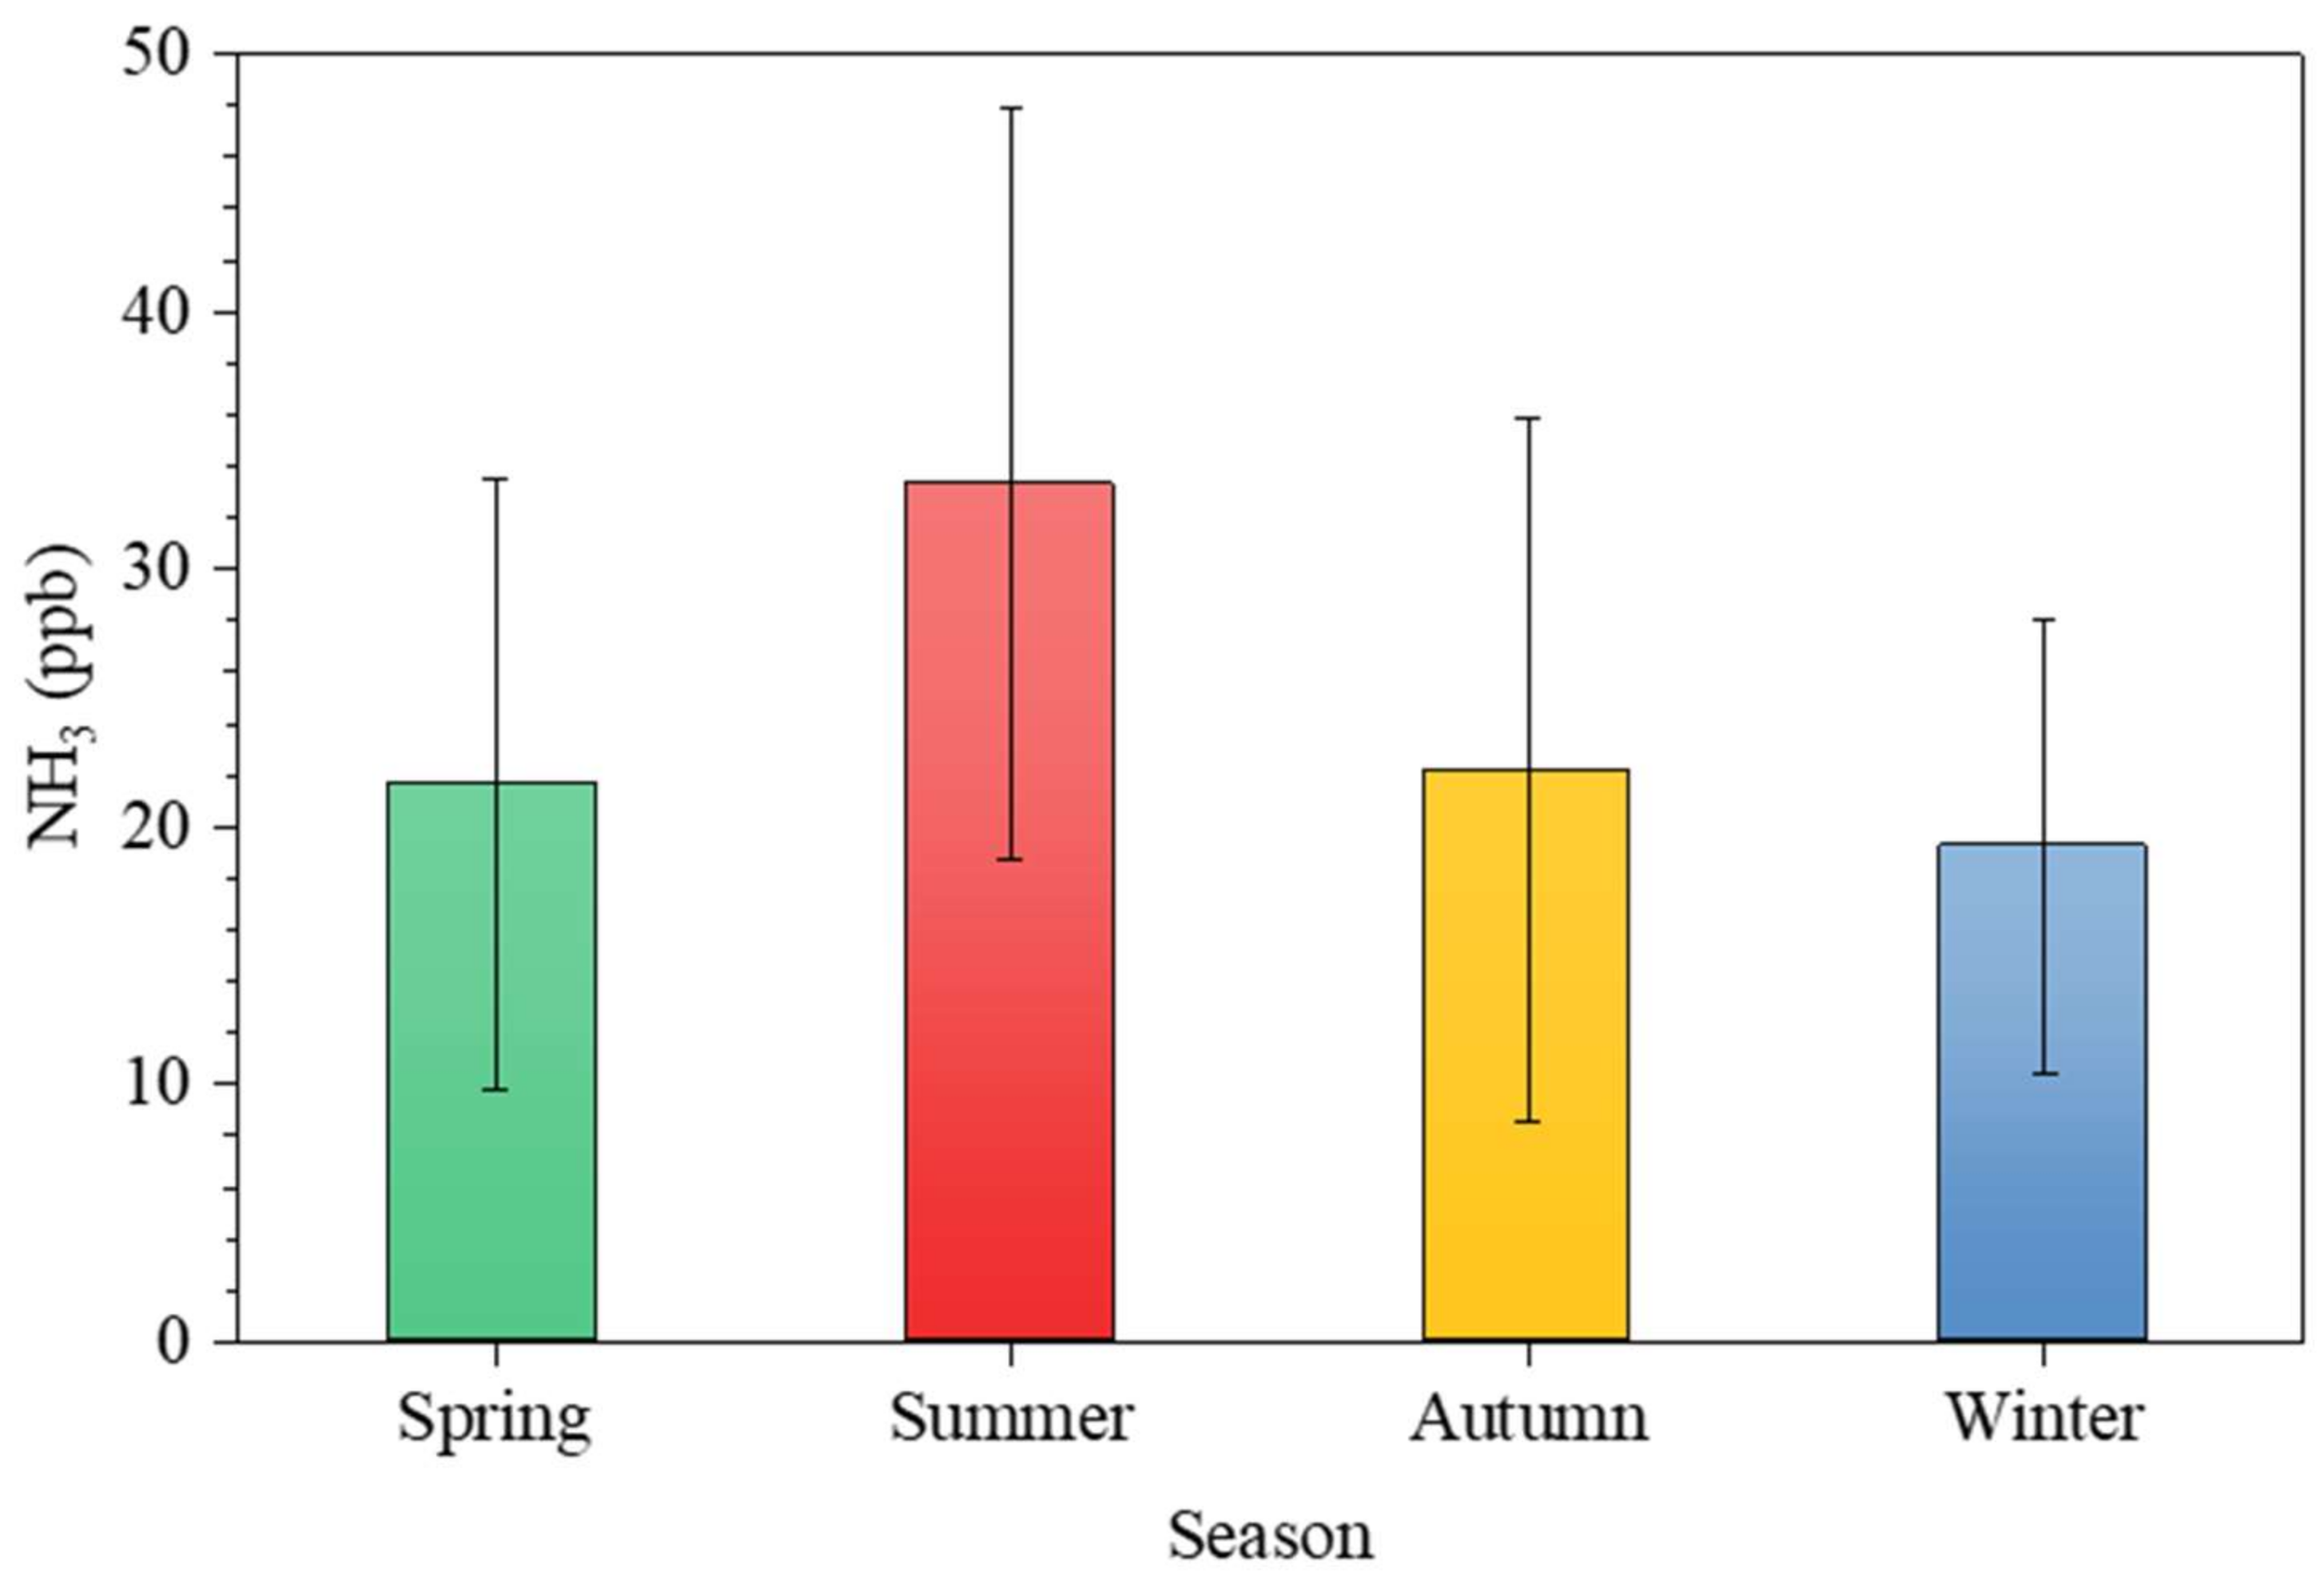
3.2. Comparisons of Atmospheric NH3 Concentrations in Different Environments

In this study, we defined the representative atmospheric NH3 concentration for the rural environment as the average NH3 concentration obtained from sites R2 and R3 in the rural area of Jeongeup. Site R1 was excluded because of its proximity to the NH3 emission source [47,48,49]. Figure 3 shows the seasonal variations in the ambient NH3 values obtained from sites R2 and R3 from September 2019 to August 2020. In the rural environment, the daily mean atmospheric NH3 concentration was 24.2 ± 13.3 ppb, with a seasonal variation of 33.3 ± 14.6 ppb in summer, 22.2 ± 13.6 ppb in autumn, 21.7 ± 11.8 ppb in spring, 19.3 ± 8.8 ppb in winter. Significantly higher NH3 concentrations were observed in summer compared with winter in the rural area. The highest monthly concentration was recorded in June 2020 at 34.2 ± 15.7 ppb (Figure S3).
Many studies have reported a strong positive correlation between the ambient NH3 and temperature; the atmospheric NH3 concentration increased with an increase in the ambient temperature [21,26,30,50]. In summer, high temperatures favor the volatilization of NH3 emitted from various sources, such as agricultural activities, leading to a thermodynamically stable phase state as gaseous NH3, rather than particulate NH4+ in the atmosphere [51,52,53]. Our results for the high NH3 levels recorded in summer is consistent with previous results (Figure 3).
Table 2 summarizes the atmospheric NH3 concentrations observed in various environments in rural (livestock villages), urban, and remote areas. Although the measurement period was different, significantly greater NH3 concentrations were observed in rural areas compared with other environments. For example, in Beijing, China, the average recorded NH3 concentration was 37.0 ppb near the pig facilities [13]. Additionally, in Navarre, Spain, where two high-intensity point-sources of NH3 are located (pig and cattle farms), the average NH3 concentration was 33.8 ppb, with a maximum value of 74.7 ppb [46]. In Colorado, USA, the NH3 had an average concentration of 61.9 ppb, as influenced by emissions from adjacent large concentrated animal feeding operations [54].
The range of NH3 concentrations reported in urban areas is relatively variable, as listed in Table 2. In China, mean annual NH3 concentrations are 7.8 ppb in Shanghai [55] and 15.2 ppb in Nanjing [56]. In Korea, the mean NH3 concentrations in Seoul [15], Mokpo [57], and Jeonju [26] are 11.6, 8.6, and 10.5 ppb, respectively. Compared with other urban areas in Asia, the ambient NH3 concentrations are relatively lower in New York, USA [18], and Douai, France [58], with values of 3.2 and 4.2 ppb, respectively. In some urban areas, diurnal variations in the NH3 concentration are dependent on the traffic emissions, which may be an important NH3 source in urban areas [59,60,61]. Compared with rural and urban areas, significantly lower NH3 levels, i.e., <~5 ppb, have been observed in remote areas, including coastal areas, mountains, and forests (Table 2) [43,47,56,62,63].

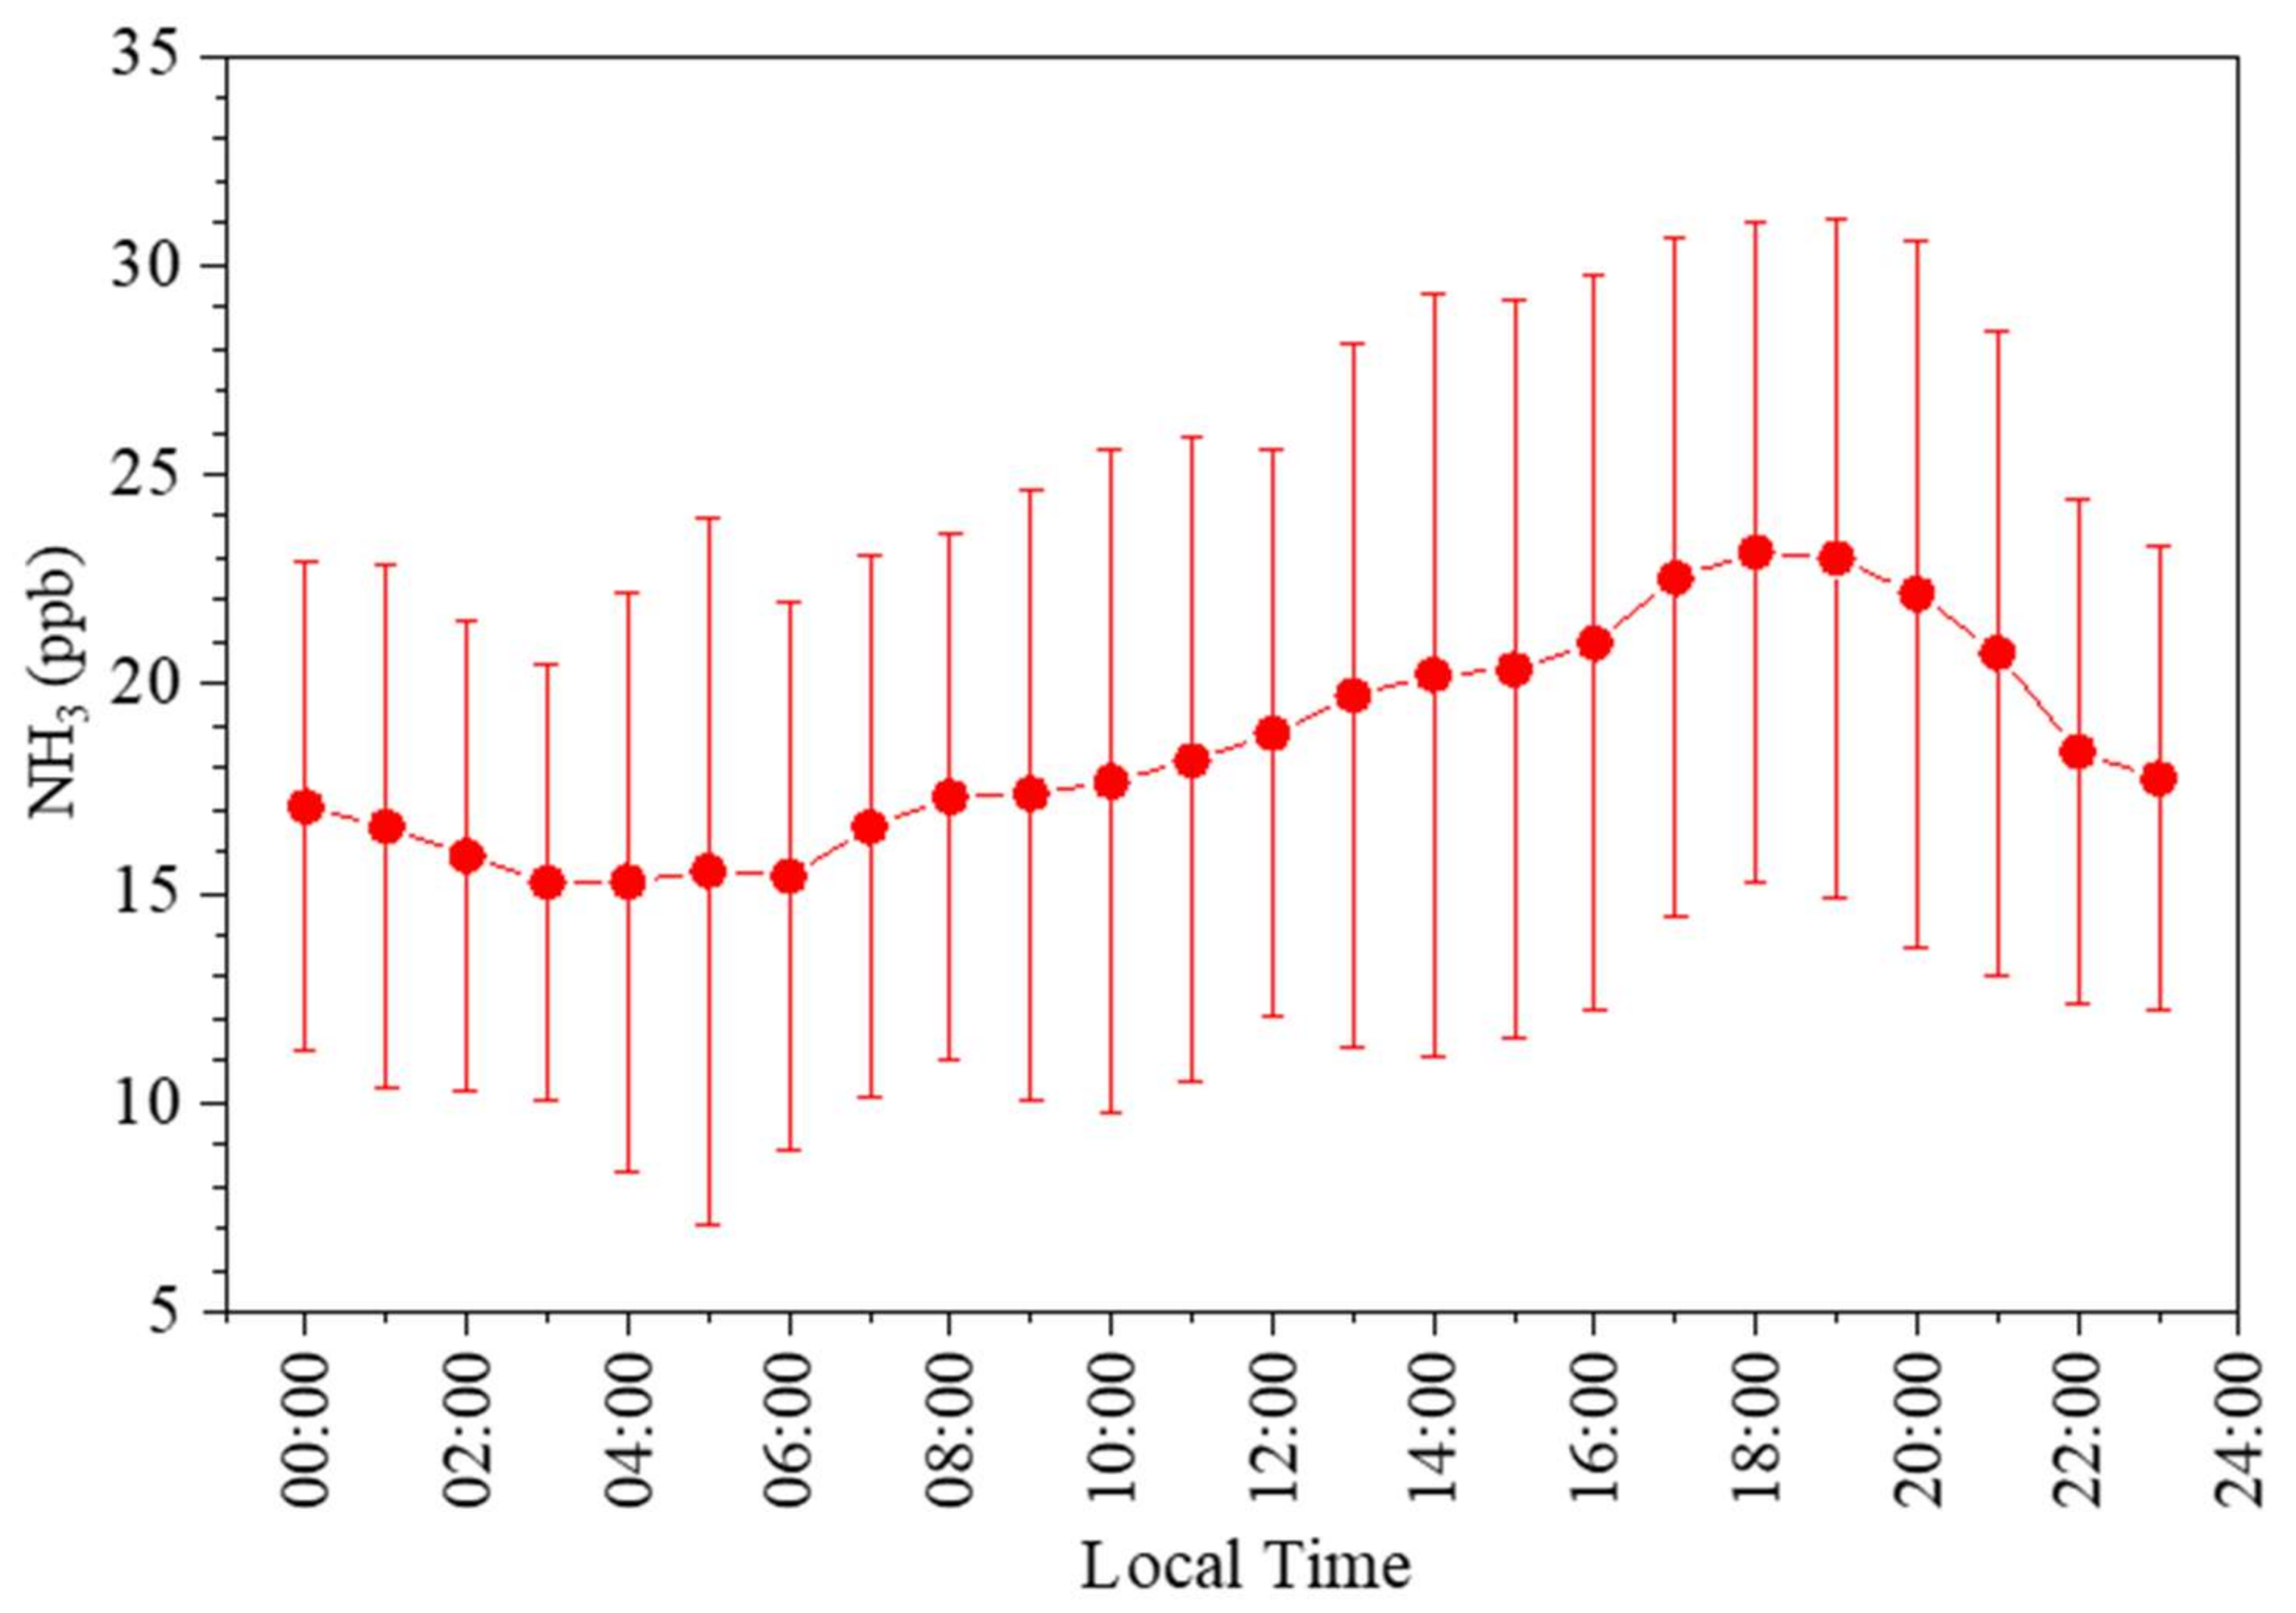
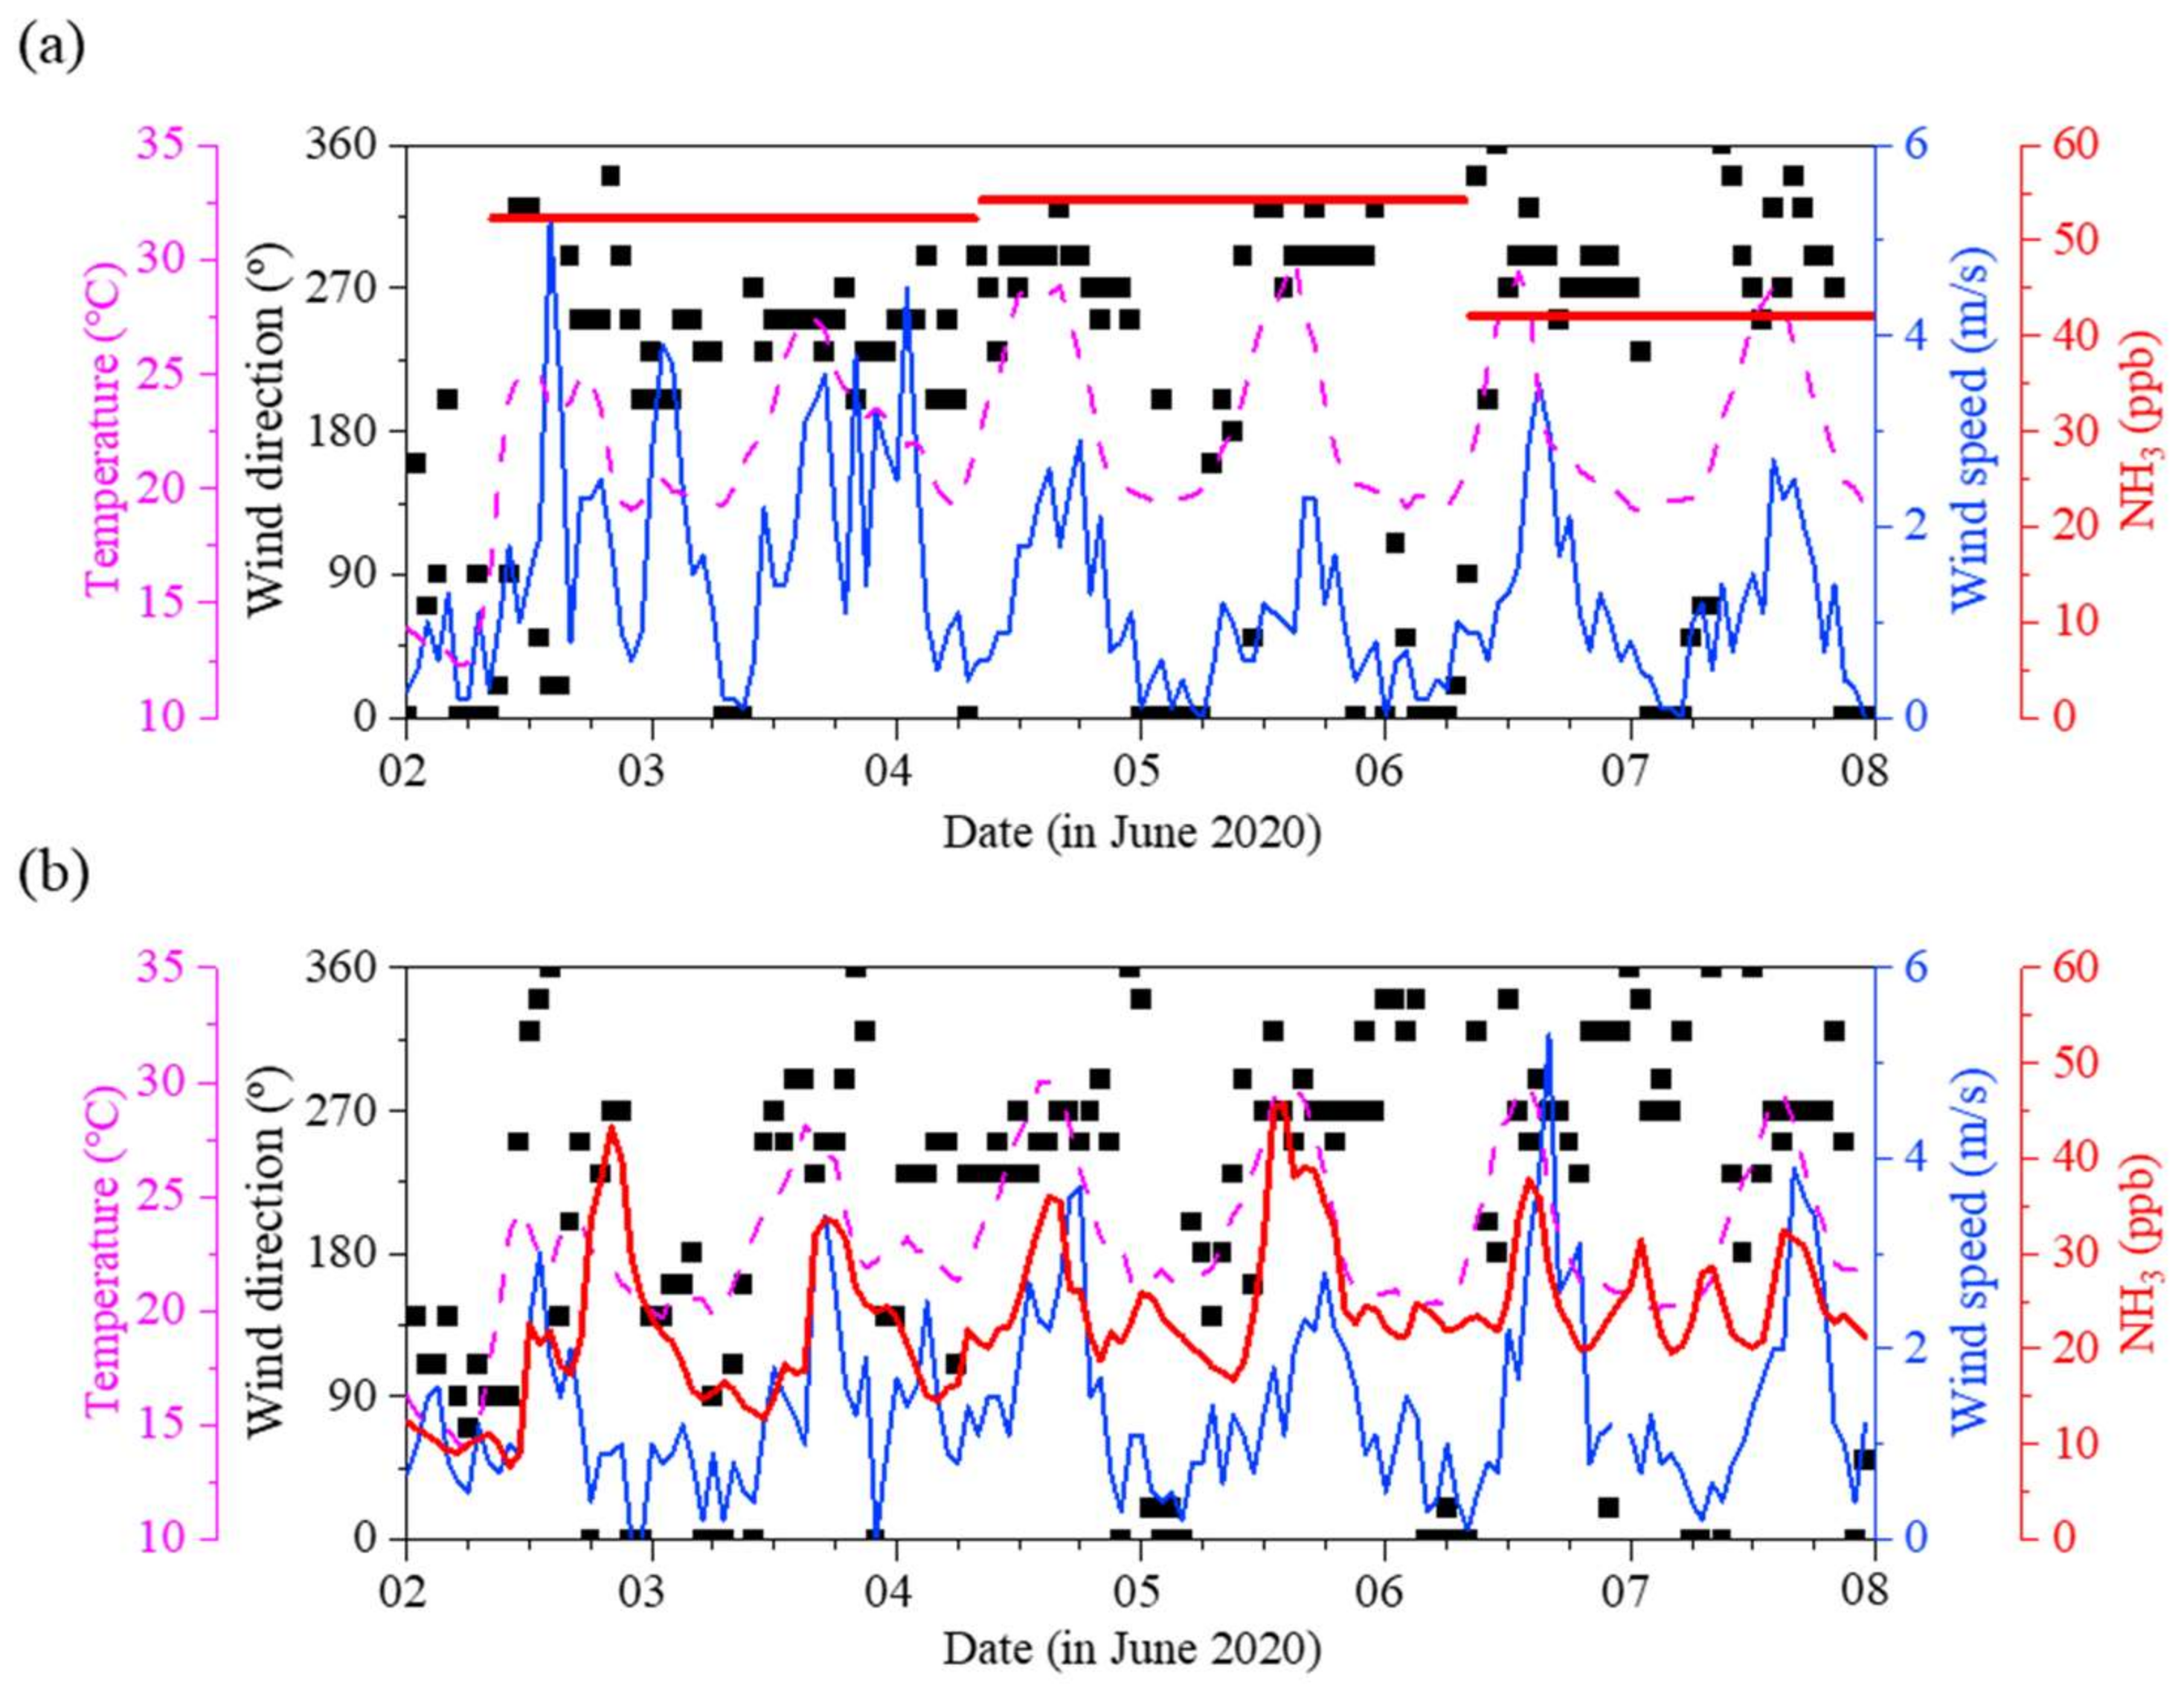
3.3. Impact on NH3 Levels in Nearby Urban Area

As discussed in Section 3.1 and Section 3.2, average seasonal atmospheric NH3 concentrations in the rural area peaked in summer (Figure 3), particularly in June (Figure S3). To investigate whether the high NH3 concentrations observed in the rural area influenced the NH3 levels in nearby urban areas, temporal variations in the atmospheric NH3 were measured using CRDS in a nearby urban area at site U1, Jeonju. Location of the urban monitoring site (U1), which is ~40 km from the rural area, is shown in Figure 1. During 1–30 June 2020, the hourly mean ambient NH3 concentration at site U1 was 18.6 ± 7.8 ppb, with a minimum at approximately the detection limit of ~1 ppb and a maximum of 59.3 ppb (Figure S4).
Figure 4 shows the diurnal variation in the ambient NH3 measured at U1 in June 2020. A high NH3 level was maintained in the afternoon with a mean hourly concentration of >20 ppb from 13:00 to 21:00, with a peak value of 23.1 ppb at 18:00. The NH3 concentration then remained low from night to sunrise. Park (2020) also observed a similar diurnal pattern with a single NH3 peak in the late afternoon in June 2019 at an adjacent site, i.e., Samcheon-dong in Jeonju [26]. This ambient NH3 peak was only measured in an urban area characterized by NH3 transported from an adjacent rural area. Previous studies have hypothesized that a single NH3 peak, appearing in the late afternoon, was caused by NH3 emitted from agricultural activities and the evolution of the planetary boundary layer [66,67,68]. In the morning, farmers in rural areas begin to fertilize their land. As the temperature rises in the afternoon, NH3 volatilizes into the atmosphere, with the occurrence of vertical exchange via extension of the mixing layer. These processes can lead to elevated levels of atmospheric NH3 in rural areas; the increasing NH3 concentrations can then be transported to nearby urban areas with increases in the mixing height and wind direction [26,66,67,68,69].
In this study, based on simultaneous measurements at the rural and urban sites in June, a high NH3 level was recorded at both the rural (daily average of 49.6 ± 5.3 ppb obtained at sites R2 and R3) and U1 (hourly average of 23.2 ± 7.6 ppb) sites from 2 to 8 June (Figure 5). On 2 June, a high daily NH3 concentration of 52.3 ppb in the rural area was recorded with high wind speeds of ≤~5.2 m/s in the afternoon, as shown in Figure 5a. The prevailing wind direction in the rural area then changed from a northeasterly to a southwesterly direction toward the urban site from 2 to 3 June; this was then maintained until 7 June. Throughout the same period, westerly winds were also dominant in the urban area, with low wind speed conditions (average of 1.3 ± 0.9 m/s), and high temperature (average of 23.0 ± 3.5 °C) at U1 (Figure 5b). These stable meteorological conditions in the urban area favored pollutant accumulation, including NH3. This resulted in increasing NH3 concentrations at U1 until 7 June, especially in the late afternoon (Figure 5b), as hypothesized in previous studies [26,66,67,68]. Therefore, based on our simultaneous measurements, the elevated NH3 level in the late afternoon in the urban area was most likely transported from the adjacent rural area. Moreover, the CPF analysis revealed that there is a high probability of NH3 concentrations > 29 ppb (90th percentile) in June (Figure 6). Additionally, the CWT results showed that the high concentration of atmospheric NH3 originated domestically, rather than via long-range transport (Figure S5). These results indicate that the adjacent rural area influenced the high NH3 concentrations observed in the urban area in June.

4. Conclusions

To investigate the spatial distributions of atmospheric NH3 in a rural area, atmospheric NH3 concentrations were analyzed from 95 samples collected using passive samplers at three different sites (R1, R2, and R3) in Jeongeup, South Korea, from September 2019 to August 2020. During the entire period, the average daily NH3 concentrations were 118.7 ± 51.7 ppb at site R1 (boundary of a large-scale pig farm), 18.2 ± 11.5 ppb at site R2 (~1 km north of R1), and 30.4 ± 12.1 ppb at site R3 (~1 km south of R1). Significantly high levels of atmospheric NH3 were recorded at the NH3 emission source of R1 during winter (average of ~141.6 ppb) due to the low ventilation rates and active production of livestock manure. In contrast, there were significant decreases in the atmospheric NH3 concentrations at R2 and R3, even at a distance of only ~1 km from the NH3 emissions source (R1). In this study, we used the average NH3 concentration at sites R2 and R3 to determine the representative atmospheric NH3 concentration in the rural area as R1 is in close proximity to the NH3 emission source. The average atmospheric NH3 concentration of the rural areas (average of sites R2 and R3) was 24.2 ± 13.3 ppb, with a seasonal variation of 33.3 ± 14.6 ppb in summer, 22.2 ± 13.6 ppb in autumn, 21.7 ± 11.8 ppb in spring, and 19.3 ± 8.8 ppb in winter. Particularly, the NH3 concentrations were highest in the summer of June 2020.
To explore the impact of the high NH3 concentrations monitored in the rural area during June on the atmospheric NH3 level in a nearby urban area, atmospheric NH3 concentrations were simultaneously measured in an urban area of Jeonju using a CRDS in June 2020. The hourly mean NH3 concentration in June was 18.6 ± 7.8 ppb in the urban area, where a high level was maintained in the late afternoon. When high NH3 episodes in June occurred at the urban site, elevated NH3 concentrations were also observed in the adjacent rural area. During these episodes from 2 to 8 June, westerly winds were dominant in the urban area with low wind speed conditions and high temperatures, thus leading to stable meteorological conditions. The CPF analysis also showed that there was a high probability of NH3 concentrations in June. Conclusively, the increasing ambient NH3 concentrations observed in the urban area in June were influenced by high NH3 concentrations from the rural area located to the west. These results can provide a more comprehensive understanding of the spatial and temporal distribution of atmospheric NH3 and its impact, as well as a scientific basis to develop effective control strategies for atmospheric NH3 levels.

Supplementary Materials

The following are available online at https://0-www-mdpi-com.brum.beds.ac.uk/article/10.3390/atmos12111411/s1, Figure S1: Monthly meteorological conditions of (a) wind direction (WD) and wind speed (WS), and (b) cumulative precipitation (Pre.), temperature (T), and relative humidity (RH) at Jeongeup in the rural area from September 2019 to August 2020. Figure S2: Monthly variations in ambient NH3 concentrations with standard deviations at the monitoring sites of (a) R1, (b) R2, and (c) R3 in a rural area during September 2019–August 2020. Figure S3: Monthly variations in ambient NH3 concentrations averaged at the rural sites R2 and R3 during September 2019–August 2020. Figure S4: Time series of hourly mean NH3 concentrations measured at the urban (Jeonju) during 1–30 June 2020. Figure S5: Concentration weighted trajectory (CWT) of grid cells (1° × 1°) at 90th percentile for ambient NH3 in urban (Jeonju) during June 2020. The color bar indicates ambient NH3 concentrations.

Author Contributions

M.S. designed this study. S.O., M.S., S.-G.K., J.B.L., J.P., J.-B.J., S.-W.H. and K.-S.K. conducted measurements and analyzed the data. M.S. and S.O. prepared the manuscript with contributions of all coauthors. All authors have read and agreed to the published version of the manuscript.

Funding

This Research was supported by the Cooperative Research Program for Agriculture Science and Technology Development (PJ014248022021) funded by the Rural Development Administration, Republic of Korea, the Technology Development Program to Solve Climate Changes of the National Research Foundation (NRF) funded by the Korea government (MSIT) (NRF-2019M1A2A2103956), and Cooperation project 2021year ‘Construction Project based on the research of Biological Toxicity of Particulate Matter’ funded by Korea Institute of Toxicology (KK-2103).

Institutional Review Board Statement

Not applicable.

Informed Consent Statement

Not applicable.

Data Availability Statement

Publicly available meteorological archived datasets analyzed in this study can be found at https://data.kma.go.kr (accessed on 13 May 2021). The publicly available Hybrid Single-Particle Lagrangian Integrated Trajectory (HYSPLIT) model can be found at https://www.ready.noaa.gov/HYSPLIT.php (accessed on 13 May 2021) and run either online or offline. The data can be found from the link: ftp://arlftp.arlhq.noaa.gov/pub/archives/gdas1/ (accessed on 13 May 2021).

Acknowledgments

M.S. thank Sung-Man Kim for helpful discussion.

Conflicts of Interest

The authors declare no conflict of interest.

References

  1. Park, R.S.; Lee, S.; Shin, S.-K.; Song, C.H. Contribution of ammonium nitrate to aerosol optical depth and direct radiative forcing by aerosols over East Asia. Atmos. Chem. Phys. Discuss. 2014, 14, 2185–2201. [Google Scholar] [CrossRef] [Green Version]
  2. Xu, L.; Penner, J.E. Global simulations of nitrate and ammonium aerosols and their radiative effects. Atmos. Chem. Phys. Discuss. 2012, 12, 9479–9504. [Google Scholar] [CrossRef] [Green Version]
  3. Bhattarai, G.; Lee, J.B.; Kim, M.-H.; Ham, S.; So, H.-S.; Oh, S.; Sim, H.-J.; Lee, J.-C.; Song, M.; Kook, S.-H. Maternal exposure to fine particulate matter during pregnancy induces progressive senescence of hematopoietic stem cells under preferential impairment of the bone marrow microenvironment and aids development of myeloproliferative disease. Leukemia 2019, 34, 1481–1484. [Google Scholar] [CrossRef] [PubMed] [Green Version]
  4. Xu, R.; Tian, H.; Pan, S.; Prior, S.; Feng, Y.; Batchelor, W.D.; Chen, J.; Yang, J. Global ammonia emissions from synthetic nitrogen fertilizer applications in agricultural systems: Empirical and process-based estimates and uncertainty. Glob. Chang. Biol. 2018, 25, 314–326. [Google Scholar] [CrossRef] [Green Version]
  5. Bouwman, L.; Lee, D.S.; Asman, W.A.H.; Dentener, F.J.; Van Der Hoek, K.W.; Olivier, J.G.J. A global high-resolution emission inventory for ammonia. Glob. Biogeochem. Cycles 1997, 11, 561–587. [Google Scholar] [CrossRef]
  6. Paulot, F.; Jacob, D.J.; Pinder, R.W.; Bash, J.O.; Travis, K.; Henze, D.K. Ammonia emissions in the United States, European Union, and China derived by high-resolution inversion of ammonium wet deposition data: Interpretation with a new agricultural emissions inventory (MASAGE_NH3). J. Geophys. Res. Atmos. 2014, 119, 4343–4364. [Google Scholar] [CrossRef]
  7. Ianniello, A.; Spataro, F.; Esposito, G.; Allegrini, I.; Rantica, E.; Ancora, M.P.; Hu, M.; Zhu, T. Occurrence of gas phase ammonia in the area of Beijing (China). Atmos. Chem. Phys. Discuss. 2010, 10, 9487–9503. [Google Scholar] [CrossRef] [Green Version]
  8. Pandolfi, M.; Amato, F.; Reche, C.; Alastuey, A.; Otjes, R.P.; Blom, M.J.; Querol, X. Summer ammonia measurements in a densely populated Mediterranean city. Atmos. Chem. Phys. Discuss. 2012, 12, 7557–7575. [Google Scholar] [CrossRef] [Green Version]
  9. Aas, W.; Mortier, A.; Bowersox, V.; Cherian, R.; Faluvegi, G.; Fagerli, H.; Hand, J.; Klimont, Z.; Galy-Lacaux, C.; Lehmann, C.M.B.; et al. Global and regional trends of atmospheric sulfur. Sci. Rep. 2019, 9, 953. [Google Scholar] [CrossRef]
  10. Georgoulias, A.K.; van der A, R.J.; Stammes, P.; Boersma, K.F.; Eskes, H.J. Trends and trend reversal detection in 2 decades of tropospheric NO2 satellite observations. Atmos. Chem. Phys. Discuss. 2019, 19, 6269–6294. [Google Scholar] [CrossRef] [Green Version]
  11. Warner, J.X.; Dickerson, R.R.; Wei, Z.; Strow, L.L.; Wang, Y.; Liang, Q. Increased atmospheric ammonia over the world’s major agricultural areas detected from space. Geophys. Res. Lett. 2017, 44, 2875–2884. [Google Scholar] [CrossRef]
  12. Sutton, M.A.; Reis, S.; Riddick, S.N.; Dragosits, U.; Nemitz, E.; Theobald, M.R.; Tang, Y.S.; Braban, C.; Vieno, M.; Dore, A.J.; et al. Towards a climate-dependent paradigm of ammonia emission and deposition. Philos. Trans. R. Soc. B Biol. Sci. 2013, 368, 20130166. [Google Scholar] [CrossRef]
  13. Xu, W.; Zheng, K.; Liu, X.; Meng, L.; Huaitalla, R.M.; Shen, J.; Hartung, E.; Gallmann, E.; Roelcke, M.; Zhang, F. Atmospheric NH3 dynamics at a typical pig farm in China and their implications. Atmos. Pollut. Res. 2014, 5, 455–463. [Google Scholar] [CrossRef] [Green Version]
  14. Kubota, T.; Kuroda, H.; Watanabe, M.; Takahashi, A.; Nakazato, R.; Tarui, M.; Matsumoto, S.; Nakagawa, K.; Numata, Y.; Ouchi, T.; et al. Role of advection in atmospheric ammonia: A case study at a Japanese lake basin influenced by agricultural ammonia sources. Atmos. Environ. 2020, 243, 117856. [Google Scholar] [CrossRef]
  15. Phan, N.-T.; Kim, K.-H.; Shon, Z.-H.; Jeon, E.-C.; Jung, K.; Kim, N.-J. Analysis of ammonia variation in the urban atmosphere. Atmos. Environ. 2013, 65, 177–185. [Google Scholar] [CrossRef]
  16. Lonati, G.; Cernuschi, S. Temporal and spatial variability of atmospheric ammonia in the Lombardy region (Northern Italy). Atmos. Pollut. Res. 2020, 11, 2154–2163. [Google Scholar] [CrossRef]
  17. Meng, Z.Y.; Lin, W.L.; Jiang, X.M.; Yan, P.; Wang, Y.; Zhang, Y.M.; Jia, X.F.; Yu, X.L. Characteristics of atmospheric ammonia over Beijing, China. Atmos. Chem. Phys. Discuss. 2011, 11, 6139–6151. [Google Scholar] [CrossRef] [Green Version]
  18. Zhou, C.; Zhou, H.; Holsen, T.M.; Hopke, P.K.; Edgerton, E.S.; Schwab, J.J. Ambient Ammonia Concentrations Across New York State. J. Geophys. Res. Atmos. 2019, 124, 8287–8302. [Google Scholar] [CrossRef] [Green Version]
  19. Clean Air Policy Support System (CAPSS). 2017 Korea National Air Pollutants Emission. 2019. Available online: https://airemiss.nier.go.kr (accessed on 1 May 2021).
  20. Korean Statistical Information Service (KOSIS). Available online: https://kosis.kr (accessed on 1 May 2021).
  21. Chang, Y.; Zou, Z.; Zhang, Y.; Deng, C.; Hu, J.; Shi, Z.; Dore, A.J.; Collett, J.L. Assessing Contributions of Agricultural and Nonagricultural Emissions to Atmospheric Ammonia in a Chinese Megacity. Environ. Sci. Technol. 2019, 53, 1822–1833. [Google Scholar] [CrossRef]
  22. Pan, Y.; Gu, M.; He, Y.; Wu, D.; Liu, C.; Song, L.; Tian, S.; Lü, X.; Sun, Y.; Song, T.; et al. Revisiting the Concentration Observations and Source Apportionment of Atmospheric Ammonia. Adv. Atmos. Sci. 2020, 37, 933–938. [Google Scholar] [CrossRef]
  23. Kure, J.L.; Krabben, J.; Pedersen, S.V.; Carozzi, M.; Sommer, S.G. An Assessment of Low-Cost Techniques to Measure Ammonia Emission from Multi-Plots: A Case Study with Urea Fertilization. Agronomy 2018, 8, 245. [Google Scholar] [CrossRef] [Green Version]
  24. Puchalski, M.A.; Sather, M.E.; Walker, J.; Lehmann, C.M.B.; Gay, D.A.; Mathew, J.; Robarge, W.P. Passive ammonia monitoring in the United States: Comparing three different sampling devices. J. Environ. Monit. 2011, 13, 3156–3167. [Google Scholar] [CrossRef]
  25. Pan, Y.; Gu, M.; Song, L.; Tian, S.; Wu, D.; Walters, W.W.; Yu, X.; Lü, X.; Ni, X.; Wang, Y.; et al. Systematic low bias of passive samplers in characterizing nitrogen isotopic composition of atmospheric ammonia. Atmos. Res. 2020, 243, 105018. [Google Scholar] [CrossRef]
  26. Park, J.; Ryoo, J.; Jee, J.; Song1, M. Origins and Distributions of Atmospheric Ammonia in Jeonju during 2019~2020. J. Korean Soc. Atmos. Environ. 2020, 36, 262–274. [Google Scholar] [CrossRef]
  27. Picarro Inc. G2103 Analyzer Datasheet—G2103-DS20-V1.2-AHDS-190917. 2019. Available online: http://www.picarro.com (accessed on 1 May 2021).
  28. Polissar, A. The aerosol at Barrow, Alaska: Long-term trends and source locations. Atmos. Environ. 1999, 33, 2441–2458. [Google Scholar] [CrossRef]
  29. Sen, A.; Ahammed, Y.N.; Banerjee, T.; Chatterjee, A.; Choudhuri, A.K.; Das, T.; Deb, N.C.; Dhir, A.; Goel, S.; Khan, A.H.; et al. Spatial variability in ambient atmospheric fine and coarse mode aerosols over Indo-Gangetic plains, India and adjoining oceans during the onset of summer monsoons. Atmos. Pollut. Res. 2016, 7, 521–532. [Google Scholar] [CrossRef]
  30. Wang, S.; Nan, J.; Shi, C.; Fu, Q.; Gao, S.; Wang, D.; Cui, H.; Saiz-Lopez, A.; Zhou, B. Atmospheric ammonia and its impacts on regional air quality over the megacity of Shanghai, China. Sci. Rep. 2015, 5, 15842. [Google Scholar] [CrossRef] [Green Version]
  31. Meng, Z.; Xu, X.; Lin, W.; Ge, B.; Xie, Y.; Song, B.; Jia, S.; Zhang, R.; Peng, W.; Wang, Y.; et al. Role of ambient ammonia in particulate ammonium formation at a rural site in the North China Plain. Atmos. Chem. Phys. Discuss. 2018, 18, 167–184. [Google Scholar] [CrossRef] [Green Version]
  32. Xu, W.; Wu, Q.; Liu, X.; Tang, A.; Dore, A.J.; Heal, M. Characteristics of ammonia, acid gases, and PM2.5 for three typical land-use types in the North China Plain. Environ. Sci. Pollut. Res. 2015, 23, 1158–1172. [Google Scholar] [CrossRef] [Green Version]
  33. Sung, M.Y.; Park, J.S.; Lim, J.H.; Park, H.Y.; Cho, S.Y. A Long Term Trend of Gaseous and Particulate Acid/Base Species and Effects of Ammonia Reduction on Nitrate Contained in PM~2018. J. Korean Soc. Atmos. Environ. 2020, 36, 249–261. [Google Scholar] [CrossRef]
  34. Redwine, J.S.; Lacey, R.E.; Mukhtar, S.; Carey, J.B. Concentration and emissions of ammonia and particulate matter in tunnel–ventilated broiler houses under summer conditions in Texas. Trans. ASAE 2002, 45, 1101. [Google Scholar] [CrossRef] [Green Version]
  35. Liang, Y.; Xin, H.; Tanaka, A.; Lee, S.H.; Li, H.; Wheeler, E.F.; Gates, R.S.; Zajaczkowski, J.S.; Topper, P.; Casey, K.D. Ammonia emissions from U.S. poultry houses: Part II—Layer houses. In Proceedings of the 3rd International Conference on Air Pollution from Agricultural Operations, Raleigh, NC, USA, 12–15 October 2003; pp. 147–158. [Google Scholar]
  36. Coufal, C.D.; Chavez, C.; Niemeyer, P.R.; Carey, J.B. Nitrogen emissions from broilers measured by mass balance over eighteen consecutive flocks. Poult. Sci. 2006, 85, 384–391. [Google Scholar] [CrossRef] [PubMed]
  37. Carr, L.E.; Wheaton, F.W.; Douglass, L.W. Empirical models to determine ammonia concentrations from broiler chicken litter. Trans. ASAE 1990, 33, 1337–1342. [Google Scholar] [CrossRef]
  38. Knížatová, M.; Mihina, Š.; Brouček, J.; Karandušovská, I.; Mačuhová, J. The influence of litter age, litter temperature and ventilation rate on ammonia emissions from a broiler rearing facility. Czech J. Anim. Sci. 2010, 55, 337–345. [Google Scholar] [CrossRef] [Green Version]
  39. Jang, D.H.; Kwon, K.S.; Kim, J.B.; Kim, J.K.; Yang, K.Y.; Choi, S.M.; Jang, Y. Investigation and Analysis of Particulate-matters and Ammonia Concentrations in Mechanically Ventilated Broiler House According to Seasonal Change, Measurement Locations and Age of Broilers. J. Korean Soc. Agric. Eng. 2021, 63, 75–87. [Google Scholar]
  40. Jeong, D.-H.; Lee, Y.; Lee, C.; Choi, S.-A.; Kim, M.; Lee, Y.; Kim, M.; Yu, S. Environmental impact of livestock manure and organic fertilizer use on the Masan stream watershed. J. Environ. Impact Assess. 2014, 23, 75–87. [Google Scholar] [CrossRef] [Green Version]
  41. García-Gómez, H.; Aguillaume, L.; Rojano, S.I.; Valiño, F.; Avila, A.; Elustondo, D.; Santamaría, J.M.; Alastuey, A.; Calvete, H.; Fernández, I.G.; et al. Atmospheric pollutants in peri-urban forests of Quercus ilex: Evidence of pollution abatement and threats for vegetation. Environ. Sci. Pollut. Res. 2015, 23, 6400–6413. [Google Scholar] [CrossRef] [Green Version]
  42. Loftus, C.; Yost, M.G.; Sampson, P.D.; Torres, E.; Arias, G.; Vasquez, V.B.; Hartin, K.; Armstrong, J.L.; Tchong-French, M.; Vedal, S.; et al. Ambient Ammonia Exposures in an Agricultural Community and Pediatric Asthma Morbidity. Epidemiology 2015, 26, 794–801. [Google Scholar] [CrossRef]
  43. Park, J.; Oh, S.-M.; Bae, M.-S.; Lim, Y.-J.; Chang, Y.; Song, M. Spatial Distribution of Atmospheric Ammonia using Passive Samplers in Jeollabuk-do. J. Korean Soc. Atmos. Environ. 2021, 37, 626–636. [Google Scholar] [CrossRef]
  44. Frati, L.; Santoni, S.; Nicolardi, V.; Gaggi, C.; Brunialti, G.; Guttova, A.; Gaudino, S.; Pati, A.; Pirintsos, S.; Loppi, S. Lichen biomonitoring of ammonia emission and nitrogen deposition around a pig stockfarm. Environ. Pollut. 2007, 146, 311–316. [Google Scholar] [CrossRef]
  45. Theobald, M.R.; Sanz-Cobena, A.; Vallejo, A.; Sutton, A. Suitability and uncertainty of two models for the simulation of ammonia dispersion form a pig farm located in an area with frequent calm conditions. Atmos. Environ. 2015, 102, 167–175. [Google Scholar] [CrossRef] [Green Version]
  46. López-Aizpún, M.; Arango-Mora, C.; Santamaría, C.; Lasheras, E.; Santamaría, J.; Ciganda, V.; Cárdenas, L.; Elustondo, D. Atmospheric ammonia concentration modulates soil enzyme and microbial activity in an oak forest affecting soil microbial biomass. Soil Biol. Biochem. 2018, 116, 378–387. [Google Scholar] [CrossRef]
  47. Yao, X.; Zhang, L. Trends in atmospheric ammonia at urban, rural, and remote sites across North America. Atmos. Chem. Phys. Discuss. 2016, 16, 11465–11475. [Google Scholar] [CrossRef] [Green Version]
  48. Kim, Y.; Seo, J.; Kim, J.Y.; Lee, J.Y.; Kim, H.; Kim, B.M. Characterization of PM2.5 and identification of transported secondary and biomass burning contribution in Seoul, Korea. Environ. Sci. Pollut. Res. 2017, 25, 4330–4343. [Google Scholar] [CrossRef]
  49. Payne, B.F.; Ackley, R.; Wicker, A.P.; Hildenbrand, Z.L.; Carlton, D.D.; Schug, K.A. Characterization of methane plumes downwind of natural gas compressor stations in Pennsylvania and New York. Sci. Total Environ. 2017, 580, 1214–1221. [Google Scholar] [CrossRef]
  50. Wang, R.; Ye, X.; Liu, Y.; Li, H.; Yang, X.; Chen, J.; Gao, W.; Yin, Z. Characteristics of atmospheric ammonia and its relationship with vehicle emissions in a megacity in China. Atmos. Environ. 2018, 182, 97–104. [Google Scholar] [CrossRef]
  51. Huang, C.; Chen, C.H.; Li, L.; Cheng, Z.; Wang, H.L.; Huang, H.Y.; Streets, D.G.; Wang, Y.J.; Zhang, G.F.; Chen, Y.R. Emission inventory of anthropogenic air pollutants and VOC species in the Yangtze River Delta region, China. Atmos. Chem. Phys. Discuss. 2011, 11, 4105–4120. [Google Scholar] [CrossRef] [Green Version]
  52. Seinfeld, J.H.; Pandis, S.N.; Noone, K. Atmospheric Chemistry and Physics: From Air Pollution to Climate Change. Phys. Today 1998, 51, 88–90. [Google Scholar] [CrossRef]
  53. Behera, S.N.; Betha, R.; Balasubramanian, R. Insights into Chemical Coupling among Acidic Gases, Ammonia and Secondary Inorganic Aerosols. Aerosol Air Qual. Res. 2013, 13, 1282–1296. [Google Scholar] [CrossRef]
  54. Li, Y.; Thompson, T.M.; Van Damme, M.; Chen, X.; Benedict, K.B.; Shao, Y.; Day, D.; Boris, A.; Sullivan, A.P.; Ham, J.; et al. Temporal and spatial variability of ammonia in urban and agricultural regions of northern Colorado, United States. Atmos. Chem. Phys. Discuss. 2017, 17, 6197–6213. [Google Scholar] [CrossRef] [Green Version]
  55. Chang, Y.; Zou, Z.; Deng, C.; Huang, K.; Collett, J.L.; Lin, J.; Zhuang, G. The importance of vehicle emissions as a source of atmospheric ammonia in the megacity of Shanghai. Atmos. Chem. Phys. Discuss. 2016, 16, 3577–3594. [Google Scholar] [CrossRef] [Green Version]
  56. Pan, Y.; Tian, S.; Zhao, Y.; Zhang, L.; Zhu, X.; Gao, J.; Huang, W.; Zhou, Y.; Song, Y.; Zhang, Q.; et al. Identifying Ammonia Hotspots in China Using a National Observation Network. Environ. Sci. Technol. 2018, 52, 3926–3934. [Google Scholar] [CrossRef] [Green Version]
  57. Song, M.; Kim, M.; Kim, M.; Lee, K.-H.; Bae, M.-S. Relationship between Long-range Transport of Ammonia and Ammonium in Wintertime in Suburban Area. J. Korean Soc. Atmos. Environ. 2020, 36, 543–557. [Google Scholar] [CrossRef]
  58. Rodelas, R.R.; Perdrix, E.; Herbin, B.; Riffault, V. Characterization and variability of inorganic aerosols and their gaseous precursors at a suburban site in northern France over one year (2015–2016). Atmos. Environ. 2018, 200, 142–157. [Google Scholar] [CrossRef]
  59. Liu, T.; Wang, X.; Wang, B.; Ding, X.; Deng, W.; Lü, S.; Zhang, Y. Emission factor of ammonia (NH3) from on-road vehicles in China: Tunnel tests in urban Guangzhou. Environ. Res. Lett. 2014, 9, 064027. [Google Scholar] [CrossRef]
  60. Phillips, F.A.; Naylor, T.; Forehead, H.; Griffith, D.W.T.; Kirkwood, J.; Paton-Walsh, C. Vehicle Ammonia Emissions Measured in An Urban Environment in Sydney, Australia, Using Open Path Fourier Transform Infra-Red Spectroscopy. Atmosphere 2019, 10, 208. [Google Scholar] [CrossRef] [Green Version]
  61. Kotnala, G.; Sharma, S.K.; Mandal, T.K. Influence of Vehicular Emissions (NO, NO2, CO and NMHCs) on the Mixing Ratio of Atmospheric Ammonia (NH3) in Delhi, India. Arch. Environ. Contam. Toxicol. 2019, 78, 79–85. [Google Scholar] [CrossRef]
  62. Xu, W.; Luo, X.S.; Pan, Y.P.; Zhang, L.; Tang, A.H.; Shen, J.L.; Zhang, Y.; Li, K.H.; Wu, Q.H.; Yang, D.W.; et al. Quantifying atmospheric nitrogen deposition through a nationwide monitoring network across China. Atmos. Chem. Phys. Discuss. 2015, 15, 12345–12360. [Google Scholar] [CrossRef] [Green Version]
  63. Hansen, K.; Pryor, S.; Boegh, E.; Hornsby, K.; Jensen, B.; Sørensen, L. Background concentrations and fluxes of atmospheric ammonia over a deciduous forest. Agric. For. Meteorol. 2015, 214–215, 380–392. [Google Scholar] [CrossRef]
  64. Xu, J.; Chen, J.; Zhao, N.; Wang, G.; Yu, G.; Li, H.; Huo, J.; Lin, Y.; Fu, Q.; Guo, H.; et al. Importance of Ammonia Gas-Particle Conversion Ratio in Haze Formation in the Rural Agricultural Environment. Atmos. Chem. Phys. Discuss. 2020, 3, 1–21. [Google Scholar] [CrossRef] [Green Version]
  65. Saraswati; Sharma, S.; Saxena, M.; Mandal, T. Characteristics of gaseous and particulate ammonia and their role in the formation of secondary inorganic particulate matter at Delhi, India. Atmos. Res. 2018, 218, 34–49. [Google Scholar] [CrossRef]
  66. Zhang, Y.; Tang, A.; Wang, D.; Wang, Q.; Benedict, K.; Zhang, L.; Liu, D.; Li, Y.; Collett, J.L., Jr.; Sun, Y.; et al. The vertical variability of ammonia in urban Beijing, China. Atmos. Chem. Phys. Discuss. 2018, 18, 16385–16398. [Google Scholar] [CrossRef] [Green Version]
  67. Dammers, E.; Schaap, M.; Haaima, M.; Palm, M.; Kruit, R.W.; Volten, H.; Hensen, A.; Swart, D.; Erisman, J. Measuring atmospheric ammonia with remote sensing campaign: Part 1—Characterisation of vertical ammonia concentration profile in the centre of The Netherlands. Atmos. Environ. 2017, 169, 97–112. [Google Scholar] [CrossRef]
  68. Shephard, M.W.; Dammers, E.; Cady-Pereira, K.E.; Kharol, S.K.; Thompson, J.; Gainariu-Matz, Y.; Zhang, J.; McLinden, C.A.; Kovachik, A.; Moran, M.; et al. Ammonia measurements from space with the Cross-track Infrared Sounder: Characteristics and applications. Atmos. Chem. Phys. Discuss. 2020, 20, 2277–2302. [Google Scholar] [CrossRef] [Green Version]
  69. Zöll, U.; Brümmer, C.; Schrader, F.; Ammann, C.; Ibrom, A.; Flechard, C.R.; Nelson, D.D.; Zahniser, M.; Kutsch, W.L. Surface–atmosphere exchange of ammonia over peatland using QCL-based eddy-covariance measurements and inferential modeling. Atmos. Chem. Phys. Discuss. 2016, 16, 11283–11299. [Google Scholar] [CrossRef] [Green Version]
Figure 1. Location and map of the monitoring sites in the rural (Jeongeup) and urban (Jeonju) areas of Jeollabuk-do, South Korea. Colors on the map indicate the NH3 emissions for 2017 based on the emissions inventory of South Korea in CAPSS 2017 [19].
Atmosphere 12 01411 g001
Figure 2. Sample-specific concentrations of atmospheric NH3 collected by passive samplers at three different locations in the rural area: (a) R1, (b) R2, and (c) R3. Pink region: autumn; blue region: winter; yellow region: spring; and green region: summer. The yellow triangle indicates the location of the target pig farm.
Atmosphere 12 01411 g002
Figure 3. Seasonal variations in the average atmospheric NH3 at rural sites R2 and R3 from September 2019 to August 2020. Each error bar indicates the standard deviation.
Atmosphere 12 01411 g003
Figure 4. Hourly concentrations and standard deviations of the atmospheric NH3 in the urban area of Jeonju from 1–30 June 2020.
Atmosphere 12 01411 g004
Figure 5. Events of high atmospheric NH3 concentrations for the (a) rural average at sites R2 and R3 (Jeongeup) measured by passive samplers and (b) urban (Jeonju) area measured by CRDS from 2–8 June 2020. Temperature (pink-dashed lines), wind direction (black dots), wind speed (blue lines), and NH3 concentrations (red lines) are included.
Atmosphere 12 01411 g005
Figure 6. Conditional probability function (CPF) result at the 90th percentile for the atmospheric NH3 during June 2020 in Jeonju (Urban).
Atmosphere 12 01411 g006
Table 1. Monitoring sites and average seasonal NH3 concentrations with their standard deviations (ppb) from September 2019 to August 2020. Spring: March to May 2020, Summer: June and August 2020, Autumn: September 2019, Winter: December 2019 to February 2020. The number of samples is mentioned in parentheses. “-” indicates no data available. CRDS is cavity ring down spectroscopy.
RuralUrban
SitesR1R2R3U1
Site descriptionBoundary of a large-scale pig farm~1 km north of R1~1 km south of R1Jeonbuk National University, Jeonju
MethodologyPassive samplerPassive samplerPassive samplerCRDS
Spring100.5 ± 43.0 (9)15.8 ± 9.4 (9)27.5 ± 11.0 (9)-
Summer128.6 ± 36.9 (9)28.5 ± 13.6 (9)38.2 ± 13.9 (9)18.6 ± 7.8 *
Autumn60.3 ± 12.8 (3)11.2 ± 1.7 (3)38.7 ± 2.0 (2)-
Winter141.6 ± 57.5 (11)13.6 ± 5.6 (11)25.0 ± 7.6 (11)-
Average during
whole periods
118.7 ± 51.7 (32)18.2 ± 11.5 (32)30.4 ± 12.1 (31)18.6 ± 7.8 *
* Measurement period: 1–30 June 2020.
Table 2. Summary of atmospheric NH3 concentrations in different environments. LGR: Logic gates as repeater; CRDS: Cavity ring-down spectroscopy; and MARGA: Monitor for aerosols and gases in ambient air.
LocationPeriodMethodNH3 Conc.
(Mean ± Std)
(unit: ppb)
Reference
Rural (Livestock Villages)
Jeongeup, Korea2019.9–2020.8Passive sampler24.2 ± 13.3This study
Beijing, China2009.4–2011.9Passive sampler37.0 ± 17.2Xu et al., 2014 [13]
Gucheng, China2013.5–9LGR36.2 ± 56.4Meng et al., 2018 [31]
Gyeonggi, Korea2009.1–2018.123-stages filter pack52.9Sung et al., 2020 [33]
Navarre, Spain2013.7–2015.7Passive sampler33.8 ± 24.0López-Aizpú et al., 2018 [46]
Colorado, USA2010.5–2015.9Passive sampler61.9 ± 10.1Li et al., 2017 [54]
Shanghai, China2017.3–2018.2MARGA27.4 ± 17.8Xu et al., 2020 [64]
Urban
Jeonju, Korea2020.6CRDS18.6 ± 7.8This study
Seoul, Korea2010.9–2011.8CRDS11.6 ± 4.2Phan et al., 2013 [15]
New York, USA2016.4–2017.10Active & Passive sampler3.2 ± 2.2Zhou et al., 2019 [18]
Jeonju, Korea2019.5–2020.1CRDS10.5 ± 5.1Park et al., 2020 [26]
Shanghai, China2014.4–2015.4MARGA7.8 ± 5.5Chang et al., 2016 [55]
Nanjing, China2015.9–2016.8Passive sampler15.2 ± 3.7Pan et al., 2018 [56]
Mokpo, Korea2019.12CRDS8.6 ± 3.3Song et al., 2020 [57]
Douai, France2015.8–2016.7MARGA4.2 ± 1.8Rodelas et al., 2019 [58]
Delhi, India2013.1–2015.12Online NH3-
analyzer
19.6 ± 3.5Saraswati et al., 2019 [65]
Remote
Saemangeum, Korea2020.6–12Passive sampler4.9 ± 1.8Park et al., 2021 [43]
New York, USA2008.8–2015.7Passive sampler0.5 ± 0.4Yao et al., 2016 [47]
Chengdu, China2015.9–2016.8Passive sampler2.6 ± 0.6Pan et al., 2018 [56]
Wuyin, Genhe, and Bayinbuluke, China2010.5–2011.9Active & Passive sampler1.7 ± 0.7Xu et al., 2015 [62]
Southern Indiana, USA2013.6–2013.10Online NH3-
analyzer
0.6 ± 0.6Hansen et al., 2015 [63]
Publisher’s Note: MDPI stays neutral with regard to jurisdictional claims in published maps and institutional affiliations.

