1. Plain Language Summary
As sunlight streaks through the atmosphere, it is attenuated and scattered by aerosol particles. Attenuation of sunlight occurs directly between the sun and the ground observer; this attenuation produces scattered light that illuminates the entire sky. The size and number of particles determine how the attenuation and scattering of sunlight change with wavelength and explain, for example, delightful sunsets with yellow-to-red colors. Traditionally, researchers use ground-based measurements of the sunlight attenuation and scattering to get comprehensive information about particles, including their number, size, shape, and chemical content. However, there is accumulating evidence that such information can rarely be collected mostly because of the frequent presence of clouds located above a ground-based instrument. These clouds can contribute strongly to the measured sunlight scattering, thus making inferences of aerosol properties impossible. In contrast, these clouds have no impact on sunlight attenuation if they do not block a straight line between the Sun and the observing instrument. In the current work, the individual ground-based measurements of the sunlight attenuation at different wavelengths are used to find particles number and size, called the size distribution, for maritime and coastal sites with abundant clouds. It is demonstrated that the aerosol size distributions obtained from the combined (attenuation and scattering) and individual (attenuation only) measurements in the coastal and maritime environment are, on average, in a good agreement. Since the sunlight attenuation can be measured much more frequently than attenuation and scattering together, the attenuation-only based size distributions will provide a more complete picture of how particles behave in time and space and interact with sunlight and clouds.
2. Introduction
Studies with focus on regional and global climate change are primarily concerned with size spectra of aerosol particles in a vertical atmospheric column, the so-called columnar size distributions (SDs) [
1,
2]. These distributions are commonly acquired from spectrally resolved aerosol optical depth (AOD) and sky radiance measured by Cimel sunphotometers (CSPHOTs) as part of the National Aeronautics and Space Administration (NASA) Aerosol Robotic Network (AERONET [
3]). The crucial limitation associated with this SD acquirement is that successful AERONET inversions [
4,
5] need mostly clear-sky conditions. Many locations around the world are characterized by frequent occurrence of clouds. This is especially true for coastal and maritime areas with abundant clouds [
6,
7]. As a result, aerosol size spectra obtained from the combined direct-sun and sky-scanning measurements over these areas can be extremely rare. To illustrate, a low rate of the successful SD retrievals (less than two per month, on average) has been documented recently for a maritime area [
6]. Obviously, such a low rate hinders many climate-related applications.
It has been argued for more than four decades that it is possible to estimate the SD reasonably well from AODs measured at several wavelengths [
8,
9,
10,
11,
12]; however, a complete practical solution still escapes us. Such a possibility has been illustrated, for example, by Sayer et al. [
11], for a marine environment. The researchers have estimated two parameters defining columnar volumes of small and large particles using AODs measured mostly at four (0.44, 0.675, 0.87, 1.02 μm) wavelengths and specified climatological values of the complex refractive index (RI) [
13]. There is a perception that one of the main difficulties encountered in obtaining such solution is determining the complementary information regarding aerosol type, because AOD is a function of both the SD and the complex RI [
14], and the chemical composition of the aerosol determines the RI and its temporal and spatial changes [
15,
16]. It should be emphasized that reliable values of the retrieved RI can be offered by the established aerosol inversions only under favorable observational conditions, defined by high aerosol loading (AOD > 0.4 at 0.44 µm wavelength) and mostly clear-sky environments [
17,
18]. The vast majority (~95%, globally) of AODs measured at 0.44 µm wavelength are below the 0.4 threshold [
19]. When faced with unfavorable conditions observed, for example, in marine and coastal areas, another potential approach is to use the RI obtained from chemical composition data.
Here, we consider estimation of four essential parameters of volume size spectra from the spectrally resolved AODs for the coastal and maritime environments with low aerosol loading and abundance of clouds. Since these challenging environments are not suitable for the reliable RI retrievals, we use chemical composition measurements for the RI estimation. These four parameters describe the volume of large and small particles and volume mean radius of these particles. There are two main questions we would like to answer: (1) How do model SDs estimated from AOD measurements and the chemical-based RI match SDs obtained from airborne measurements and those obtained by the established aerosol inversions based on the combined AOD and sky radiance data? and (2) How sensitive are SD estimations to selection of AODs at specific wavelengths and the chemical-based RIs?
To answer these questions, we use two datasets with the CSPHOT-measured AODs and information on size spectra and the chemical composition of aerosol particles. The first dataset represents coastal aerosol properties collected during the Two-Column Aerosol Project (TCAP [
20]) supported by the U.S. Department of Energy (DOE) Atmospheric Radiation Measurement (ARM) User Facility (
https://www.arm.gov/ accessed at 20 May 2021). The TCAP with summer and winter phases includes chemical composition data collected by integrated airborne measurements over the U.S. coastal region (Cape Cod, Massachusetts), which characterizes crossroads of distinct air-mass flow patterns [
20,
21]. The second dataset defines maritime aerosol properties collected at the Eastern North Atlantic (ENA) atmospheric observatory [
22] established by the ARM user facility. The ENA atmospheric observatory is located on Graciosa Island (Azores) in the northeastern Atlantic Ocean west of Portugal. The ENA integrated observations include multi-year ground-based measurements of the chemical composition.
3. Approach
The common element which links together all AOD-based estimations of SD [
8,
9,
10,
11,
12] is that they contain an AOD fitting component, which is a comparison of AODs measured at several wavelengths with modeled AODs calculated from estimated SDs. Although there are several ways for performing the AOD fitting, we outline only one of them in this section. This fitting is a part of our method originally suggested for estimating aerosol intensive properties for the ARM-supported continental site [
10]. A further point worth noting is that an expected reasonable agreement between the measured and model AODs at selected wavelengths gives us no guarantees about the level of agreement between the corresponding SDs. For example, different combinations of parameters describing SDs of small particles can produce very similar optical properties for given RIs [
23]. Thus, we compare model SDs estimated from observed AODs with SDs offered by both the airborne measurements and the established AERONET inversions (
Section 4). It should be emphasized that the model SDs considered here define estimated columnar size spectra with an assumed shape—a combination of two lognormally distributed modes—and wide size range (0.05–15 μm). To cover this wide range by in situ measurements, several instruments are needed [
24,
25].
3.1. AOD Fitting
Our AOD fitting [
10] has three main assumptions. The first assumption is a simplified representation of columnar volume SD. It is assumed that it can be approximated by two lognormally distributed modes, named here as “fine” and “coarse” modes, for representing small and large particles, respectively. We define these modes explicitly below (
Section 3.3). However, there is some indication that three lognormally distributed modes can be employed for approximation of maritime-dominated aerosols, as well [
26]. Each mode of the estimated SD is described by three parameters: total volume (
), logarithmic volume mean radius (
), and geometric standard deviation (
). These parameters characterize the magnitude (
), position (
), and width (
) of each mode. The second assumption is related to selection of unknown parameters. It was assumed that two parameters (
and
) for each mode are unknown, and the remaining parameters (
) can be specified using the corresponding climatological values [
18]. Selection of the unknown parameters is based on our sensitivity studies [
10], which demonstrate that the calculated AOD depends mostly on two model parameters (
and
), and information on the third parameter (
) is of secondary importance. Finally, the AOD fitting requires an assumption about the size-dependence of the complex RI. It is assumed that the same value of the RI can be used for fine and coarse modes; this assumption implies that mixtures of chemical components for both small and large particles have comparable values of the RI. Similar assumption of size-independent RI is used in the conventional AERONET inversions [
4,
5].
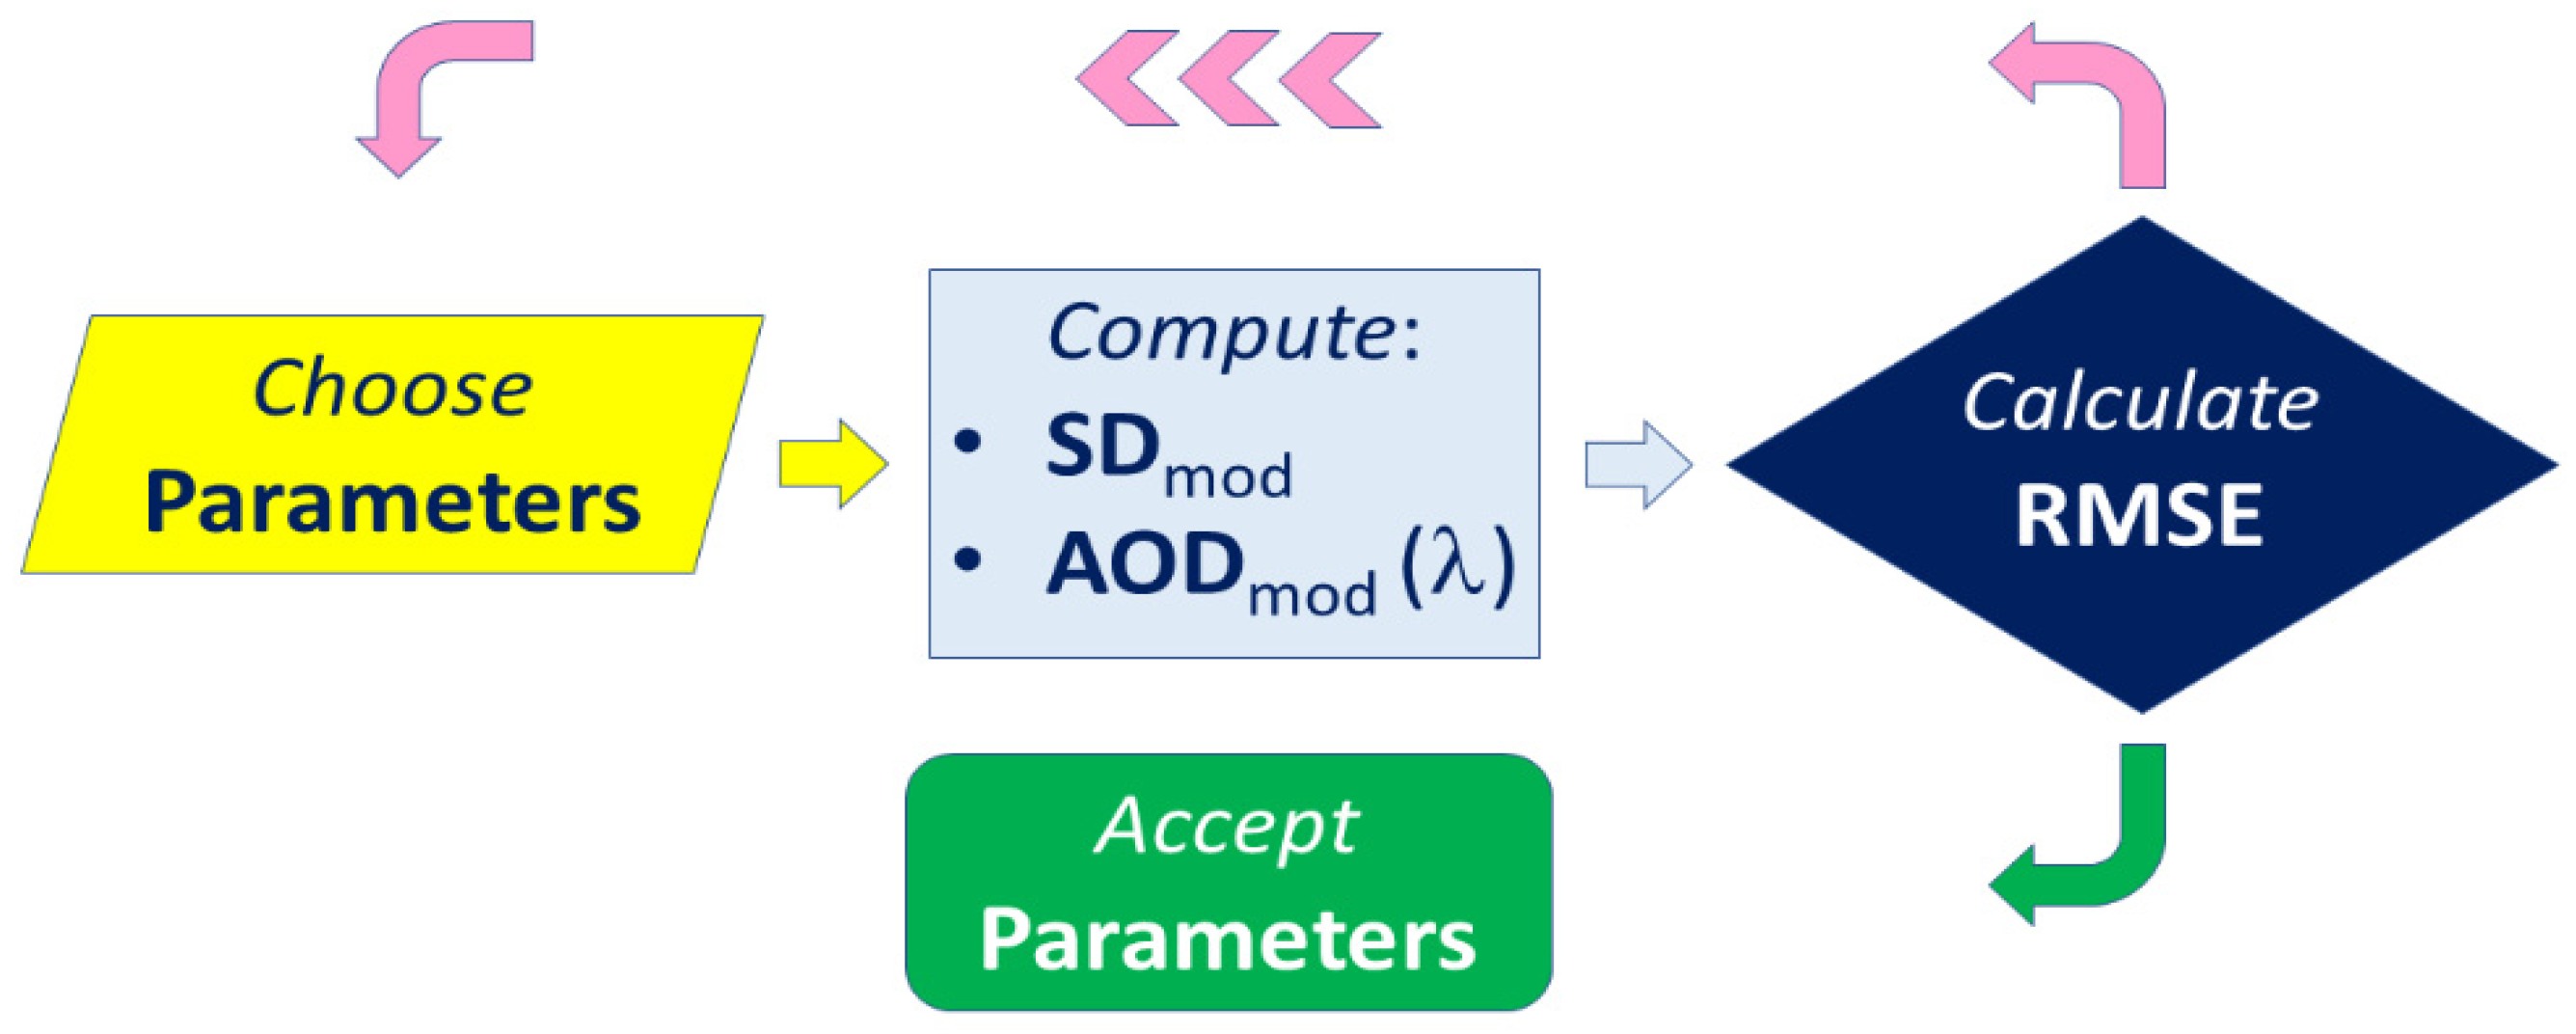
The AOD fitting (
Figure 1) relies on Mie calculations (for a given RI) of the model AODs at several wavelengths from the assumed SD. These wavelengths are selected to match wavelengths of the measured AODs. The four unknown parameters defined above are chosen to compute a model SD with fine and coarse modes. Then, the computed SD is fed into the Mie calculations, and the spectrally-dependent model AODs are found, which are, in turn, used to calculate the root mean square error (RMSE) between the model and measured AODs. The four SD parameters are varied to find the minimum RMSE. Such RMSE minimization makes the model AODs as close as possible, on average, to the measured AODs. Moreover, such minimization allows one to reduce the potential impact of the AOD uncertainties on the estimation of model parameters. If the RMSE after minimization does not exceed a given threshold (e.g., 0.01), the solution set is considered converged. To speed up the AOD fitting, look-up-tables of model AODs are generated for the assumed parameters describing the model SD. Ranges of
provided by the AERONET inversions [
13,
18] are used to specify typical ranges of coastal- and maritime-dominated aerosols: 0.12–0.24 µm (fine mode) and 1.65–3.53 µm (coarse mode). The corresponding values of the third parameter (
) are specified as 0.5 (fine mode) and 0.7 (coarse mode).
Two types of model SDs are estimated from AOD measurements alone. The first type is referred as “CSPHOT” to define SD estimation based on AOD measured by the CSPHOT at four wavelengths (0.44, 0.675, 0.87, 1.02 μm). In contrast to the inversion-based SDs [
4,
5], sky radiance data are not used here. The second type is referred as “MFRSR-like” is the same as the “CSPHOT” type, with one exception. The SD estimations are based on AODs obtained at five wavelengths (0.415, 0.5, 0.615, 0.675, 0.87 μm) acquired from the four CSPHOT AODs by extrapolation (0.415 μm) and interpolation (0.5, 0.615 μm). AODs at these five wavelengths are provided by Multifilter Rotating Shadowband Radiometers (MFRSRs) with widespread deployment [
27,
28]. Note, the AERONET direct Sun algorithm provides AOD at eight wavelengths (0.34, 0.38, 0.44, 0.5, 0.675, 0.87, 1.02, 1.64 μm). Typically, the overall uncertainty of the measured AODs is small (0.01–0.02) [
3,
4,
5].
3.2. RI Estimation
Estimation of the model SDs from AOD measurements requires information on the complex RI. The established AERONET inversions offer values of the ambient columnar complex RI with high quality (Version 3, Level 2.0) under favorable observational conditions, which define high aerosol loading (AOD > 0.4 at 0.44 μm wavelength) and mostly clear sky [
17,
18]. Note that Andrews et al. [
19] demonstrated that successful (Level 2) AERONET inversions likely have a low rate: about 5% of the days, globally, and less than 11% of the days over land. Alternatively, information on the complex RI can be obtained from the chemical composition measurements. Below, we consider two options related to the RI estimation from the chemical composition data (
Section 3). The first option represents a “complete” dataset where values of ambient complex RI are available at several altitudes from integrated airborne data collected over U.S. coastal region (Cape Cod). Certainly, these values are accessible only on a limited basis. The second option represents an “incomplete” dataset where values of dry real RI are available from near-surface chemical composition measurements at the ENA site. Since such measurements are widely available at many locations, this option can be considered as a “practical-oriented”. We discuss the sensitivity of the model SD estimation to assumptions regarding the ability of particles to absorb water and the representativeness of the near-surface RI values for entire atmospheric column (
Section 5.3).
3.3. SD and AOD Comparison
To evaluate the model SDs, we consider (1) SDs obtained from the integrated airborne measurements (TCAP) and (2) SDs offered by the conventional AERONET inversions (ENA site). The airborne number SDs represent vertically integrated size spectra measured during several flight legs (FLs) with different altitudes during the TCAP. To ensure an appropriate comparison between the columnar model SDs and the vertically integrated observed SDs, we apply the following three requirements. The first requirement defines “collocated” and “coincident” SDs. The airborne SDs are considered as “collocated” and “coincident” with the model size spectra if the selected FLs are in both spatial (within 100 km) and temporal (within 2 h) vicinity of available ground-based AOD measured during the TCAP (
Section 3.1). The second requirement defines FLs suitable for calculation of the vertically integrated SD. The selected “collocated” and “coincident” FLs are considered as appropriate if they characterize at least four different altitudes. Application of these two requirements provides 21 appropriate FLs which denote three summer and two winter days (
Section 3.1). The third requirement involves normalization of the columnar model SDs and the vertically integrated measured SDs using total numbers of particles. Such normalization is aimed to remove effect of different particle concentrations (or aerosol loadings) on comparison of the vertically integrated and columnar SDs. The measured SDs are considered as a “reference” for evaluation of the corresponding model SDs estimated during the TCAP campaign (
Section 4.1). The SDs offered by the conventional AERONET inversions are considered as a “reference” for evaluation of the model SDs estimated at the ENA site (
Section 4.2). It should be emphasized that the number of the inversion-based SDs obtained with high quality (Version 3, Level 2.0) for 7-year period considered here (from 3 October 2013 to 23 June 2019) is quite small (529; or about six per month, on average). In contrast, the corresponding number of AODs measured with high quality (Version 3, Level 2.0) is large (10,863). In other words, the number of measured AODs exceed the number of the inversion-based SD more than 20 times.
Two important notes should be made. First, the model SDs estimated from the measured AODs represent volume size spectra
. To convert them into their number counterparts
, we use the well-known relationship [
13]:
Second, the AERONET aerosol inversion provides both fine and coarse components of the measured AOD (or total AOD). The corresponding size cut-off is determined as minimal value of the inversion-based SD found within prearranged size range (0.439–0.992 μm). Our analysis of the inversion data collected at the ENA site indicates that the minimal value appears typically (more than 80% of time) at the smallest (0.439 μm) radius (R) from the prearranged size range. We use this value (0.439 μm) as the cut-off for specifying explicitly the fine (R < 0.439 μm) and coarse (R > 0.439 μm) particles occurred at the ENA site and, thus, for specifying the corresponding fine and coarse components of the total AODs.
4. Data
Important aerosol properties required for estimation of the model SDs from the measured AOD and their evaluation (
Section 5) are considered here. These properties characterize both the coastal (
Section 4.1) and marine (
Section 4.2) observational conditions and include the “reference” size spectra obtained from both the airborne measurements and conventional aerosol inversions, and site-dependent values of the RI obtained from the chemical composition data using both the “complete” (
Section 4.1) and “incomplete” (
Section 4.2) options. The major assumptions required for calculating ambient values of the RI are highlighted, and the corresponding references are provided.
4.1. TCAP Data
The TCAP campaign involves intensive observations performed by the U.S. DOE Gulfstream-159 (G-1) aircraft [
29] during summer (2012) and winter (2013). These aircraft observations provide a comprehensive dataset related to important properties of clouds and aerosol [
20] and include the ambient SDs and RIs of particles [
24,
30]. The latter represents a mixture of the measured chemical components and absorbed water. The estimation of the ambient complex RI involves two major steps: (1) calculation of its dry values using well-known values of the complex RIs for the measured components and their mass fractions and (2) estimation of its ambient values using the calculated dry values and the hygroscopic growth factor of the mixture (HGFmix) for a given relative humidity (RH). The reader is referred to our previous studies [
24,
30] for details regarding the ambient SDs and RIs and their seasonal changes (winter versus summer). For example, we have demonstrated that the relative contribution of sulfate to total mass is larger in winter in comparison with summer. As a result, winter dry values of the real part of the complex RI for a mixture are larger than their summer counterparts. In addition, we have demonstrated that particles have a stronger ability to absorb water during winter in comparison with summer. These two factors (sulfate contribution and water absorption) define moderate seasonal changes of the ambient values of the real part of the complex RI (
Table 1). In contrast, the ambient values of the imaginary part of the complex RI exhibit strong seasonal variability (
Table 1): the winter values surpass the summer values substantially (about three times) due to a larger fraction of black carbon (rBC) in the total mass in winter compared to summer [
24,
30].
The aircraft measurements were performed within two columns of air. One of them was located over Cape Cod with frequent occurrence of clouds. A 12-month deployment of the ARM Mobile Facility (AMF) on Cape Cod included AERONET-supported CSPHOT measurements for a limited period (summer, 2012). Martha’s Vineyard coastal observatory (MVCO) is located south-west of Cape Cod and the CSPHOT is part of the MVCO instrumentation suite. We used the CSPHOT AODs measured at four wavelengths (0.44, 0.675, 0.87, 1.02 μm) with high quality (Version 3, Level 2.0) on Cape Cod (July 2012) and at the nearby MVCO site (February 2013) for estimation of the corresponding model SDs.
4.2. ENA Data
The ENA observatory provides long-term measurements of low marine clouds and atmospheric aerosol. Three multi-year (2013–2019) datasets related to aerosol properties are used in our study. The first dataset is AODs measured by the CSPHOT at four wavelengths (0.44, 0.675, 0.87, 1.02 μm) with high quality (Version 3, Level 2.0). These AODs are used to estimate the model SDs (
Section 5.2). The second dataset consists of columnar volume SDs derived with high quality (Version 3, Level 2.0) from the combined AOD and sky radiance measurements. The retrieval uncertainty of these SDs is size-dependent [
17]: moderate (up to 35%) for intermediate size range (0.1–7 μm) and large (up to 100%) for smaller (<0.1 μm) and larger (>7 μm) particles. The third dataset is the RIs calculated from the near-surface chemical composition measurements. Calculation of the dry RI involves mass fractions for non-refractive species measured by the Aerosol Chemical Speciation Monitor and the corresponding values of the dry RI for these species reported in literature [
16,
24]. To assess the sensitivity of the model SDs to the water uptake by particles (
Section 5.3), the ambient values of the real RI are also calculated for both summer and winter using their dry counterparts and the assumption that the HGFmix (RH = 70%) obtained for the TCAP data [
24] can be applied for the ENA data, as well. The selected RH value (70%) roughly represents scattering-weighted column-averaged RH values observed during the TCAP. Note that the corresponding RH values are smaller (<55%) for two typical continental sites [
19]. The normalized frequency distributions of the calculated dry and ambient values of the real RI are quite narrow (
Figure 2).
The corresponding mean values of the real RI depend weakly on season. Thus, we use the mean “summer” values of the dry (1.498) and wet (1.457) real RI for the model SD estimation at the ENA site (
Section 5.2). On average, the assumed water uptake by particles reduces slightly (~0.04) the real RI. It should be mentioned that the expected uncertainty of the real RI offered by the conventional AERONET inversions is noticeable (0.05) for low (AOD < 0.2 at 0.44 μm wavelength) aerosol loadings [
17].
5. Results
This section describes evaluation of the model SDs estimated from the measured AODs using the “complete” (
Section 4.1) and “incomplete” (
Section 4.2) datasets of the chemical-based RI. Recall that AOD is related to the attenuation of sunlight, which occurs directly between the sun and the ground observer, and the size and number of particles determine how the attenuation of sunlight changes with wavelength. In addition, this section discusses the sensitivity of the model SDs to assumptions regarding the ability of particles to absorb water and the representativeness of the near-surface RI values for the entire atmospheric column (
Section 5.3).
5.1. TCAP Data
Strong seasonal changes of aerosol properties occurred during the TCAP have been documented previously [
20,
24,
30]. In particular, it was demonstrated that winter in comparison with summer is characterized by (1) a higher aerosol loading and (2) a larger fraction of coarse particles.
Figure 3 illustrates clearly these strong seasonal changes in terms of magnitude of the measured AOD and its wavelength dependence: (1) winter AODs exceed their summer counterparts more than two times, and (2) wavelength variability of AODs become flatter during winter compared to summer.
The winter and summer values of the measured AOD are about 0.2 and 0.1 at 0.44 μm wavelength, respectively. Therefore, these values are about two and four times smaller than the corresponding AOD threshold (0.4) required for the reliable (Level 2.0) RI retrievals offered by the established aerosol inversions.
Figure 3 also illustrates that the two retrieval schemes used here for estimation of the model SD (
Section 3.1) provide a very similar level of agreement between the measured and model AODs at the wavelengths considered here. Moreover, the level of agreement does not depend on both the aerosol loading and fraction of coarse particles (as demonstrated by weak changes versus strong changes of the measured AOD with wavelength). Thus, it can be hypothesized that the model SDs estimated by these two retrieval schemes should provide a comparable level of agreement between the measured and model SDs for both winter and summer. To confirm our hypothesis, we compare these SDs (
Figure 4).
The measured SDs exhibit the strong seasonal changes (
Figure 4). The later are more pronounced for the coarse particles (D ≥ 1 µm). To illustrate, let us consider SDs measured for two days (
Figure 4h,i), which define summer (25 July 2012) and winter (25 February 2013) days, respectively. Winter values of the measured SD significantly exceed (about 10 times) the corresponding summer values for the super-micron size range (
Figure 4h,i). In contrast, difference between winter and summer values of the measured SD become less distinct for the sub-micron size range (
Figure 4c,d). It should be mentioned that the SD measured for another winter day (26 February 2013) decreases sharply with particle size for the super-micron range (
Figure 4j). The observed sharp decrease of the measured SD can be associated, at least in part, with sampling issues of coarse particles for this day.
The model SDs estimated by two retrieval schemes capture the strong seasonal changes of the measured SD reasonably well (
Figure 4). For example, winter values of the model SDs exceed the corresponding summer values significantly (about 10 times) for the super-micron size range (
Figure 4h,i), as also seen in the measured SDs (
Figure 4h,i). A reasonable visual agreement between the measured and model SDs is seen for the overlapping size range (roughly 0.1–2 µm). As a result, the corresponding values of correlation coefficient (measured SD versus model SD) are high (≥0.9). Since the “optically equivalent” model SDs estimated by two retrieval schemes appear as almost coincident lines for many size bins (
Figure 4), estimation of the model SD depends weakly on the wavelengths of AOD measurements. The term “optically equivalent” is used here to emphasize that the model AODs calculated from the estimated SDs nicely replicate the measured AODs (
Figure 3).
5.2. ENA Data
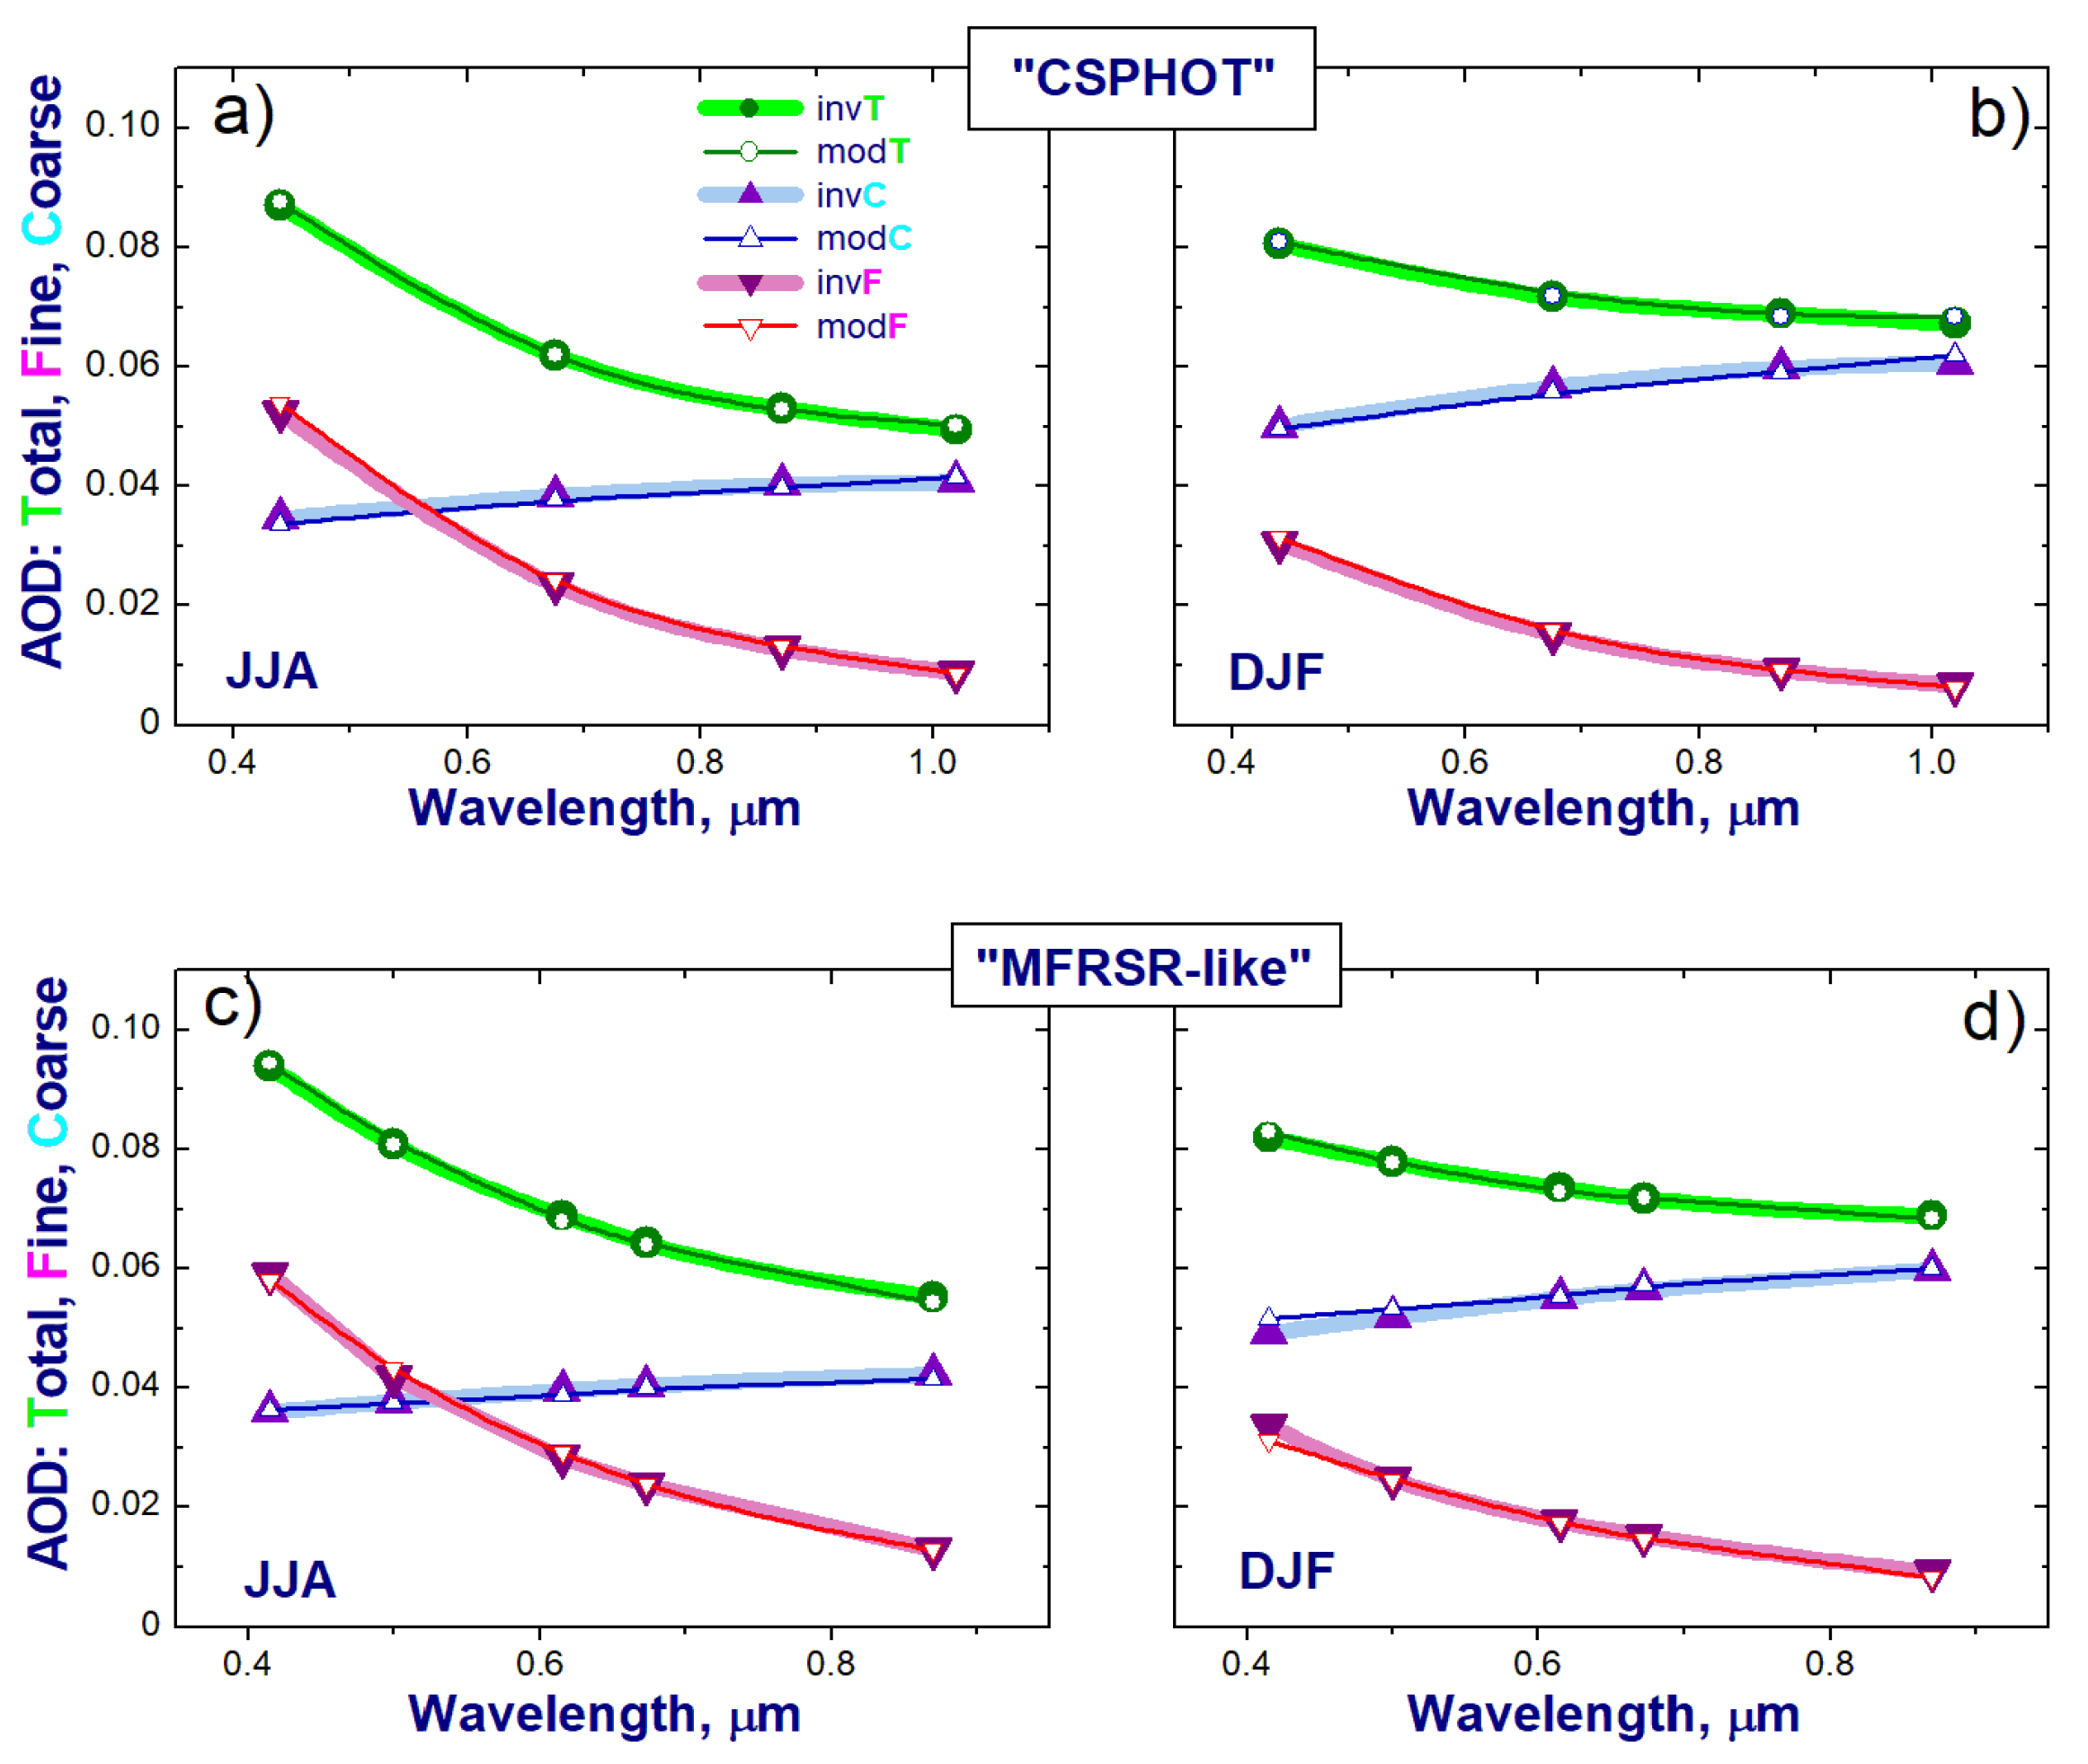
The AOD measured at the ENA site exhibits strong seasonal changes (
Figure 5a,b): its spectral variability becomes flatter during winter (
Figure 5b) in comparison with summer (
Figure 5a). Likewise, its fine and coarse components show distinct seasonal differences. To illustrate, the summer-winter increase of the coarse AOD is about 50% at 0.44 μm wavelength (
Figure 5a,b). It should be noted that the mean near-surface wind speed in winter is about twice as large as that in summer [
31], and a fraction of large particles increases with wind speed [
13]. Thus, the spectral flattering of the measured AOD can be associated, at least in part, with the seasonal differences of the wind speed. Second, the model AOD resembles very closely the measured AOD and its fine and coarse components at all wavelengths (
Figure 5). The close resemblance (
Figure 5) between the observed and model AODs clearly indicates that application of the selected RI values (
Section 4.2) appears to be sufficient to reproduce nicely the spectral changes of the measured AODs with well-pronounced seasonal variability. Moreover, the very good agreement obtained here (
Figure 5) suggests that the AODs measured at distinct wavelengths within a relatively broad spectral interval (roughly 0.4–1.0 μm) can be used to estimate “optically equivalent” SDs.
Let us look now at how well the “optically equivalent” model SDs estimated from the measured AODs reproduce the SDs provided by the AERONET aerosol inversions based on the combined AOD and sky radiance data (
Figure 6). It appears that the inversion-based SDs have three modes at the ENA site. This result is consistent with the inversion-based SDs obtained for areas with maritime-dominated aerosols [
26]. The existence of the third mode could be attributed to various reasons, including distinct aerosol sources and aerosol-cloud interactions [
32]. Contribution of sub-micron particles to the total volume of the inversion-based SDs is smaller (about two times) during winter (
Figure 6b) in comparison with that for summer (
Figure 6a). In contrast, the corresponding seasonal differences for super-micron particles are quite minor (
Figure 6). Thus, the seasonal variability of the measured AODs (
Figure 5) is mostly governed by sub-micron particles and their seasonal changes (
Figure 6).
The model SDs estimated from the measured AOD reproduce reasonably well the inversion-based SDs (
Figure 6). The corresponding correlation coefficient is high (≥0.9). It should be emphasized that the model and inversion-based SDs are in close agreement for a limited size range (about 0.1–1 μm): the difference between them is mostly within the expected retrieval uncertainty of the SDs offered by aerosol inversions [
17]. This agreement can be explained by two main factors. First, it is well-known that particles scatter light most efficiently when their size is comparable with wavelength [
14,
33]. Second, we consider the AODs measured within a spectral interval (about 0.4–1 μm). Thus, this limited size range (about 0.1–1 μm) likely represents “optically active” particles, which are largely responsible for the sunlight scattering within the considered spectral interval, while contribution of super-micron particles to the sunlight scattering is not negligible. The obtained agreement, on average, depends weakly on season and two retrieval schemes considered here. Thus, the AODs measured at various wavelengths within a relatively broad spectral coverage (roughly 0.4–1μm) can be used to estimate the model SDs plausibly well, and such estimation seems to be the most accurate for the size range, which defines the “optically active” particles.
The model SDs resemble closely inversion-based SDs within the limited size range (about 0.1–1 μm) (
Figure 6), despite the major assumptions regarding the RI obtained from the chemical composition measurements. Recall, these assumptions are related to (1) calculation of the ambient near-surface RI and (2) appropriateness of the calculated near-surface RI for estimation of the columnar SDs from the measured AOD. Below, we discuss these assumptions and their impact of the model SD estimation.
5.3. Sensitivity to RI Selection
We calculate the ambient real RI using its dry values obtained from the near-surface chemical composition data collected at the ENA site and the HGFmix (RH = 70%) obtained during TCAP (
Section 4.1). Below, we assess the impact of the assumed HGFmix on the model SD estimated from the measured AOD. To do that, we estimate the model SDs using both the dry (1.498) and ambient (1.457) mean values of the real RI (
Section 4.2) and compare these model SDs. Such a comparison illustrates the sensitivity of the model SD estimation to the real RI, which characterizes non-absorbing particles only. With the aim of illustrating the impact of the complex RI (both real and imaginary parts) on the model SD estimation, we repeat our comparison using the complex RI measured during the TCAP winter phase. Specifically, we use the vertically integrated ambient complex RI measured for winter day (26 February 2013) when fraction of rBC in the total mass was the largest in comparison with those observed for other selected days (
Table 1). The chosen complex RI (1.449 + i0.031) characterizes both absorbing and non-absorbing particles. To illustrate the impact of the real and complex RIs on the model SD estimation, we use the CSPHOT AOD measured at the ENA site during summer, the “CSPHOT” retrieval scheme, and three different values of the RI (
Figure 7).
The model (SDmod) volume distributions estimated for different values of the assumed RI have very similar shapes (
Figure 7a). To quantify the level of agreement between the model volume distributions, we use their relative difference (
Figure 7b): ΔSDmod(RI*) = 100 × (SDmod(1.498) − SDmod(RI*))/SDmod(1.498), where RI* is either the “ambient ENA” (1.457) or the “ambient TCAP” (1.449 + i0.031) refractive index. The negative values of this difference indicates that SDmod(RI*) overestimates SDmod(1.498) for a given size, and vice versa. Let us start with the difference obtained for the “ambient ENA” real RI (
Figure 7b): the magnitude of the “ambient ENA” difference ΔSDmod(1.457) is mostly within 15% for a relatively wide size range (roughly from 0.1 to 10 µm).
Before we move on, two comments should be made. First, the AOD is proportional to the aerosol size distribution and extinction efficiency, which depends on the complex RI and size parameter (α = 2πR/λ, where λ is the wavelength) [
14,
33]. Second, the impact of the real RI on the AOD is governed by the well-known behavior of the extinction efficiency as a function of the real RI for a given size range. For example, the extinction efficiency increases with the real RI when the size parameter is small (α < 5). Thus, the increase of the real RI is compensated by the decrease of the model SD estimated from the measured AOD for this size range.
Results from
Figure 7b allows one to assess such RI-related compensation. The dry real RI (1.498) exceeds the ambient real RI (1.457) slightly (~3%). However, the “dry ENA” SD(RI = 1.457) can underestimate the “ambient ENA” SD(RI = 1.498) noticeably (up to 15%) within a spectral interval (about 0.1–1 μm), which represents “optically active” particles. Thus, the use of the dry real RI instead of the ambient real RI results in the noticeable (up to 15%) reduction of the model SD within this spectral interval. To put this another way, the estimation of the model SDs appears not to be very sensitive to the assumption regarding the water uptake by particles (“dry ENA” RI versus “ambient ENA” RI). In a similar manner, the well-known behavior of the extinction efficiency as a function of the complex RI can explain noticeable (mostly within 15%) distinctions between the “dry ENA” SD(RI = 1.457) and the “ambient TCAP” SD(RI = 1.449 + i0.031) (
Figure 7b). These distinctions are comparable with the expected uncertainty of the inversion-based SDs [
17]. It should be emphasized that the imaginary part of the “ambient TCAP” RI defines a considerable absorption associated with a large fraction of rBC in the total mass (
Section 4.1). However, the presence of even considerable absorption does not substantially modify the model SD estimated from the measured AOD (
Figure 7; “ambient TCAP” versus “ambient ENA”), mostly due to recognized weak sensitivity of the AOD to the imaginary RI [
8].
Both “dry ENA” and “ambient ENA” RIs considered above characterize the near-surface chemical composition data. It is well-known that the mixture of chemical components can change substantially with altitude. For example, organics and sulfate are dominant chemical components at the ENA site and their relative fractions are typically different near the surface and aloft [
34]. Since these dominant components have comparable values of the real RI [
16,
24], it should be expected that the real RI of the mixture should not vary considerably with altitude. Results from the recent observational study performed over different locations of continental U.S. [
35] favors such an expectation: the real RI changes with altitude only slightly (<10%).
6. Summary
The well-established AERONET aerosol inversions [
4,
5] are elegant solutions to the problem of deriving a columnar aerosol size distribution (SD) from the combined wavelength-dependent measurements of aerosol optical depth (AOD) and sky radiance. However, these inversions require mostly clear-sky observational conditions, so that there are few “favorable” events where high quality SDs can be retrieved successfully. For many areas with cloud abundance these events are rare in comparison with frequent AOD measurements, which only require an unobstructed view of the sun. The U.S. coastal region (Cape Cod) and Graciosa Island in the Azores are examples of such cloudy areas. Here, we demonstrate the possibility to bypass this stringent requirement regarding clear-sky conditions by adapting our approach [
10] to cloudy coastal and maritime areas. Originally, it was used to estimate four parameters of a volume SD from spectrally resolved AODs measured at the U.S. continental site. These parameters define the magnitude and position of fine and coarse modes with an assumed lognormal shape.
For our demonstration, we consider two integrated datasets. The first dataset represents coastal aerosol properties collected over Cape Cod by research aircraft during the summer (2012) and winter (2013) phases of the Two-Column Aerosol Project (TCAP), while the second dataset defines maritime aerosol properties collected at the Eastern North Atlantic (ENA) atmospheric observatory over 7-year period (2013–2019). The collected aerosol properties include (1) AODs measured at four wavelengths (0.44, 0.675, 0.87, 1.02 μm) with the high quality (Version 3, Level 2.0), (2) size spectra offered by both aircraft measurements and well-established aerosol inversions (Version 3, Level 2.0), and (3) refractive index (RI) calculated from the chemical composition data. Our calculations provide vertically integrated ambient complex RI (TCAP data) and near-surface dry and ambient real RIs (ENA data).
We use these datasets to answer two questions posed in the introduction and to demonstrate the following. First, the estimated SDs—with assumed bimodal shape—can approximate the measured and inversion-based SDs quite accurately (correlation coefficient exceeds 0.9), despite the large summer-winter differences of the size spectra. The level of agreement between the observed and estimated SDs is particularly good for a limited size range (roughly 0.1–1 μm). Second, this level of agreement depends weakly on the wavelengths of AOD measurements if they represent a broad spectral range, roughly 0.4–1 μm, and at least four AODs are available. Finally, the SD estimation is not sensitive to assumptions regarding the ability of particles to absorb water and the representativeness of the near-surface RI values for the entire atmospheric column. Near-surface values of the dry real RI appear to be suitable for the SD estimation for the coastal and maritime areas considered here.
High quality AOD measurements within a spectral interval, roughly 0.4–1 μm, can be provided by many instruments deployed at the fixed and mobile ground-based sites [
27,
28,
36,
37,
38] and aircraft [
39,
40]. Chemical composition measurements are offered by numerous sites with global coverage [
41]. These widely available AODs, coupled with representative site- and season-dependent RIs calculated from the chemical composition data, furnish an opportunity to estimate the SDs at previously unavailable time periods and spatial coverage and, thus, to meet ever-growing demands for additional observations required for an improved assessment of the temporal and spatial variability of aerosol SDs and their impact on regional and global climate change.
Author Contributions
Conceptualization, E.K., J.B., and C.J.F.; Formal Analysis, E.K. and M.P.; Investigation, E.K. and M.P.; Writing—Original Draft Preparation, E.K.; Writing—Review & Editing, M.P., L.K.B., F.M., and J.B.; Data Curation, M.P. and F.M.; Resources, L.K.B. All authors have read and agreed to the published version of the manuscript.
Funding
This research was supported by the U.S. Department of Energy (DOE), Office of Science Biological and Environmental Research, as part of the Atmospheric Radiation Measurement (ARM) user facility and Atmospheric System Research (ASR) program. The Pacific Northwest National Laboratory is operated for DOE by the Battelle Memorial Institute under Contract DEAC05-76RL01830.
Institutional Review Board Statement
Not applicable.
Informed Consent Statement
Not applicable.
Data Availability Statement
Data are available upon request to the authors.
Conflicts of Interest
The authors declare no conflict of interest.
References
- Lesins, G.; Lohmann, U. Using MODIS and AERONET to Determine GCM Aerosol Size. J. Atmos. Sci. 2006, 63, 1338–1347. [Google Scholar] [CrossRef]
- Li, J.; Liu, L.; Lacis, A.A.; Carlson, B.E. An optimal fitting approach to improve the GISS ModelE aerosol optical property parameterization using AERONET data. J. Geophys. Res. Space Phys. 2010, 115, D16211. [Google Scholar] [CrossRef] [Green Version]
- Holben, B.; Eck, T.; Slutsker, I.; Tanré, D.; Buis, J.; Setzer, A.; Vermote, E.; Reagan, J.; Kaufman, Y.; Nakajima, T.; et al. AERONET—A Federated Instrument Network and Data Archive for Aerosol Characterization. Remote Sens. Environ. 1998, 66, 1–16. [Google Scholar] [CrossRef]
- Giles, D.M.; Sinyuk, A.; Sorokin, M.G.; Schafer, J.S.; Smirnov, A.; Slutsker, I.; Eck, T.F.; Holben, B.N.; Lewis, J.R.; Campbell, J.R.; et al. Advancements in the Aerosol Robotic Network (AERONET) Version 3 database—A automated near-real-time quality control algorithm with improved cloud screening for Sun photometer aerosol optical depth (AOD) measurements. Atmos. Meas. Tech. 2019, 12, 169–209. [Google Scholar] [CrossRef] [Green Version]
- Sinyuk, A.; Holben, B.N.; Eck, T.F.; Giles, D.M.; Slutsker, I.; Korkin, S.; Schafer, J.S.; Smirnov, A.; Sorokin, M.; Lyapustin, A. The AERONET Version 3 aerosol retrieval algorithm, associated uncertainties and comparisons to Version 2. Atmos. Meas. Tech. 2020, 13, 3375–3411. [Google Scholar] [CrossRef]
- Zhang, C.; Xu, H.; Li, Z.; Xie, Y.; Li, D. Maritime Aerosol Optical and Microphysical Properties in the South China Sea Under Multi-Source Influence. Sci. Rep. 2019, 9, 17796. [Google Scholar] [CrossRef]
- Dye, A.W.; Rastogi, B.; Clemesha, R.E.S.; Kim, J.B.; Samelson, R.M.; Still, C.J.; Williams, A.P. Spatial Patterns and Trends of Summertime Low Cloudiness for the Pacific Northwest, 1996–2017. Geophys. Res. Lett. 2020, 47, e2020GL088121. [Google Scholar] [CrossRef]
- King, M.; Byrne, D.M.; Herman, B.M.; Reagan, J.A. Aerosol Size Distributions Obtained by Inversions of Spectral Optical Depth Measurements. J. Atmos. Sci. 1978, 35, 2153–2167. [Google Scholar] [CrossRef]
- González Jorge, H.; Ogren, J.A. Sensitivity of retrieved aerosol properties to assumptions in the inversion of spectral optical depths. J. Atmos. Sci. 1996, 53, 3669–3683. [Google Scholar] [CrossRef] [Green Version]
- Kassianov, E.I.; Flynn, C.J.; Ackerman, T.P.; Barnard, J.C. Aerosol single-scattering albedo and asymmetry parameter from MFRSR observations during the ARM Aerosol IOP 2003. Atmos. Chem. Phys. Discuss. 2007, 7, 3341–3351. [Google Scholar] [CrossRef] [Green Version]
- Sayer, A.M.; Smirnov, A.; Hsu, N.C.; Munchak, L.A.; Holben, B.N. Estimating marine aerosol particle volume and number from Maritime Aerosol Network data. Atmos. Chem. Phys. Discuss. 2012, 12, 8889–8909. [Google Scholar] [CrossRef] [Green Version]
- Torres, B.; Fuertes, D. Characterization of aerosol size properties from measurements of spectral optical depth: A global validation of the GRASP-AOD code using long-term AERONET data. Atmos. Meas. Tech. 2021, 14, 4471–4506. [Google Scholar] [CrossRef]
- Sayer, A.M.; Smirnov, A.; Hsu, N.C.; Holben, B.N. A pure marine aerosol model, for use in remote sensing applications. J. Geophys. Res. Space Phys. 2012, 117, D05213. [Google Scholar] [CrossRef] [Green Version]
- Hansen, J.E.; Travis, L.D. Light scattering in planetary atmospheres. Space Sci. Rev. 1974, 16, 527–610. [Google Scholar] [CrossRef]
- Levin, E.; Kreidenweis, S.; Mcmeeking, G.; Carrico, C.; Collett, J.C., Jr.; Malm, W. Aerosol physical, chemical and optical properties during the Rocky Mountain Airborne Nitrogen and Sulfur study. Atmos. Environ. 2009, 43, 1932–1939. [Google Scholar] [CrossRef]
- Barnard, J.C.; Fast, J.D.; Paredes-Miranda, G.; Arnott, W.P.; Laskin, A. Technical Note: Evaluation of the WRF-Chem “Aerosol Chemical to Aerosol Optical Properties” Module using data from the MILAGRO campaign. Atmos. Chem. Phys. Discuss. 2010, 10, 7325–7340. [Google Scholar] [CrossRef] [Green Version]
- Dubovik, O.; Smirnov, A.; Holben, B.N.; King, M.; Kaufman, Y.J.; Eck, T.F.; Slutsker, I. Accuracy assessments of aerosol optical properties retrieved from Aerosol Robotic Network (AERONET) Sun and sky radiance measurements. J. Geophys. Res. Space Phys. 2000, 105, 9791–9806. [Google Scholar] [CrossRef] [Green Version]
- Dubovik, O.; Holben, B.; Eck, T.F.; Smirnov, A.; Kaufman, Y.J.; King, M.; Tanré, D.; Slutsker, I. Variability of Absorption and Optical Properties of Key Aerosol Types Observed in Worldwide Locations. J. Atmos. Sci. 2002, 59, 590–608. [Google Scholar] [CrossRef]
- Andrews, E.; Ogren, J.A.; Kinne, S.; Samset, B. Comparison of AOD, AAOD and column single scattering albedo from AERONET retrievals and in situ profiling measurements. Atmos. Chem. Phys. Discuss. 2017, 17, 6041–6072. [Google Scholar] [CrossRef] [Green Version]
- Berg, L.K.; Fast, J.D.; Barnard, J.C.; Burton, S.; Cairns, B.; Chand, D.; Comstock, J.M.; Dunagan, S.; Ferrare, R.A.; Flynn, C.J.; et al. The Two-Column Aerosol Project: Phase I—Overview and impact of elevated aerosol layers on aerosol optical depth. J. Geophys. Res. Atmos. 2015, 121, 336–361. [Google Scholar] [CrossRef] [Green Version]
- Fast, J.D.; Berg, L.K.; Zhang, K.; Easter, R.C.; Ferrare, R.A.; Hair, J.W.; Hostetler, C.A.; Liu, Y.; Ortega, I.; Sedlacek, A.; et al. Model representations of aerosol layers transported from North America over the Atlantic Ocean during the Two-Column Aerosol Project. J. Geophys. Res. Atmos. 2016, 121, 9814–9848. [Google Scholar] [CrossRef] [Green Version]
- Wood, R.; Wyant, M.; Bretherton, C.S.; Rémillard, J.; Kollias, P.; Fletcher, J.; Stemmler, J.; De Szoeke, S.; Yuter, S.; Miller, M.; et al. Clouds, Aerosols, and Precipitation in the Marine Boundary Layer: An Arm Mobile Facility Deployment. Bull. Am. Meteorol. Soc. 2015, 96, 419–440. [Google Scholar] [CrossRef] [Green Version]
- Chemyakin, E.; Burton, S.; Kolgotin, A.; Müller, D.; Hostetler, C.; Ferrare, R. Retrieval of aerosol parameters from multi-wavelength lidar: Investigation of the underlying inverse mathematical problem. Appl. Opt. 2016, 55, 2188–2202. [Google Scholar] [CrossRef] [Green Version]
- Kassianov, E.; Berg, L.K.; Pekour, M.; Barnard, J.; Chand, D.; Flynn, C.; Ovchinnikov, M.; Sedlacek, A.; Schmid, B.; Shilling, J.; et al. Airborne Aerosol In Situ Measurements during TCAP: A Closure Study of Total Scattering. Atmosphere 2015, 6, 1069–1101. [Google Scholar] [CrossRef] [Green Version]
- Denjean, C.; Cassola, F.; Mazzino, A.; Triquet, S.; Chevaillier, S.; Grand, N.; Bourrianne, T.; Momboisse, G.; Sellegri, K.; Schwarzenbock, A.; et al. Size distribution and optical properties of mineral dust aerosols transported in the western Mediterranean. Atmos. Chem. Phys. Discuss. 2016, 16, 1081–1104. [Google Scholar] [CrossRef] [Green Version]
- Taylor, M.; Kazadzis, S.; Gerasopoulos, E. Multi-modal analysis of aerosol robotic network size distributions for remote sensing applications: Dominant aerosol type cases. Atmos. Meas. Tech. 2014, 7, 839–858. [Google Scholar] [CrossRef] [Green Version]
- Augustine, J.A.; Hodges, G.B.; Dutton, E.G.; Michalsky, J.J.; Cornwall, C.R. An aerosol optical depth climatology for NOAA’s national surface radiation budget network (SURFRAD). J. Geophys. Res. Space Phys. 2008, 113, D11204. [Google Scholar] [CrossRef] [Green Version]
- Michalsky, J.J.; Schlemmer, J.A.; Berkheiser, W.E.; Berndt, J.L.; Harrison, L.C.; Laulainen, N.S.; Larson, N.R.; Barnard, J.C. Multiyear measurements of aerosol optical depth in the Atmospheric Radiation Measurement and Quantitative Links programs. J. Geophys. Res. Space Phys. 2001, 106, 12099–12107. [Google Scholar] [CrossRef]
- Schmid, B.; Tomlinson, J.M.; Hubbe, J.M.; Comstock, J.; Mei, F.; Chand, D.; Pekour, M.S.; Kluzek, C.D.; Andrews, E.; Biraud, S.; et al. The DOE ARM Aerial Facility. Bull. Am. Meteorol. Soc. 2014, 95, 723–742. [Google Scholar] [CrossRef]
- Kassianov, E.; Berg, L.K.; Pekour, M.; Barnard, J.; Chand, D.; Comstock, J.; Flynn, C.; Sedlacek, A.; Shilling, J.; Telg, H.; et al. A Closure Study of Total Scattering Using Airborne in Situ Measurements from the Winter Phase of TCAP. Atmosphere 2018, 9, 228. [Google Scholar] [CrossRef] [Green Version]
- Aiken, A.C.; Gallo, F.; Uin, J.; Springston, S.R.; Wang, J.; Zheng, G.; Kuang, C.; McComiskey, A.; Wood, R.; Flynn, C.; et al. Eastern North Atlantic (ENA) Aerosol Supplementary Site (S1) Data Analysis Report. 2019. Available online: https://www.osti.gov/biblio/1567063-eastern-north-atlantic-ena-aerosol-supplementary-site-s1-data-analysis-report (accessed on 5 May 2021).
- Zheng, G.; Wang, Y.; Aiken, A.C.; Gallo, F.; Jensen, M.P.; Kollias, P.; Kuang, C.; Luke, E.; Springston, S.; Uin, J.; et al. Marine boundary layer aerosol in the eastern North Atlantic: Seasonal variations and key controlling processes. Atmos. Chem. Phys. Discuss. 2018, 18, 17615–17635. [Google Scholar] [CrossRef] [Green Version]
- Bohren, C.; Huffman, D. Absorption and Scattering of Light by Small Particles; John Wiley & Sons: Hoboken, NJ, USA, 1983. [Google Scholar]
- Zawadowicz, M.A.; Suski, K.; Liu, J.; Pekour, M.; Fast, J.; Mei, F.; Sedlacek, A.J.; Springston, S.; Wang, Y.; Zaveri, R.A.; et al. Aircraft measurements of aerosol and trace gas chemistry in the eastern North Atlantic. Atmos. Chem. Phys. Discuss. 2021, 21, 7983–8002. [Google Scholar] [CrossRef]
- Aldhaif, A.M.; Stahl, C.; Braun, R.A.; Moghaddam, M.A.; Shingler, T.; Crosbie, E.; Sawamura, P.; Dadashazar, H.; Ziemba, L.; Jimenez, J.L.; et al. Characterization of the Real Part of Dry Aerosol Refractive Index Over North America from the Surface to 12 km. J. Geophys. Res. Atmos. 2018, 123, 8283–8300. [Google Scholar] [CrossRef]
- Kassianov, E.; Pekour, M.; Flynn, C.; Berg, L.K.; Beranek, J.; Zelenyuk, A.; Zhao, C.; Leung, L.R.; Ma, P.-L.; Riihimaki, L.; et al. Large Contribution of Coarse Mode to Aerosol Microphysical and Optical Properties: Evidence from Ground-Based Observations of a Transpacific Dust Outbreak at a High-Elevation North American Site. J. Atmos. Sci. 2017, 74, 1431–1443. [Google Scholar] [CrossRef]
- Bian, Q.; Ford, B.; Pierce, J.R.; Kreidenweis, S.M. A Decadal Climatology of Chemical, Physical, and Optical Properties of Ambient Smoke in the Western and Southeastern United States. J. Geophys. Res. Atmos. 2020, 125. [Google Scholar] [CrossRef]
- Ortega, I.; Coburn, S.; Berg, L.K.; Lantz, K.; Michalsky, J.; Ferrare, R.A.; Hair, J.W.; Hostetler, C.A.; Volkamer, R. The CU 2-D-MAX-DOAS instrument—Part 2: Raman scattering probability measurements and retrieval of aerosol optical properties. Atmos. Meas. Tech. 2016, 9, 3893–3910. [Google Scholar] [CrossRef] [Green Version]
- Shinozuka, Y.; Johnson, R.R.; Flynn, C.J.; Russell, P.B.; Schmid, B.; Redemann, J.; Dunagan, S.E.; Kluzek, C.D.; Hubbe, J.M.; Segal-Rosenheimer, M.; et al. Hyperspectral aerosol optical depths from TCAP flights. J. Geophys. Res. Atmos. 2013, 118, 12180–12194. [Google Scholar] [CrossRef]
- LeBlanc, S.E.; Redemann, J.; Flynn, C.; Pistone, K.; Kacenelenbogen, M.; Segal-Rosenheimer, M.; Shinozuka, Y.; Dunagan, S.; Dahlgren, R.P.; Meyer, K.; et al. Above-cloud aerosol optical depth from airborne observations in the southeast Atlantic. Atmospheric Chem. Phys. Discuss. 2020, 20, 1565–1590. [Google Scholar] [CrossRef] [Green Version]
- Uin, J.; Aiken, A.C.; Dubey, M.K.; Kuang, C.; Pekour, M.; Salwen, C.; Sedlacek, A.J.; Senum, G.; Smith, S.; Wang, J.; et al. Atmospheric Radiation Measurement (ARM) Aerosol Observing Systems (AOS) for Surface-Based In Situ Atmospheric Aerosol and Trace Gas Measurements. J. Atmos. Ocean. Technol. 2019, 36, 2429–2447. [Google Scholar] [CrossRef]
| Publisher’s Note: MDPI stays neutral with regard to jurisdictional claims in published maps and institutional affiliations. |
© 2021 by the authors. Licensee MDPI, Basel, Switzerland. This article is an open access article distributed under the terms and conditions of the Creative Commons Attribution (CC BY) license (https://creativecommons.org/licenses/by/4.0/).


 ,
, 


