Article

Diurnal Variations in Physiological Characteristics, Photoassimilates, and Total Ascorbate in Early and Late Sown Indian Wheat Cultivars under Exposure to Elevated Ozone

by
Durgesh Singh Yadav
1,
Bhavna Jaiswal
2,
Shashi Bhushan Agrawal
2 and
Madhoolika Agrawal
2,*
1
Department of Botany, Government Raza P.G. College, Rampur 244901, India
2
Department of Botany, Institute of Science, Banaras Hindu University, Varanasi 221005, India
*
Author to whom correspondence should be addressed.
Submission received: 29 October 2021 / Revised: 23 November 2021 / Accepted: 25 November 2021 / Published: 26 November 2021
(This article belongs to the Special Issue Tropospheric Ozone Assessment in the Urban Environment)

Abstract

:
Rising tropospheric ozone (O3) in the atmosphere is detrimental to crop’s productivity and is one of the reasons for a warmer climate. The present study describes diurnal changes in gaseous exchange, chlorophyll fluorescence, ascorbic acid, and photoassimilate parameters in flag leaves of four Indian wheat (Triticum aestivum L.) cultivars (two early sown and two late sown cultivars) under ambient and elevated O3 treatments, using the open-top chambers (OTCs). Results showed that the diurnal pattern of photosynthetic rate (Ps), sucrose, and ascorbic acid content varied according to changes in photosynthetically active radiation (PAR) and O3 concentrations during the daytime and were maximum between 10:00 to 12:00. The present study suggested that elevated O3 caused more negative effects on photosystem II in early sown compared to late sown cultivars. The greater loss of photosynthesis led to lower production of photoassimilates in early sown cultivars, which utilized more assimilates in ascorbic acid formation for detoxification of ROS formed due to elevated O3. This work will also help to identify the robustness of physiological machinery in different wheat cultivars under elevated levels of O3, and may be used for selection of suitable cultivars during future breeding programs.

1. Introduction

Predicting the exact concentration of ambient ozone (O3) in the future is critical as the concentration of O3 varies diurnally, seasonally, and spatially [1,2,3,4]. If precursor gases of O3 are produced nearby, peaks generally occur around noon, but at more distance, the peaks of O3 occur in the late afternoon [5]. Many researchers have developed exposure regimes where ambient O3 concentration reaches its highest level diurnally in mid- to late-afternoon [6]. The concentration of tropospheric O3 is increasing rapidly in the Asian countries since 1990 due to rising O3 precursors [3,7]. As tropospheric O3 is a greenhouse gas and long-range transboundary air pollutant, the rising trend of O3 concentration is impacting climate, human health and vegetation [3,7]. Many studies have estimated wheat yield losses under future climate and air pollution scenarios [8,9,10,11]. The physiological traits of plants may depend on stomatal and non-stomatal factors which are in turn controlled by external environmental factors such as light intensity and air pollutants [12,13]. Therefore, diurnal changes in O3 concentration may modify the response pattern of the plants. Oksanen and Holopainen [14] reported that high O3 peaks caused foliar injury, but the cumulative long-term exposure caused growth reductions in birch plants. Likewise, the growth and yield of wheat are mostly affected at higher O3 rather than intermediate peak levels [15,16,17,18]. Furthermore, ascorbic acid is most potential scavenger of O3 molecules in the apoplastic region, and detoxifies a significant portion of O3 before it enters the cells [19,20,21]. Therefore, ascorbate content in different plants is a true representative of O3 tolerance [1,22].
The diurnal changes in gas exchange parameters are documented as the best indications in reflecting the response of photosynthetic apparatus to environmental stresses [18,23]. Several studies have revealed that peak O3 levels suppress the accumulation of photoassimilates (carbohydrates) and the impact varies with species and cultivars based on the sensitivity of the plants to O3 [24,25]. Therefore, investigating the diurnal changes in parameters such as ascorbic acid and carbohydrates in test wheat cultivars under ambient O3 and elevated O3 treatments could be interesting in relation to understanding the flow of photoassimilates diurnally to elucidate the relationship amongst the diurnal variations in O3 concentrations, gas exchange, chlorophyll fluorescence, photoassimilates and ascorbic acid in flag leaves of wheat cultivars. The objectives of the present study were (i) to assess the diurnal variations in gas exchange parameters and chlorophyll fluorescence; (ii) to estimate diurnal changes of photoassimilates; and (iii) to investigate the diurnal changes of ascorbic acid (a major O3 detoxification agent) concerning diurnal O3 in flag leaves of early and late sown wheat cultivars under the ambient and elevated level of O3. The effect of elevated O3 on leaf constituents of early and late sown wheat cultivars was also investigated.

2. Materials and Methods

2.1. Experimental Site and Design

The experiment was performed in 2018 inside the open-top chambers (OTCs) having 1.5 m diameter and 1.8 m height at the Botanical Garden, Banaras Hindu University, Varanasi, India (25°16′ N, 82°59′ E, with an annual average temperature of 26.9 °C and total rainfall of 750 mm). Early sown cultivars (lifespan ~140 days) were sown in the field on 9th November and late sown cultivars (lifespan ~120 days) were sown on 5th December. Plants were maintained in six rows with 15 cm distances and around 30 plants per OTC. The field soil of each OTC was treated with recommended dose of synthetic nitrogen (N), phosphorous (P) and potassium (K) fertilizer in ratio of 60, 60 and 40, respectively, as a basal dressing before sowing seeds. Further, 1st and 2nd top dressings of N (30 kg ha−1 each) were applied at the tillering and anthesis stages. The OTC grown plants were exposed to two treatments (i) OTCs, receiving ambient O3 treatment (ii) OTCs, receiving ambient + 20 ppb O3 (elevated O3 treatment). More details on the experimental design, set-up, O3 exposure, cultivars, and raising of plants are given in Yadav et al. [10,26]. Elevated O3 treatment was provided through O3 generator (A-series, Model: A2G; Faraday, Coimbatore, TN, India) for 5 h day−1 at peak O3 time (10:00 to 15:00) from seed germination to maturity of plants. Monitoring of O3 inside the OTC and photosynthetic active radiation (PAR) at the experimental site were performed through O3 analyzer (Model: APOA 370, Horiba Ltd., Kyoto, Japan) and a radiometer (Model: PMA2100, Solar Light Company, Inc., Glenside, PA, USA), respectively.

2.2. Plant Sampling

In this study, four Indian high-yielding, bread-making wheat cultivars (Triticum aestivum L.) were selected according to their popularity in the Indo-Gangetic Plain region and having two different (early and late) sowing periods. Diurnal variations in gaseous exchange, chlorophyll fluorescence, ascorbic acid, and carbohydrate contents were measured in the flag leaf of two early sown wheat cultivars (HUW468 and HD3086) and two late sown wheat cultivars (HUW234 and HD3118) under ambient and elevated O3 treatments at the reproductive stage. The gas exchange parameters (photosynthetic rate (Ps) and stomatal conductance (gs)) were measured through LI-6400XT portable photosynthesis system (LI-6400XT; Licor, Inc., Lincoln, NE, USA) with 2 × 3 cm size leaf cuvette. Simultaneously, on the same plants, chlorophyll fluorescence (Fv/Fm), electron transport rate (J), photochemical quenching (qP), and non-photochemical quenching (NPQ) were also measured using a CIRAS-3 portable photosynthesis system (PP Systems, Haverhill, Amesbury, MA, USA) with 25 × 7 mm size PLC3 universal leaf cuvette. Five plants of each cultivar under ambient and elevated O3 treatments were selected and tagged for the measurements at 5 different times of a day at 2-h intervals from 8:00 to 16:00 (i.e., 8, 10, 12, 14, 16 h local time). The observation time was categorized into early morning (8–10 a.m.), late morning (10:00 –12:00), noontime (12:00–14:00), afternoon (14:00–16:00) and late afternoon (16:00–18:00). Physiological measurements were made on fully expanded flag leaves devoid of any visible symptoms on 2 February 2018 during reproductive stage. At each time interval of samplings, flag leaves were collected from the same tagged plants where physiological measurements were made. After taking measurements of photosynthesis and fluorescence, flag leaves were harvested and half of the samples were transferred to liquid N2 and stored at −80 °C for the analysis of ascorbic acid (AsA) and the other half was oven-dried at 60 °C for the estimation of carbohydrates.

2.3. Ascorbic Acid Content

For the estimation of AsA, fresh leaf samples (100 mg) were crushed in 0.5% oxalic acid-EDTA extracting solution and centrifuged at 6000× g for 15 min. The supernatant was used for the quantification of AsA by using the methodology of Keller and Schwager [27]. The absorbance (Es) of the pink colored solution (reaction mixture of supernatant (1 mL) and DCPIP (5 mL)) was taken at 520 nm wavelength using a UV-VIS spectrophotometer (Model 2203, Systronics, Bengaluru, India). The pink colored solution was bleached by adding a drop of 1% aqueous AsA to the cuvette and again absorbance was recorded at the same wavelength (Et). The difference between the two absorbances was used to estimate the quantity of AsA in the sample.

2.4. Carbohydrates

The leaf samples (100 mg dry weight) were homogenized in 80% ethanol. The solutions were centrifuged at 14,000× g rpm for 20 min and the pellets were sequentially washed five times with 80% ethanol then centrifuged at the same rpm. The collected supernatant was used for estimating total soluble and sucrose contents and the pellets were used for estimation of starch content. Total sugar and starch contents (mg g−1 dry wt. leaf) were determined by the phenol-sulfuric acid colorimetric assay method [28]. Sucrose content was estimated by the colorimetric KOH method. Detailing of estimation procedures for total sugar, sucrose, and starch content are elaborated in Yadav et al. [29].

2.5. Statistical Analysis

Significant differences between ambient O3 and elevated O3 were evaluated for all the measured parameters using a one-way analysis of variance (ANOVA). Principal component analysis (PCA) was applied to investigate the correlation among studied parameters, treatments, and daytime. All the statistical tests were performed using SPSS software (SPSS Inc. version 21.0, IBM Corp, Armonk, NY, USA).

3. Results

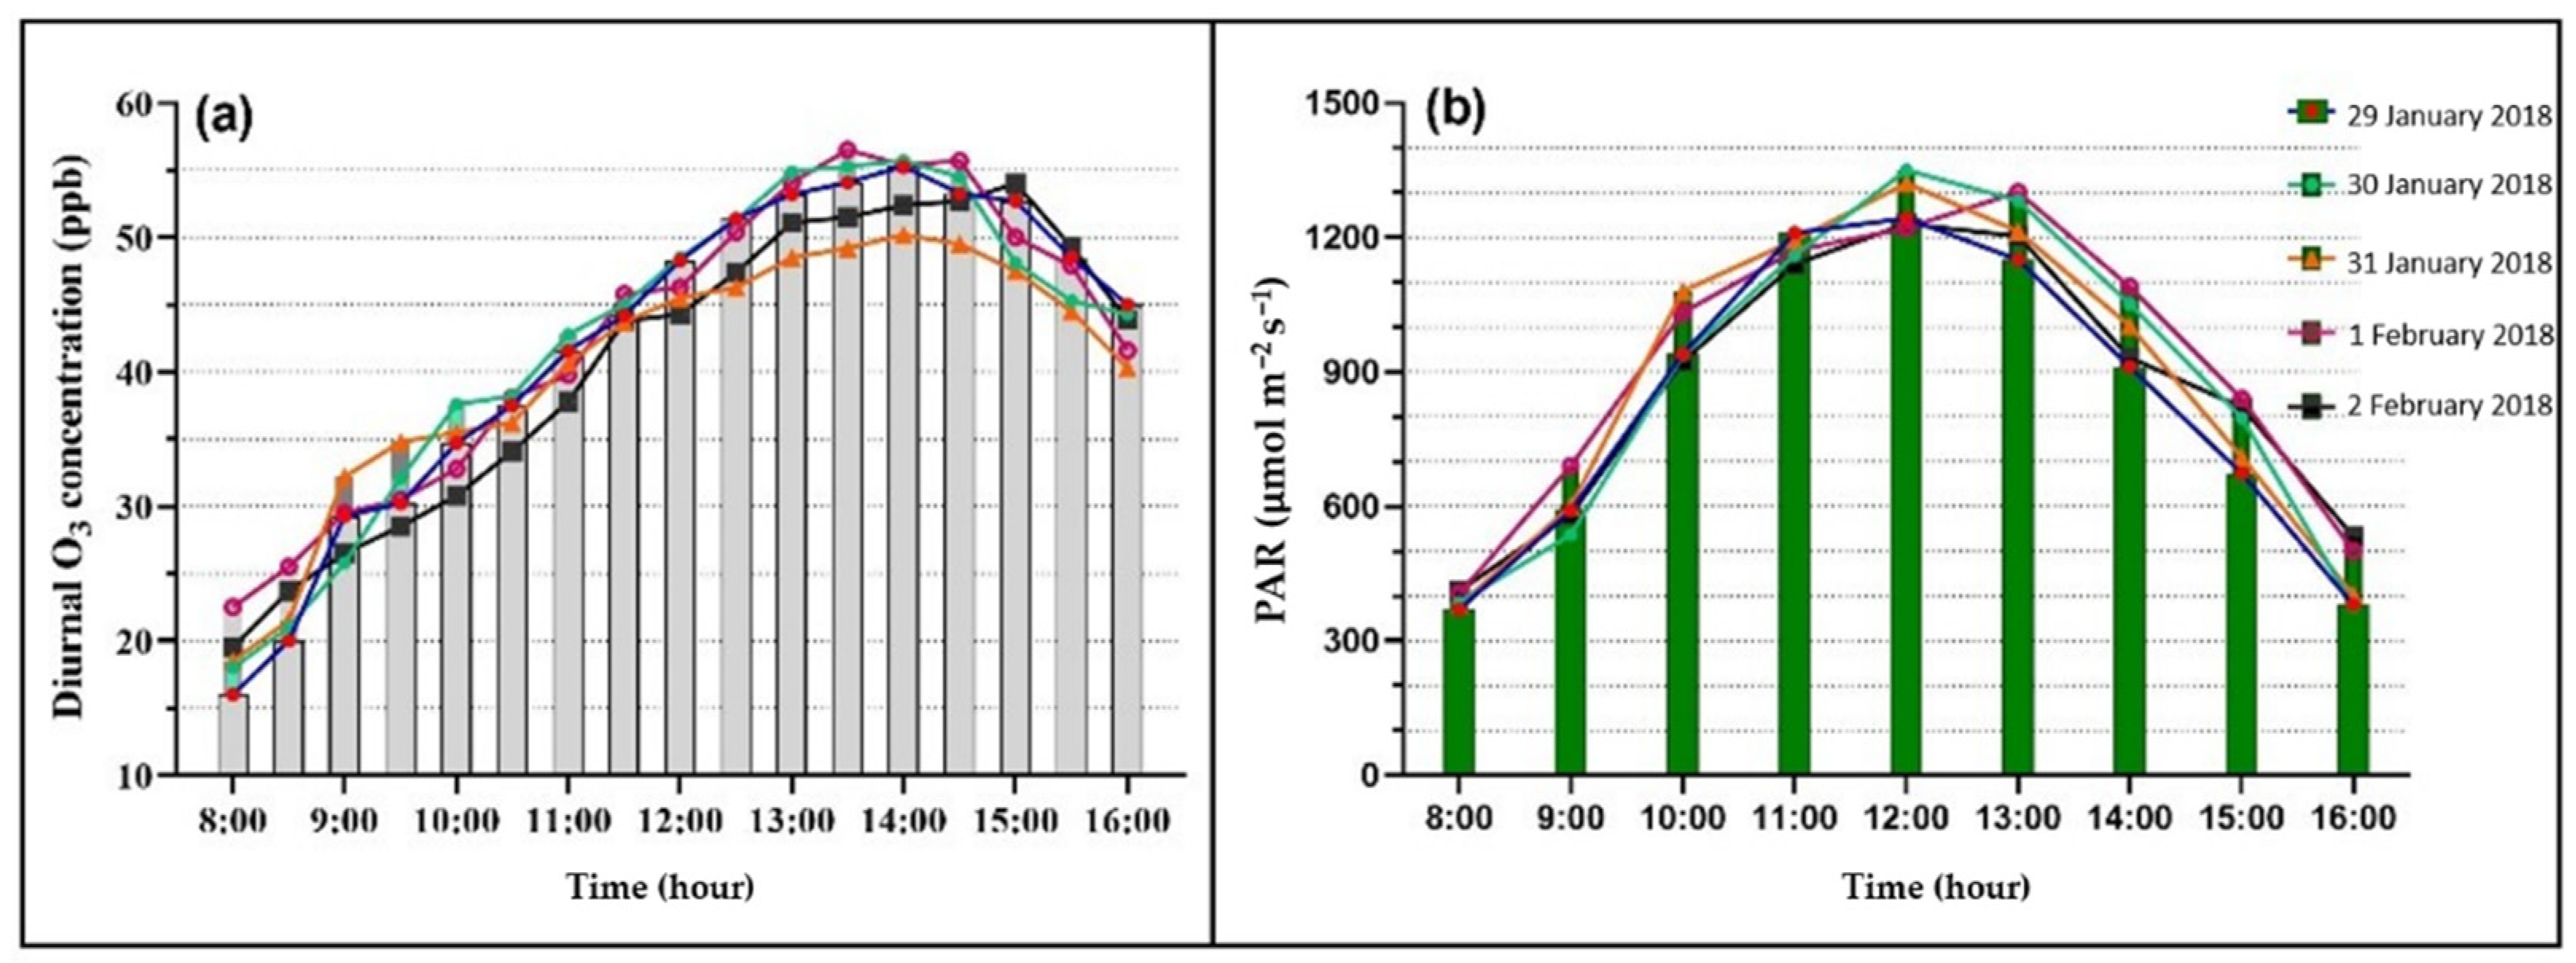
3.1. Diurnal Variations in Ambient O3 and PAR

The profiles of O3 and photosynthetically active radiation (PAR) showed the highest values during the noon and afternoon period (Figure 1). During the five days of monitoring from 29 January 2018 to 2 February 2018, the O3 has a typical diurnal profile and ambient concentration during the daytime (8:00–16:00) varied between 16 to 56.5 ppb with peak concentration during 13:00–15:00 (Figure 1). Similarly, PAR varied between 370 to 1350 µ mol m−2 s−1 during the daytime (8:00–16:00) with a peak at 1 p.m. (Figure 1). During the present study, seasonal 8 h mean O3 concentrations under ambient and elevated O3 were 45.87 and 67.17 ppb, respectively [10].

3.2. Diurnal Gaseous Exchange and Chlorophyll Fluorescence

In general, the photosynthetic rate (Ps) was higher in plants grown under ambient compared to elevated O3 (Figure 2). While a higher reduction in Ps rate was observed in early sown cultivars (ranging from 12 to 30%) compared to late sown cultivars (9 to 18%) under elevated O3 treatment. The Ps of leaves increased rapidly in the morning and reached a maximum between 9:00 to 12:00 in all the test cultivars, followed by a progressive decrease in Ps till 4 p.m. (Figure 2). However, a small depression in Ps was observed at noon in HUW468, HD3086, and HUW234 under elevated O3 treatment, thereby, displaying a double peak of Ps at 10 am and 2 p.m. in these cultivars (Figure 2).
Similar to Ps, stomatal conductance (gs) was significantly lower under elevated O3 treatment compared to ambient O3 (Figure 2). The gs was maximum in all the test cultivars around 8:00 to 9:00 and, thereafter, a drastic decrease was observed, except in HUW468 and HD3118 under ambient O3 treatment (Figure 2).
The Fv/Fm ratio was higher than 0.8 under ambient O3 treatment in all the cultivars and was found to be high during the morning period (Figure 2). The Fv/Fm ratio showed reductions under ambient and elevated O3 treatments at around 2:00 p.m. in early sown cultivars and 12:00 to 2:00 p.m. in late sown cultivars (Figure 2). A recovery in Fv/Fm was observed in the evening period in all test cultivars and treatments. Significant reductions in Fv/Fm were observed under elevated O3 compared to ambient O3 treatment during daytime (Figure 2).
Chloroplastic electron transport rate (J) was progressively increased with increasing light intensity from morning to evening in all cultivars and treatments with a maximum in late sown cultivars compared to early sown cultivars (Figure 3). In the evening period, the J was reached at the highest level, while no significant differences were observed between ambient and elevated O3 treatments (Figure 3).
Photochemical quenching (qP) of late sown cultivars did not vary significantly with daytime, while a depression at 14:00 and then an increase was found in early sown cultivars (Figure 3). However, qP was significantly high in HD3118 followed by HUW468, HD3086, and HUW234. The qP of early sown cultivars showed a larger reduction than late sown under elevated O3 (Figure 3).
Non-photochemical quenching (NPQ) was enhanced under elevated O3 as compared to ambient O3 in all cultivars and also increased from morning to evening (Figure 3). However, late sown cultivars showed higher induction in NPQ under elevated O3 compared to early sown cultivars (Figure 3).

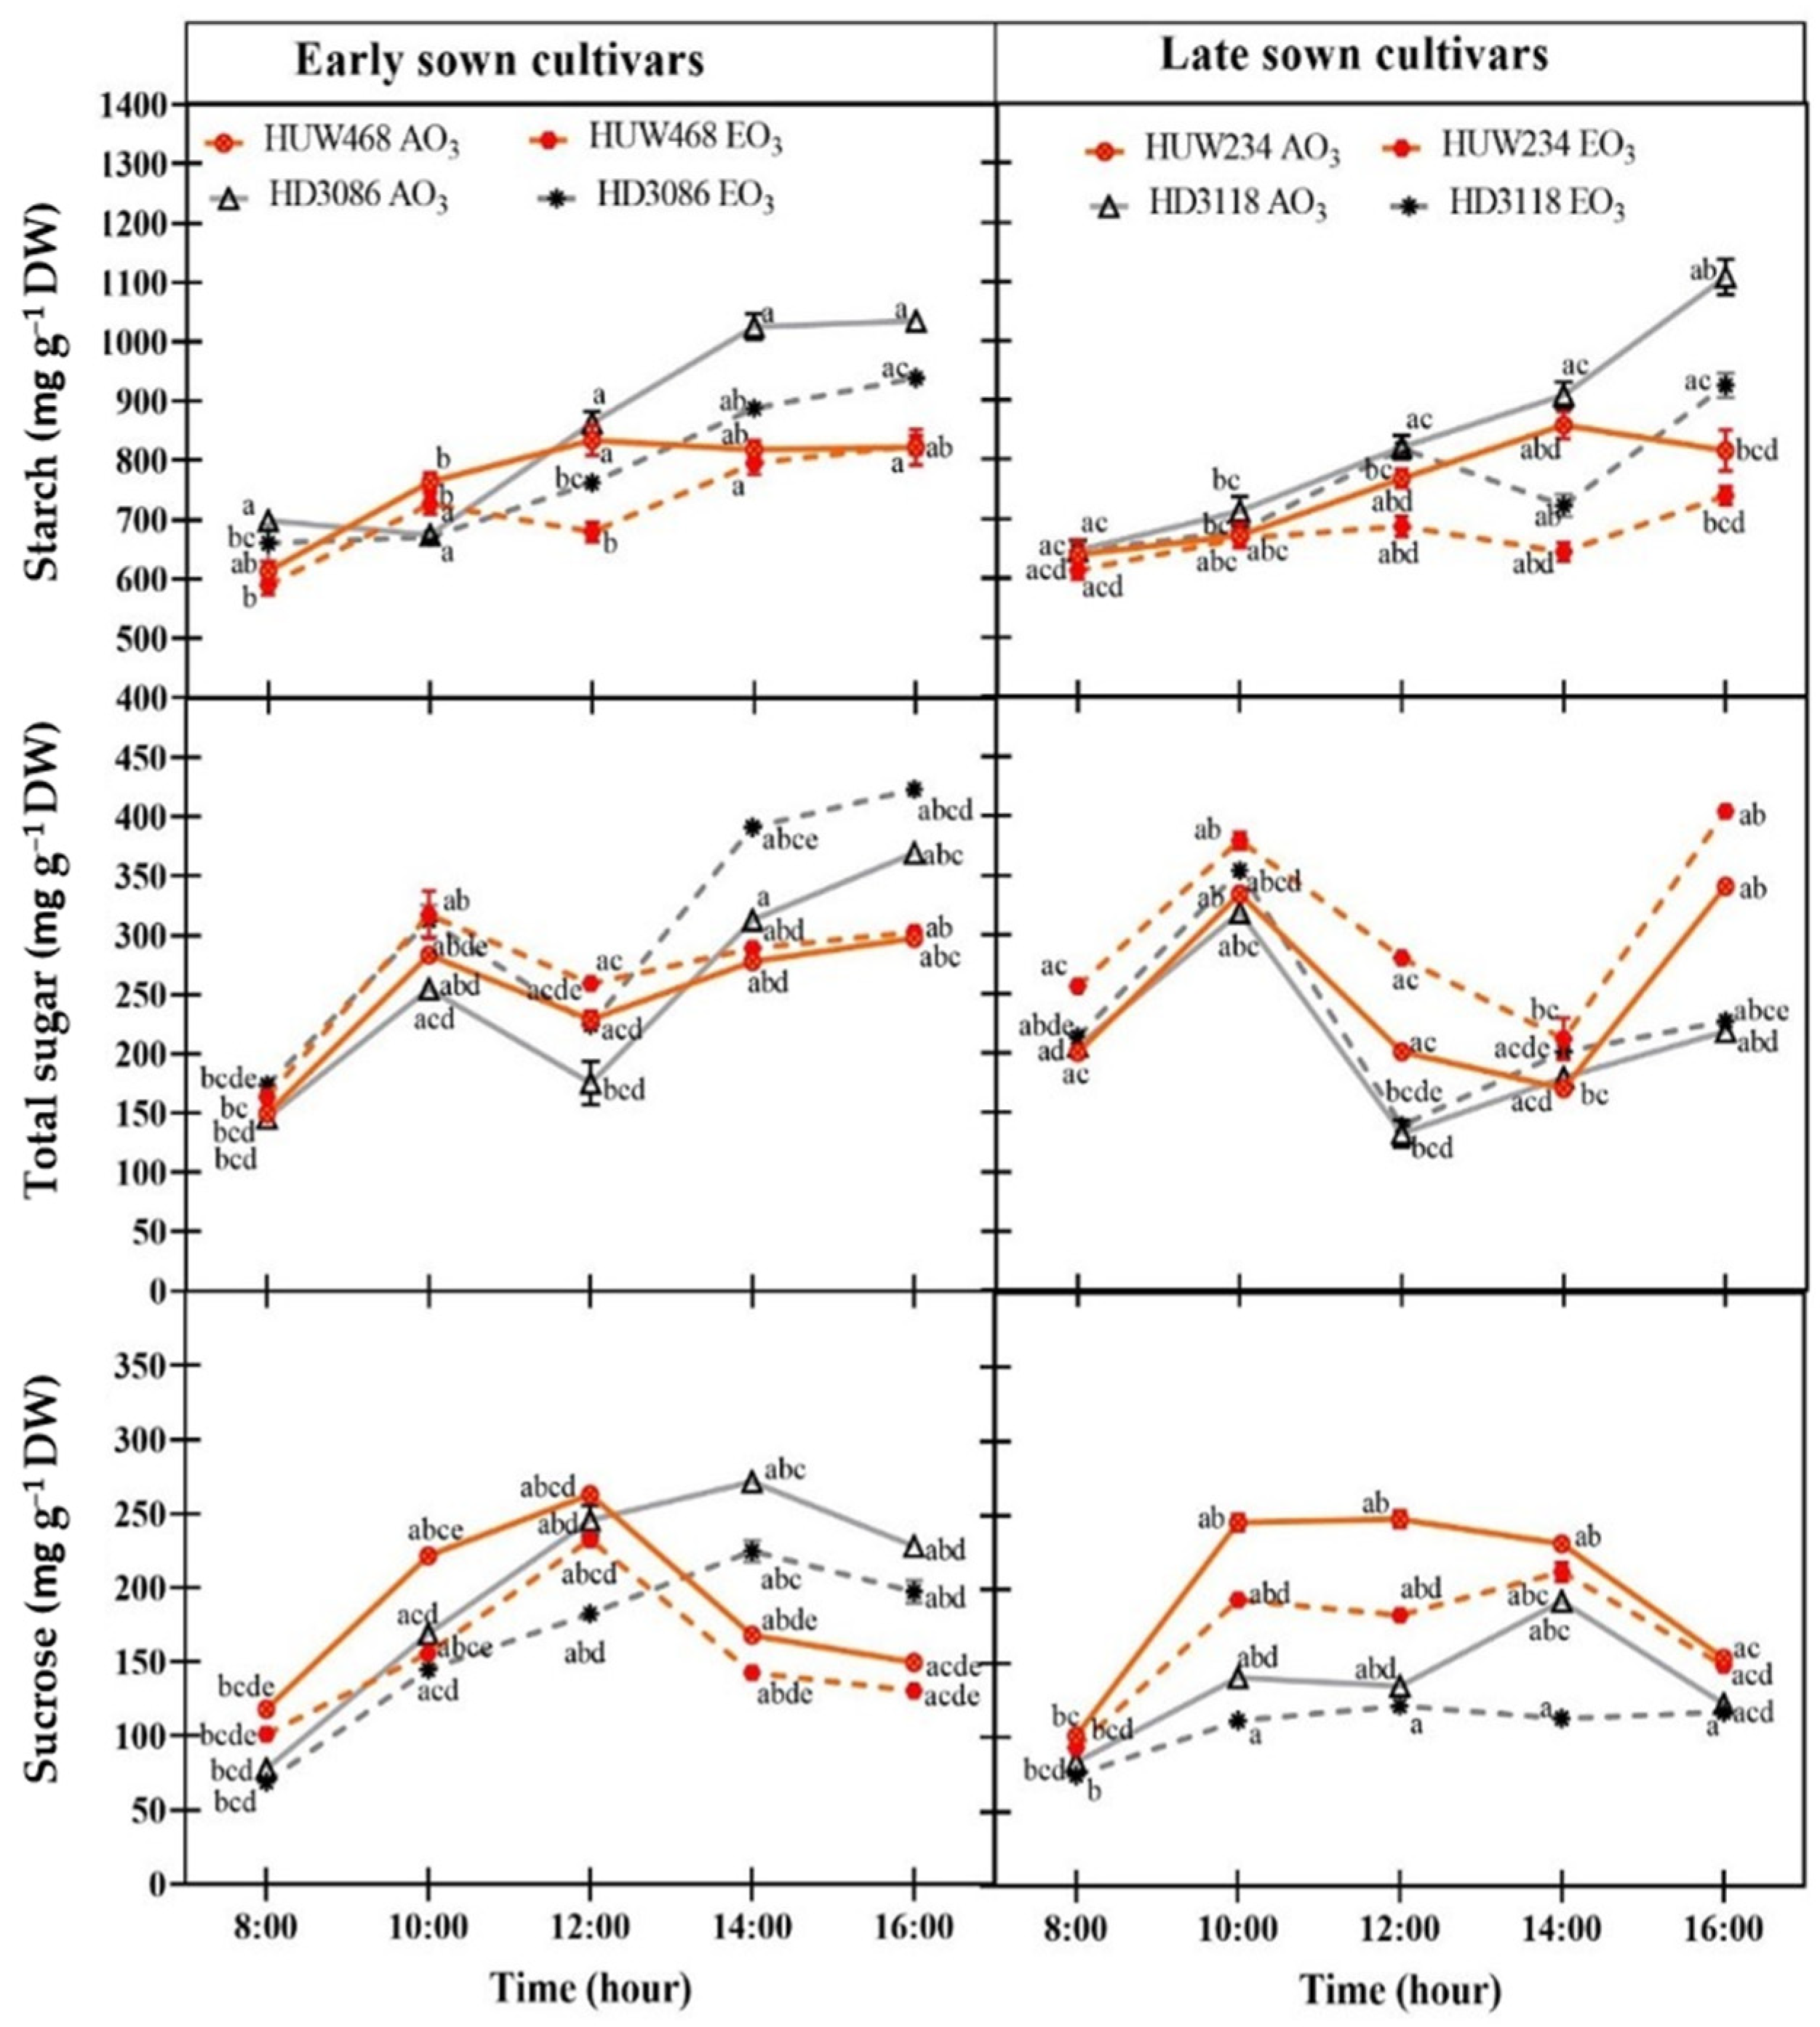
3.3. Diurnal Variations in Leaf Carbohydrate Pool

The concentration of photoassimilates in the leaves also varied significantly during daytime due to the variations in PAR and O3 levels. The starch content progressively increased from morning to afternoon in all cultivars and treatments (Figure 4). Under elevated O3 treatment, the starch content was significantly reduced between 10:00 to 12:00 in early sown cultivars and at around 14:00 in late sown cultivars (Figure 4). The highest starch accumulation in leaves was observed in the evening period in all cultivars and treatment (Figure 4).
Total neutral sugar content increased under elevated O3 compared to ambient O3 treatment, particularly in HD3086 and HUW234 at each interval, and the highest accumulation was found during the evening period (Figure 4). The total sugar content was maximum during the late morning and decreased towards midday and further increased during the afternoon in all the cultivars and treatments (Figure 4).
During the daytime, sucrose content was significantly reduced under elevated O3 as compared to ambient O3 treatment at each interval of a sampling (Figure 4). Sucrose content increased from morning to 14:00 then went down in all the test cultivars. However, elevated O3-induced reduction in sugar content varied with cultivars and time of the day (Figure 4). The early sown cultivars showed a relatively greater reduction (11 to 25%) in sucrose content than the late sown cultivars (3 to 20%) under elevated O3 treatment (Figure 4).

3.4. Diurnal Variations in Ascorbic Acid Content

Ascorbic acid was found to increase significantly under elevated O3 treatment in the morning period, while the changes were insignificant during the noon and afternoon periods (Figure 5). The ascorbic acid content in early sown cultivars was increased maximally by 29% during the late morning, while an increase of 10% was observed in late sown cultivars during the early morning under elevated O3 treatment (Figure 5).

3.5. Principal Component Analysis (PCA)

In the early sown cultivars, PCA analysis revealed a strong positive association of J, NPQ, ascorbic acid, total sugar, sucrose, and starch with diurnal changes in O3 concentration and daytime, while Ps, gs, Fv/Fm ratio, and qP were negatively associated with daytime and O3 (Figure 6). However, Ps was also significantly influenced by changes in diurnal PAR.
In the late sown cultivars, ascorbic acid was positively associated with diurnal changes in O3 concentrations and daytime, while Fv/Fm ratio, J, qP, NPQ, total sugar, and starch content were positively associated with treatment. But Ps, gs, and sucrose content showed negative associations with O3 treatment (Figure 6).

4. Discussion

Diurnal physiological responses of wheat cultivars against changing O3 concentrations during the day period were investigated in this study to understand its present and future impact on early and late sown wheat cultivars. Since the background O3 concentration is increasing in troposphere, future background O3 levels could be a reason for global warming and will play a significant role in climate change [7]. Therefore, screening the better performing cultivars under elevated O3 conditions may help in sustaining potential yield. The results clearly demonstrated that diurnal photosynthesis, photoassimilates and ascorbate content in early sown and late sown wheat cultivars were significantly affected by O3 pollution and closely related to changes in environmental conditions. Diurnal changes in photosynthesis, sucrose content, and ascorbic acid resembled the pattern of changes in PAR intensity and O3 concentration, which suggested that physiological responses of plants are greatly affected by current environmental status and available light. The maximum physiological activity was recorded between 10:00 to 12:00. In agreement with earlier findings of Feng et al. [15], Vongcharoen et al. [30], and Wang et al. [6], Ps, gs, and chlorophyll fluorescence corresponded directly to diurnal O3 concentrations and PAR during noon and thereafter. Moreover, Rai et al. [18] also reported that diurnal changes in Ps and gs of wheat paralleled with ambient O3 concentrations and PAR levels when the environmental conditions were relatively mild. Betzelberger et al. [31] observed a decrease in net assimilation and stomatal conductance in U.S. soybean cultivars during the midday period under elevated O3 treatment due to the O3-induced transient stomatal closure.
In the present study, the highest Ps and gs were recorded during morning hours with increasing radiation from early morning to late morning. Similar trends were reported by Mohotti and Lawlor [32] in fully expanded Camellia sinensis leaves in the winter season, however, Ps, gs, Fv/Fm ratio, and qP decreased and NPQ increased during midday from 12:00 to 2:00 p.m. Mohotti and Lawlor [32] suggested that it might be because of high irradiance, leaf temperature, and VPD during midday. Likewise, Huang et al. [33] suggested that depression in CO2 assimilation at midday was mostly attributed to non-stomatal limitation due to the increases of antenna heat dissipation, reversible inactivation of PSII reaction centers, and photorespiration in response to the high light intensity. It is likely that heat dissipation, PSII down-regulation, and photorespiration co-operate together to prevent the chloroplast from photodamage. Diurnal variations in Ps and Fv/Fm ratio have also been observed by Santanoo et al. [34] and Vongcharoen et al. [30] in four commercial cassava genotypes and revealed that plants′ prominent mechanism to avoid damages from stress during the afternoon in the hot season was to reduce leaf temperature by enhancing transpiration, early stomatal closure, and increase in NPQ.
In our study, the quantum efficiency of PSII represented by the Fv/Fm ratio was the lowest around 2:00 p.m. in all the cultivars under ambient and elevated O3 treatments, which could be correlated with natural high light intensity. Vongcharoen et al. [30] also observed reductions in Fv/Fm in the noon period due to high PAR. Reduction of Fv/Fm ratio indicates an alteration of PSII photochemistry [35]. However, a reduction in photosynthetic rate may influence the rate of ATP and NADPH utilization, thus altering the PSII efficiency [36]. Meyer et al. [17] reported 2–3% reductions in Fv/Fm in the flag leaves of wheat due to the exposure to 65 ppb O3 and 5% due to 110 ppb O3 for 12 h during the anthesis period. In the present study, elevated O3 reduced the photochemical quenching and induced the non-photochemical quenching in all the test cultivars, but no significant changes were observed in electron transport rate under elevated O3 treatment. However, qP and NPQ showed diurnal fluctuations among the cultivars.
Heath et al. [37] found higher O3 concentration in the afternoon as a result of reduced gs. It was further suggested that due to higher antioxidant activity, morning O3 fluxes were less biologically effective than afternoon fluxes. However, plants can regulate the entry of O3 by altering the stomatal conductance of leaf tissue and can detoxify O3 once it enters the leaf to protect from O3 damage, but this defense would be limited under higher O3 concentration [38]. The tolerance of plants to O3 due to higher ascorbic acid content has been observed in many plant species, e.g., Triticum aestivum [1,39,40], Ischaemum rugosum [41], Trifolium repens [42], snap bean [19], soybean [43] and Costus pictus [44]. In the present study, ascorbic acid increased markedly with higher light intensities and diurnal increase in ambient O3 concentration, which explains the strong positive correlation of these variables with treatment in the PCA. The increase in ascorbic acid content under elevated O3 treatment as compared to ambient O3 gradually disappeared with the increasing daytime in HUW468 and HUW234. Ascorbic acid content was low in the morning and increased around noon, and it becomes more stagnant toward the evening. A similar variation in ascorbic acid was reported by Shinohara and Suzuki [45].
The elevated O3 exposed plants showed reductions in Ps, gs, Fv/Fm ratio leading to negative effects on the production of sucrose and starch. Likewise, Shinohara and Suzuki [45] reported that the rate of photosynthesis retarded at lower PAR levels as a result of reduced total sugar content in the leaves of lettuce. The present study revealed that total sugar increased during the daytime and was highest in the evening period in both the early sown cultivars and HUW234 under ambient and elevated O3 treatments. Sideris et al. [46] also found the highest total sugar level in the leaves of Ananas comosus during the evening period at 6:00 p.m.
In this experiment, we found a positive correlation between ascorbic acid and total sugar content. Previous studies reported, the ascorbic acid is synthesized in plants via the d-mannose/l-galactose (glucose derivatives) pathway [47,48,49]. Therefore, a positive correlation can be expected between ascorbic acid and total sugar contents. The elevated O3 stress induces the accumulation of both total soluble sugar and ascorbic acid content in the leaves in the present study. Previous reports suggested that high O3 concentration inside the leaves may elevate concentrations of total sugars and also cause a shift in the partitioning of current assimilates from starch (storage compound) to compounds involved in O3 injury-repair responses such as ascorbic acid [50,51,52]. Total ascorbate in leaf tissue is denoted by pooling of ascorbic acid and dehydroascorbic acid (DHA) content [19]. Ascorbic acid content is increased under elevated O3 conditions due to overexpressed DHA reductase [53]. An O3-induced stimulation of ascorbic acid synthesis was also observed in pumpkin leaves [54]. The capacity of ascorbic acid and DHA conversion is measured by the ascorbate-glutathione cycle [55]. Reduced ascorbic acid directly reacts with ROS and causes oxidation of ascorbic acid to DHA [21]. Earlier experiments confirmed that ascorbic acid content directly correlates with O3 tolerance in wheat, rice and soybean [20,21,56,57]. Shinohara and Suzuki [45] reported a positive correlation between ascorbic acid and sugar content in leaves of lettuce. However, Feng et al. [1] observed no effect of elevated O3 or varieties on the ascorbate concentration of the apoplast and leaf tissues in winter wheat.

5. Conclusions

Diurnal changes in PAR and O3 concentrations have significantly affected the chemical composition of the flag leaf tissues of wheat cultivars. All the test cultivars of wheat showed maximum physiological activities during the late morning under both ambient O3 and elevated O3 treatments, while storage of photoassimilates was more active during the afternoon period. Rising PAR intensity from 10:00 a.m. to 12:00 p.m. stimulated the production of photoassimilates and ascorbic acid content in all the test cultivars. However, elevated O3 reduced the photosynthetic activity and enhanced total soluble sugar and ascorbic acid content in the leaves of the plants with maximum variations in early sown cultivars compared to late sown. The ascorbic acid contents at different diurnal intervals did not vary significantly after 10 a.m., which could be related to the carbohydrate supplies in the leaves during daytime. The present study suggested that elevated O3 concentration caused more negative effects on photosystem II in early sown compared to late sown cultivars. The greater photoinhibition in early sown cultivars due to the deactivation of PSII is evidenced by the higher reduction in Fv/Fm ratio under elevated O3 treatment. Impaired photosynthesis led to lower levels of photoassimilates in early sown cultivars, which were also utilized in ascorbic acid formation for detoxification of excess O3 molecules inside the leaf. These findings also suggest the high sensitivity of early sown cultivar towards the future O3 level in the atmosphere. Early stomatal closure in leaves could be a better solution for crop breeders to prevent the damage in photosynthetic machinery and develop tolerance in crops from high O3 and high PAR intensity during the afternoon.

Author Contributions

D.S.Y.: investigation, methodology, validation, software, data curation, writing—original draft. B.J.: investigation, methodology, validation, writing-review and editing. S.B.A.: supervision, formal analysis, visualization, project administration, writing—review and editing. M.A.: supervision, conceptualization, funding acquisition, project administration, writing—review and editing. All authors have read and agreed to the published version of the manuscript.

Funding

The research was supported by the Interaction of Climate Extremes, Air Pollution and Agro-ecosystems (CiXPAG) project (grant no. 244551) from the Research Council of Norway, Centre for International Climate Research (CICERO), Oslo, Norway.

Institutional Review Board Statement

Not applicable.

Informed Consent Statement

Not applicable.

Data Availability Statement

Data set available on request to corresponding authors.

Acknowledgments

The authors are thankful to the Head, Department of Botany, Banaras Hindu University, and Coordinators, CAS in Botany, Institute of Eminence and Interdisciplinary School of Life Sciences for providing the instruments and necessary facilities to carry out the work.

Conflicts of Interest

The authors declare no conflict of interest.

References

  1. Feng, Z.; Pang, J.; Nouchi, I.; Kobayashi, K.; Yamakawa, T.; Zhu, J. Apoplastic ascorbate contributes to the differential ozone sensitivity in two varieties of winter wheat under fully open-air field conditions. Environ. Pollut. 2010, 158, 3539–3545. [Google Scholar] [CrossRef] [PubMed]
  2. Tiwari, S.; Agrawal, M. Tropospheric Ozone and Its Impacts on Crop Plants: A Threat to Future Global Food Security; Springer: New York, NY, USA, 2018; ISBN 9783319718736. [Google Scholar]
  3. Mills, G.; Pleijel, H.; Malley, C.S.; Sinha, B.; Cooper, O.R.; Schultz, M.G.; Neufeld, H.S.; Simpson, D.; Sharps, K.; Feng, Z.; et al. Tropospheric ozone assessment report: Present-day tropospheric ozone distribution and trends relevant to vegetation. Elementa 2018, 6, 12. [Google Scholar] [CrossRef]
  4. Ren, J.; Hao, Y.; Simayi, M.; Shi, Y.; Xie, S. Spatiotemporal variation of surface ozone and its causes in Beijing, China since 2014. Atmos. Environ. 2021, 260, 118556. [Google Scholar] [CrossRef]
  5. Colls, J. Air Pollution, 2nd ed.; Bess Pub: London, UK, 2002. [Google Scholar]
  6. Wang, X.; Zheng, Q.; Feng, Z.; Xie, J.; Feng, Z.; Ouyang, Z.; Manning, W.J. Comparison of a diurnal vs. steady-state ozone exposure profile on growth and yield of oilseed rape (Brassica napus L.) in open-top chambers in the Yangtze Delta, China. Environ. Pollut. 2008, 156, 449–453. [Google Scholar] [CrossRef]
  7. Gaudel, A.; Cooper, O.R.; Ancellet, G.; Barret, B.; Boynard, A.; Burrows, J.P.; Clerbaux, C.; Coheur, P.F.; Cuesta, J.; Cuevas, E.; et al. Tropospheric Ozone Assessment Report: Present-day distribution and trends of tropospheric ozone relevant to climate and global atmospheric chemistry model evaluation. Elementa 2018, 6, 39. [Google Scholar] [CrossRef]
  8. Avnery, S.; Mauzerall, D.L.; Liu, J.; Horowitz, L.W. Global crop yield reductions due to surface ozone exposure: 2. Year 2030 potential crop production losses and economic damage under two scenarios of O3 pollution. Atmos. Environ. 2011, 45, 2297–2309. [Google Scholar] [CrossRef]
  9. Lal, S.; Venkataramani, S.; Naja, M.; Kuniyal, J.C.; Mandal, T.K.; Bhuyan, P.K.; Kumari, K.M.; Tripathi, S.N.; Sarkar, U.; Das, T.; et al. Loss of crop yields in India due to surface ozone: An estimation based on a network of observations. Environ. Sci. Pollut. Res. 2017, 24, 20972–20981. [Google Scholar] [CrossRef] [PubMed]
  10. Yadav, D.S.; Agrawal, S.B.; Agrawal, M. Field Crops Research Ozone flux-effect relationship for early and late sown Indian wheat cultivars: Growth, biomass, and yield. Field Crop. Res. 2021, 263, 108076. [Google Scholar] [CrossRef]
  11. Mills, G.; Sharps, K.; Simpson, D.; Pleijel, H.; Broberg, M.; Uddling, J.; Jaramillo, F.; Davies, W.J.; Dentener, F.; Van den Berg, M.; et al. Ozone pollution will compromise efforts to increase global wheat production. Glob. Chang. Biol. 2018, 24, 3560–3574. [Google Scholar] [CrossRef]
  12. Hazrati, S.; Tahmasebi-Sarvestani, Z.; Modarres-Sanavy, S.A.M.; Mokhtassi-Bidgoli, A.; Nicola, S. Effects of water stress and light intensity on chlorophyll fluorescence parameters and pigments of Aloe vera L. Plant Physiol. Biochem. 2016, 106, 141–148. [Google Scholar] [CrossRef] [PubMed]
  13. Saibo, N.J.M.; Lourenço, T.; Oliveira, M.M. Transcription factors and regulation of photosynthetic and related metabolism under environmental stresses. Ann. Bot. 2009, 103, 609–623. [Google Scholar] [CrossRef] [Green Version]
  14. Oksanen, E.; Holopainen, T. Responses of two birch (Betula pendula Roth) clones to different ozone profiles with similar AOT40 exposure. Atmos. Environ. 2001, 35, 5245–5254. [Google Scholar] [CrossRef]
  15. Feng, Z.Z.; Yao, F.F.; Chen, Z.; Wang, X.K.; Zheng, Q.W.; Feng, Z.W. Response of gas exchange and yield components of field-grown Triticum aestivum L. to elevated ozone in China. Photosynthetica 2007, 45, 441–446. [Google Scholar] [CrossRef]
  16. Meyer, U.; Köllner, B.; Willenbrink, J.; Krause, G.H.M. Effects of different ozone exposure regimes on photosynthesis, assimilates and thousand grain weight in spring wheat. Agric. Ecosyst. Environ. 2000, 78, 49–55. [Google Scholar] [CrossRef]
  17. Meyer, U.; Köllner, B.; Willenbrink, J.; Krause, G.H.M. Physiological changes on agricultural crops induced by different ambient ozone exposure regimes. I. Effects on photosynthesis and assimilate allocation in spring wheat. New Phytol. 1997, 136, 645–652. [Google Scholar] [CrossRef] [PubMed]
  18. Rai, R.; Agrawal, M.; Agrawal, S.B. Effects of ambient O3 on wheat during reproductive development: Gas exchange, photosynthetic pigments, chlorophyll fluorescence, and carbohydrates. Photosynthetica 2011, 49, 285–294. [Google Scholar] [CrossRef]
  19. Burkey, K.O.; Neufeld, H.S.; Souza, L.; Chappelka, A.H.; Davison, A.W. Seasonal profiles of leaf ascorbic acid content and redox state in ozone-sensitive wildflowers. Environ. Pollut. 2006, 143, 427–434. [Google Scholar] [CrossRef]
  20. Wang, L.; Pang, J.; Feng, Z.; Zhu, J.; Kobayashi, K. Diurnal variation of apoplastic ascorbate in winter wheat leaves in relation to ozone detoxification. Environ. Pollut. 2015, 207, 413–419. [Google Scholar] [CrossRef]
  21. Bellini, E.; De Tullio, M.C. Ascorbic acid and ozone: Novel perspectives to explain an elusive relationship. Plants 2019, 8, 122. [Google Scholar] [CrossRef] [PubMed] [Green Version]
  22. Burkey, K.O.; Wei, C.; Eason, G.; Ghosh, P.; Fenner, G.P. Antioxidant metabolite levels in ozone-sensitive and tolerant genotypes of snap bean. Physiol. Plant. 2000, 110, 195–200. [Google Scholar] [CrossRef] [Green Version]
  23. Geiger, D.R.; Servaites, J.C. Diurnal regulation of photosynthetic carbon metabolism in C3 plants. Annu. Rev. Plant Physiol. Plant Mol. Biol. 1994, 45, 235–256. [Google Scholar] [CrossRef]
  24. Xu, H.; Chen, S.B.; Biswas, D.K.; Li, Y.G.; Jiang, G.M. Photosynthetic and yield responses of an old and a modern winter wheat cultivars to short-term ozone exposure. Photosynthetica 2009, 47, 247–254. [Google Scholar] [CrossRef]
  25. Singh, A.A.; Fatima, A.; Mishra, A.K.; Chaudhary, N.; Mukherjee, A.; Agrawal, M.; Agrawal, S.B. Assessment of ozone toxicity among 14 Indian wheat cultivars under field conditions: Growth and productivity. Environ. Monit. Assess. 2018, 190. [Google Scholar] [CrossRef] [PubMed]
  26. Yadav, D.S.; Rai, R.; Mishra, A.K.; Chaudhary, N.; Mukherjee, A.; Agrawal, S.B.; Agrawal, M. ROS production and its detoxification in early and late sown cultivars of wheat under future O 3 concentration. Sci. Total Environ. 2019, 659, 200–210. [Google Scholar] [CrossRef] [PubMed]
  27. Keller, T.; Schwager, H. Air pollution and ascorbic acid. Eur. J. For. Pathol. 1977, 7, 338–350. [Google Scholar] [CrossRef]
  28. Dubois, M.; Gilles, K.; Hamilton, J.; Roberts, P.; Smith, F. Colorimetric method for determination of sugars and related substances. Anal. Biochem. 1956, 28, 350–356. [Google Scholar] [CrossRef]
  29. Yadav, D.S.; Mishra, A.K.; Rai, R.; Chaudhary, N.; Mukherjee, A.; Agrawal, S.B.; Agrawal, M. Responses of an old and a modern Indian wheat cultivar to future O3 level: Physiological, yield and grain quality parameters. Environ. Pollut. 2020, 259, 113939. [Google Scholar] [CrossRef]
  30. Vongcharoen, K.; Santanoo, S.; Banterng, P.; Jogloy, S.; Vorasoot, N.; Theerakulpisut, P. Diurnal and seasonal variations in the photosynthetic performance and chlorophyll fluorescence of cassava ‘rayong 9’ under irrigated and rainfed conditions. Photosynthetica 2019, 57, 268–285. [Google Scholar] [CrossRef] [Green Version]
  31. Betzelberger, A.M.; Yendrek, C.R.; Sun, J.; Leisner, C.P.; Nelson, R.L.; Ort, D.R.; Ainsworth, E.A. Ozone exposure response for U.S. soybean cultivars: Linear reductions in photosynthetic potential, biomass, and yield. Plant Physiol. 2012, 160, 1827–1839. [Google Scholar] [CrossRef] [PubMed] [Green Version]
  32. Mohotti, A.J.; Lawlor, D.W. Diurnal variation of photosynthesis and photoinhibition in tea: Effects of irradiance and nitrogen supply during growth in the field. J. Exp. Bot. 2002, 53, 313–322. [Google Scholar] [CrossRef] [PubMed]
  33. Huang, L.F.; Zheng, J.H.; Zhang, Y.Y.; Hu, W.H.; Mao, W.H.; Zhou, Y.H.; Yu, J.Q. Diurnal variations in gas exchange, chlorophyll fluorescence quenching and light allocation in soybean leaves: The cause for midday depression in CO2 assimilation. Sci. Hortic. 2006, 110, 214–218. [Google Scholar] [CrossRef]
  34. Santanoo, S.; Vongcharoen, K.; Banterng, P.; Vorasoot, N.; Jogloy, S.; Roytrakul, S.; Theerakulpisut, P. Seasonal Variation in Diurnal Photosynthesis and Chlorophyll Fluorescence of Four Genotypes of Cassava (Manihot esculenta Crantz) under Irrigation Conditions in a Tropical Savanna Climate. Agronomy 2019, 9, 206. [Google Scholar] [CrossRef] [Green Version]
  35. Calatayud, A.; Alvarado, J.W.; Barreno, E. Changes in chlorophyll a fluorescence, lipid peroxidation, and detoxificant system in potato plants grown under filtered and non-filtered air in open-top chambers. Photosynthetica 2001, 39, 507–513. [Google Scholar] [CrossRef]
  36. Guidi, L.; Degl’Innocenti, E. Ozone effects on high light-induced photoinhibition in Phaseolus vulgaris. Plant Sci. 2008, 174, 590–596. [Google Scholar] [CrossRef]
  37. Heath, R.L.; Lefohn, A.S.; Musselman, R.C. Temporal processes that contribute to nonlinearity in vegetation responses to ozone exposure and dose. Atmos. Environ. 2009, 43, 2919–2928. [Google Scholar] [CrossRef]
  38. Musselman, R.C.; Lefohn, A.S.; Massman, W.J.; Heath, R.L. A critical review and analysis of the use of exposure- and flux-based ozone indices for predicting vegetation effects. Atmos. Environ. 2006, 40, 1869–1888. [Google Scholar] [CrossRef]
  39. Fatima, A.; Singh, A.A.; Mukherjee, A.; Agrawal, M.; Agrawal, S.B. Ascorbic acid and thiols as potential biomarkers of ozone tolerance in tropical wheat cultivars. Ecotoxicol. Environ. Saf. 2019, 171, 701–708. [Google Scholar] [CrossRef]
  40. Wang, J.; Zeng, Q.; Zhu, J.; Chen, C.; Liu, G.; Tang, H. Apoplastic antioxidant enzyme responses to chronic free-air ozone exposure in two different ozone-sensitive wheat cultivars. Plant Physiol. Biochem. 2014, 82, 183–193. [Google Scholar] [CrossRef]
  41. Dolker, T.; Agrawal, M. Negative impacts of elevated ozone on dominant species of semi-natural grassland vegetation in Indo-Gangetic plain. Ecotoxicol. Environ. Saf. 2019, 182, 109404. [Google Scholar] [CrossRef]
  42. Severino, J.F.; Stich, K.; Soja, G. Ozone stress and antioxidant substances in Trifolium repens and Centaurea jacea leaves. Environ. Pollut. 2007, 146, 707–714. [Google Scholar] [CrossRef] [PubMed]
  43. Robinson, J.M.; Britz, S.J. Ascorbate-dehydroascorbate level and redox status in leaflets of field-grown soybeans exposed to elevated ozone. Int. J. Plant Sci. 2001, 162, 119–125. [Google Scholar] [CrossRef]
  44. Ansari, N.; Yadav, D.S.; Agrawal, M.; Agrawal, S.B. The impact of elevated ozone on growth, secondary metabolites, production of reactive oxygen species and antioxidant response in an anti-diabetic plant Costus pictus. Funct. Plant Biol. 2021, 48, 597–610. [Google Scholar] [CrossRef]
  45. Shinohara, Y.; Suzuki, Y. Effects of Light and Nutritional Conditions on the Ascorbic Acid Content of Lettuce. J. Jpn. Soc. Hortic. Sci. 1981, 50, 239–246. [Google Scholar] [CrossRef]
  46. Sideris, C.P.; Young, H.Y.; Chun, H.H.Q. Diurnal changes and growth rates as associated with ascorbic acid, titratable acidity, carbohydrate and nitrogeous fractions in the leaves of Ananas comosus (L.) Merr. Plant Physiol. 1948, 23, 38–69. [Google Scholar] [CrossRef] [Green Version]
  47. Ishikawa, T.; Maruta, T.; Yoshimura, K.; Smirnoff, N. Biosynthesis and regulation of ascorbic acid in plants. In Antioxidants and Antioxidant Enzymes in Higher Plants; Springer: Cham, Switzerland, 2018; pp. 163–179. ISBN 9783319750880. [Google Scholar]
  48. Seminario, A.; Song, L.; Zulet, A.; Nguyen, H.T.; González, E.M.; Larrainzar, E. Drought stress causes a reduction in the biosynthesis of ascorbic acid in soybean plants. Front. Plant Sci. 2017, 8, 1042. [Google Scholar] [CrossRef] [Green Version]
  49. Dowdle, J.; Ishikawa, T.; Gatzek, S.; Rolinski, S.; Smirnoff, N. Two genes in Arabidopsis thaliana encoding GDP-L-galactose phosphorylase are required for ascorbate biosynthesis and seedling viability. Plant J. 2007, 52, 673–689. [Google Scholar] [CrossRef]
  50. Lavola, A.; Julkunen-Tiitto, R.; Paakkonen, E. Does ozone stress change the primary or secondary metabolites of birch (Betula pendula Roth.)? New Phytol. 1994, 126, 637–642. [Google Scholar] [CrossRef]
  51. Castagna, A.; Ranieri, A. Detoxification and repair process of ozone injury: From O3 uptake to gene expression adjustment. Environ. Pollut. 2009, 157, 1461–1469. [Google Scholar] [CrossRef] [PubMed]
  52. Friend, A.L.; Tomlinson, P.T. Mild ozone exposure alters 14C dynamics in foliage of Pinus taeda L. Tree Physiol. 1992, 11, 215–227. [Google Scholar] [CrossRef] [PubMed]
  53. Chen, Z.; Gallie, D.R. Increasing tolerance to ozone by elevating foliar ascorbic acid confers greater protection against ozone than increasing avoidance. Plant Physiol. 2005, 138, 1673–1689. [Google Scholar] [CrossRef] [PubMed] [Green Version]
  54. Ranieri, A.; D’Urso, G.; Nali, C.; Lorenzini, G.; Soldatini, G.F. Ozone stimulates apoplastic antioxidant systems in pumpkin leaves. Physiol. Plant. 1996, 97, 381–387. [Google Scholar] [CrossRef]
  55. Foyer, C.H.; Noctor, G. Ascorbate and glutathione: The heart of the redox hub. Plant Physiol. 2011, 155, 2–18. [Google Scholar] [CrossRef] [PubMed] [Green Version]
  56. Jiang, L.; Feng, Z.; Dai, L.; Shang, B.; Paoletti, E. Large variability in ambient ozone sensitivity across 19 ethylenediurea-treated Chinese cultivars of soybean is driven by total ascorbate. J. Environ. Sci. 2018, 64, 10–22. [Google Scholar] [CrossRef] [PubMed]
  57. Höller, S.; Ueda, Y.; Wu, L.; Wang, Y.; Hajirezaei, M.R.; Ghaffari, M.R.; von Wirén, N.; Frei, M. Ascorbate biosynthesis and its involvement in stress tolerance and plant development in rice (Oryza sativa L.). Plant Mol. Biol. 2015, 88, 545–560. [Google Scholar] [CrossRef] [PubMed]
Figure 1. The profile of ambient O3 concentration (a) and ambient PAR (b) at the experimental site from 29 January 2018 to 2 February 2018.
Atmosphere 12 01568 g001
Figure 2. Diurnal variations in photosynthetic rate (Ps), stomatal conductance (gs), and chlorophyll fluorescence (Fv/Fm) of flag leaves in early (HUW468 and HD3118) and late sown (HUW234 and HD3118) wheat cultivars under ambient and elevated O3 treatments. The letters on top of the line graph are based on the Tukey test among the 5 different time intervals of a day. Lines without the same letter are significantly different from each other at p < 0.05. Values are mean ± SE; N = 5 replicate leaves of 5 plants for each treatment. Solid lines represent plant response under ambient O3 condition and dotted lines indicate plant response under elevated O3 condition. Different color in a box represents different cultivar.
Atmosphere 12 01568 g002
Figure 3. Diurnal variations in chloroplastic electron transport rate (J), photochemical quenching (qP), and non-photochemical quenching (NPQ) of flag leaves in early (HUW468 and HD3118) and late sown (HUW234 and HD3118) wheat cultivars under ambient and elevated O3 treatments. The letters on top of the line graph are based on the Tukey test among the 5 different time intervals of a day. Lines without the same letter are significantly different from each other at p < 0.05. Values are mean ± SE; N = 5 replicate leaves of 5 plants for each treatment. Solid lines represent plant response under ambient O3 condition and dotted lines indicate plant response under elevated O3 condition. Different color in a box represents different cultivar.
Atmosphere 12 01568 g003
Figure 4. Diurnal variations in starch, total sugar, and sucrose contents of flag leaf in early (HUW468 and HD3118) and late sown (HUW234 and HD3118) wheat cultivars under ambient and elevated O3 treatments. The letters on top of the line graph are based on the Tukey test among the five different time intervals of a day. Lines without the same letter are significantly different from each other at p < 0.05. Values are mean ± SE; N = 5 replicate leaves of 5 plants for each treatment. Solid lines represent plant response under ambient O3 condition and dotted lines indicate plant response under elevated O3 condition. Different color in a box represents different cultivar.
Atmosphere 12 01568 g004
Figure 5. Diurnal changes in the ascorbic acid content of flag leaves in early (HUW468 and HD3118) and late sown (HUW234 and HD3118) wheat cultivars under ambient and elevated O3 treatments. The letters on top of the line graph are based on the Tukey test among the 5 different time intervals of a day. Lines without the same letter are significantly different from each other at p < 0.05. Values are mean ± SE; N = 5 replicate leaves of 5 plants for each treatment. Solid lines represent plant response under ambient O3 condition and dotted lines indicate plant response under elevated O3 condition. Different color in a box represents different cultivar.
Atmosphere 12 01568 g005
Figure 6. Principal Component Analysis (PCA) biplot for all the diurnally recorded parameters representing two principal components (PC1 and PC2) axis explaining 31.1 and 27.1% of the total variance in early sown cultivars (a) and 26.1 and 22.7% of the variance in late sown cultivars (b) under ambient and elevated O3 treatment.
Atmosphere 12 01568 g006
Publisher’s Note: MDPI stays neutral with regard to jurisdictional claims in published maps and institutional affiliations.

