
Spatial-Temporal Variation Characteristics and Influencing Factors of Vegetation in the Yellow River Basin from 2000 to 2019

Abstract
:1. Introduction
2. Materials and Methods
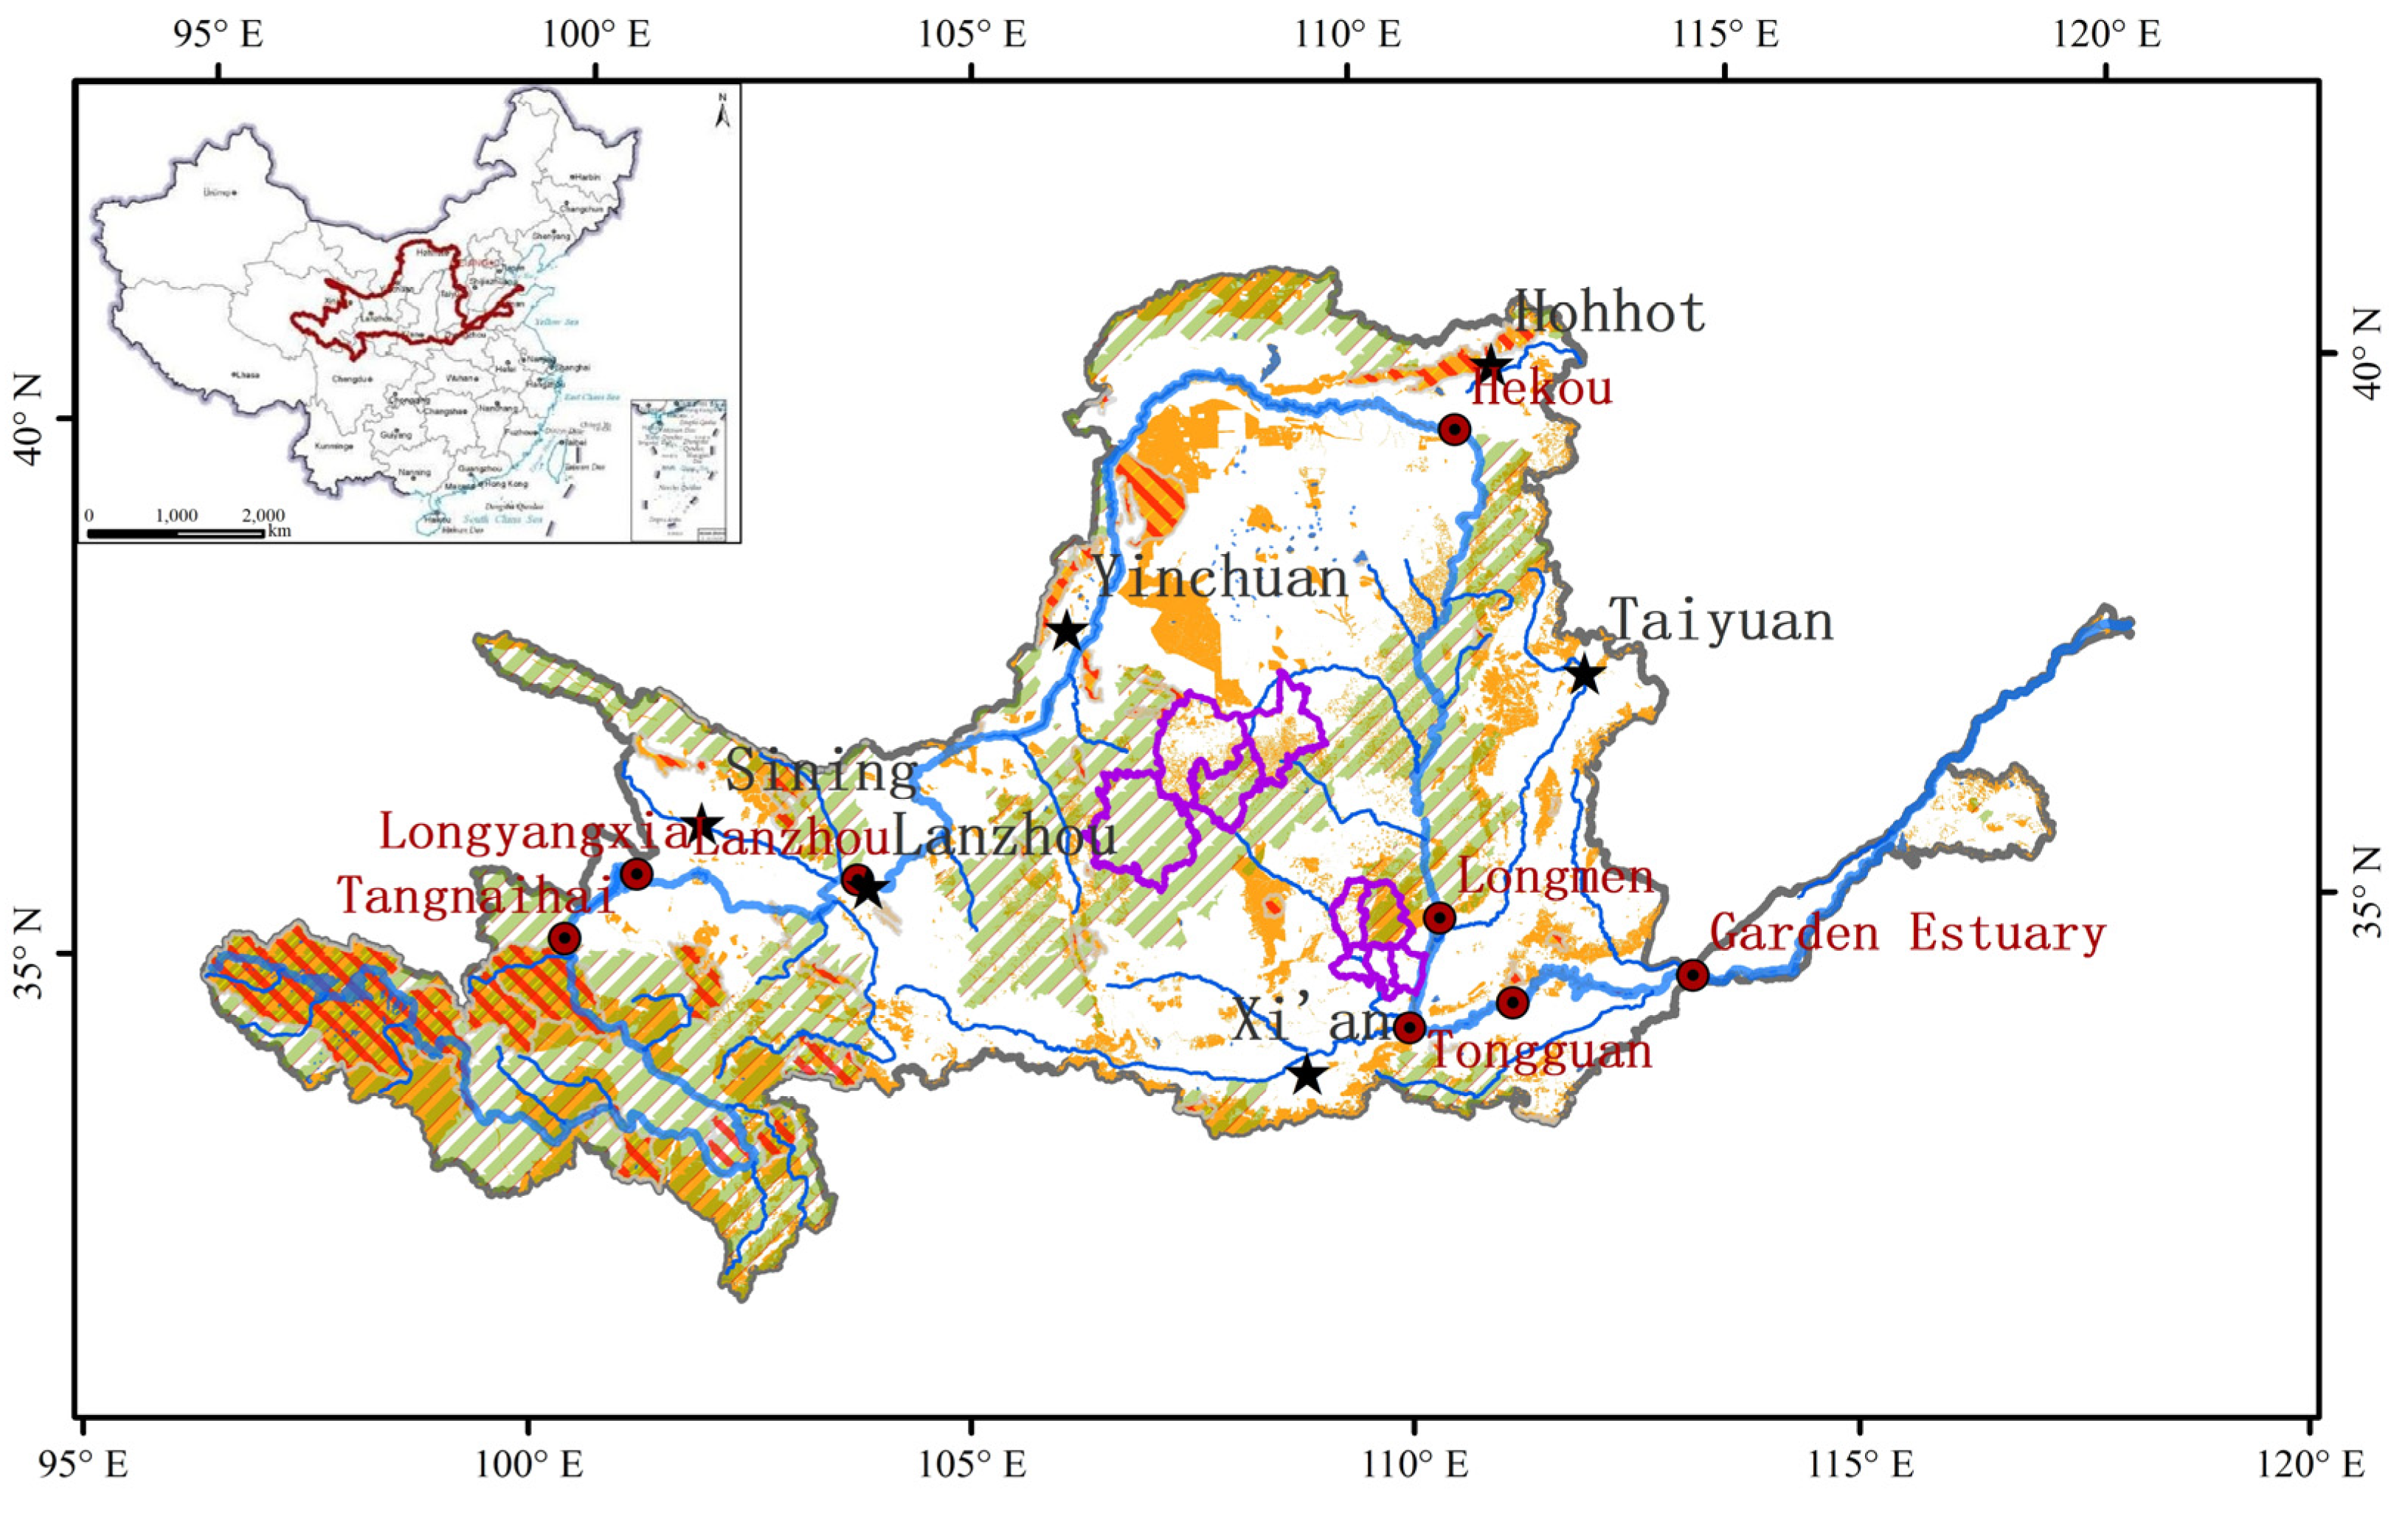
2.1. Research Area
2.2. Data Resource
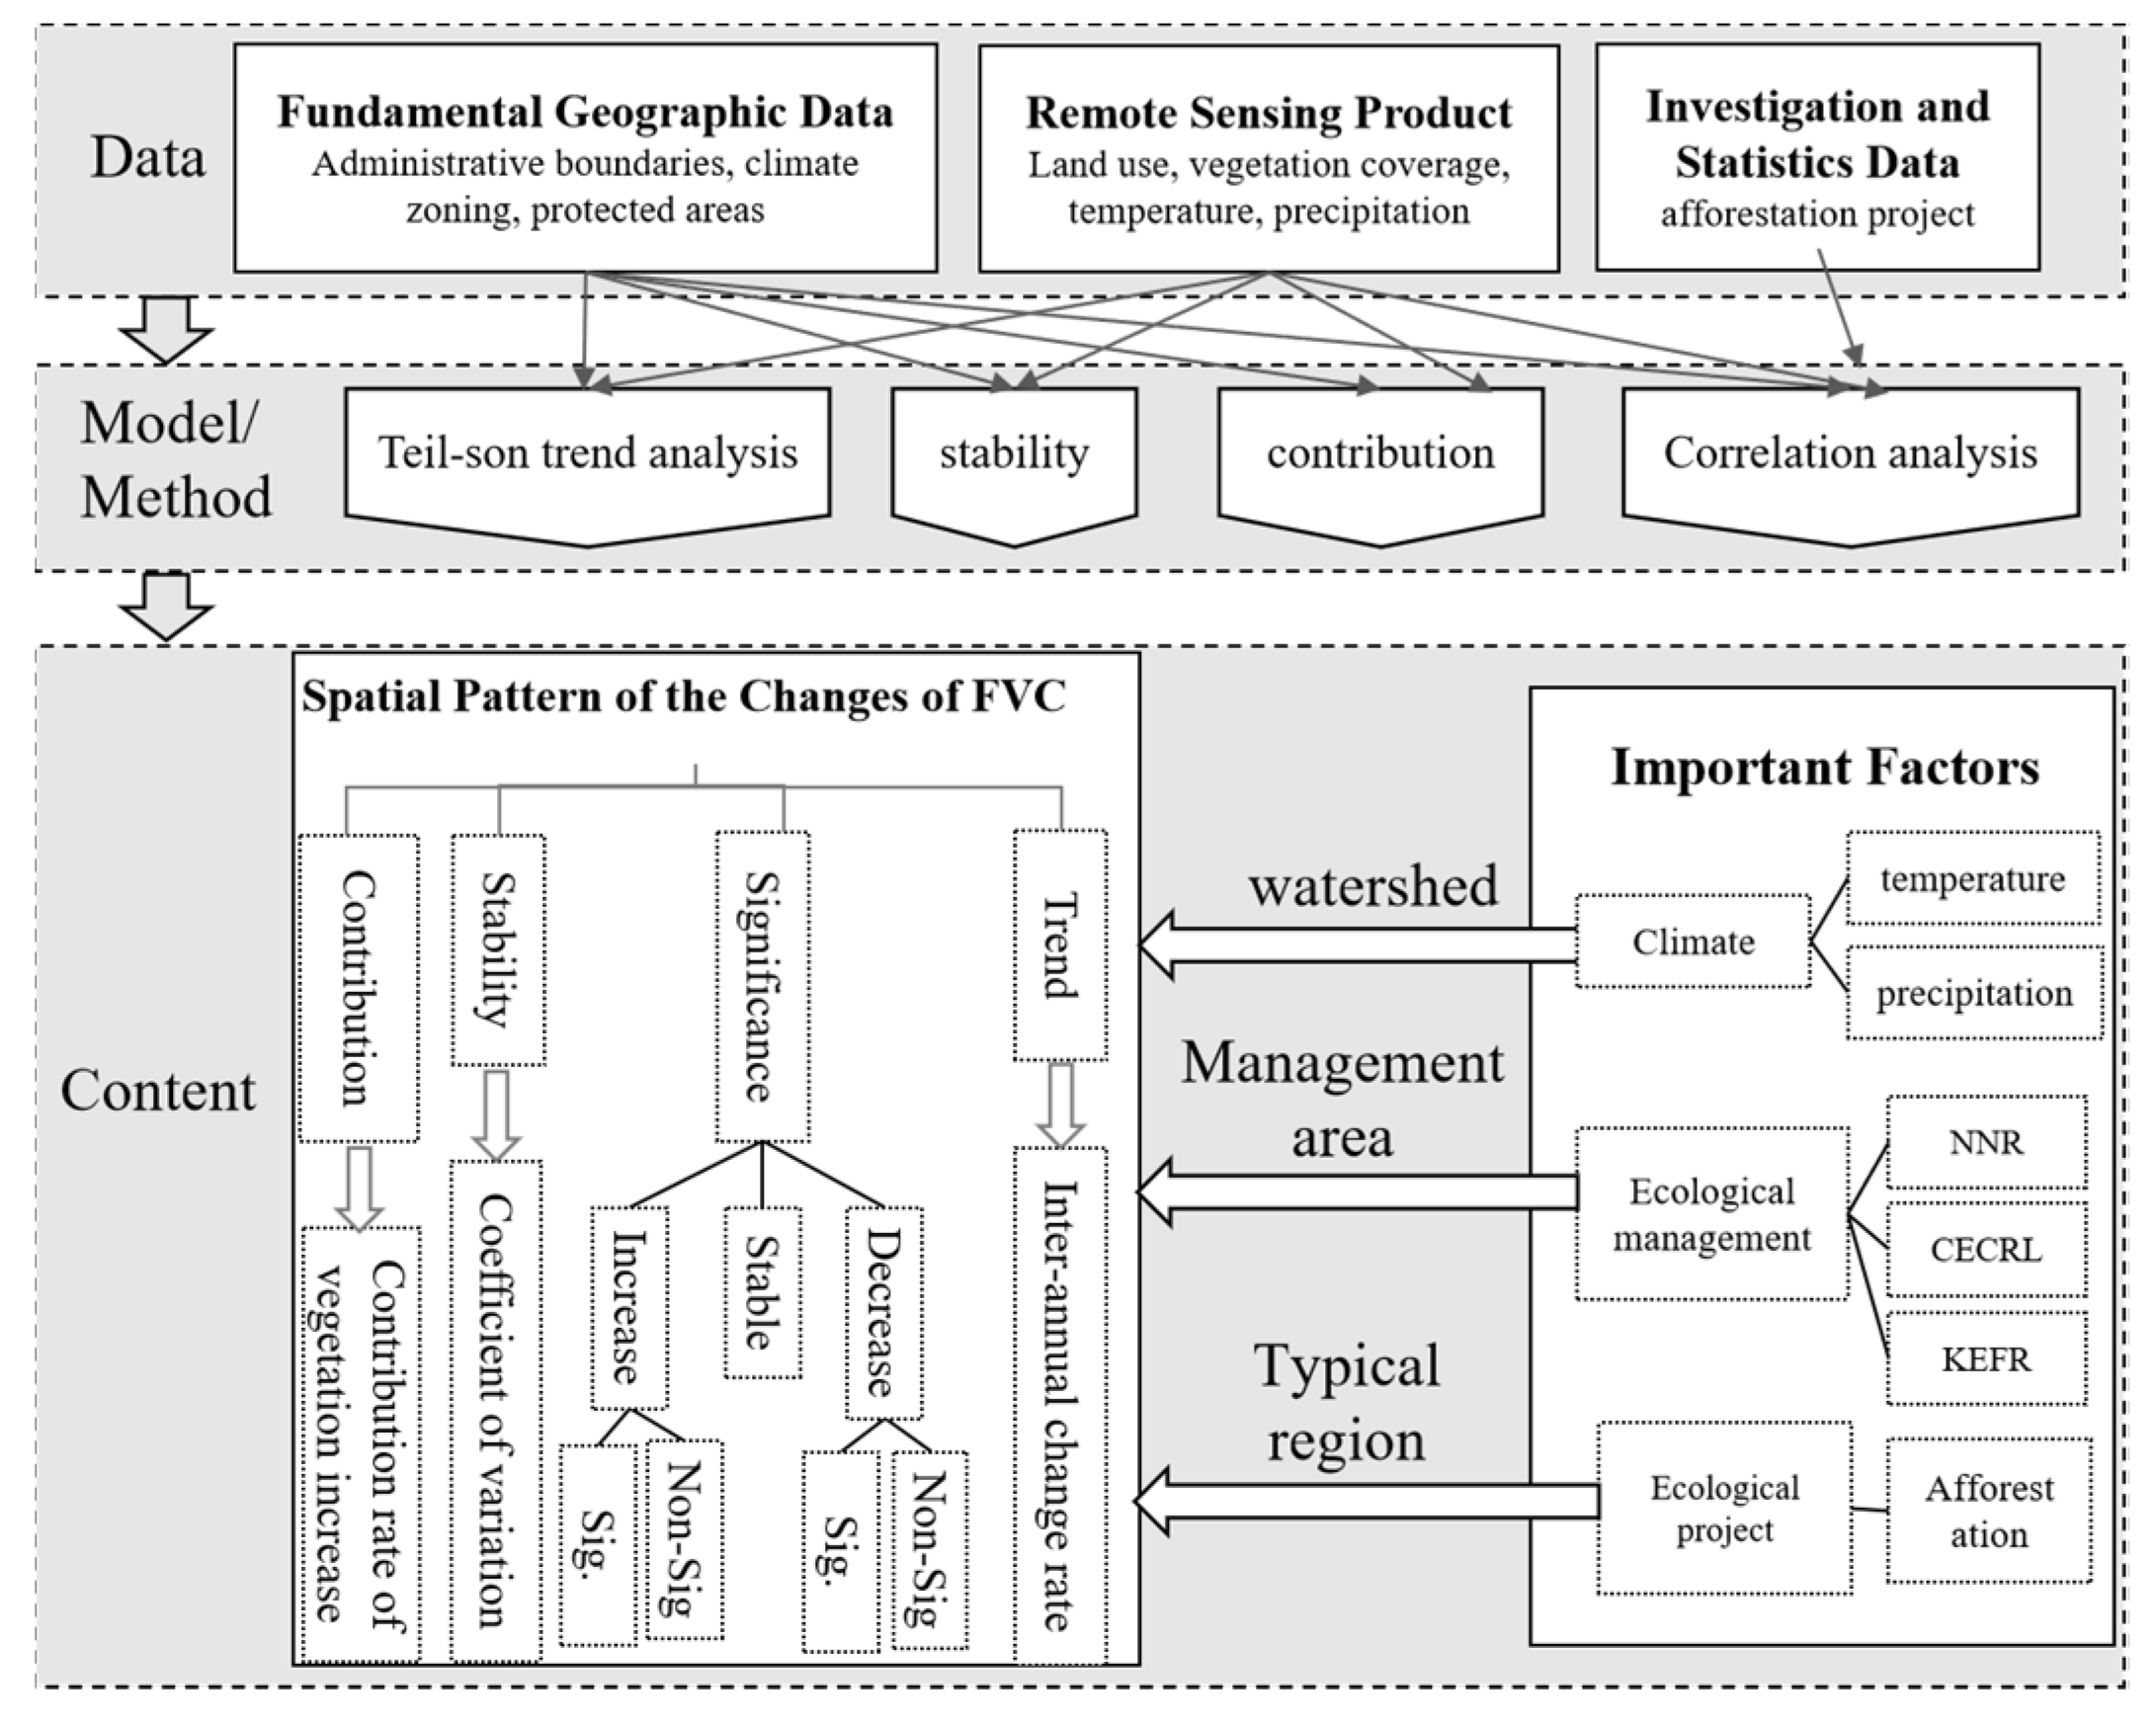
2.3. Method
3. Results
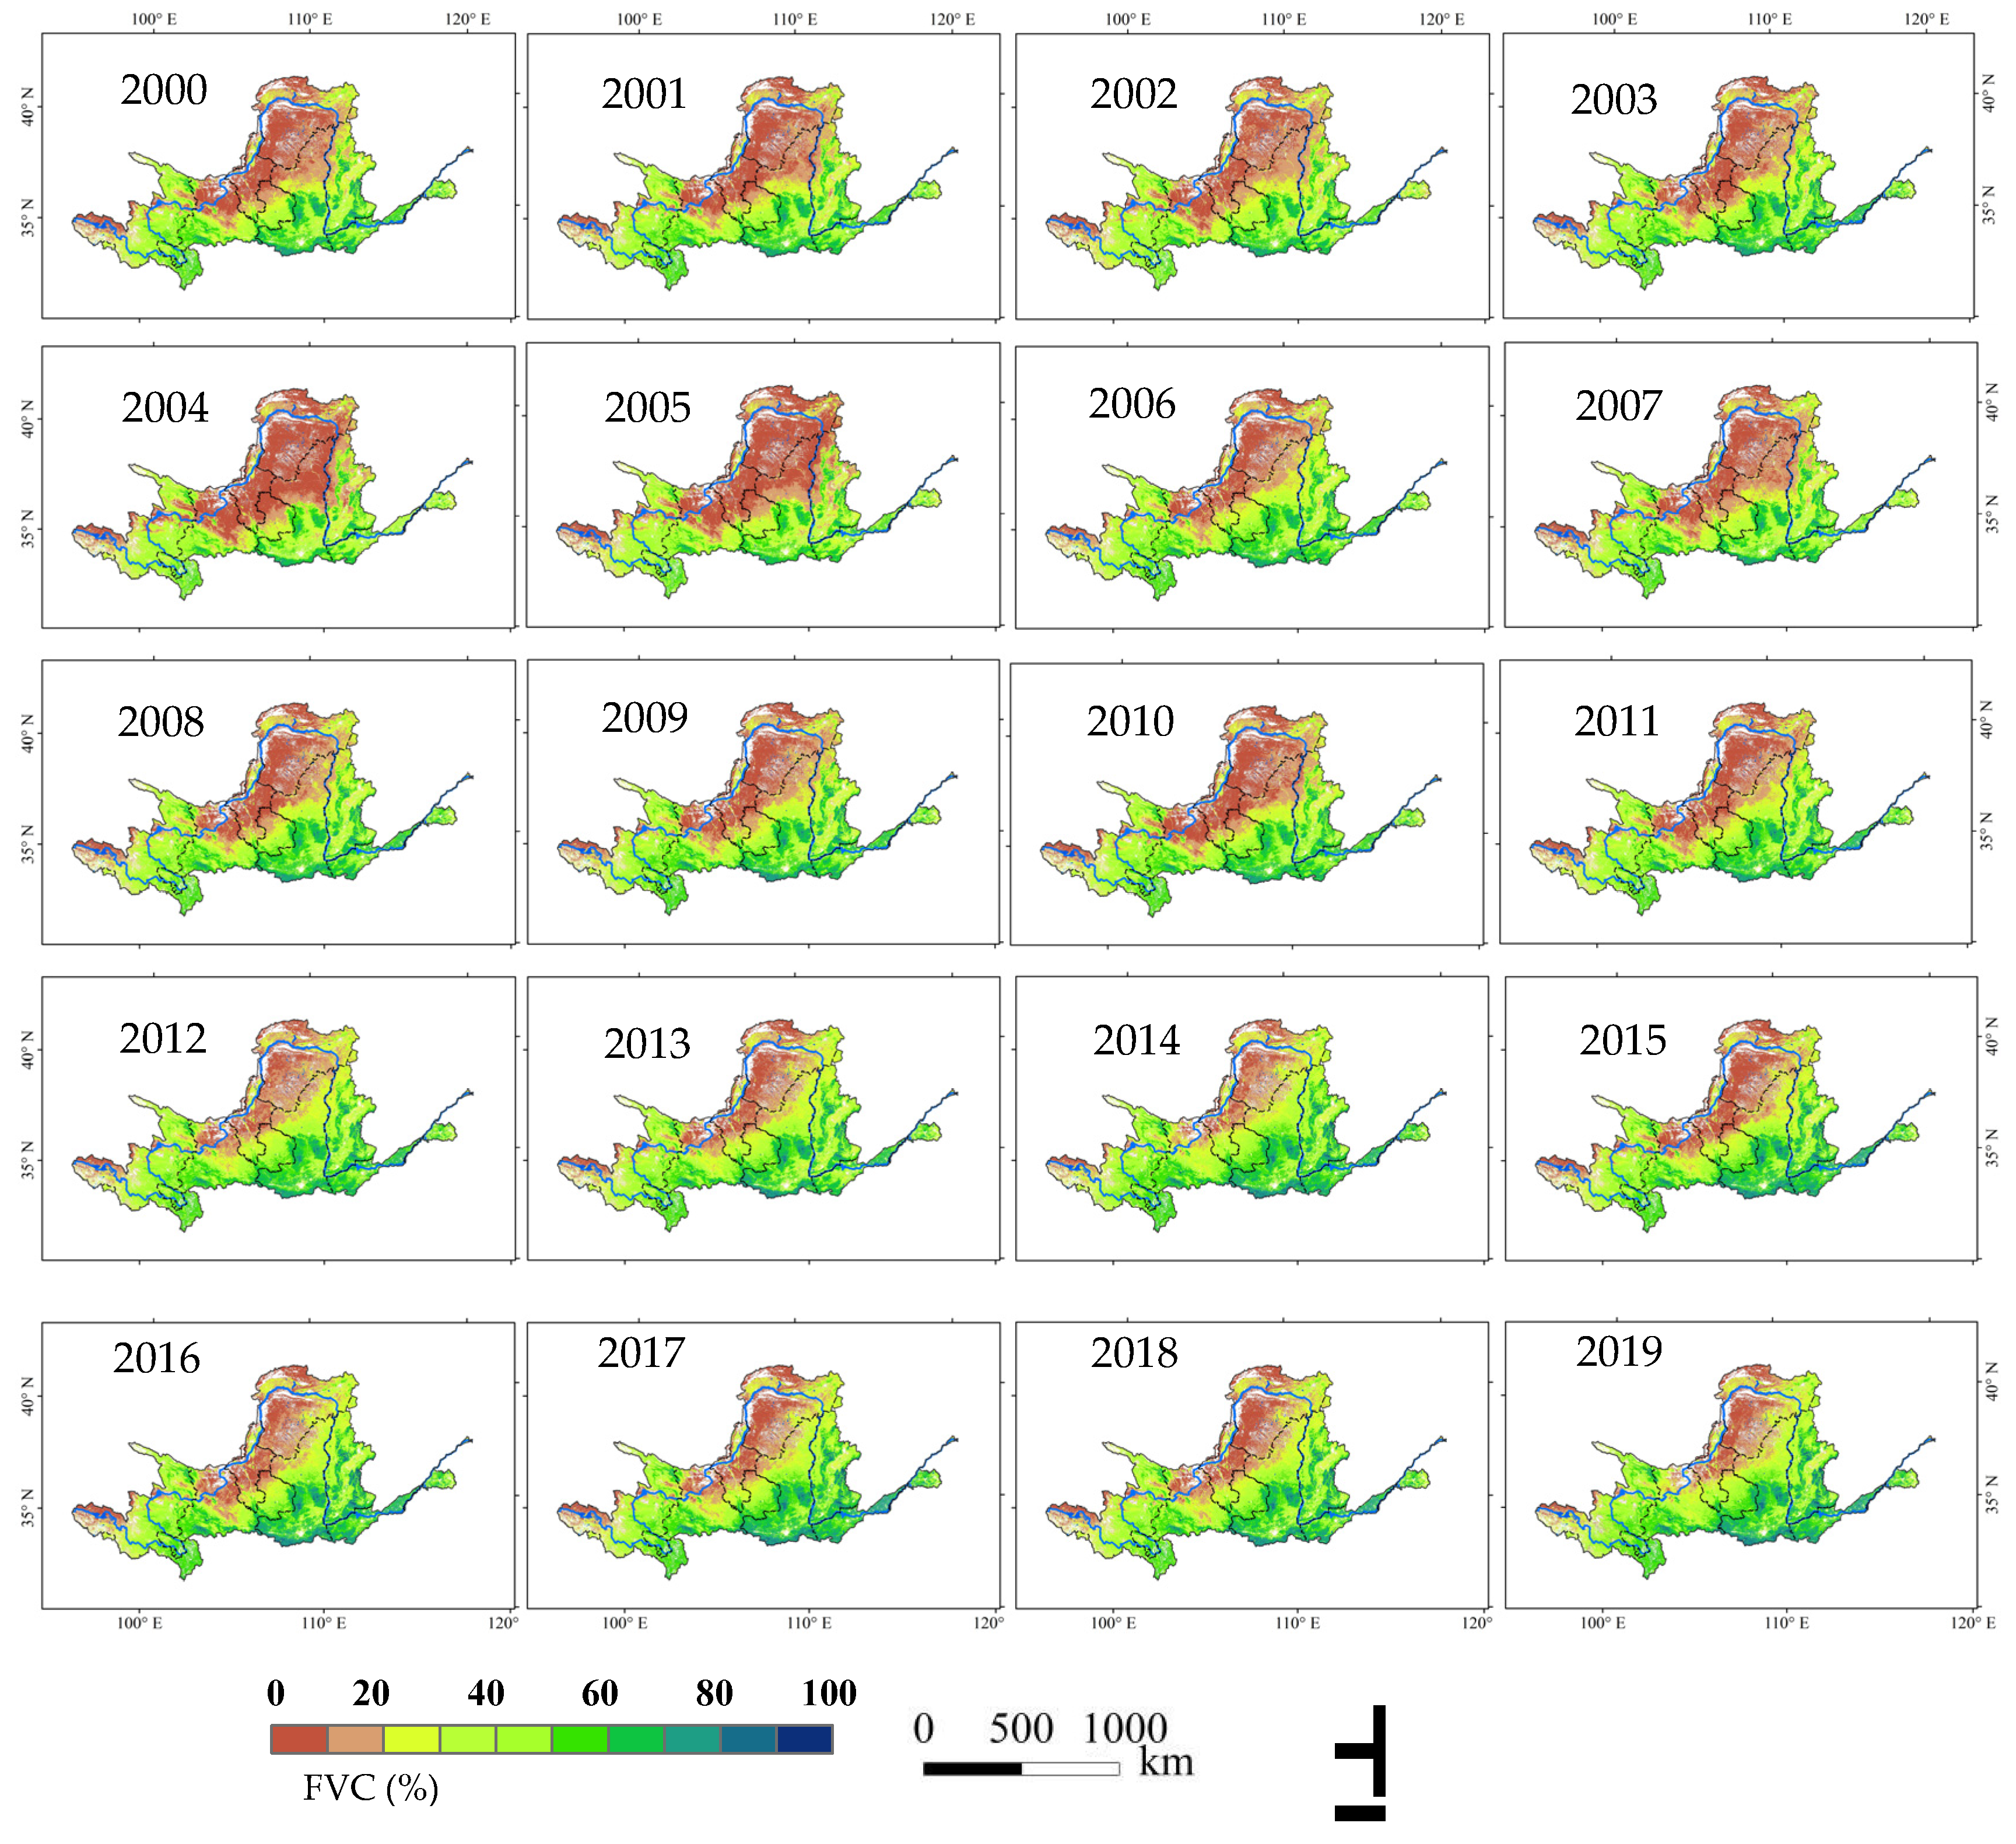
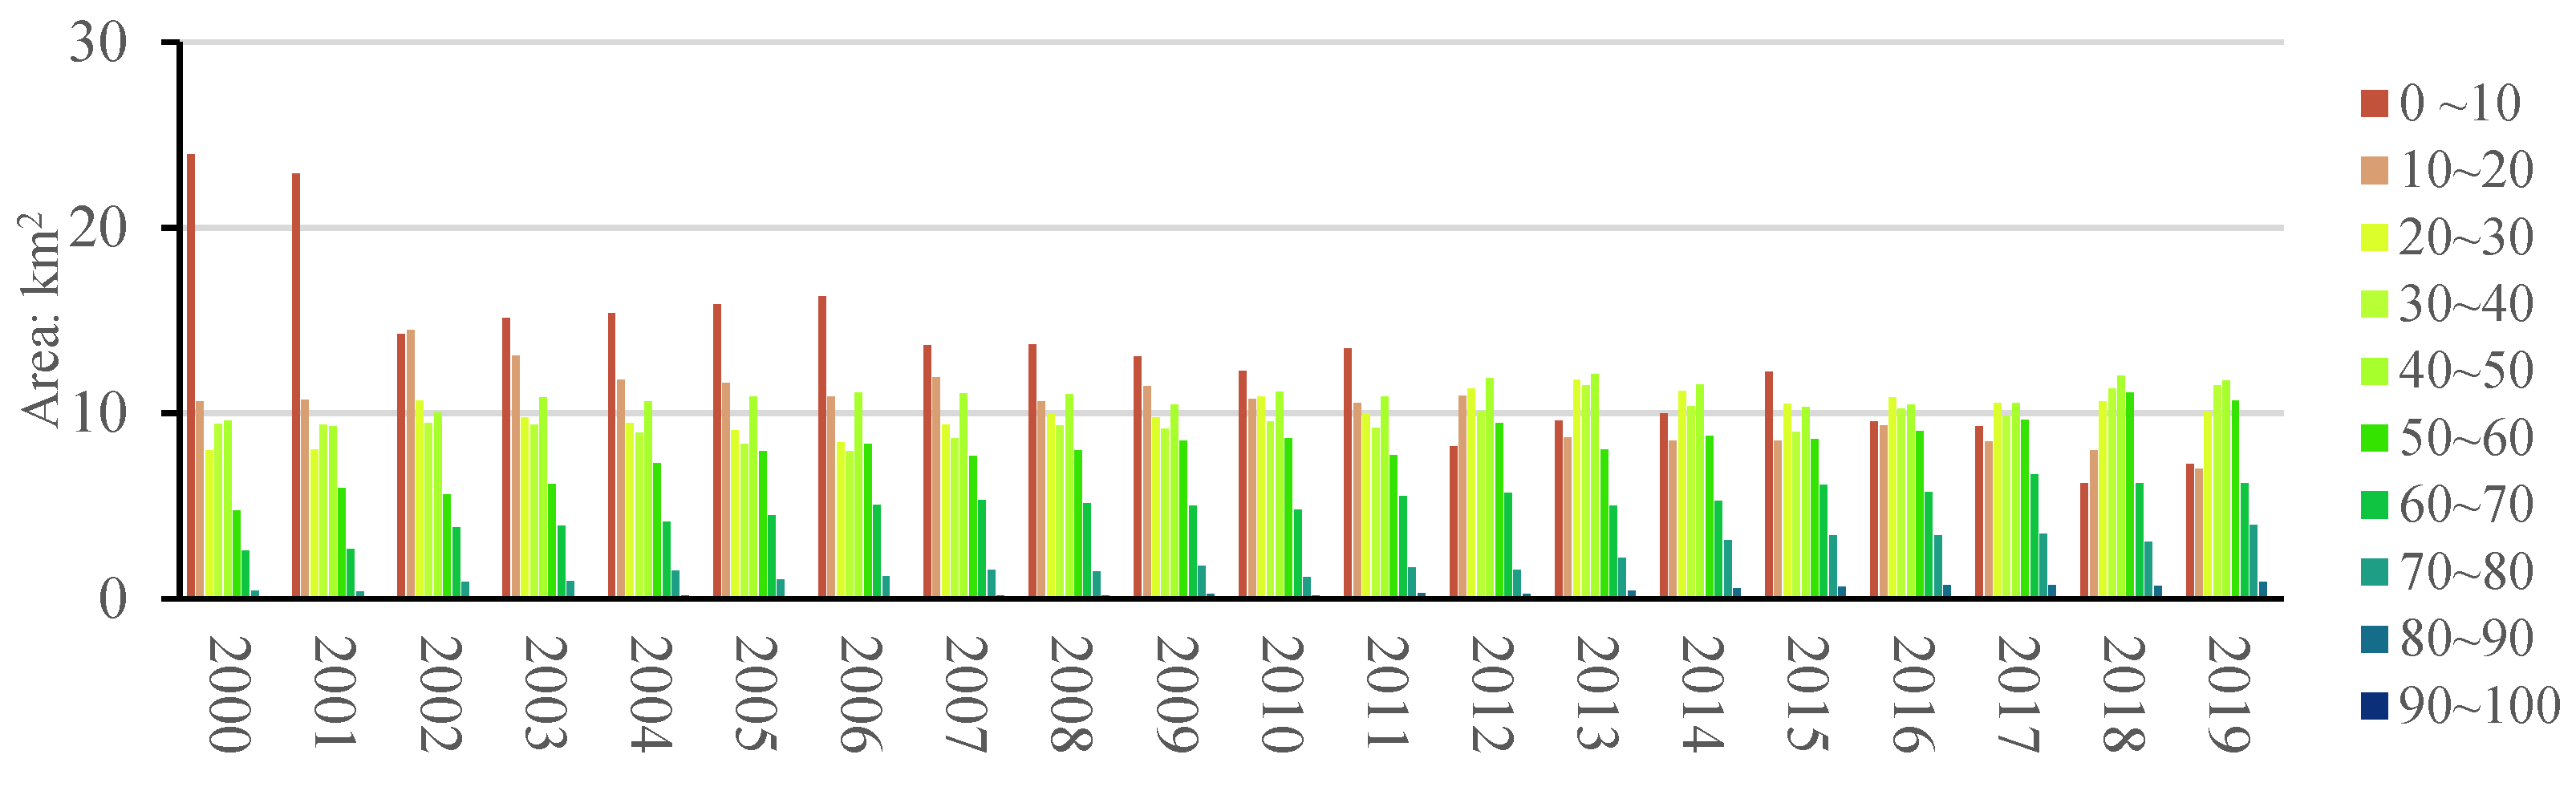
3.1. Spatiotemporal Distribution and Changes in FVC
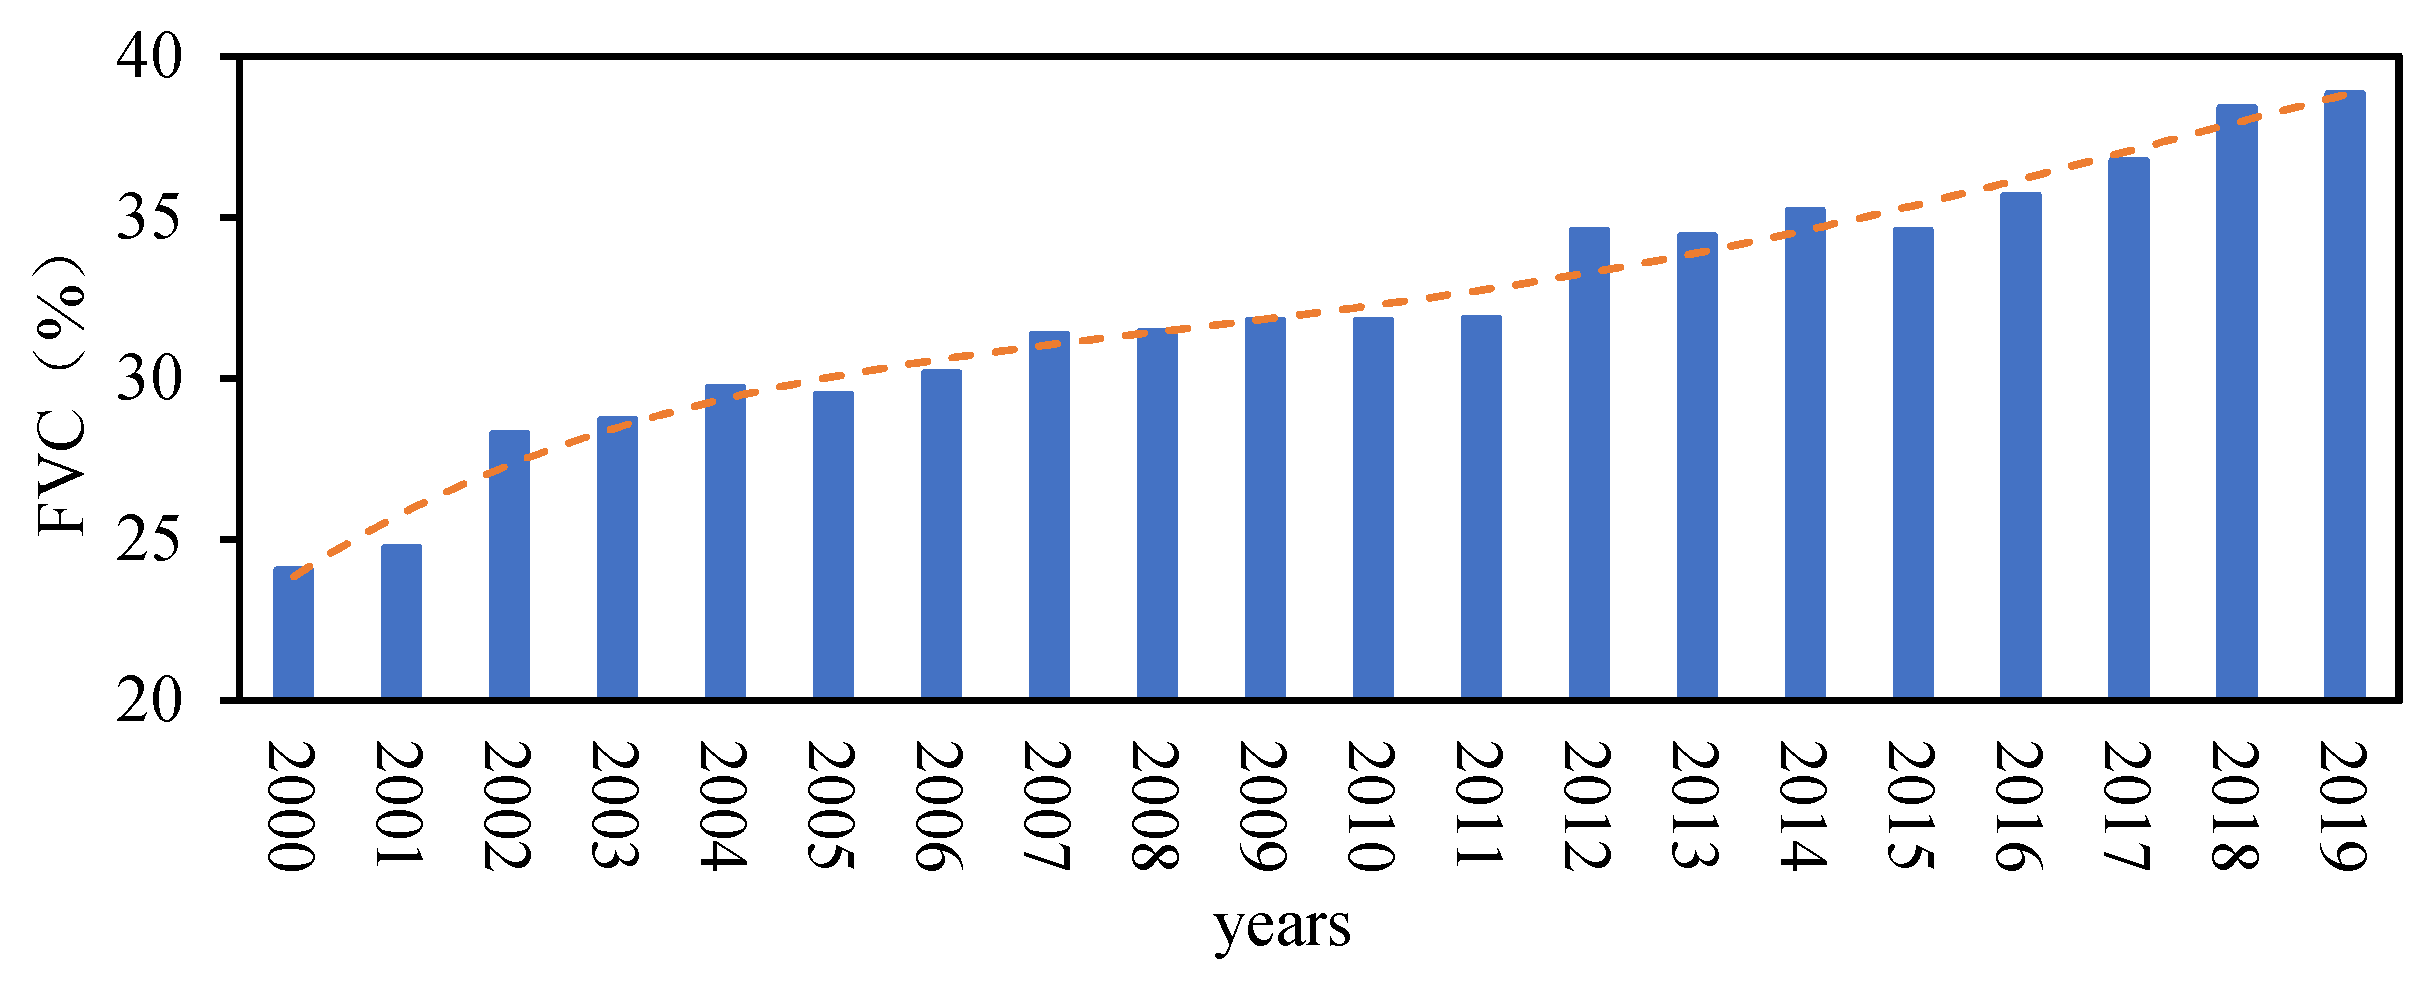
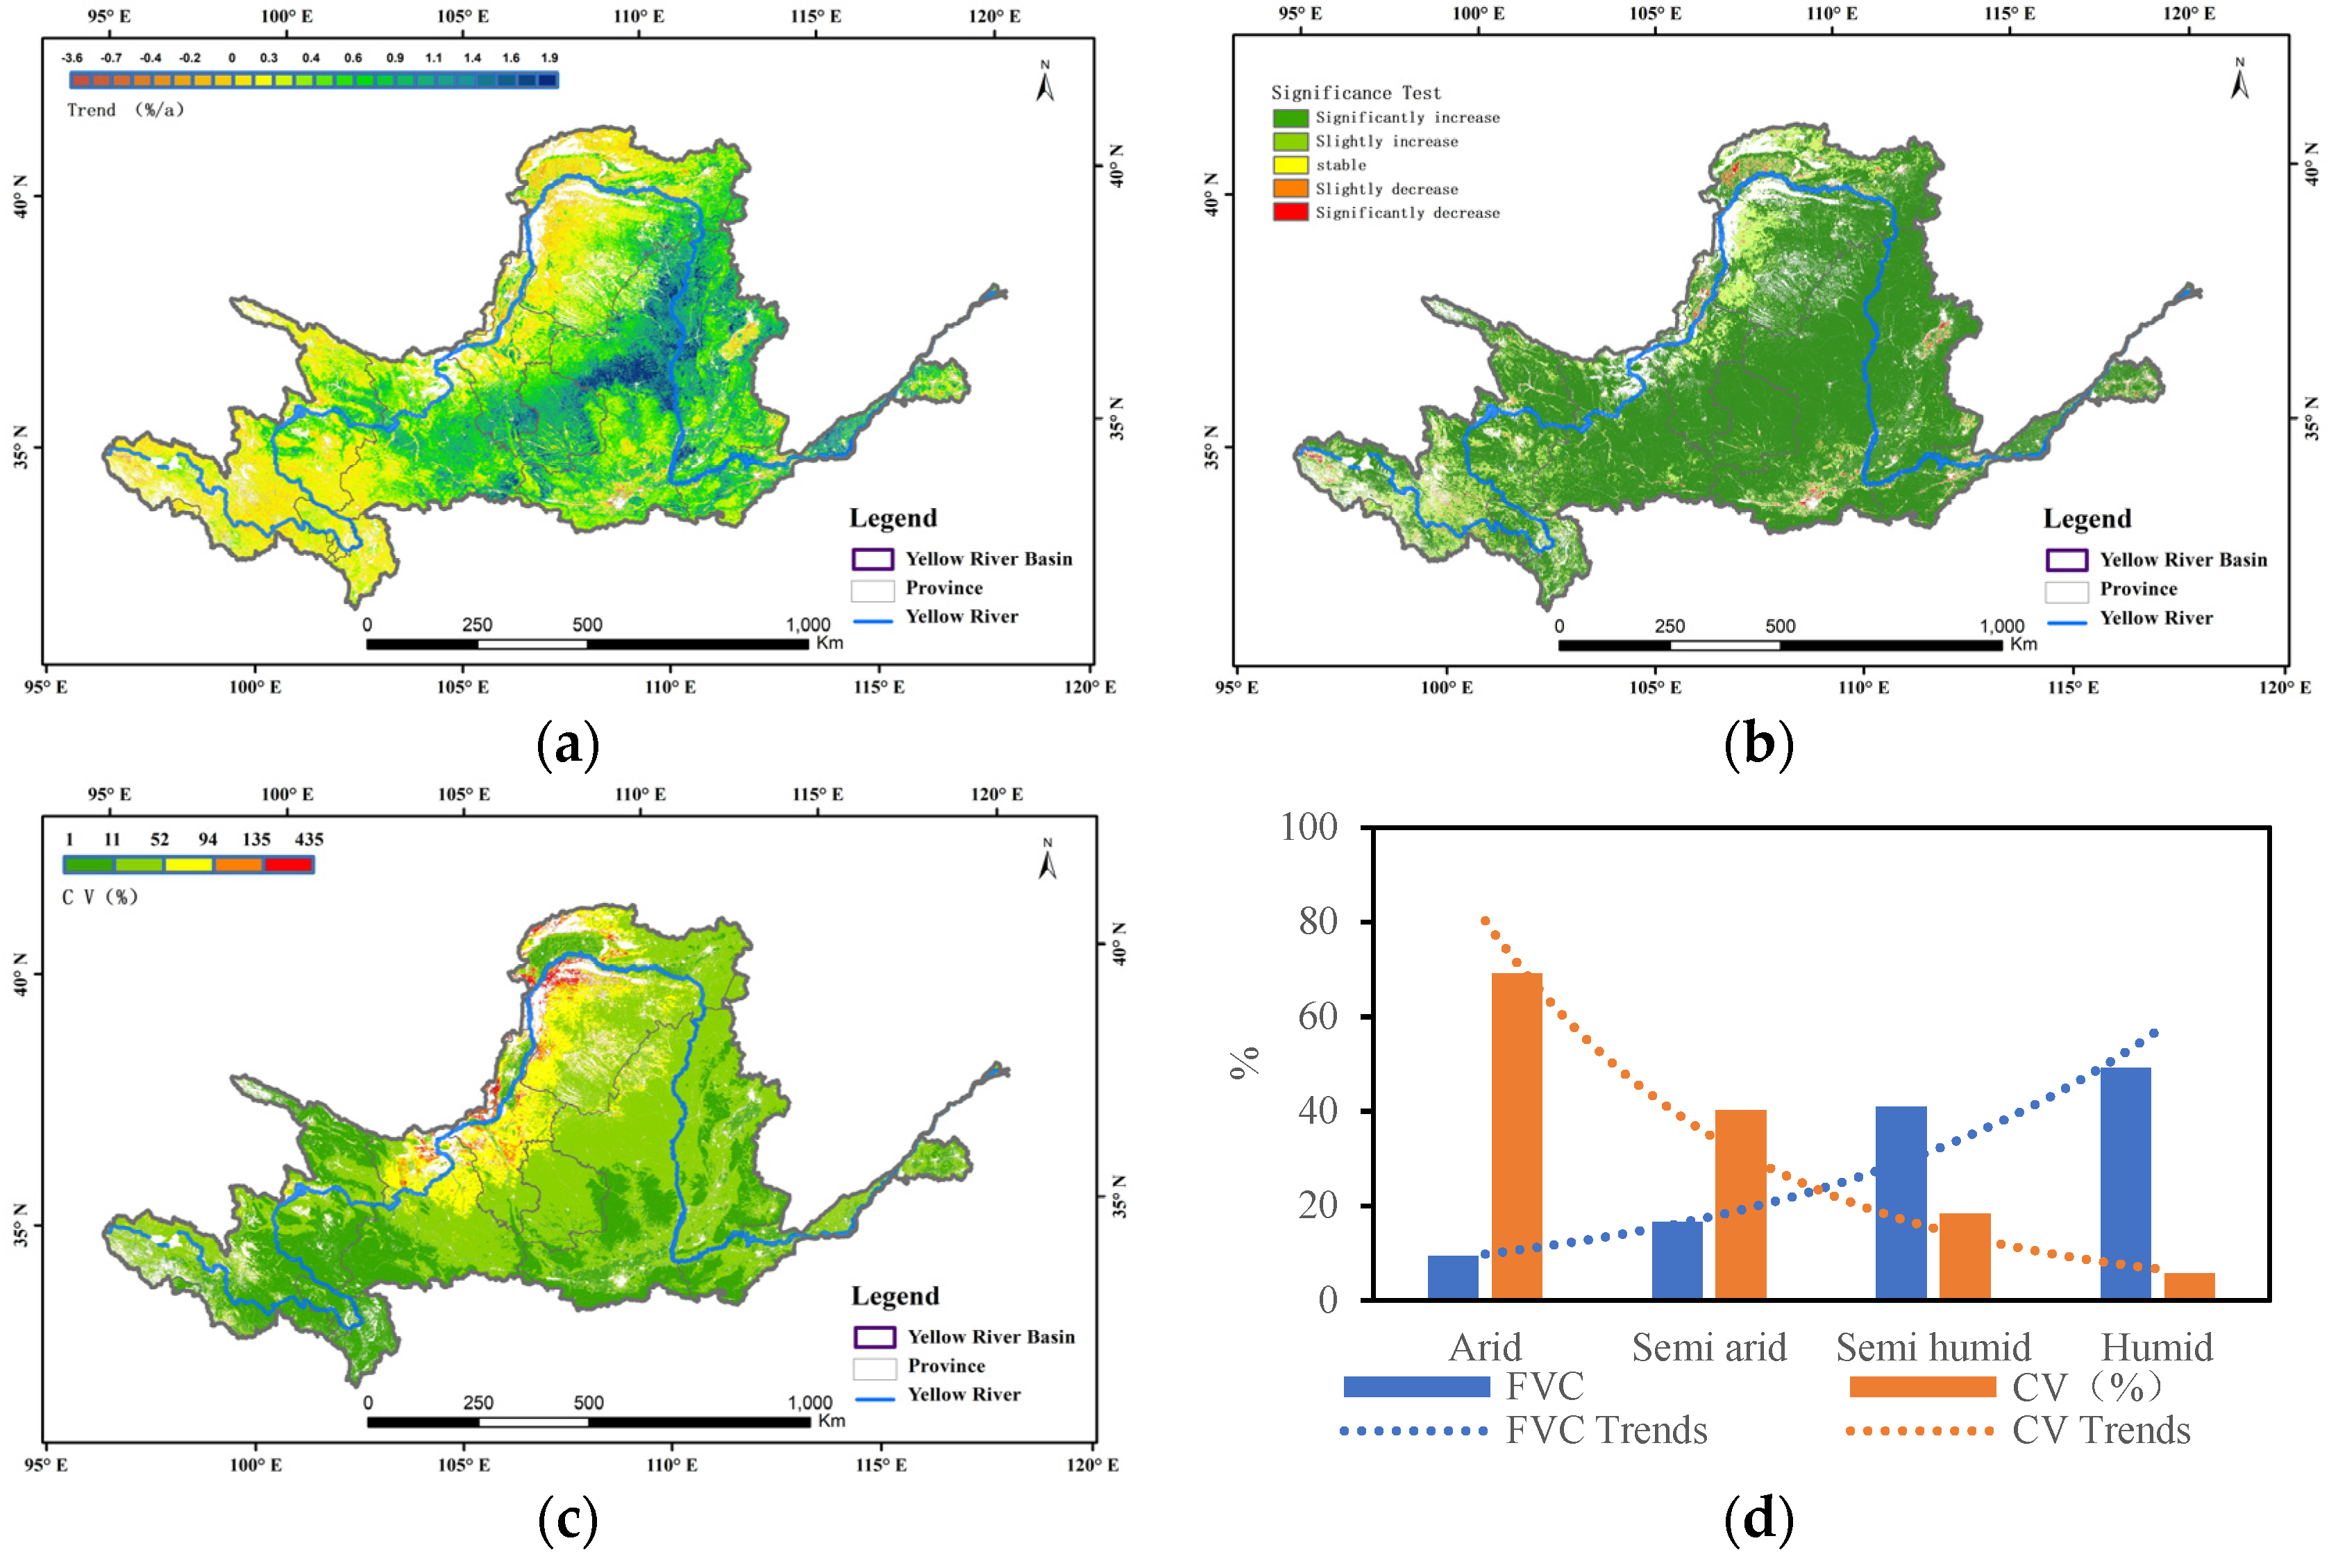
3.1.1. FVC Trends and Characteristics
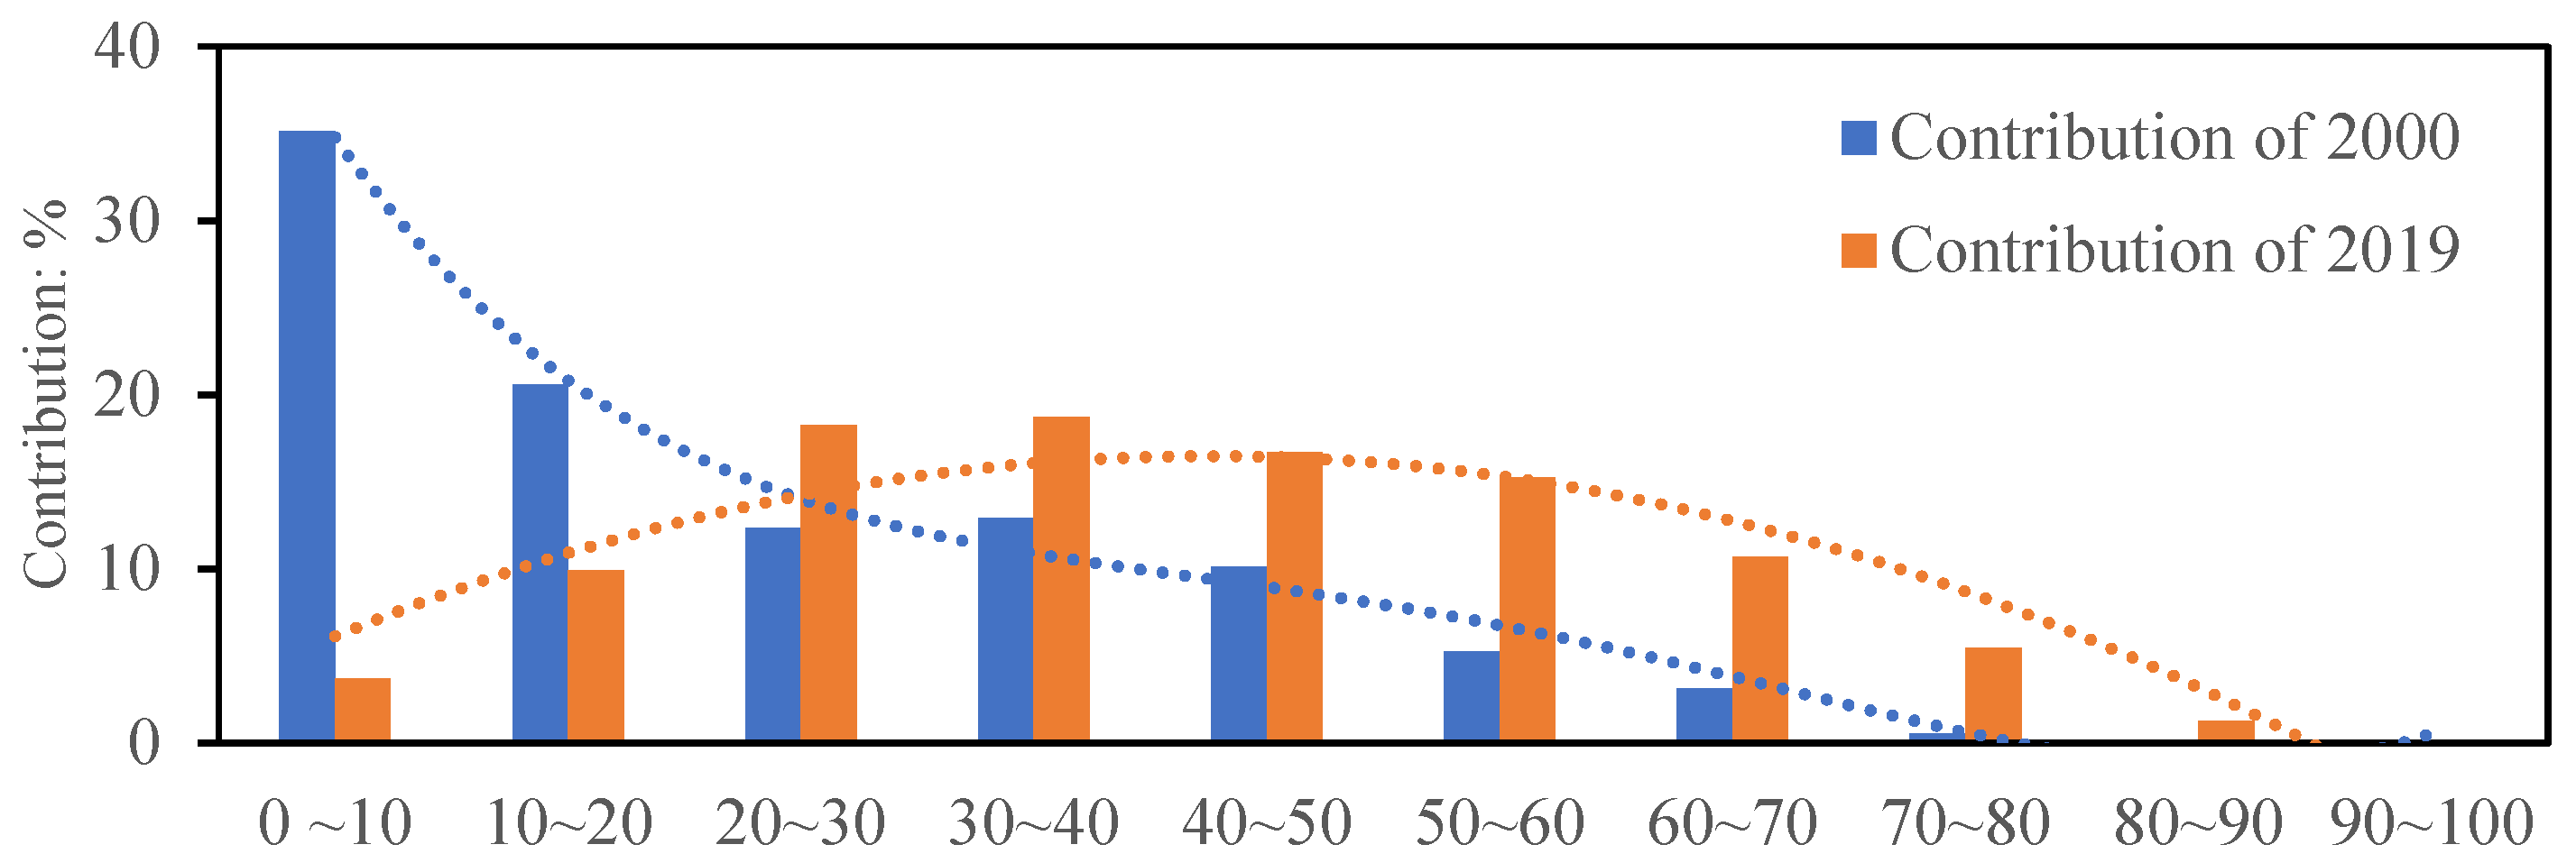
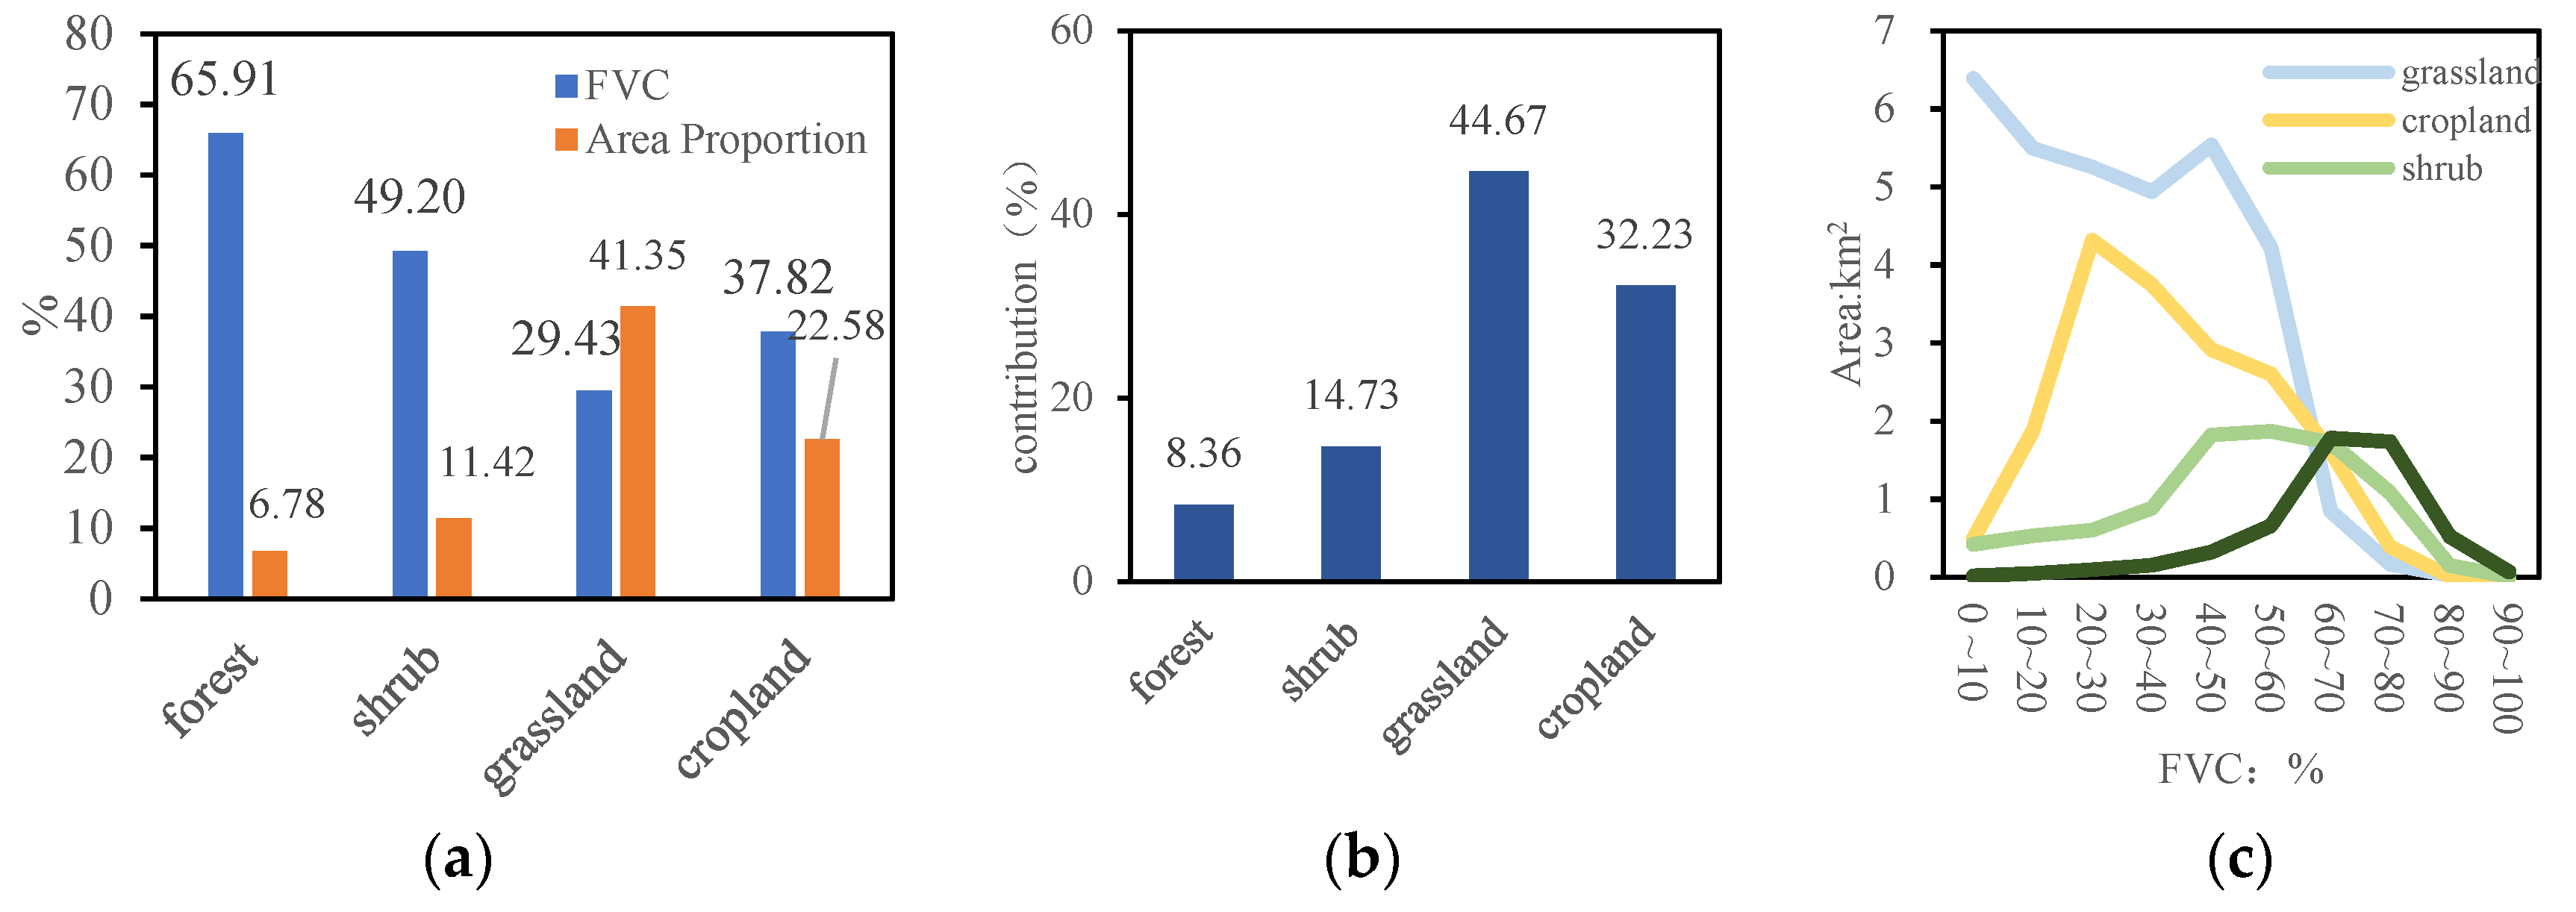
3.1.2. The Contribution of Vegetation
3.2. Variation Factors
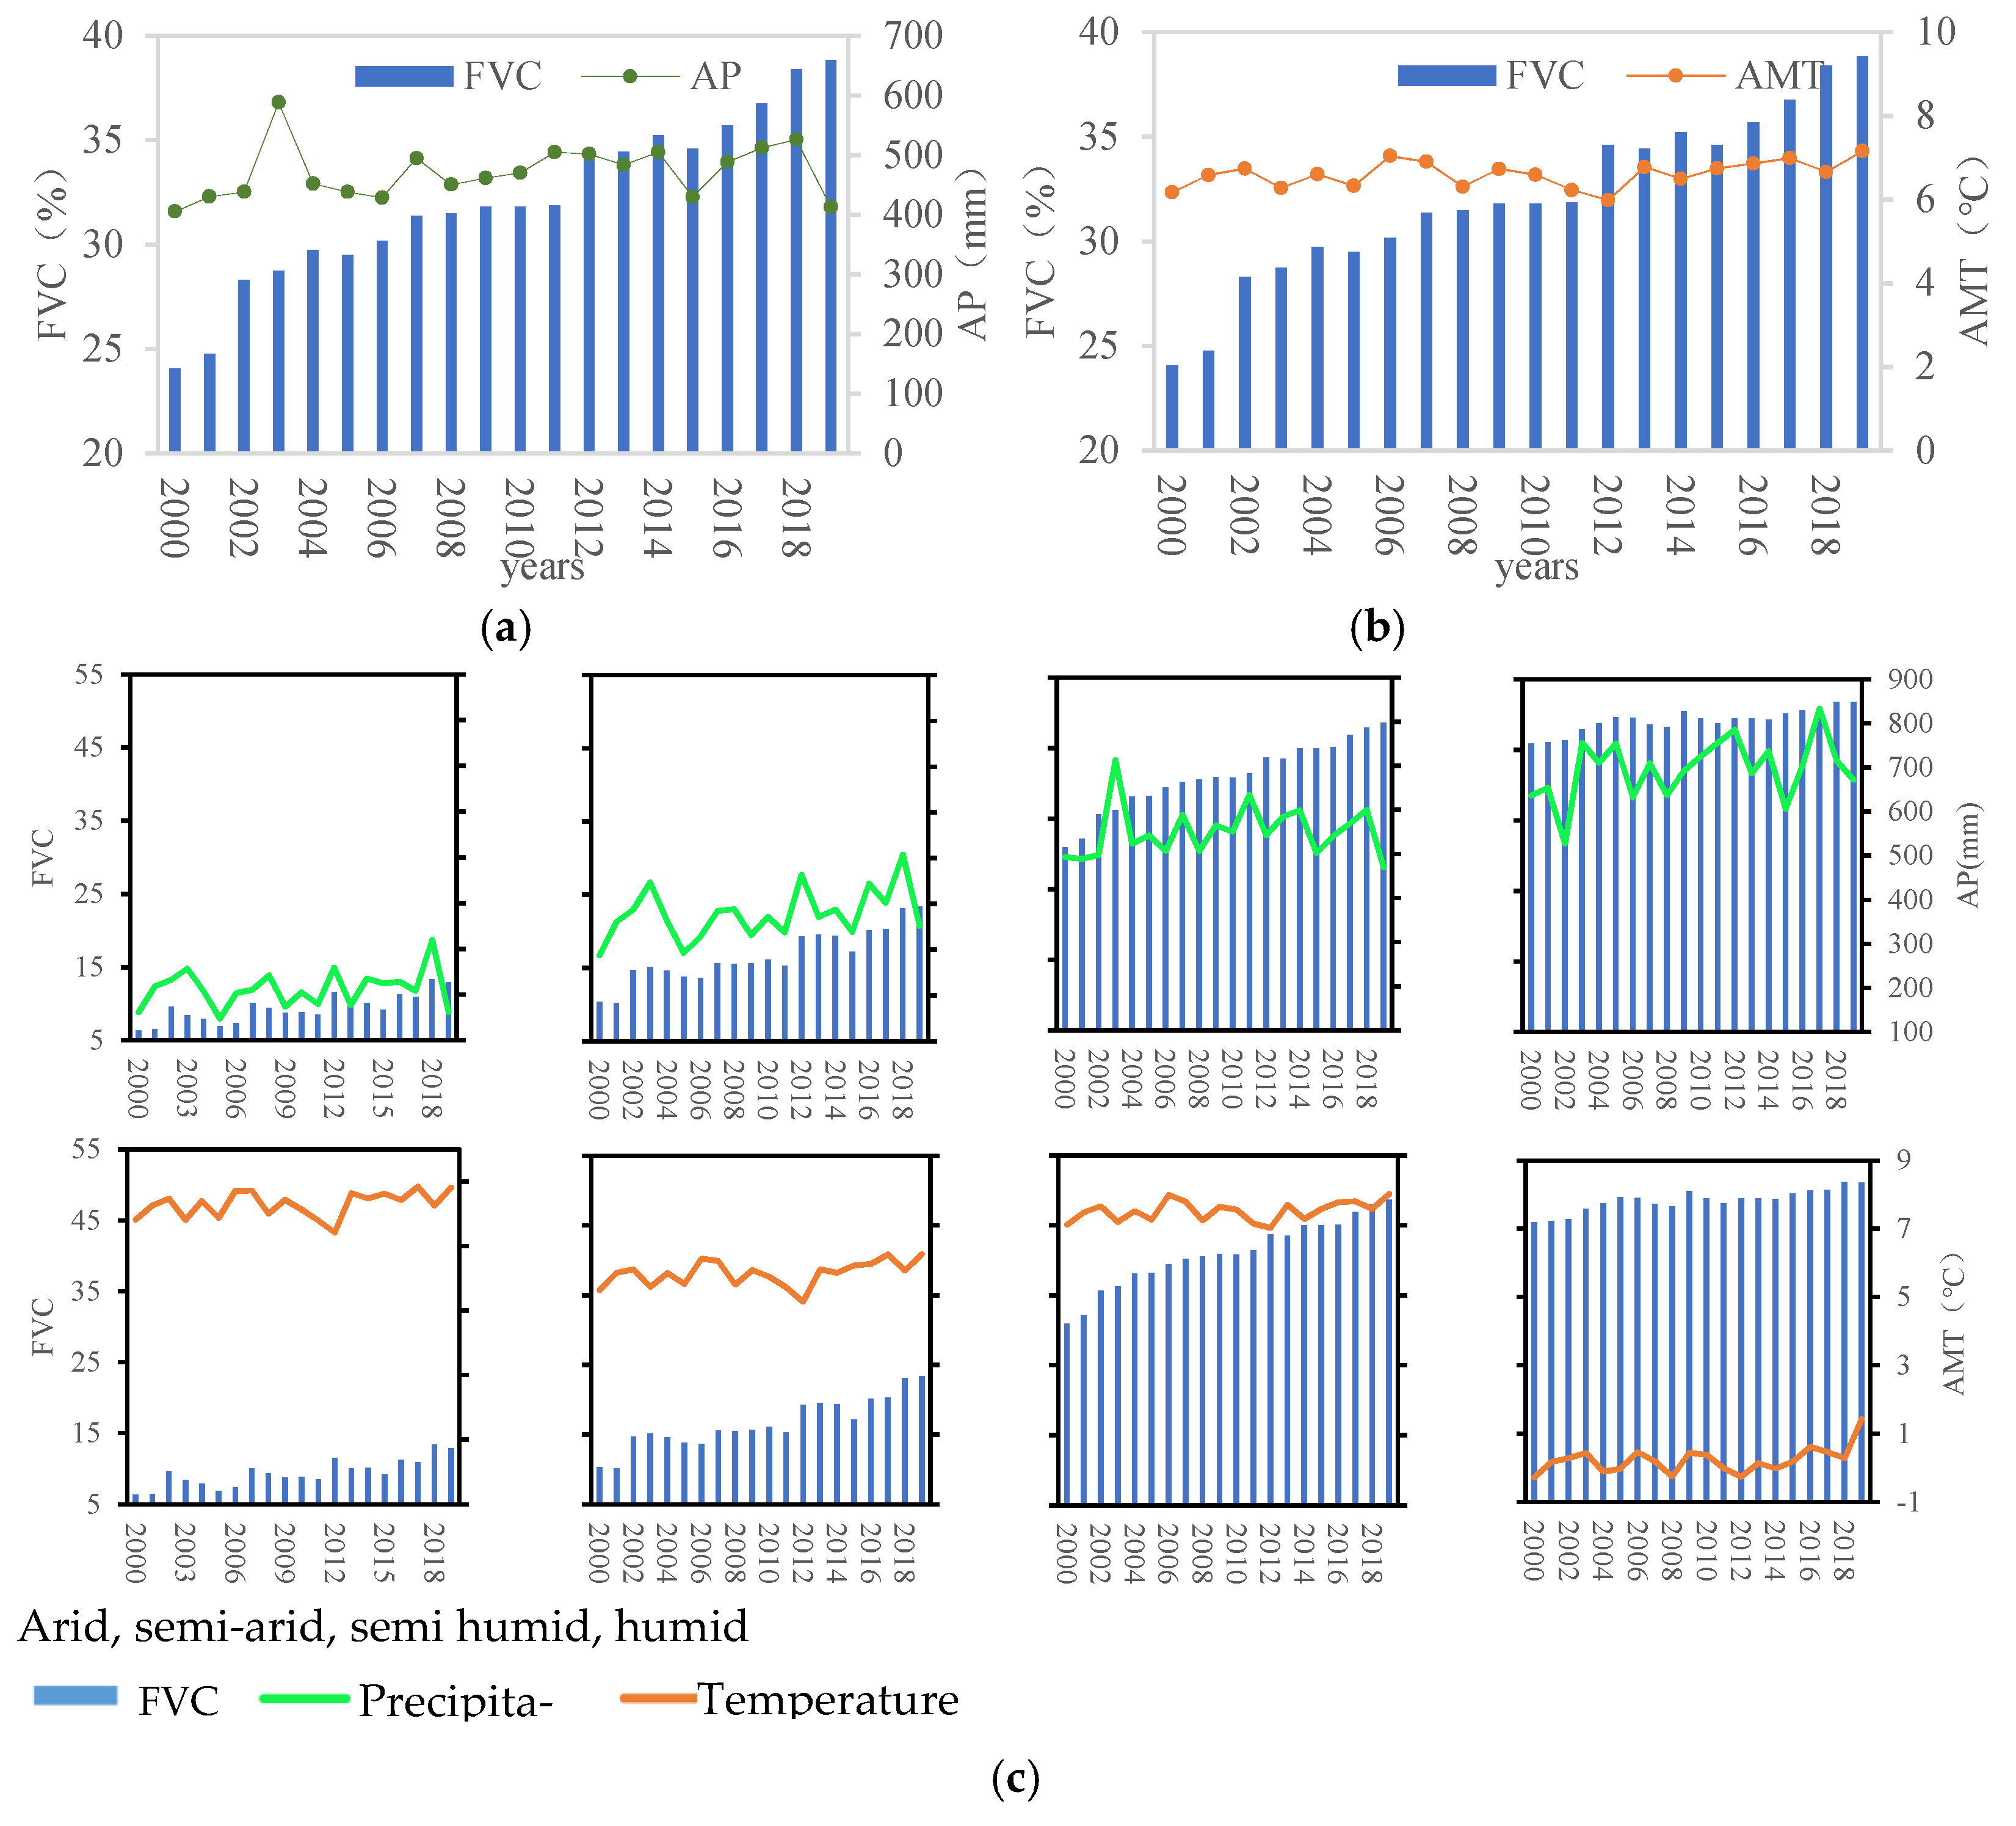
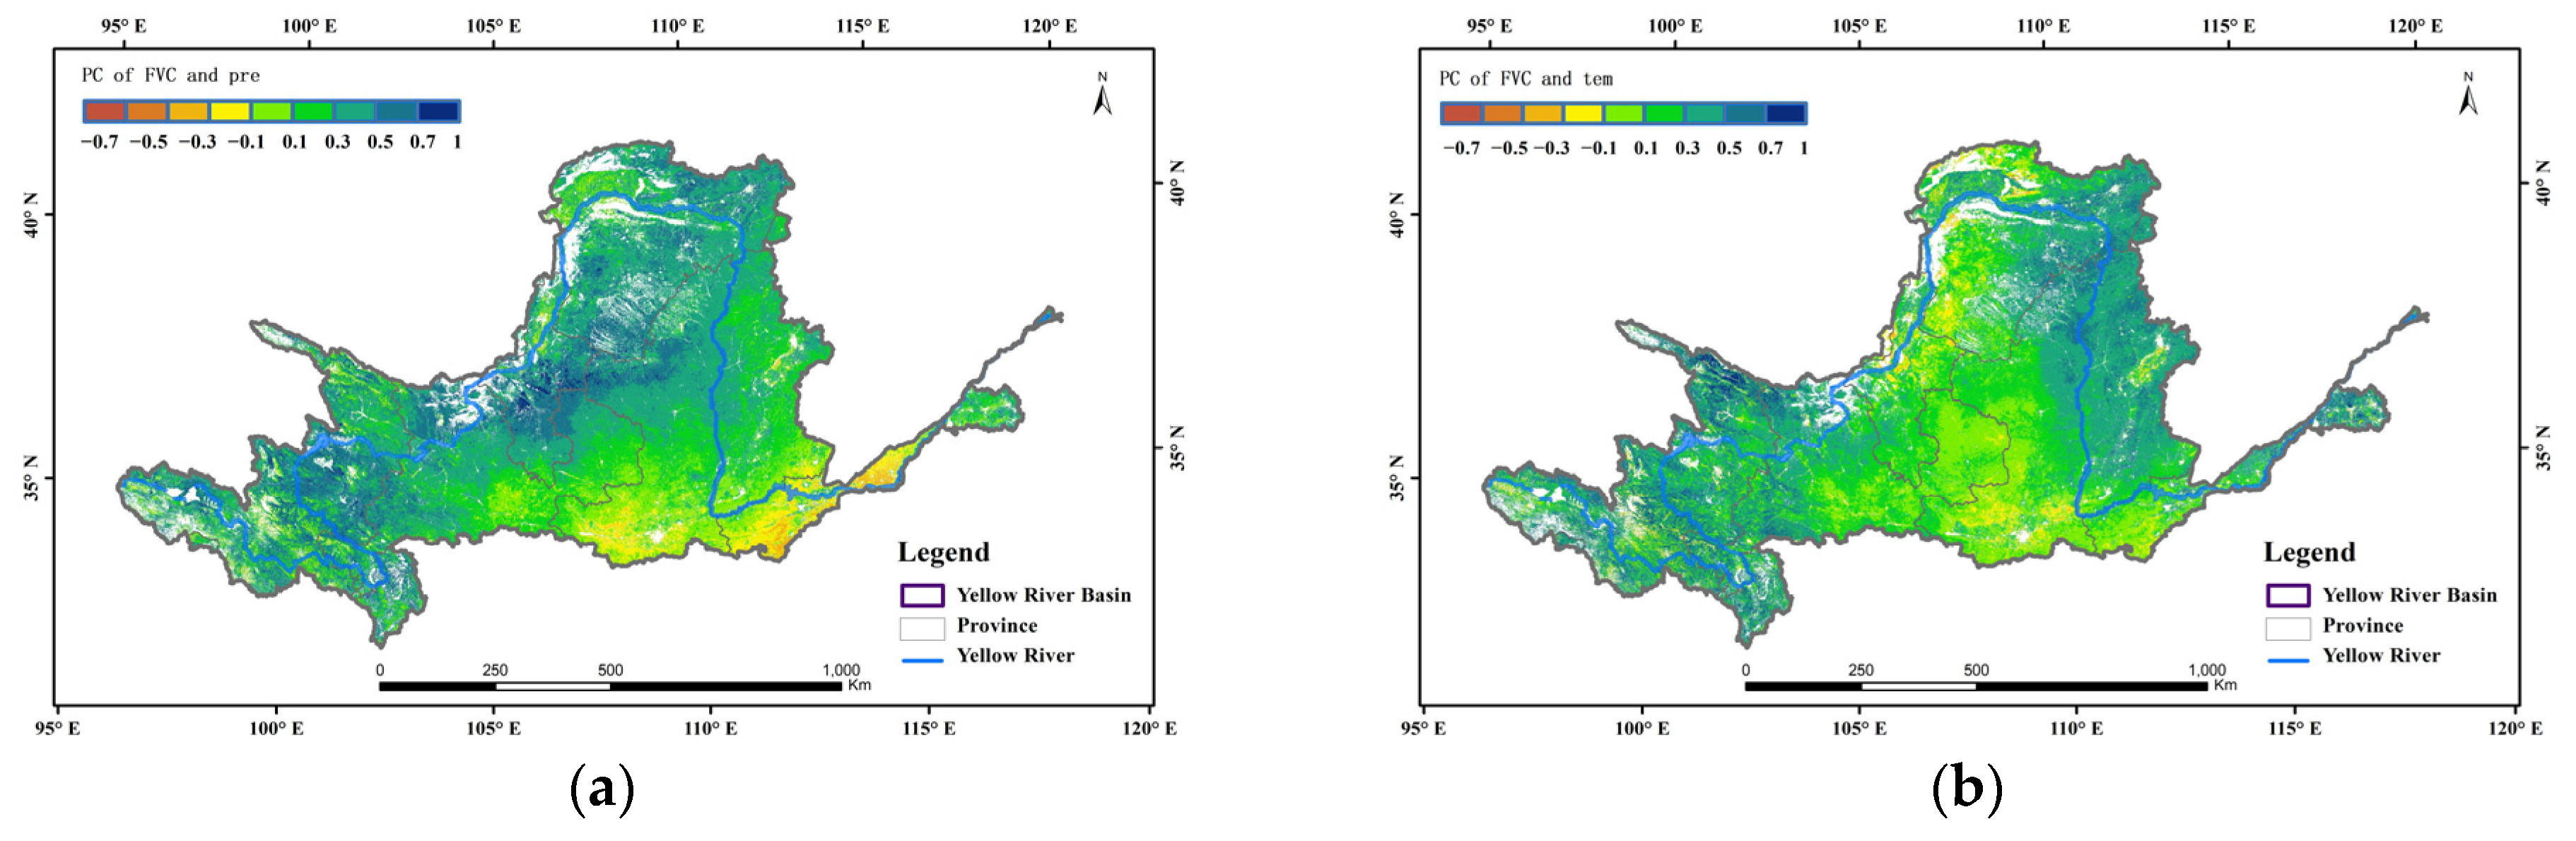
3.2.1. Effects of Climatic Factors on Vegetation
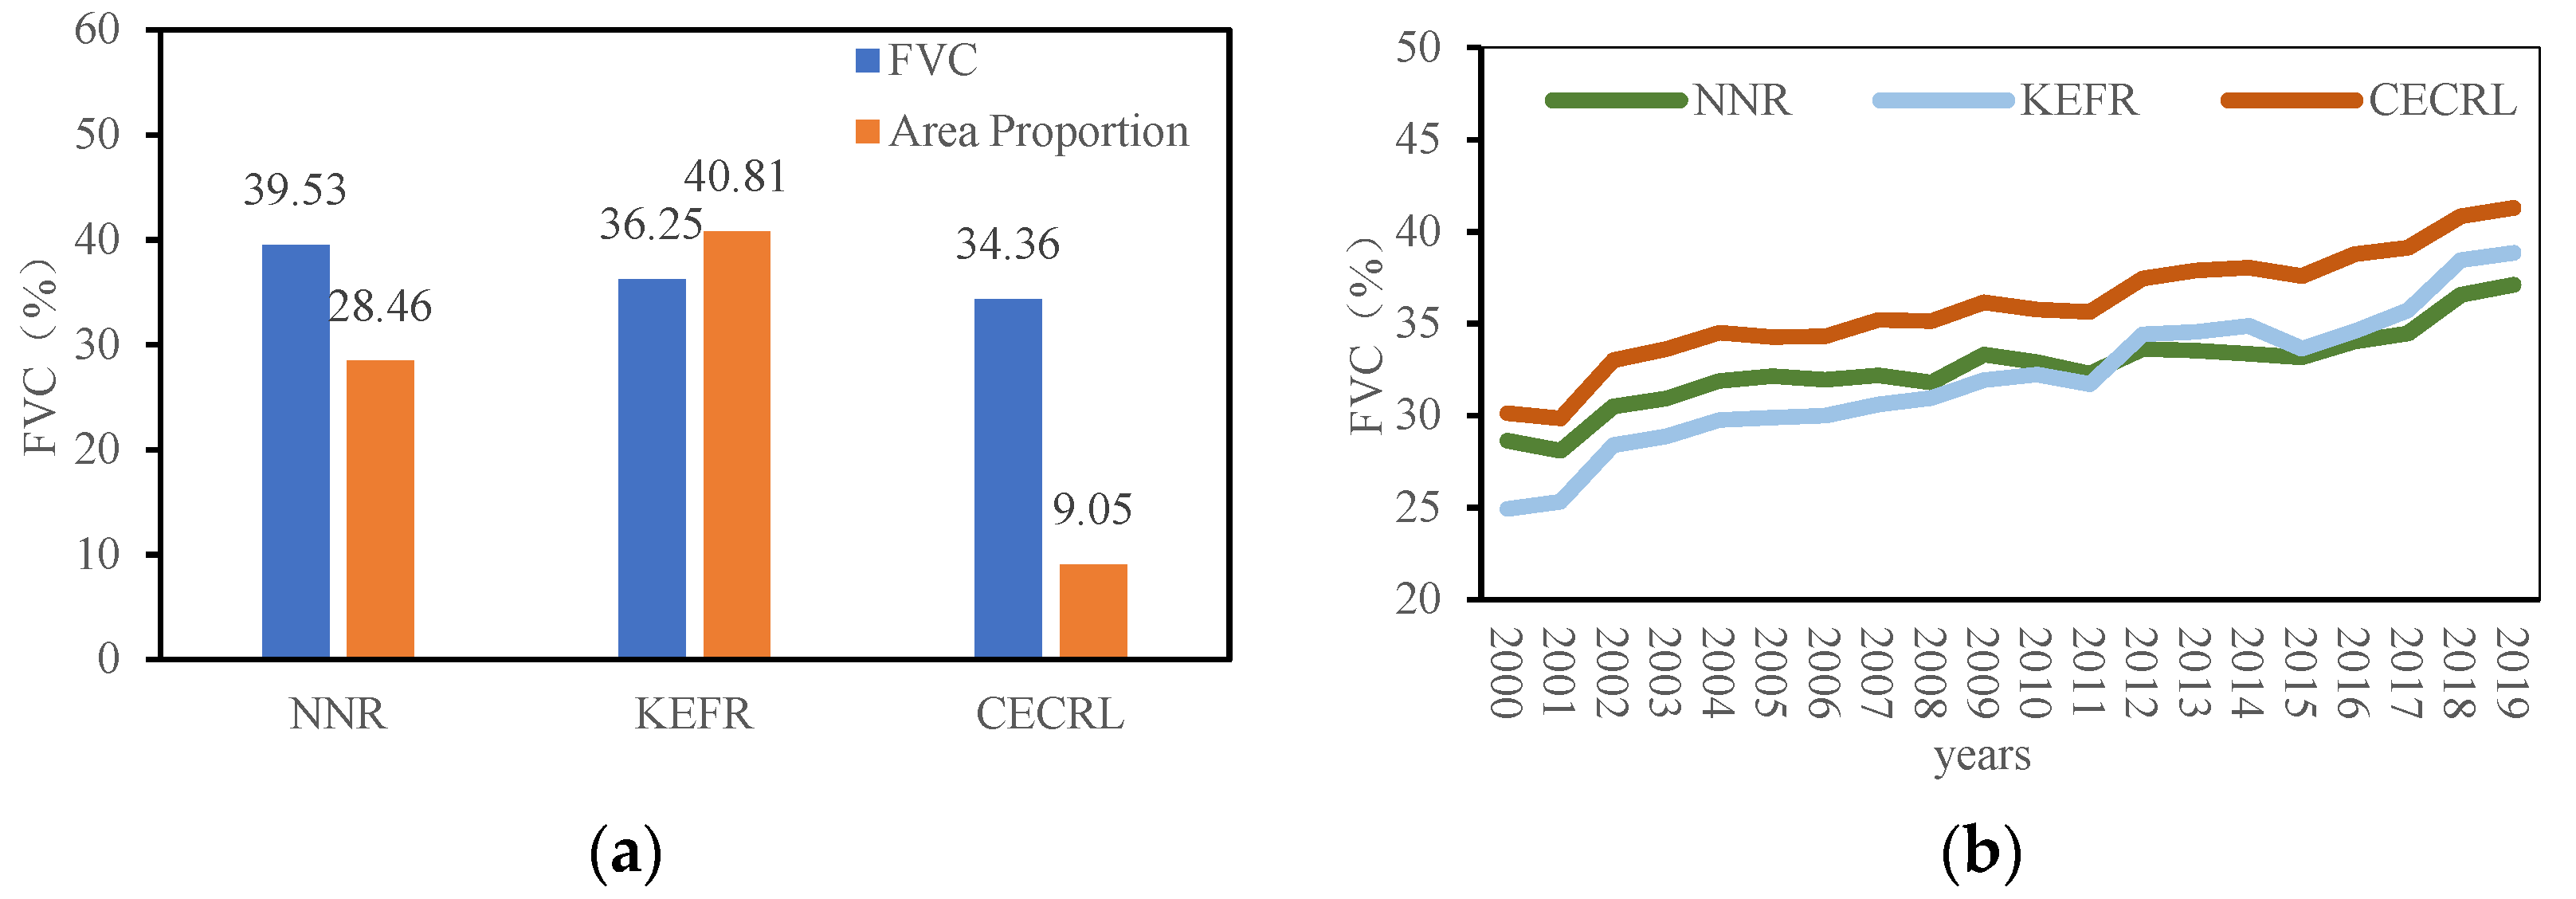
3.2.2. The Relationship between Ecological Management and Vegetation
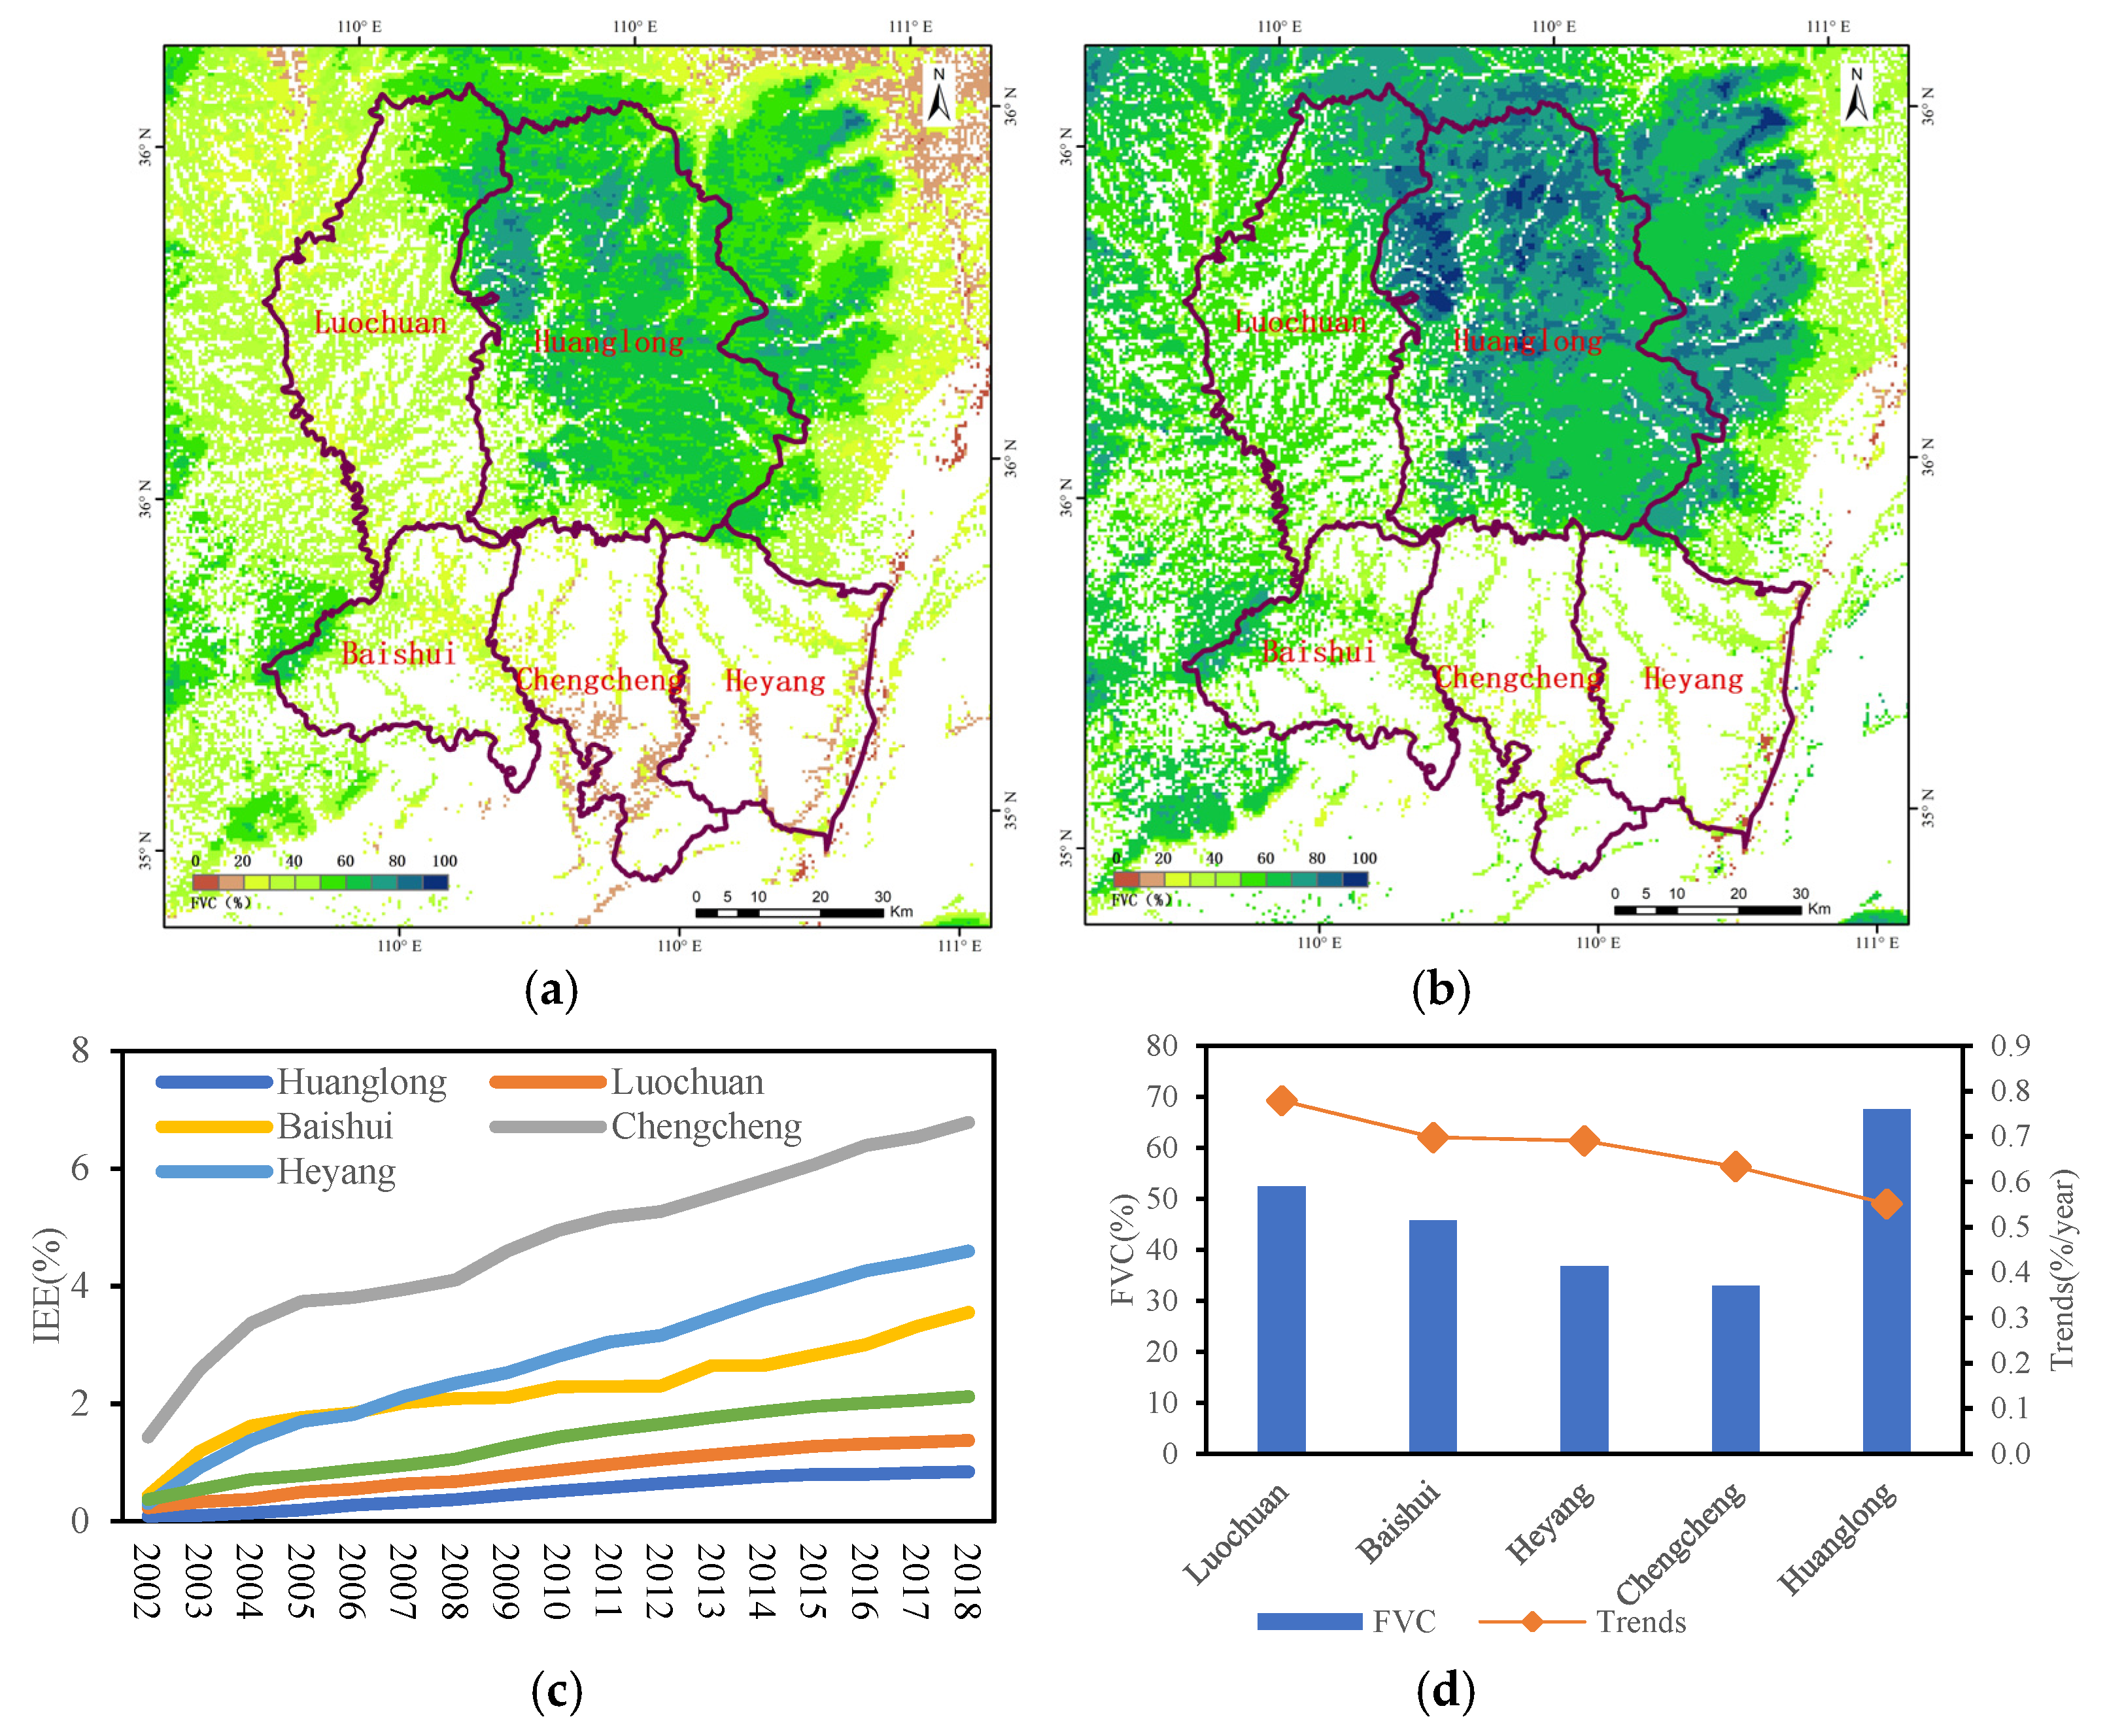
3.2.3. Effects of Ecological Afforestation on Vegetation
- (1)
- The Typical Area of Huanglong and the Surrounding County
- (2)
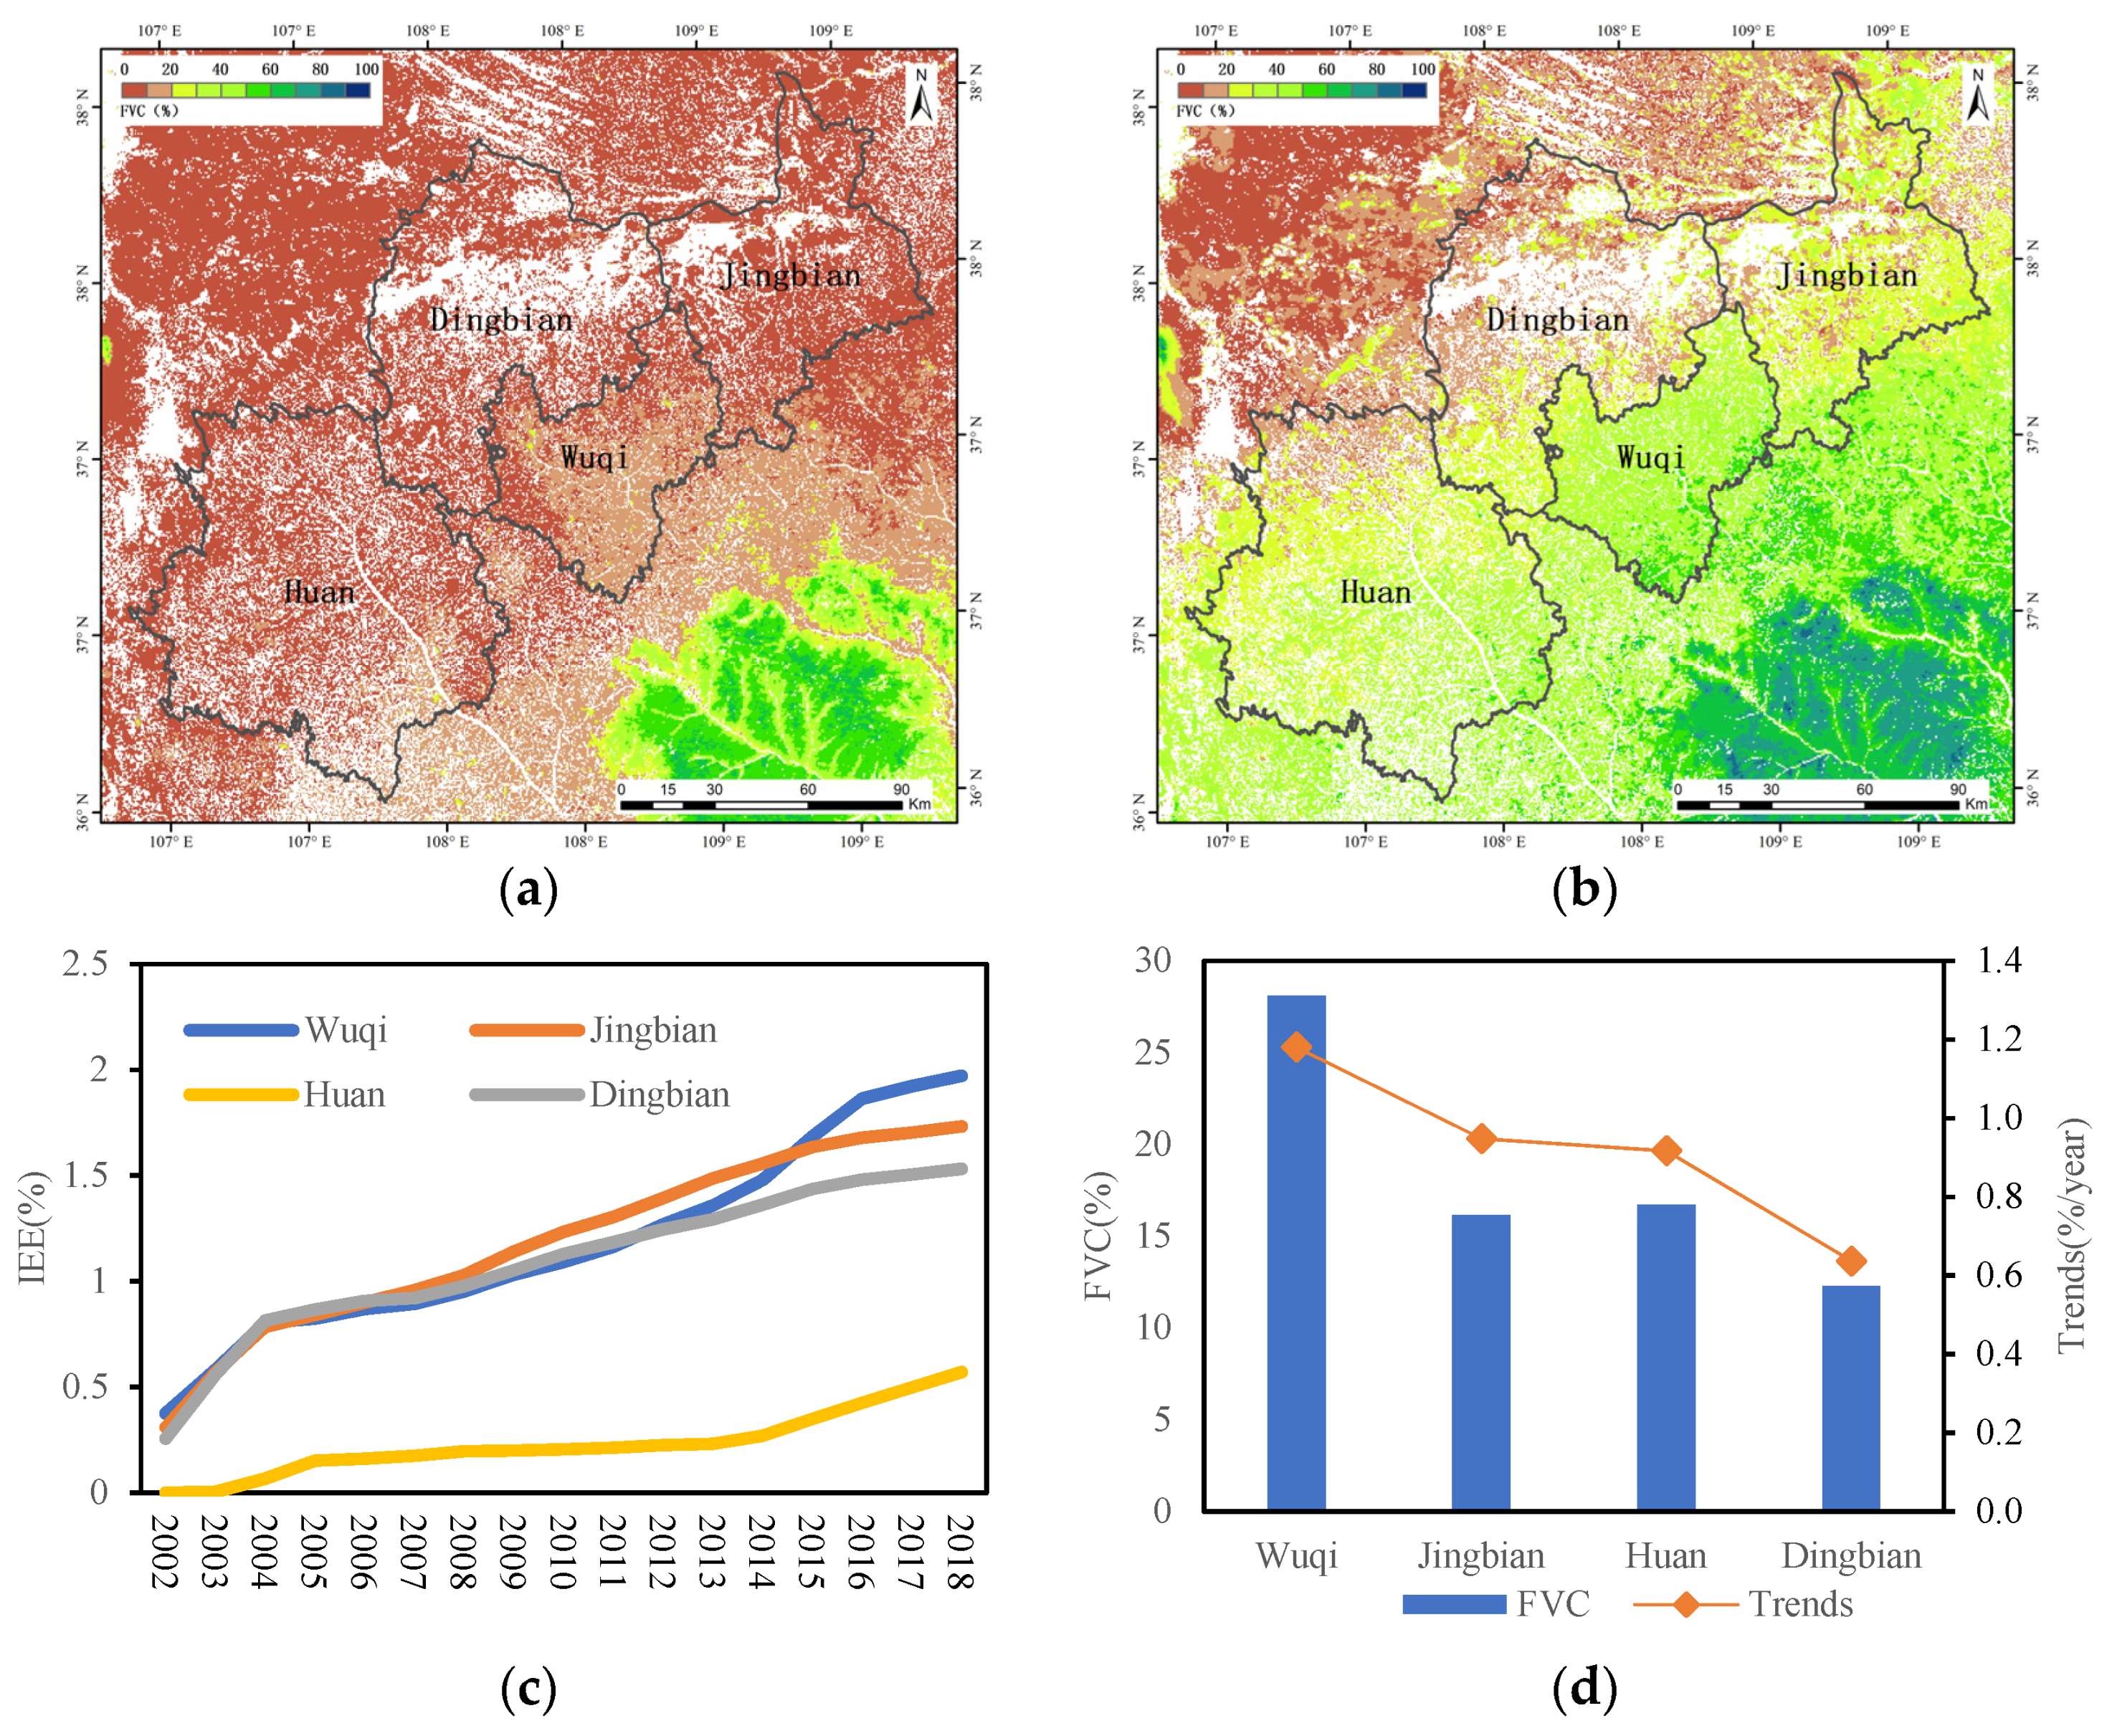
- The Typical Area of Wuqi and the Surrounding County
4. Conclusions and Discussion
Author Contributions
Funding
Institutional Review Board Statement
Informed Consent Statement
Data Availability Statement
Acknowledgments
Conflicts of Interest
References
- Xiao, J.F.; Moody, A. A comparison of methods for estimating fractional green vegetation cover within a desert-to-upland transition zone in central New Mexico, USA. Remote Sens. Environ. 2005, 98, 237–250. [Google Scholar] [CrossRef]
- Lu, H.; Raupach, M.R.; McVicar, T.R.; Barrett, D.J. Decomposition of vegetation cover into woody and herbaceous components using AVHRR NDVI time series. Remote Sens. Environ. 2003, 86, 1–18. [Google Scholar] [CrossRef]
- Ma, H.X.; Chen, C.C.; Song, Y.Q.; Ye, S.; Hu, Y.M. Analysis of vegetation cover change and its driving factors over the past ten years in Qinghai province. Res. Soil Water Conserv. 2018, 25, 137–145. [Google Scholar] [CrossRef]
- Liu, B.Z.; Fang, X.Q.; He, Q.S.; Rong, Q.Y. Monitoring the changes of vegetation based on MODIS data and BFAST methods. Remote Sens. Land Resour. 2016, 28, 146–153. [Google Scholar] [CrossRef]
- Yang, L.; Jia, K.; Liang, S.; Liu, J.; Wang, X. Comparison of Four Machine earning Methods for Generating the GLASS Fractional Vegetation Cover Product from MODIS Data. Remote Sens. 2016, 8, 682. [Google Scholar] [CrossRef] [Green Version]
- Cao, W.; Wu, D.; Huang, L.; Liu, L. Spatial and temporal variations and significance identification of ecosystem services in the Sanjiangyuan National Park, China. Sci. Rep. 2020, 10, 6151. [Google Scholar] [CrossRef] [PubMed]
- Hill, J.M.; Guerschman, P.J. The MODIS Global Vegetation Fractional Cover Product 2001–2018: Characteristics of Vegetation Fractional Cover in Grasslands and Savanna Woodlands. Remote Sensing. Remote Sens. 2020, 12, 406. [Google Scholar] [CrossRef] [Green Version]
- Ding, Y.; Zheng, X.; Zhao, K.; Xin, X.; Liu, H. Quantifying the Impact of NDVIsoil Determination Methods and NDVIsoil Variability on the Estimation of Fractional Vegetation Cover in Northeast China. Remote Sens. 2016, 8, 29. [Google Scholar] [CrossRef] [Green Version]
- Wu, D.H.; Wu, H.; Zhao, X.; Zhou, T.; Tang, B.J.; Zhao, W.Q.; Jia, K. Evaluation of spatiotemporal variations of global fractional vegetation cover based on GIMMS NDVI data from 1982 to 2011. Remote Sens. 2014, 6, 4217–4239. [Google Scholar] [CrossRef] [Green Version]
- Zhang, C.S.; Hu, Y.; Shi, X.L. Analysis of spatial-temporal evolution of vegetation cover in Loess Plateau in recent 33 years based on AVHRR NDVI and MODIS NDVI. J. Appl. Sci. Electron. Sand Inf. Eng. 2016, 34, 702–712. [Google Scholar] [CrossRef]
- Dong, J.F.; Yuan, Y.; He, H.J.; Gao, B. Analyses of spatial-temporal changes of leaf area index in Shaanxi province based on MODIS. J. Northwest Univ. 2016, 31, 79–85. [Google Scholar] [CrossRef]
- Zhang, Y.; Zhang, C.B.; Wang, Z.Q.; An, R.; Li, J.L. Comprehensive Research on Remote Sensing Monitoring of Grassland Degradation: A Case Study in the Three-River Source Region, China. Sustainability 2019, 11, 1845. [Google Scholar] [CrossRef] [Green Version]
- Piao, S.L.; Yin, G.D.; Tan, J.G.; Cheng, L.; Huang, M.T.; Li, Y.; Liu, R.G.; Mao, J.F.; Myneni, R.B.; Peng, S.S.; et al. Detection and attribution of vegetation greening trend in China over the last 30 years. Glob. Chang. Biol. 2015, 21, 1601–1609. [Google Scholar] [CrossRef]
- Xiao, J.S.; Qiao, B.; Chen, G.Q.; Shi, F.F.; Cao, X.Y.; Zhu, C.X. Land use change and evolution of ecosystem service value in Maduo County of source region of the Yellow River. Acta Ecol. Sin. 2020, 40, 510–521. [Google Scholar] [CrossRef]
- Jia, K.; Liang, S.; Gu, X.; Baret, F.; Wei, X.; Wang, X.; Yao, Y.; Yang, L.; Li, Y. Fractional vegetation cover estimation algorithm for Chinese GF-1 wide field view data. Remote Sens. Environ. 2016, 177, 184–191. [Google Scholar] [CrossRef]
- Mu, X.H.; Song, W.J.; Gao, Z.; McVicar, T.R.; Donohuec, R.J.; Yan, G.J. Fractional vegetation cover estimation by using multi-angle vegetation index. Remote Sens. Environ. 2018, 216, 44–56. [Google Scholar] [CrossRef]
- Bareta, F.; Hagolle, O.; Geiger, B.; Bicheron, P.; Miras, B.; Huc, M.; Berthelot, B.; Niño, F.; Weiss, M.; Samain, O.; et al. LAI, fAPAR and fCover cyclipes global products derived from vegetation Part 1: Principles of the algorithm. Remote Sens. Environ. 2007, 110, 275–286. [Google Scholar] [CrossRef] [Green Version]
- Yi, L.; Ren, Z.Y.; Zhang, C.; Liu, W. Vegetation Cover, Climate and Human Activities on the Loess Plateau. Resour. Sci. 2014, 36, 166–174. [Google Scholar]
- Jeong, S.-J.; Ho, C.-H.; Park, T.-W.; Kim, J.; Levis, S. Impact of vegetation feedback on the temperature and its diurnal range over the Northern Hemisphere during summer in a 2 × CO2 climate. Clim. Dyn. 2011, 37, 821–833. [Google Scholar] [CrossRef] [Green Version]
- Li, X.; Wang, H.; Fu, N.; Wang, D.; Zhang, L. Estimating vegetation fractional coverage for temperate grassland in northern China based on remotely sensed data and rainfall time series. In Proceedings of the 2007 IEEE International Geoscience and Remote Sensing Symposium, Barcelona, Spain, 23–28 July 2007; IEEE: Piscataway, NJ, USA. [Google Scholar] [CrossRef]
- Adler, P.; Raff, D.; Lauenroth, W. The effect of grazing on the spatial heterogeneity of vegetation. Oecologia 2001, 128, 465–479. [Google Scholar] [CrossRef]
- Eldridge, D.J.; Poore, A.; Ruiz-Colmenero, M.; Letnic, M.; Soliveres, S. Ecosystem structure, function, and composition in rangelands are negatively affected by livestock grazing. Ecol. Appl. 2016, 26, 1273–1283. [Google Scholar] [CrossRef] [Green Version]
- Gaitán, J.J.; Bran, D.; Oliva, G.E.; Aguiar, M.R.; Buono, G.G.; Ferrante, D.; Nakamatsu, V.; Ciari, G.; Salomone, J.M.; Massara, V.; et al. Aridity and Overgrazing Have Convergent Effects on Ecosystem Structure and Functioning in Patagonian Rangelands. Land Degrad. Dev. 2018, 29, 210–218. [Google Scholar] [CrossRef]
- Li, W.; Zhao, J.; Pan, J.H.; Li, X. A Research of Net Primary Productivity Model of Grassland Based on MODIS Data in the Loess Plateau of China. Remote Sens. Technol. Appl. 2009, 24, 660–664. [Google Scholar]
- Liang, W.; Bai, D.; Wang, F.Y.; Fu, B.J.; Yan, J.P.; Wang, S.; Yang, Y.T.; Long, D.; Feng, M.Q. Quantifying the impacts of climate change and ecological restoration on streamflow changes based on a Budyko hydrological model in China’s Loess Plateau. Water Resour. Res. 2015, 51, 6500–6519. [Google Scholar] [CrossRef]
- Xiao, J.F. Satellite evidence for significant biophysical consequences of the “Grain for Green” Program on the Loess Plateau in China. J. Geophys. Res. Biogeosci. 2014, 119, 2261–2275. [Google Scholar] [CrossRef] [Green Version]
- Lu, Y.H.; Zhang, L.W.; Feng, X.M.; Zeng, Y.; Fu, B.J.; Yao, X.L.; Li, J.R.; Wu, B.F. Recent ecological transitions in China-greening, browning, and influential factors. Sci. Rep. 2015, 5, 8732. [Google Scholar] [CrossRef]
- Liu, Y.; Fu, B.J. Topographical variation of vegetation cover evolution and the impact of land use/cover change in the Loess Plateau. Arid. Land Geogr. 2013, 36, 1097–1102. [Google Scholar] [CrossRef]
- Jin, Z.; Liang, W.; Yang, Y.T. Separating Vegetation Greening and Climate Change Controls on Evapotranspiration trend over the Loess Plateau. Sci. Rep. 2017, 7, 1–15. [Google Scholar] [CrossRef]
- Wen, Z.M.; Feng, J. Review of the studies on the prediction of natural vegetation distribution. Sci. Soil Water Conserv. 2009, 7, 117–124. [Google Scholar] [CrossRef]
- Wohlfart, C.; Liu, G.; Huang, C.; Kuenzer, C. A River Basin over the Course of Time: Multi-Temporal Analyses of Land Surface Dynamics in the Yellow River Basin (China) Based on Medium Resolution Remote Sensing Data. Remote Sens. 2016, 8, 186. [Google Scholar] [CrossRef] [Green Version]
- De Keersmaecker, W.; Lhermitte, S.; Hill, M.J.; Tits, L.; Coppin, P.; Somers, B. Assessment of Regional Vegetation Response to Climate Anomalies: A Case Study for Australia Using GIMMS NDVI Time Series between 1982 and 2006. Remote Sens. 2017, 9, 34. [Google Scholar] [CrossRef] [Green Version]
- Gogoi, P.P.; Vinoj, V.; Swain, D.; Roberts, G.; Dash, J.; Tripathy, S. Land use and land cover change effect on surface temperature over Eastern India. Sci. Rep. 2019, 9, 8859. [Google Scholar] [CrossRef] [PubMed] [Green Version]
- Liu, X.F.; Yang, Y.; Ren, Z.Y.; Lin, Z.H. Changes of Vegetation Cover age in the Loess Plateau in 2000–2009. J. Desert Res. 2013, 33, 1244–1249. [Google Scholar] [CrossRef]
- McKeon, G.M.; Stone, G.S.; Syktus, J.I.; Carter, J.O.; Flood, N.R.; Ahrens, D.G.; Howden, S.M.; Johnston, P.W.; Ryan, J.G.; Day, K.A.; et al. Climate change impacts on northern Australian rangeland livestock carrying capacity--a review of issues. Rangel. J. 2009, 31, 1–29. [Google Scholar] [CrossRef] [Green Version]
- Ahlström, A.; Raupach, M.R.; Schurgers, G.; Smith, B.; Arneth, A.; Jung, M.; Reichstein, M.; Canadell, J.G.; Friedlingstein, P.; Jain, A.K.; et al. The dominant role of semi-arid ecosystems in the trend and variability of the land CO2 sink. Science 2015, 348, 895–899. [Google Scholar] [CrossRef] [Green Version]
- Guerschmana, J.P.; Hill, M.J.; Leys, J.; Heidenreich, S. Vegetation cover dependence on accumulated antecedent precipitation in Australia--Relationships with photosynthetic and non-photosynthetic vegetation fractions. Remote Sens. Environ. 2020, 240, 111670. [Google Scholar] [CrossRef]
- Amiri, R.; Weng, Q.H.; Alimohammadi, A.; Alavipanah, S.K. Spatial–temporal dynamics of land surface temperature in relation to fractional vegetation cover and land use/cover in the Tabriz urban area, Iran. Remote Sens. Environ. 2009, 113, 2606–2617. [Google Scholar] [CrossRef]
- Gao, X.; Zhao, Q.; Zhao, X.; Wu, P.; Pan, W.; Gao, X.; Sun, M. Temporal and spatial evolution of the standardized precipitation evapotranspiration index (SPEI) in the Loess Plateau under climate change from 2001 to 2050. Sci. Total. Environ. 2017, 595, 191–200. [Google Scholar] [CrossRef]
- Arneth, A. Climate science: Uncertain future for vegetation cover. Nature 2015, 524, 44–45. [Google Scholar] [CrossRef] [PubMed] [Green Version]
- Sun, X.P.; Wang, T.M.; Kou, X.J.; Ge, J.P. Normalized difference vegetation index dynamic change and its driving factor analysis with long time series in the Jinghe River watershed on the Loess Plateau of China. Chin. J. Plant Ecol. 2012, 36, 511–521. [Google Scholar] [CrossRef]
- Zhi, T.; Zhang, H.B.; Xin, C.; Wei, X.C.; Dang, C.H. Vegetation cover variation and its impact on runoff in Tuweihe River Watershed. Water Resour. Hydropower Eng. 2021, 02, 40–52. [Google Scholar]
- Dong, X.; Chen, Z.; Wu, M.; Hu, C. Long time series of remote sensing to monitor the transformation research of Kubuqi Desert in China. Earth Sci. Inf. 2020, 13, 795–809. [Google Scholar] [CrossRef]
- Ostwald, M.; Chen, D. Land-use change: Impacts of climate variations and policies among small-scale farmers in the Loess Plateau, China. Land Use Policy 2006, 23, 361–371. [Google Scholar] [CrossRef]
- Chen, C.; Park, T.; Wang, X.; Piao, S.; Xu, B.; Chaturvedi, R.K.; Fuchs, R.; Brovkin, V.; Ciais, P.; Fensholt, R.; et al. China and India lead in greening of the world through land-use management. Nat. Sustain. 2019, 2, 122–129. [Google Scholar] [CrossRef]
- Yang, W.; Pei, J.; Li, X.X.; Sun, T.; Wang, W.Y. Effect evaluation and management strategies for freshwater restoration projects in Yellow River Delta wetlands. J. Beijing Norm. Univ. (Nat. Sci.) 2018, 54, 98–103. [Google Scholar] [CrossRef]
- Sun, Q.L.; Li, B.L.; Xu, L.L.; Tao, Z.; Jinsong, G.; Fei, L. Analysis of NDVI change trend and its impact factors in the Three-River Headwater Region from2000 to 2013. J. Geo-Inf. Sci. 2016, 18, 1707–1716. [Google Scholar] [CrossRef]
- Liu, R.G.; Liu, Y. Generation of new cloud masks from MODIS land surface reflectance products. Remote Sens. Environ. 2013, 133, 21–37. [Google Scholar] [CrossRef]
- Chen, J.M.; Deng, F.; Chen, M. Locally adjusted cubic-spline capping for reconstructing seasonal trajectories of a satellite-derived surface parameter. IEEE Trans. Geosci. Remote Sens. 2006, 44, 2230–2238. [Google Scholar] [CrossRef]
- Liu, R.; Shang, R. Global evaluation of gap-filling approaches for seasonal NDVI with considering vegetation growth trajectory, protection of key point, noise resistance and curve stability. Remote Sens. Environ. 2017, 89, 164–179. [Google Scholar] [CrossRef] [Green Version]
- Ministry of Ecology and Environment, China; Chinese Academy of Sciences. Eco-Environment Investigation and Assessment from 2000 to 2010 with Remote Sensing of China; Science Press: Beijing, China, 2014.
- McNally, A.; Arsenault, K.; Kumar, S.; Shukla, S.; Peterson, P.; Wang, S.; Funk, C.; Peters-Lidard, C.D.; Verdin, J.P. A land data assimilation system for sub-Saharan Africa food and water security applications. Sci. Data 2017, 4, 170012. [Google Scholar] [CrossRef] [PubMed] [Green Version]
- Abatzoglou, J.T.; Dobrowski, S.; Parks, S.A.; Hegewisch, K.C. TerraClimate, a high-resolution global dataset of monthly climate and climatic water balance from 1958–2015. Sci. Data 2018, 5, 170191. [Google Scholar] [CrossRef] [PubMed] [Green Version]
- Mann, H.B. Non-parametric Tests against Trend. Econometrica 1945, 13, 245–259. [Google Scholar] [CrossRef]
- Deng, X.Y.; Liu, Y.; Liu, Z.H.; Yao, J.Q. Temporal-spatial dynamic change characteristics of evapotranspiration in arid region of Northwest China. Acta Ecol. Sin. 2017, 37, 2994–3008. [Google Scholar] [CrossRef] [Green Version]
- Zoungrana, B.J.-B.; Conrad, C.; Thiel, M.; Amekudzi, L.K.; Da, E.D. MODIS NDVI trends and fractional land cover change for improved assessments of vegetation degradation in Burkina Faso, West Africa. J. Arid. Environ. 2018, 153, 66–75. [Google Scholar] [CrossRef]
- Smith, L.C. Trends in Russian Arctic river-ice formation and breakup, 1917 to 1994. Phys. Geogr. 2000, 21, 46–56. [Google Scholar] [CrossRef]
- Wessels, K.J.; Bergh, F.V.D.; Scholes, R.J. Limits to detectability of land degradation by trend analysis of vegetation index data. Remote Sens. Environ. 2012, 125, 10–22. [Google Scholar] [CrossRef]
- Yao, J.; Wang, M.; Huang, Y.C.; Bai, Y.; Huang, S.F. Three-dimensional frame exploration of the ecological protection red line in China: A case study of the Ningde region. Acta Ecol. Sin. 2015, 35, 6848–6856. [Google Scholar] [CrossRef]
- Liu, Y.; Li, D.L.; Yang, T.Z. Study on the Influence of Geographical Indication Cognition on Farmers’ Safe Production- Taking “Luochuan Apple” in Shaanxi as example. Chin. J. Agric. Resour. Reg. Plan. 2021, 42, 209–216. [Google Scholar]
- Zhang, X.B.; Zhang, D.Y.; Shangguan, Z.P.; Mao, N. Temporal variation of driving factors for land desertification in Huan county of Gansu province from 1949 to 2013. J. Arid. Land Resour. Environ. 2016, 30, 130–135. [Google Scholar] [CrossRef]
- Sun, Q.; Zhang, D.S.; Liu, M.; Li, K.K.; Liu, J.H. Research on the Community Characters of Restored Vegetation on Loess Plateau in Huanxian County, Gansu Province. Mod. Landsc. Archit. 2014, 11, 22–30. [Google Scholar]
- Han, J.P. The Difficulty and Countermeasure of the New Round Returning Farmland to Forest in Huanxian County, Gansu. J. Gansu For. Sci. Technol. 2021, 46, 64–66. [Google Scholar] [CrossRef]


| Partial Correlation Analysis | Fractional Vegetation Cover (FVC) | ||||
|---|---|---|---|---|---|
| PCC | Arid | Semi Arid | Semi Humid | Humid | |
| Precipitation | Partial correlation coefficient | 0.532 | 0.649 | 0.258 | 0.504 |
| Significance (bilateral) | 0.019 | 0.003 | 0.25 | 0.028 | |
| Temperature | Partial correlation coefficient | 0.387 | 0.47 | 0.445 | 0.586 |
| Significance (bilateral) | 0.101 | 0.042 | 0.056 | 0.008 | |
| County | Pearson Correlation | Significance | County | Pearson Correlation | Significance |
|---|---|---|---|---|---|
| Huanglong | 0.88 | 0.01 * | Wuqi | 0.925 | 0.01 * |
| Luochuan | 0.95 | 0.01 * | Jingbian | 0.896 | 0.01 * |
| Baishui | 0.66 | 0.01 * | Huan | 0.714 | 0.01 * |
| Chengcheng | 0.56 | 0.05 * | Dingbian | 0.639 | 0.01 * |
| Heyang | 0.62 | 0.01 * |
Publisher’s Note: MDPI stays neutral with regard to jurisdictional claims in published maps and institutional affiliations. |
© 2021 by the authors. Licensee MDPI, Basel, Switzerland. This article is an open access article distributed under the terms and conditions of the Creative Commons Attribution (CC BY) license (https://creativecommons.org/licenses/by/4.0/).
Share and Cite
Shi, P.; Hou, P.; Gao, J.; Wan, H.; Wang, Y.; Sun, C. Spatial-Temporal Variation Characteristics and Influencing Factors of Vegetation in the Yellow River Basin from 2000 to 2019. Atmosphere 2021, 12, 1576. https://0-doi-org.brum.beds.ac.uk/10.3390/atmos12121576
Shi P, Hou P, Gao J, Wan H, Wang Y, Sun C. Spatial-Temporal Variation Characteristics and Influencing Factors of Vegetation in the Yellow River Basin from 2000 to 2019. Atmosphere. 2021; 12(12):1576. https://0-doi-org.brum.beds.ac.uk/10.3390/atmos12121576
Chicago/Turabian StyleShi, Peirong, Peng Hou, Jixi Gao, Huawei Wan, Yongcai Wang, and Chenxi Sun. 2021. "Spatial-Temporal Variation Characteristics and Influencing Factors of Vegetation in the Yellow River Basin from 2000 to 2019" Atmosphere 12, no. 12: 1576. https://0-doi-org.brum.beds.ac.uk/10.3390/atmos12121576