
Contributions of Ammonia to High Concentrations of PM2.5 in an Urban Area
by
 , , ,
, , ,
Junsu Park
1,2 ,
,
Eunhye Kim
3,4,
Sangmin Oh
1,
Haeri Kim
1,
Soontae Kim
3,
Yong Pyo Kim
5 and
Mijung Song
1,6,* 1
Department of Environment and Energy, Jeonbuk National University, Jeonju-si 54896, Jeollabuk-do, Korea
2
Animal Environment Division, National Institute of Animal Science, 1500, WanjuGun 55365, Jeollabuk-do, Korea
3
Department of Environmental Safety and Engineering, Ajou University, Suwon-si 16499, Gyeonggi-do, Korea
4
Emission Inventory Management Team, National Air Emission Inventory and Research Center, Cheongju 28166, Chungcheongbuk-do, Korea
5
Department of Chemical Engineering and Materials Science, System Health & Engineering Major in Graduate School (BK21 Plus Program), Ewha Womans University, Seoul 03760, Korea
6
Department of Earth and Environmental Sciences, Jeonbuk National University, Jeonju-si 54896, Jeollabuk-do, Korea
*
Author to whom correspondence should be addressed.
Atmosphere 2021, 12(12), 1676; https://0-doi-org.brum.beds.ac.uk/10.3390/atmos12121676
Submission received: 19 November 2021
/
Revised: 10 December 2021
/
Accepted: 11 December 2021
/
Published: 14 December 2021
(This article belongs to the Special Issue Ammonia in a Changing Atmosphere)
Abstract
:Atmospheric ammonia (NH3) plays a critical role in PM2.5 pollution. Data on atmospheric NH3 are scanty; thus, the role of NH3 in the formation of ammonium ions (NH4+) in various environments is understudied. Herein, we measured concentrations of NH3, PM2.5, and its water-soluble SO42−, NO3−, and NH4+ ions (SNA) at an urban site in Jeonju, South Korea from May 2019 to April 2020. During the measurement period, the average concentrations of NH3 and PM2.5 were 10.5 ± 4.8 ppb and 24.0 ± 12.8 μg/m3, respectively, and SNA amounted to 4.3 ± 3.1, 4.4 ± 4.9, and 1.6 ± 1.8 μg/m3, respectively. A three-dimensional photochemical model analysis revealed that a major portion of NH3, more than 88%, originated from Korea. The enhancement of the ammonium-to-total ratio of NH3, NHX (NHR = [NH4+]/[NH4+] + [NH3]) was observed up to ~0.61 during the increase of PM2.5 concentration (PM2.5 ≥ 25 μg/m3) under low temperature and high relative humidity conditions, particularly in winter. The PM2.5 and SNA concentrations increased exponentially as NHR increased, indicating that NH3 contributed significantly to SNA formation by gas-to-particle conversion. Our study provided experimental evidence that atmospheric NH3 in the urban area significantly contributed to SNA formation through gas-to-particle conversion during PM2.5 pollution episodes.
1. Introduction
Global emissions of NH3 have annually increased from an estimated 1.9 Tg in the 1960s to 16.7 Tg in 2010 [1]. Reports have indicated that the main source of atmospheric NH3 at the global scale is agricultural activities involving livestock, fertilizers, soil, and crops [2,3,4,5]; these activities accounted for approximately 60% of the total NH3 emitted from Asia in the 2000s [1]. NH3 is important because it can contribute to the acidification of ecosystems [6,7]. Moreover, it plays a critical role in chemical reactions in the atmosphere, where its conversion to particulate ammonium can lead to high concentrations of particulate matter [8,9,10,11,12,13,14]. These particulate ammonium can influence air quality, visibility, and human health [15,16,17].
Field measurements have shown that concentrations of atmospheric NH3 generally vary depending on the season and location [9,18,19,20,21,22,23,24,25,26,27]. NH3 concentrations are temperature-dependent; they increase in summer and decrease in winter [9,20]. For example, an average ambient NH3 concentration of ~36.2 ppb, with variations ranging from ~73.9 ppb in July to ~13.5 ppb in September, was detected in the Northern Plains of China in 2013 [8]. Only a few studies have been conducted in Korea, which showed the average NH3 concentration in Seoul of ~6.0 ppb from 1996 to 1997 and ~11.0 ppb from 2010 to 2011 [23,27], and 10.5 ppb in Jeon-ju from 2019 to 2020, with higher concentrations occurring during the summer [19].
NH3 in the atmosphere can react with acidic species, such as sulfuric acid (H2SO4), nitric acid (HNO3), and hydrochloric acid (HCl), which lead to the production of secondary inorganic aerosols (SIAs) including ammonium sulfate ((NH4)2SO4), ammonium nitrate (NH4NO3), and ammonium chloride (NH4Cl) [28,29]. Previous studies have shown that these SIAs can account for up to ~70% of the mass of PM2.5, depending on the location and season [30,31,32,33,34]. Moreover, recent studies have shown that high conversion ratios of ammonium from the gas to particle phase can significantly promote high PM2.5 concentration [8,9,25,35,36,37,38,39]. In rural areas of Shanghai, China, PM2.5 concentrations were found to be influenced by secondary NH4+ from NH3 at a conversion ratio of up to ~0.8 during periods of high PM2.5 pollution in October 2013 [9]. In Delhi, India, the conversion ratio from NH3 to NH4+ increased up to ~0.6 during PM2.5 pollution episodes from 2013 to 2015 [36]. Increases of SIAs following increasing water content of aerosols result in various aqueous phase reactions and high concentration of PM2.5 [40,41,42]. Although atmospheric NH3 is one of the key species for the formation of SIAs, which cause aerosol pollution, studies on evaluations of the impacts of NH3 on the formation of PM2.5 are still limited. In addition, characteristics of atmospheric NH3 and its impact on PM2.5 pollution are scarce in urban areas
In this study, atmospheric NH3 and water-soluble ions, including SO42−, NO3−, and NH4+ (SNA) concentrations were measured over one year from May 2019 to April 2020 in an urban area, Samcheon-dong, Jeonju, South Korea. Using the dataset, we explored how the ambient NH3 contributes to high concentrations of PM2.5. Moreover, we applied a three-dimensional photochemical model to identify the origin of the ambient NH3. Altogether, our results provide a more comprehensive understanding of the gas-to-particle conversion process in the atmosphere and the role of NH3 in the formation of aerosol pollution.
2. Materials and Methods
2.1. Monitoring Site
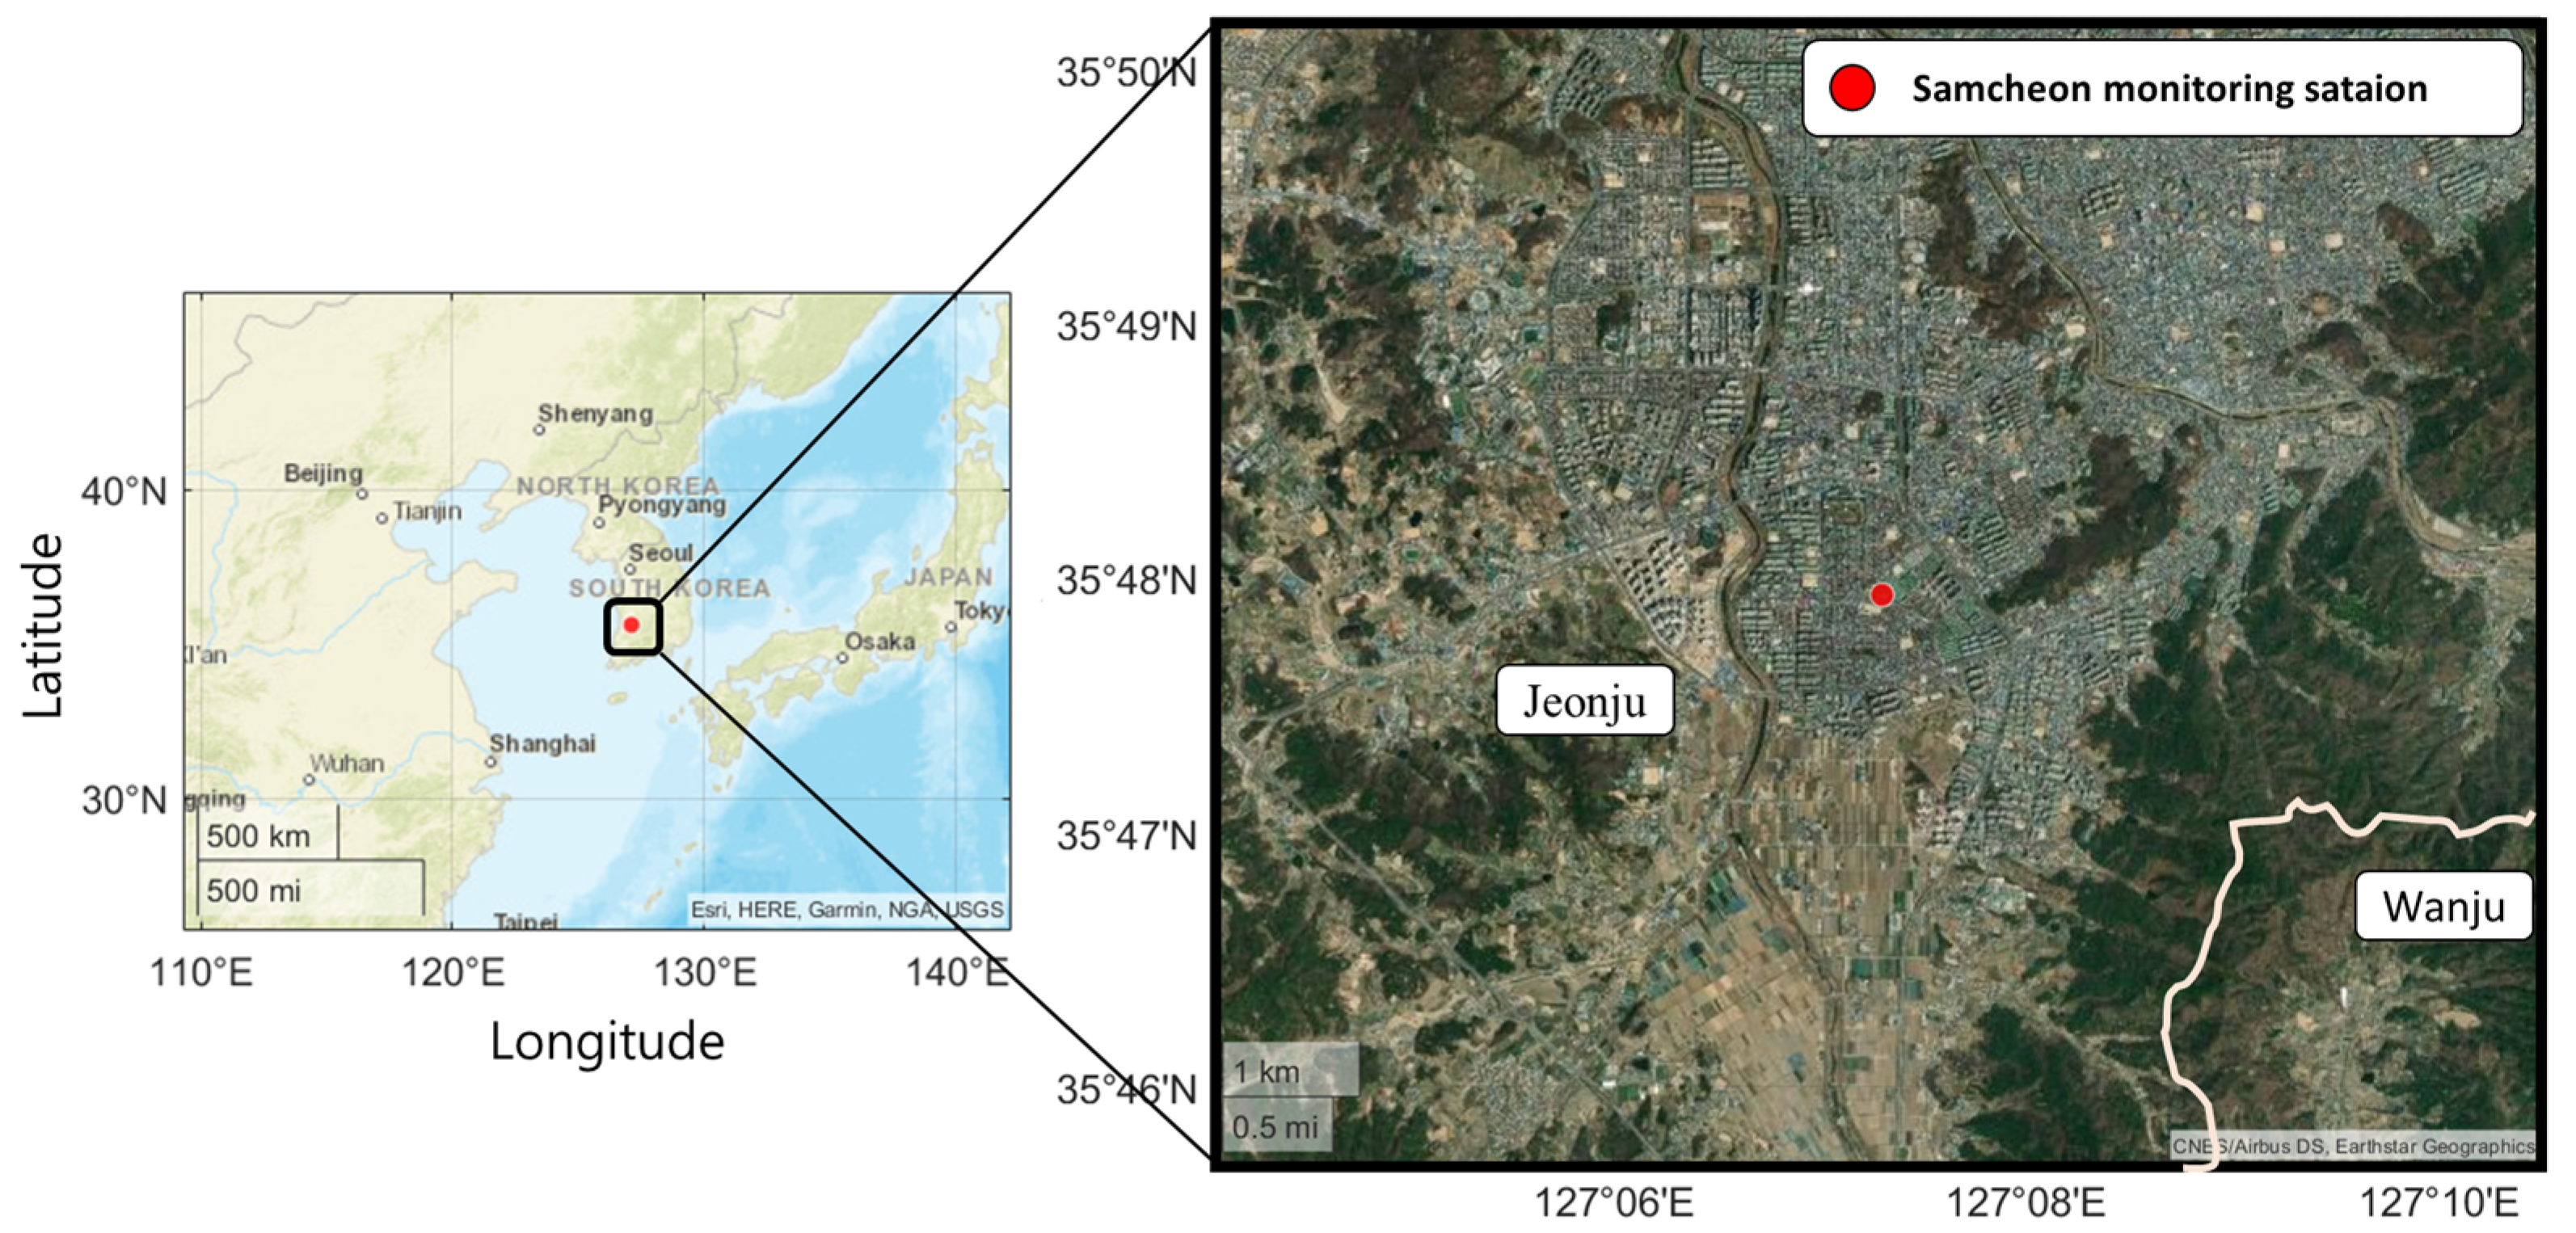
The concentrations of NH3 and SIAs in PM2.5 were measured from 4 May 2019 to 15 April 2020 at a monitoring station in Samchon-dong, Jeonju, Jeollabuk-do, South Korea (35°47′56.4’’ N, 127°7′19.2’’ E) (Figure 1). The monitoring site can be considered as a representative urban site for Jeollabuk-do because the area is surrounded by residential clusters, business buildings, and roads. It is located ~50 km from agricultural areas consisting of large- and small-scale livestock farms (pigs, cows, and chickens) and other types of farmlands, ~75 km from the Yellow Sea, ~190 km from Busan, and ~200 km from Seoul.
2.2. Measurements
The method of NH3 measurements has been previously described by Park et al. [19]. Briefly, atmospheric NH3 concentrations were measured with cavity ring-down spectroscopy (CRDS) (Picarro Inc., model G2103, Santa Clara, CA, USA) on a 1 s basis from 4 May 2019 to 15 April 2020, and the 1-h-averaged data were used for the analyses. The NH3 analyzer has an average precision of 0.03 ppb for 300 s, with a response time of less than 1 s and a detection limit below 0.09 ppb [43]. Additionally, the analyzer has a low drift value of 0.15 ppb over 72 h [43]. Theoretically, atmospheric NH3 absorbs light of a characteristic wavelength from within the cavity; when the laser is turned off, the concentration can be calculated using the attenuation curves that disappear. No additional external calibration is required, according to the manual for the Model G-2103 CRDS analyzer [44]. However, in this study, calibration was conducted to confirm the performance of the analyzer by using a mixture of standard NH3 (11.9 ppm, Airkorea, Korea) and N2 gas. The calibration was repeated three times with four points at 25, 20, 15, and 5 ppb, and the resulting R2 was 0.997 (Figure S1). During the measurement period, perfluoroalkoxy (PFA) tubing (internal diameter 4 mm) was used for the inlet, and the inlet length was as short as possible (~1.5 m) to limit the residence time to shorter than 1 s during the measurement period [8].
PM2.5 was collected on Teflon filters (PTFE, R2PJ047, PALL, New York, USA) over a 24-h period from 09:00 am to 09:00 am at a flow rate of 16.67 L/min using a sequential low volume sampler (APM, PMS-104, Bucheon, Korea) at the monitoring site. A total of 118 PM2.5 filters were collected during the measurement period (Table S1). The mass concentration of PM2.5 was determined using the method recommended by the USA. Environmental Protection Agency (EPA) (Compendium of Methods for the Determination of Inorganic Compounds in Ambient Air, Methods), (EPA, https://www.epa.gov) (accessed on 15 September 2021). The concentrations of ion species such as NO3−, SO42−, and NH4+, as well as minor ions in the PM2.5, were analyzed by ion chromatography (AQUION, Thermo Scientific, Massachusetts, USA).
Hourly averaged meteorological parameters of temperature, relative humidity (RH), wind speed, and wind direction were collected from the Jeollabuk-do Institute of Health and Environment Research. The hourly average temperature during the measurement period was 13.6 ± 9.5 °C, and the relative humidity was 67.6 ± 18.6%. To reduce the uncertainties from measurements and instruments during high-precipitation events [45,46], data were excluded from the analyses when the hourly amount of precipitation exceeded 5 mm. These excluded data (~10.5% of the original measured NH3 data) were mostly from July-August and September (~10.3% of the original measured NH3 data) due to the monsoon and frequent occurrence of typhoons, respectively.
2.3. Modelling
Identifying the origins of the NH3 is challenging because the airborne NH3 concentration is affected by various physical and chemical processes, including emission, transport, deposition, and chemical transformation. In this study, we simulated NH3 and NH4+ concentrations in Northeast Asia using the community multiscale air quality (CMAQ) model version 4.7.1 [47]. It is a three-dimensional photochemical model. To operate CMAQ, the meteorological inputs were prepared using Weather Research and Forecasting (WRF) version 3.5.1 [48] with final operational global analysis data. The Sparse Matrix Operator Kernel Emission (SMOKE; version 3.1) [49] was applied to process the KORUSv5 emissions inventory [50,51] for regional emissions, excluding South Korea. For South Korea, CAPSS 2016, developed and released by the National Air Emission Inventory and Research Center (NAIR), was utilized [52].
In the WRF-SMOKE-CMAQ simulation, the brute force method (BFM) was applied to identify the relative contribution of NH3 and NH4+ from China and South Korea to the downwind area. The BFM estimates the sensitivity of pollutant concentrations to change in targeted emissions [53]. Kim et al. [54] showed that the estimated contributions using BFM with different emission perturbation regions or rates were not identical, showing non-linearity of responses. Considering that a 100% emission reduction for a region may severely change the chemical condition, in this study, we calculated the sensitivity of NHx (total ammonia; [NH4+] + [NH3]) concentrations in South Korea to Chinese NH3 emissions through 50% reduced Chinese NH3 emissions using Equation (1) [55]. The emission perturbation rate has been used in previous air quality modeling studies over the region [56,57,58]. We assumed that the change of NHx concentrations in South Korea to the NH3 emission perturbations in China shows a low nonlinear response based on a previous NH3 sensitivity conducted by Kim et al. [55].
where is the NH3 (or NHx) concentration simulated using the base run, Cc,50% is the NH3 (or NHx) concentration simulated using a 50% reduction in Chinese NH3 emissions, and is the emission perturbation rate (0.5 in this study). Then, the zero-out contribution (ZOC) of Chinese NH3 emissions to NH3 concentrations in South Korea was calculated by dividing the NH3 sensitivity by the perturbation rate (0.5 in this study) [56,58] as shown in Equation (2). Additionally, the difference between the NH3 concentration in the base run and the ZOC of Chinese NH3 in the downwind area was considered as the ZOC of South Korea.
Sensitivity (μg/m3) = CB − CC,50%
3. Results and Discussion
3.1. Characteristics of Atmospheric NH3 in Urban Area
During the entire measurement period at the urban site, the hourly averaged concentration of atmospheric NH3 was 10.5 ± 4.8 ppb, ranging from 2.0 ppb to 54.5 ppb. These atmospheric NH3 concentrations are comparable to those measured in other regions (Table 1). The NH3 level in Jeonju was similar in Seoul in 2010–2011 [23], which was higher than that of the Shanghai urban area in China in 2013 [9]. Moreover, the NH3 concentration in Jeonju was higher than that of Osaka, Japan, and Ho Chi Minh, Vietnam in 2015, also in Asia [22]. Further, the NH3 concentration in the urban area was up to 3–4 times higher than that of North America and Europe (Table 1) [24,25,59].
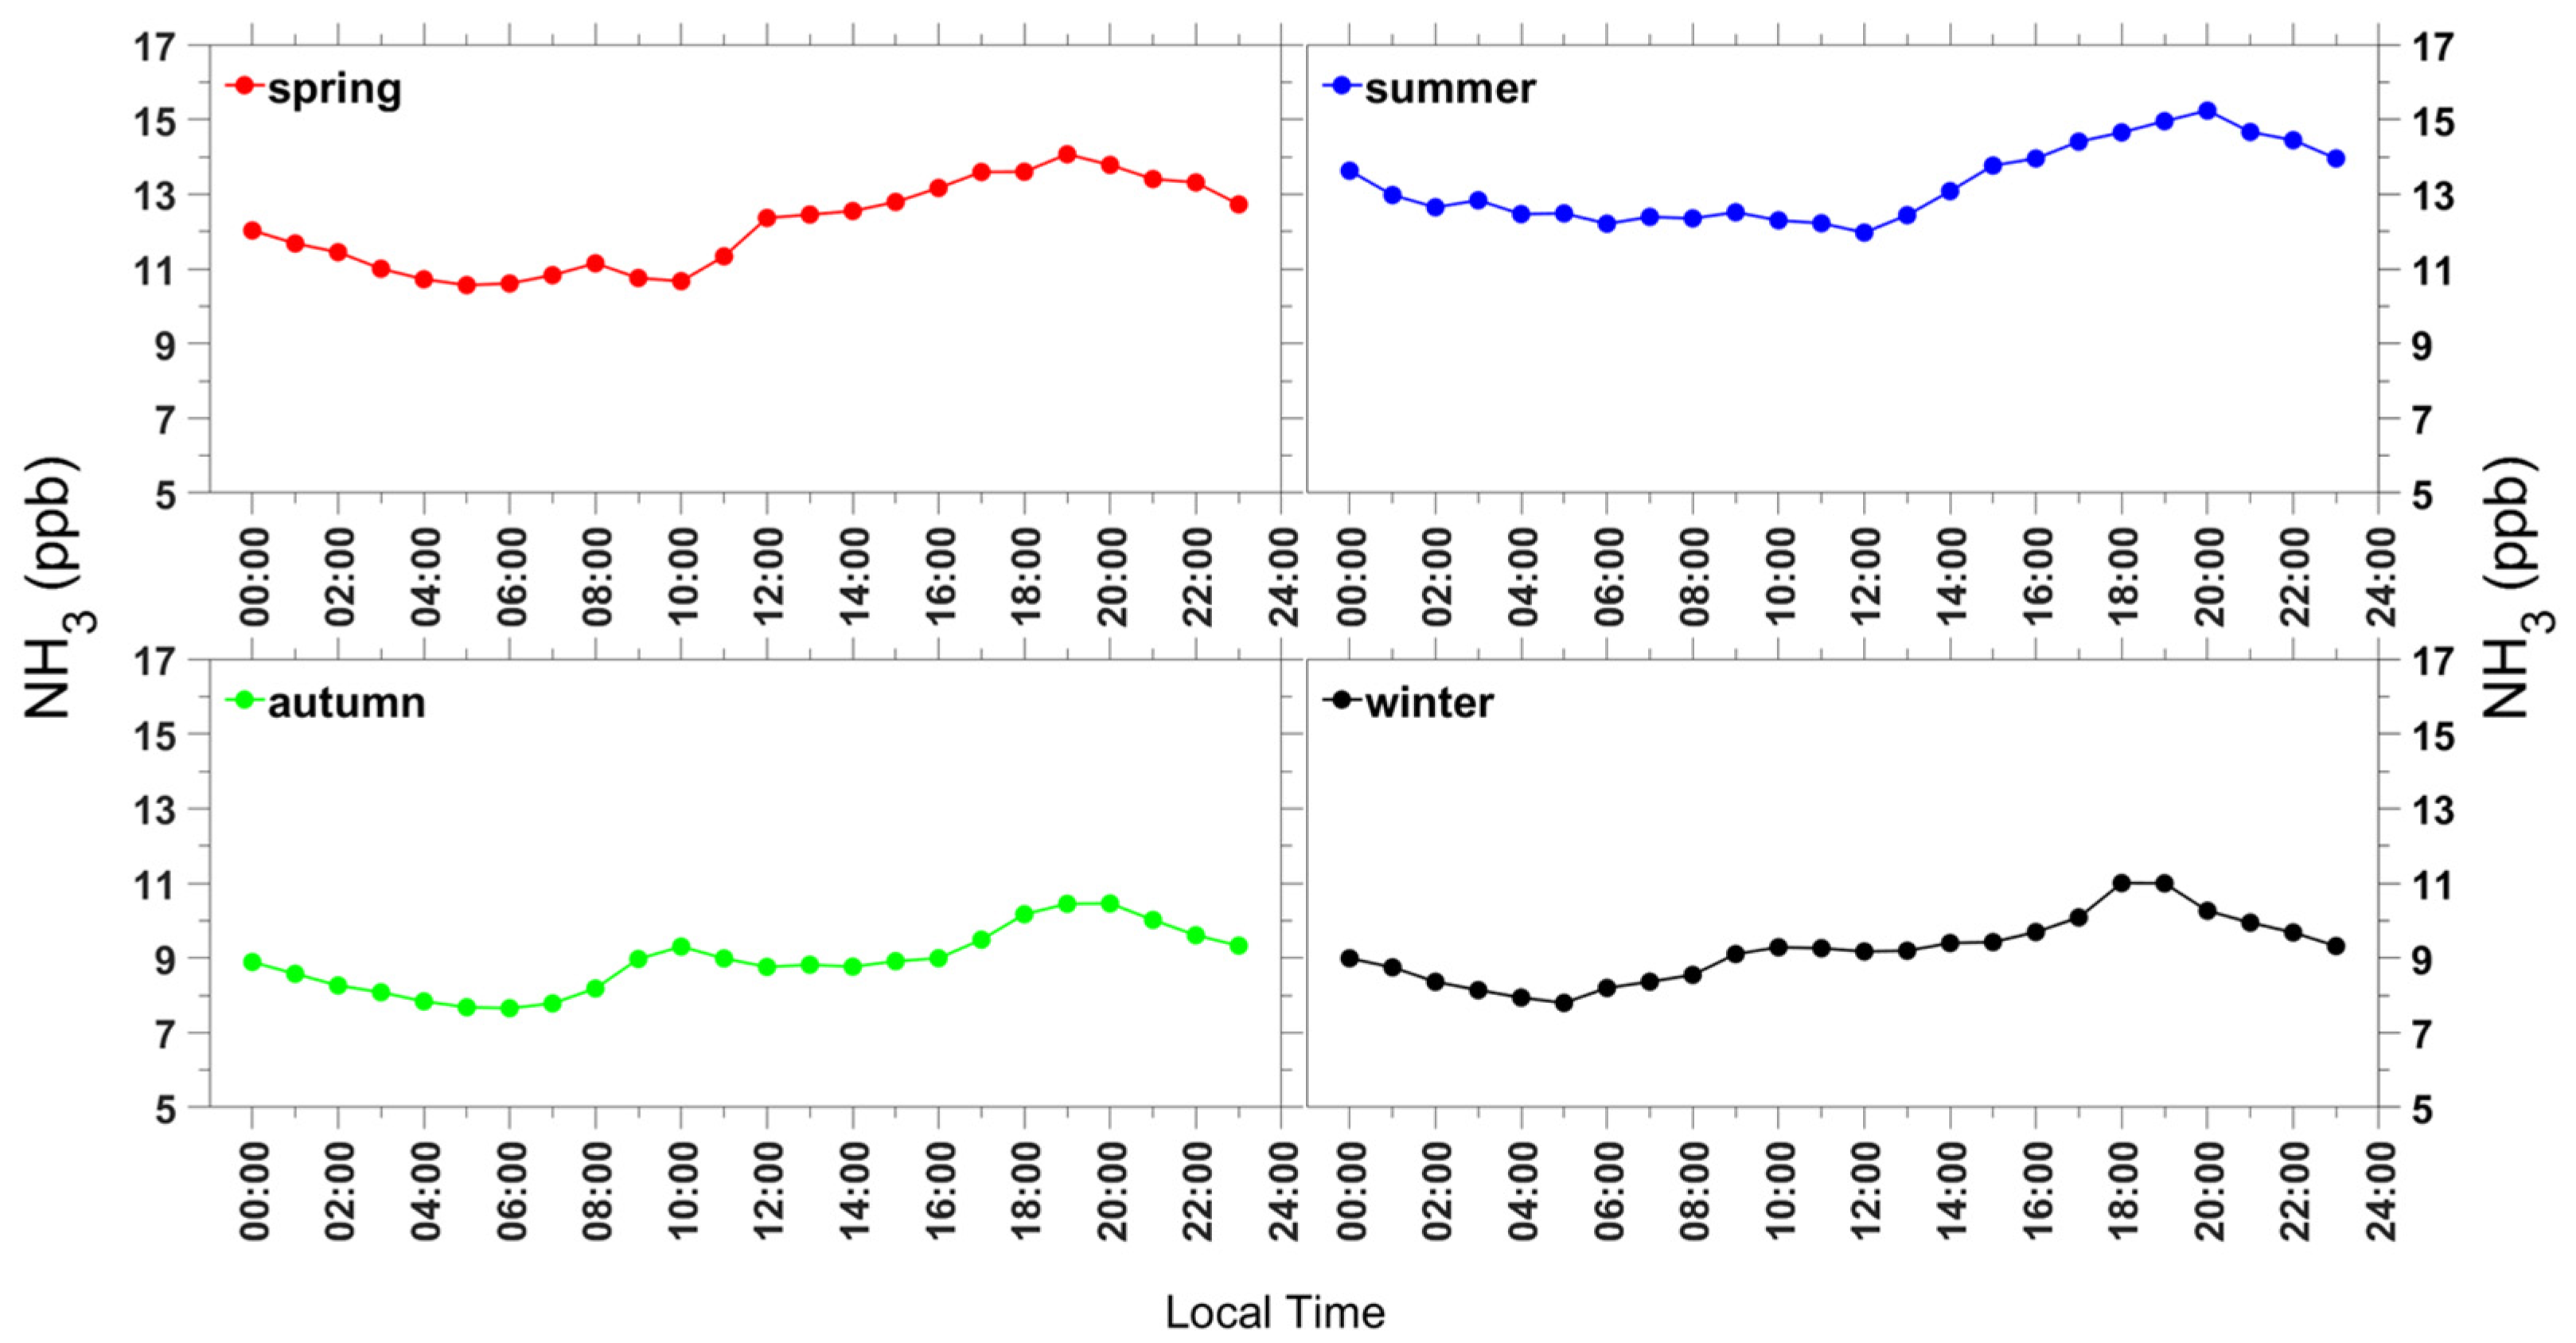
Shown in Figure 2 is the seasonal diurnal variation of the atmospheric NH3 observed at the urban site. In spring and summer, the diurnal variation of the ambient NH3 concentration was low, from 00:00 to 12:00 local time, and then the concentration increased and reached a maximum concentration of more than ~14 ppb at 20:00. Previous studies reported that such variations, with high concentrations observed in late afternoon, are caused by NH3 transport to urban area from the vicinity of rural areas by agricultural sources, expansion of a planetary boundary layer, and wind directions [60,61]. This could explain the high concentration in the study site, which is surrounded by agricultural lands (rice fields, and large and small livestock farms) ~10 km to the west and southwest (Figure S2). A recent study simultaneously measured atmospheric NH3 concentration from rural and urban areas, which are close to the present study site, and showed that the NH3 concentrations at both sites (rural and urban areas) were significantly higher in summer, particularly in June, than in other seasons [62]. When the highest atmospheric NH3 concentrations occurred in June in the urban area, elevated NH3 concentrations were also observed in the adjacent rural area [62]. They suggested that the enhanced ambient NH3 concentrations observed in the urban area were influenced by high NH3 concentrations from the rural area located to the west [62]. Contrastingly, bimodal peaks in the morning and late afternoon determined in autumn and winter were likely due to the impact of traffic in the urban areas.
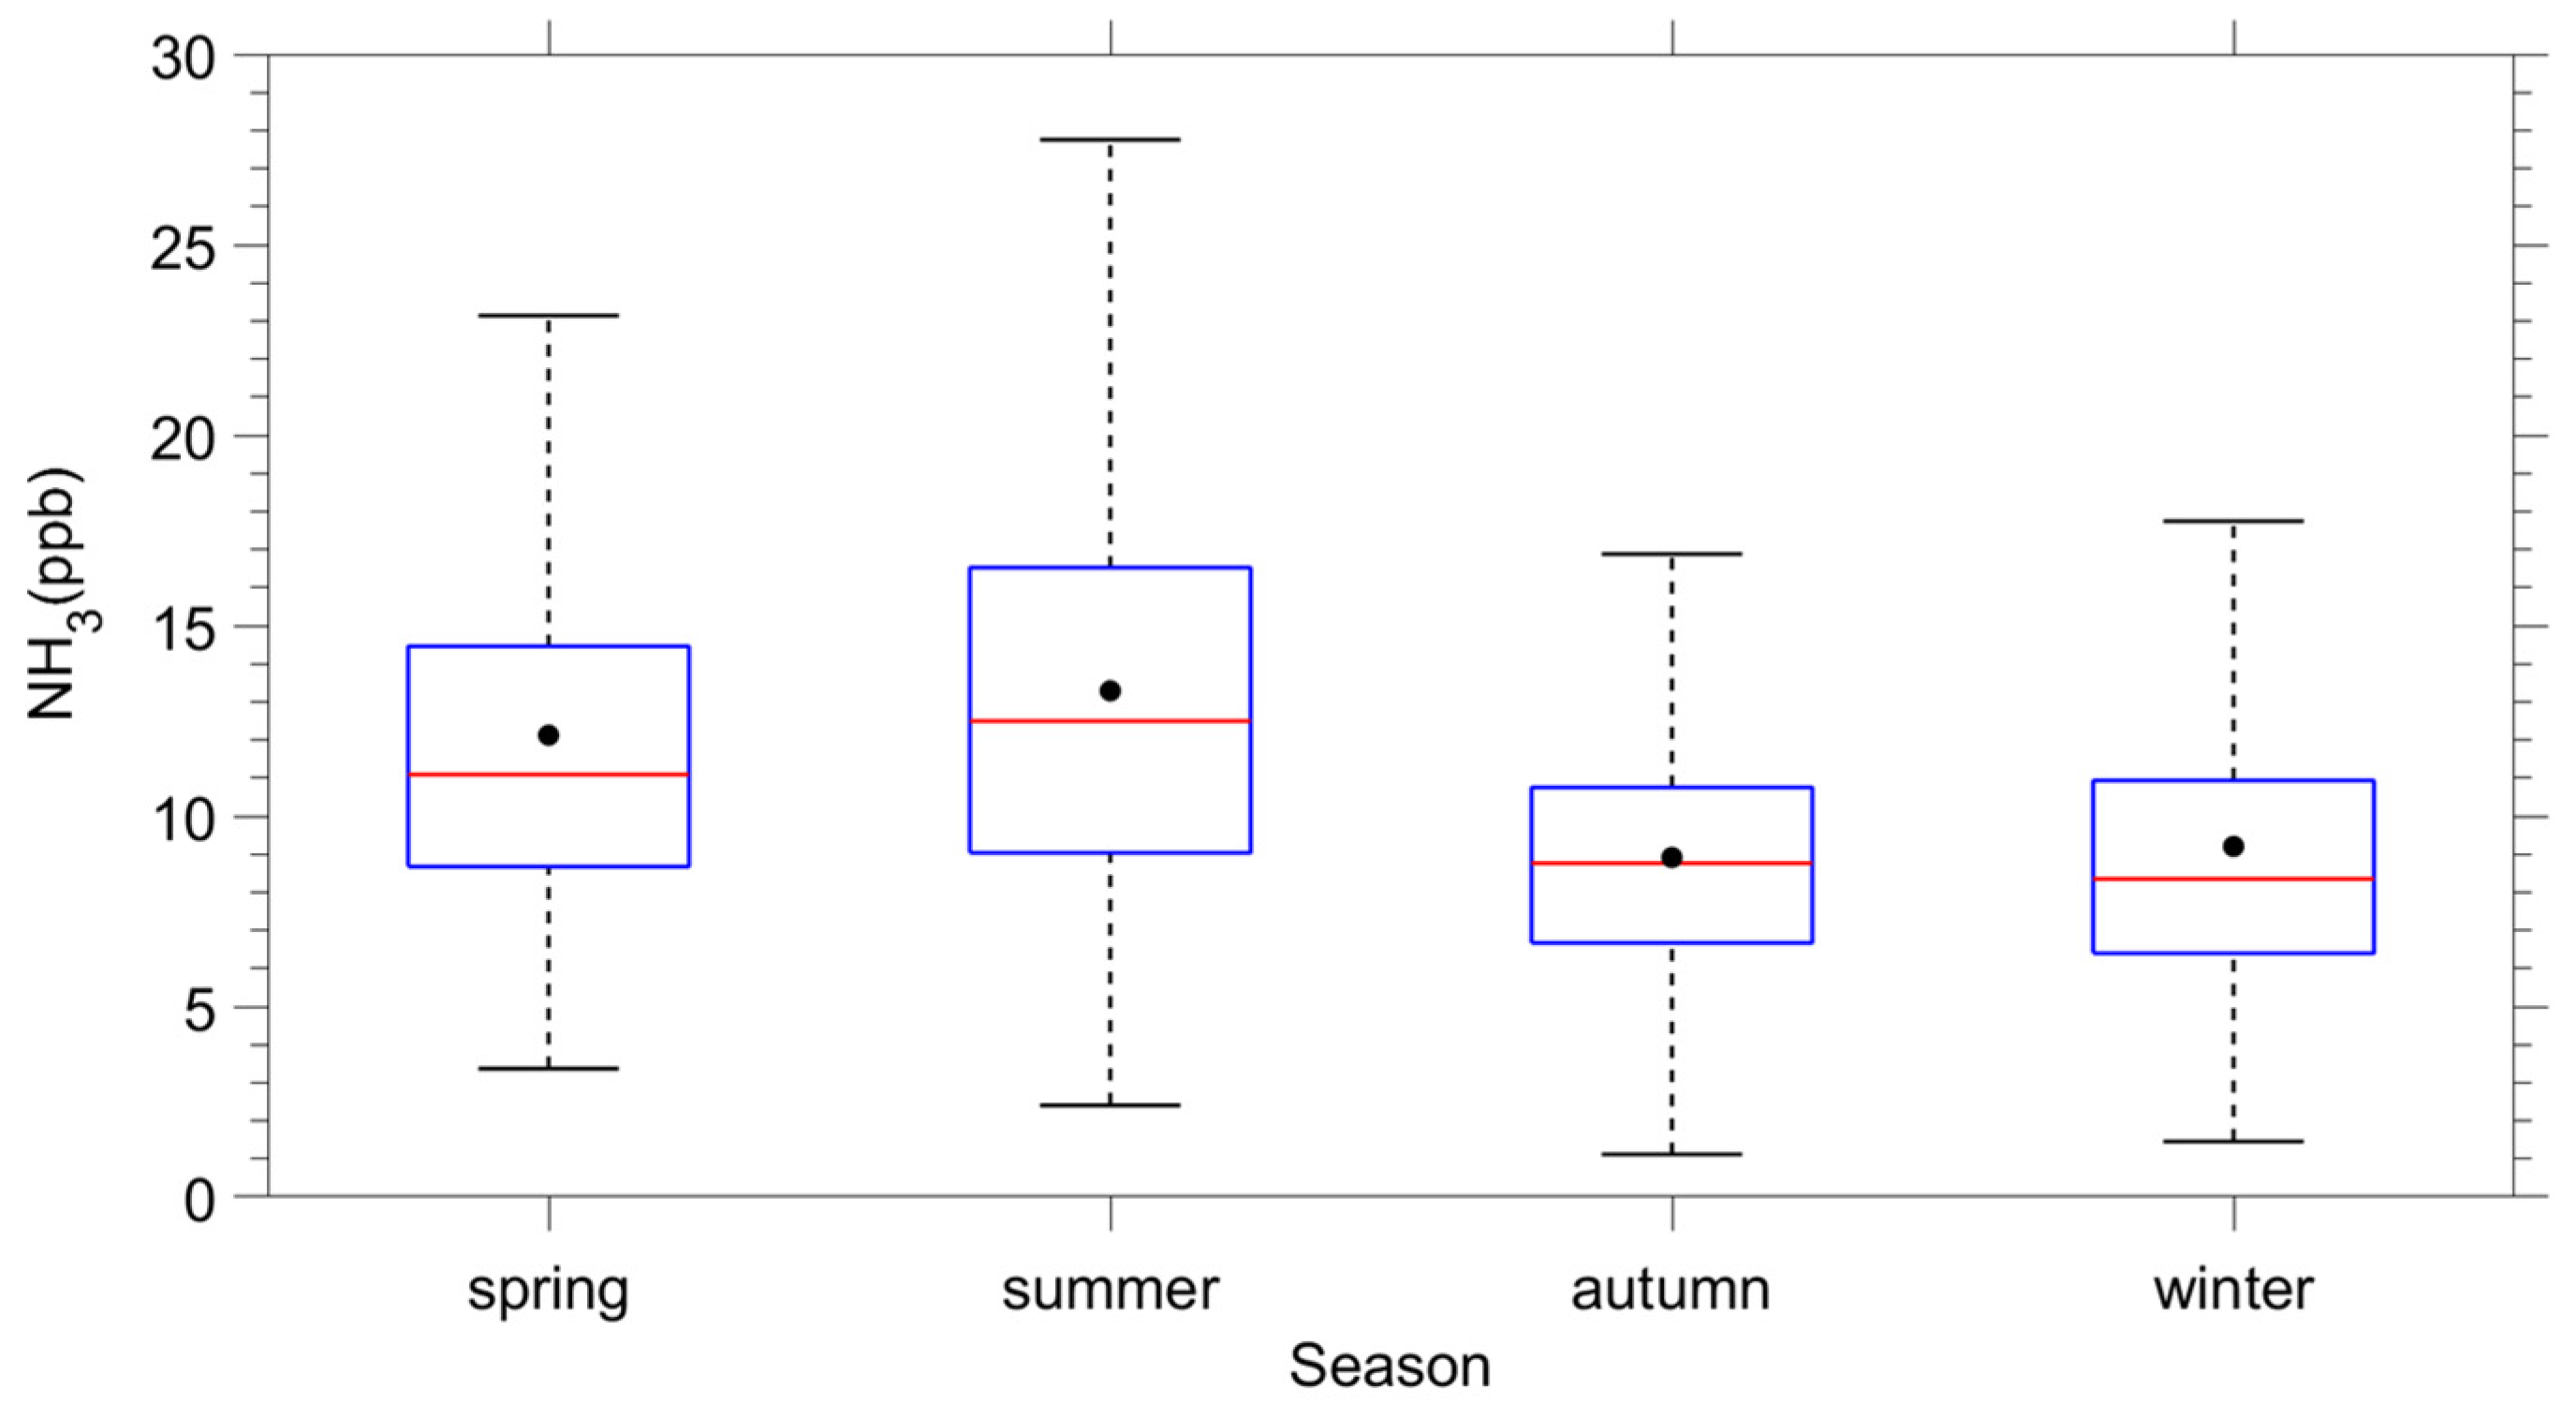
Seasonally, the NH3 concentration in Jeonju was observed as follows: summer (13.3 ± 5.8 ppb) > spring (12.1 ± 5.1 ppb) > winter (9.2 ± 4.3 ppb) > autumn (8.9 ± 3.1 ppb) (Figure 3). In this study, the NH3 concentration showed a strong correlation with ambient temperature (Figure S3). The atmospheric NH3 concentration in the urban site was enhanced as temperature was increased, which is consistent with previous studies [8,9,19,20,37,38,62]. However, the concentrations decreased when the temperature was above 30 °C (Figure S3), because of the wet deposition and removal effects that occur in monsoon (Figure S4) [9,19,36].
3.2. Contribution of NH3 to PM2.5 Pollution
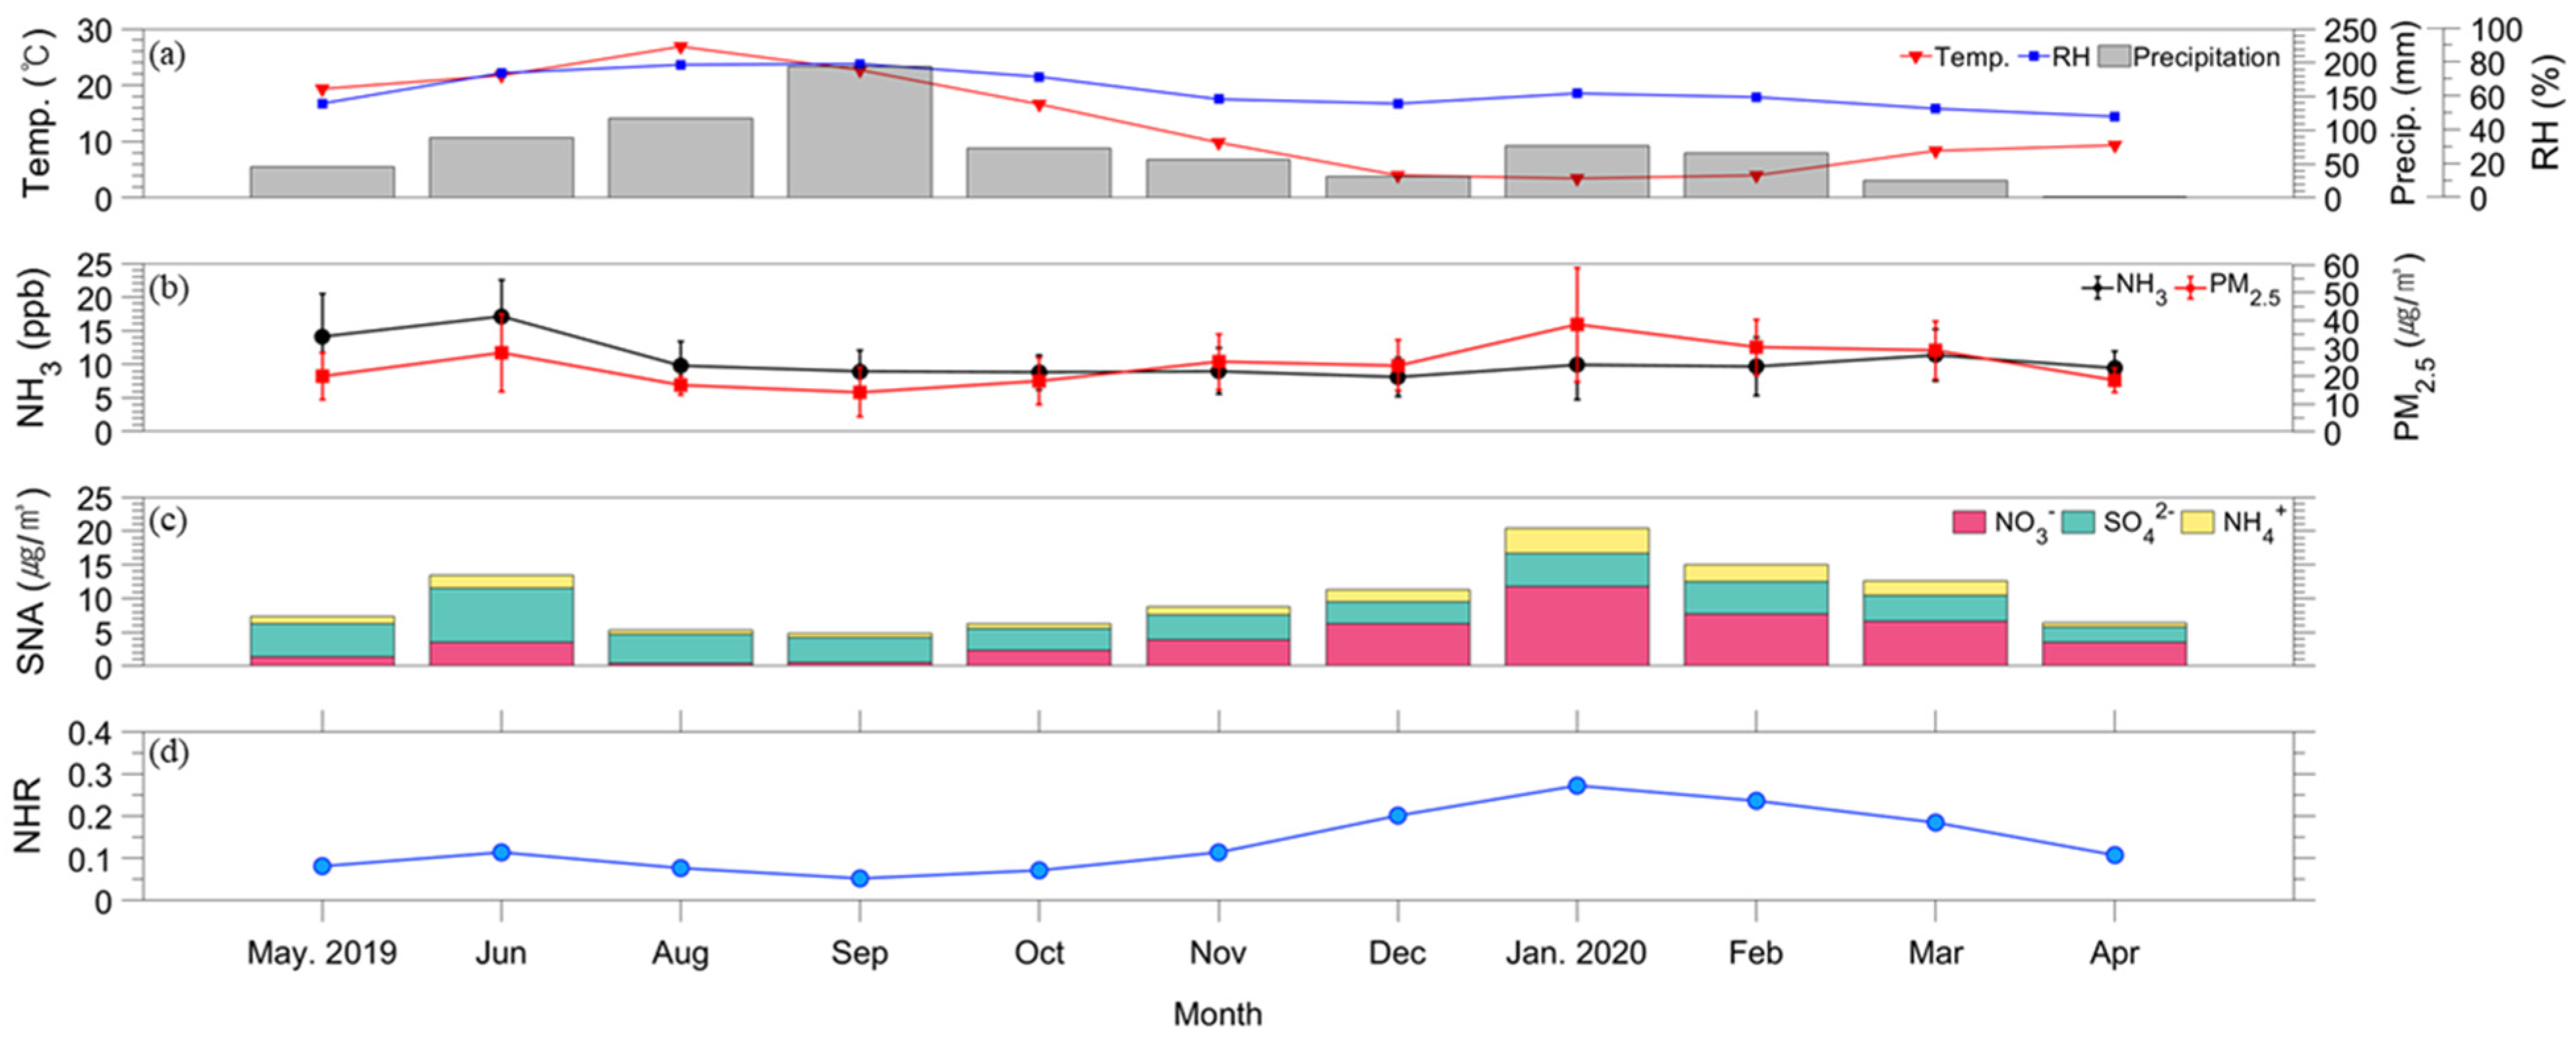
To explore the effects of NH3 on aerosol pollution, which have never been studied in Korea through field measurements, we measured PM2.5 and its water-soluble ions, and investigated how NH3 contributes to NH4+ formation and the production of PM2.5. Throughout the measurement period, the monthly average PM2.5 concentration was 24.0 ± 12.8 μg/m3, and NO3− was the most abundant (4.4 ± 4.9 μg/m3), followed by SO42− (4.3 ± 3.1 μg/m3) and NH4+ (1.6 ± 1.8 μg/m3) in the PM2.5 (Figure 4b,c, Table S1). The NO3− in the PM2.5 was significantly enhanced in winter time. Previous studies also reported that PM2.5 concentrations were elevated, particularly in winter, with a remarkable increase in the NO3− concentrations at the measurement site during winter [63,64,65,66]. In particular, in January, high concentrations of PM2.5 were observed, with a monthly average of 38.1 ± 20.3 μg/m3 (Table S1), and an average NO3− concentration of 11.8 μg/m3 (Figure S5).
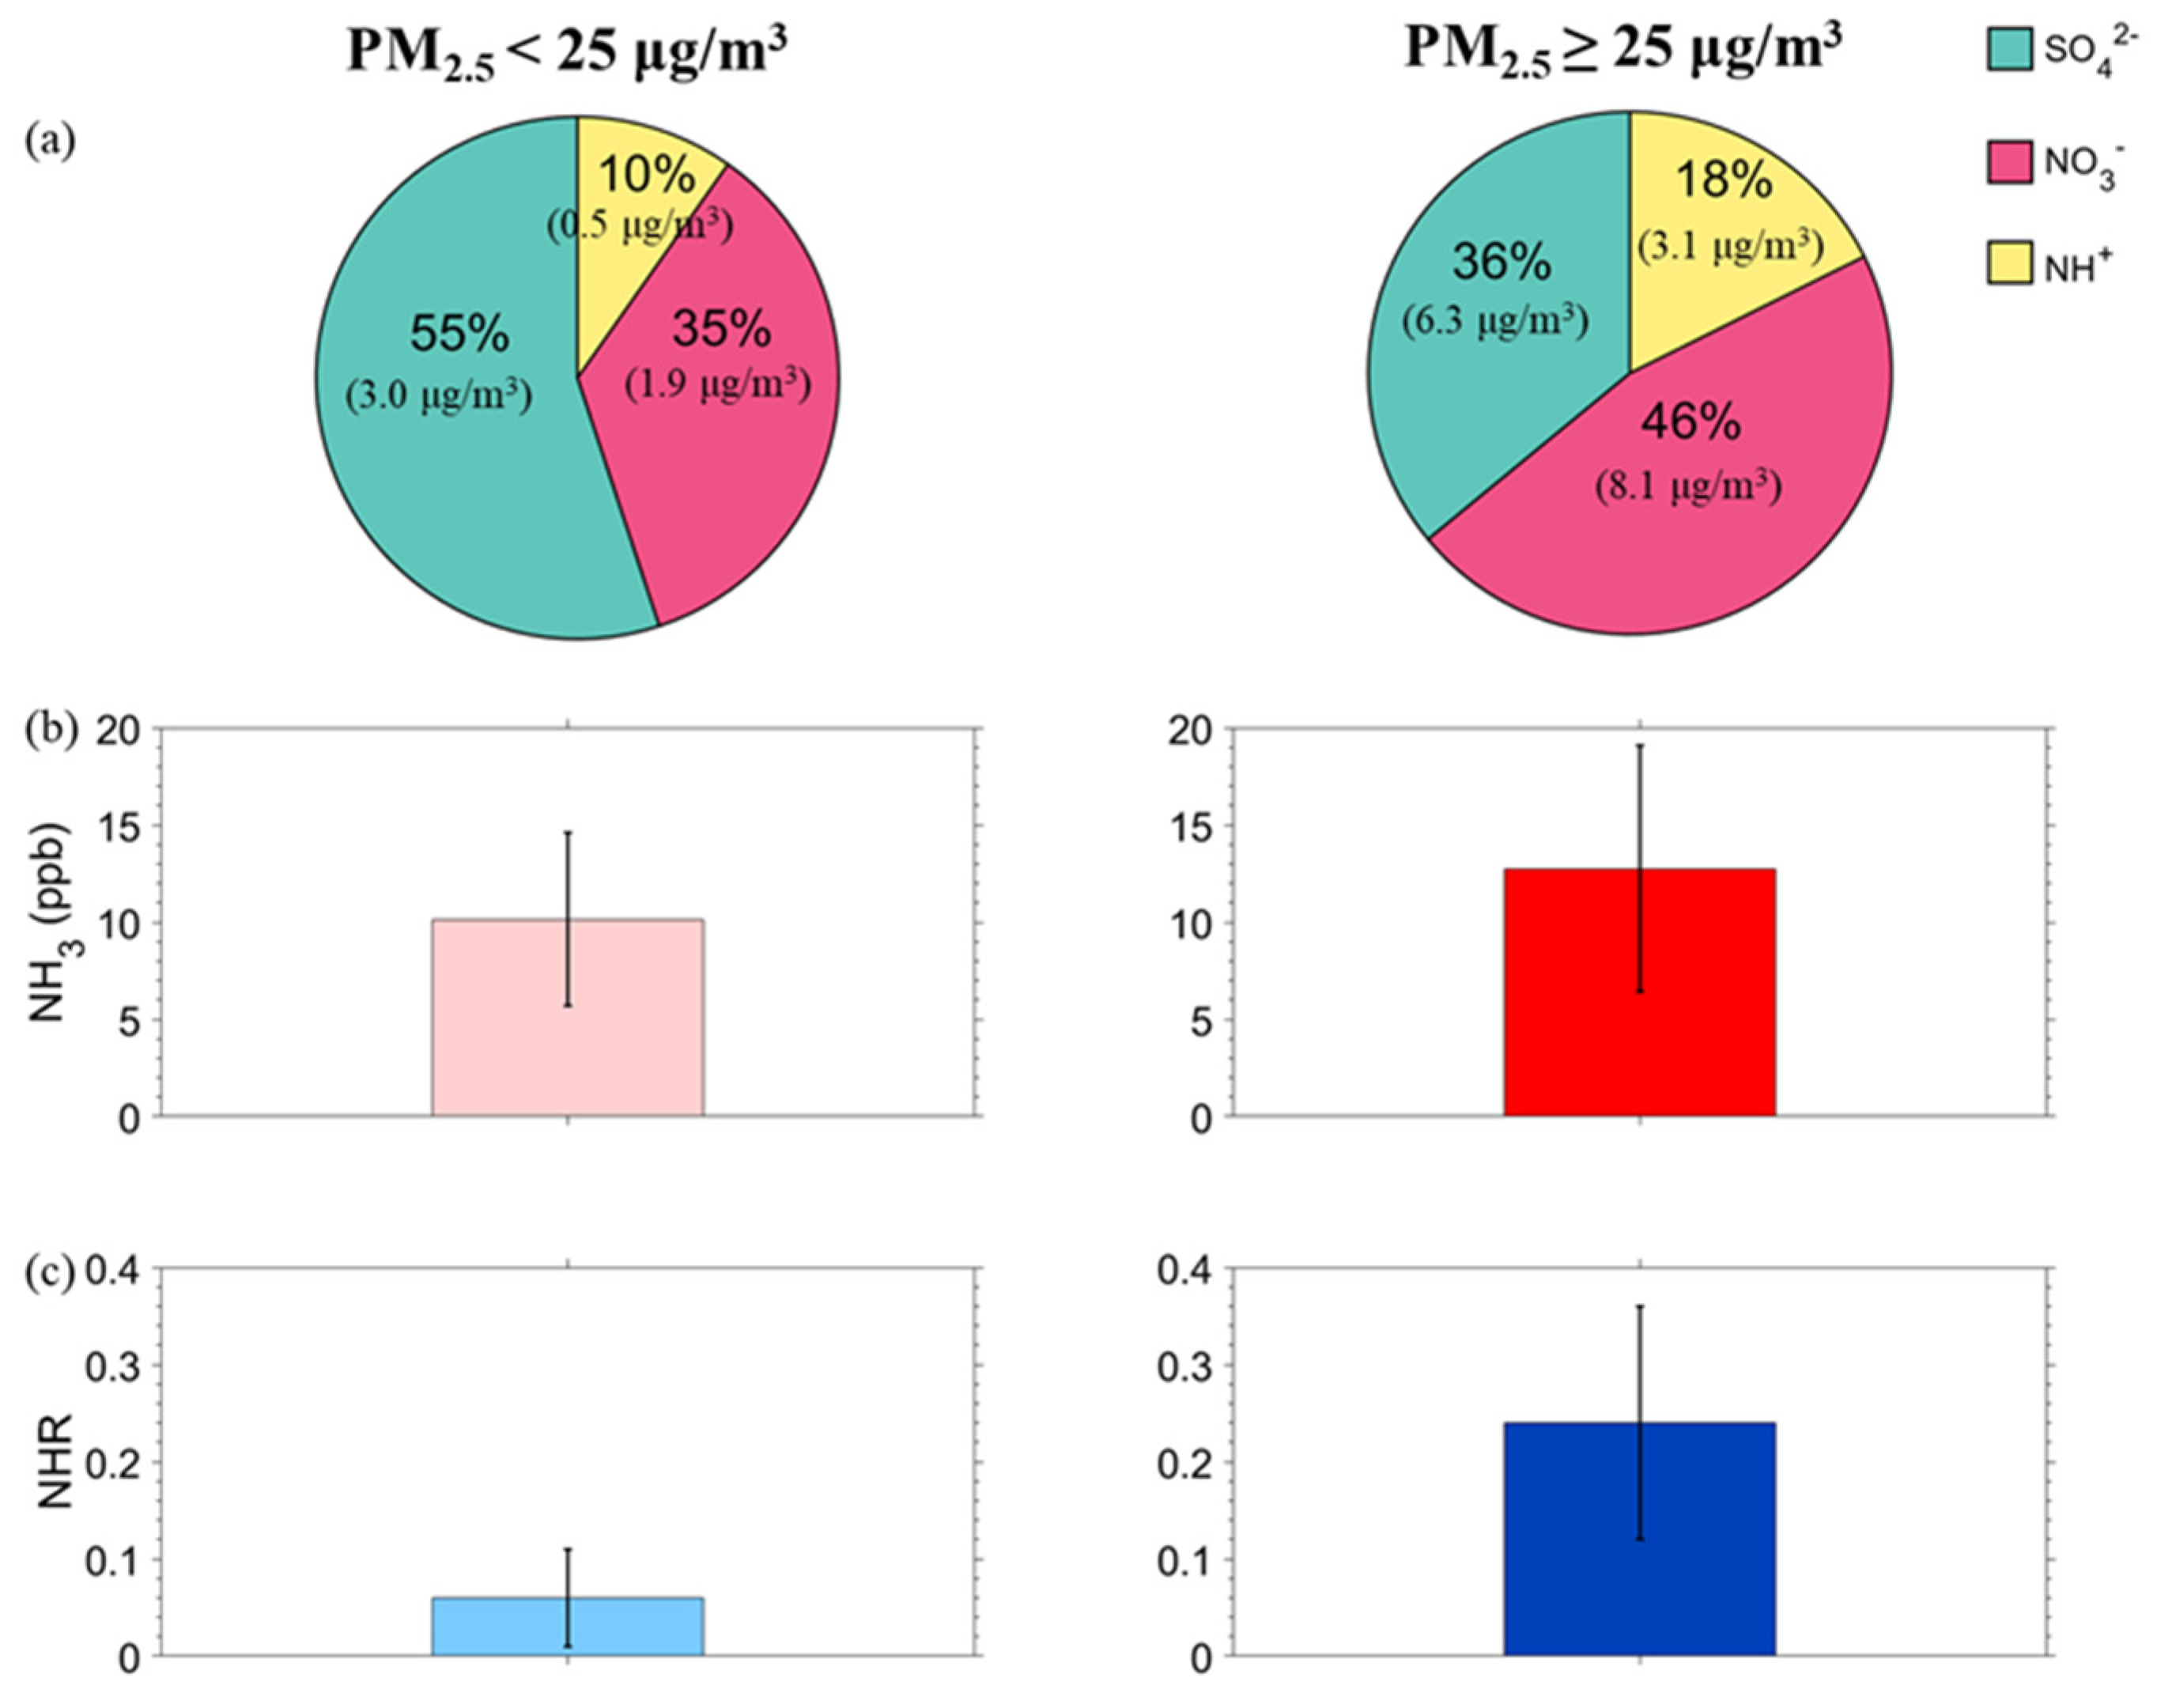
In this study, PM2.5 pollution was defined as a daily average of PM2.5 ≥ 25 μg/m3, based on the daily mean PM2.5 guideline value recommended by the World Health Organization [67]. During the entire period, 47 d (spring: 13 d, summer: 6 d, autumn: 10 d, and winter: 18 d) out of a total of 118 d showed PM2.5 pollution. Figure 5 presents a comparison of the SNA concentrations, NH3, and the ratio of NH4+ to total ammonia, NHx (where NHR = [NH4+]/([NH4+] + [NH3])) [68], for clean days (PM2.5 < 25 μg/m3) versus polluted days (PM2.5 ≥ 25 μg/m3). On the polluted days, the NO3− and NH4+ mass fraction significantly increased to 46% and 18%, respectively, while the SO42− fraction was reduced to 36% in the SNA fraction (Figure 5a). The NH3 concentration was slightly higher (12.6 ppb) during PM2.5 pollution than during clean days (10.7 ppb) (Figure 5b). Moreover, on the PM2.5 pollution, the daily average NHR increased dramatically to 0.24 (Figure 5c), with a maximum daily ratio of 0.61 in January (Figure S5). It was comparable with the NHR of only 0.06 during the clean days.
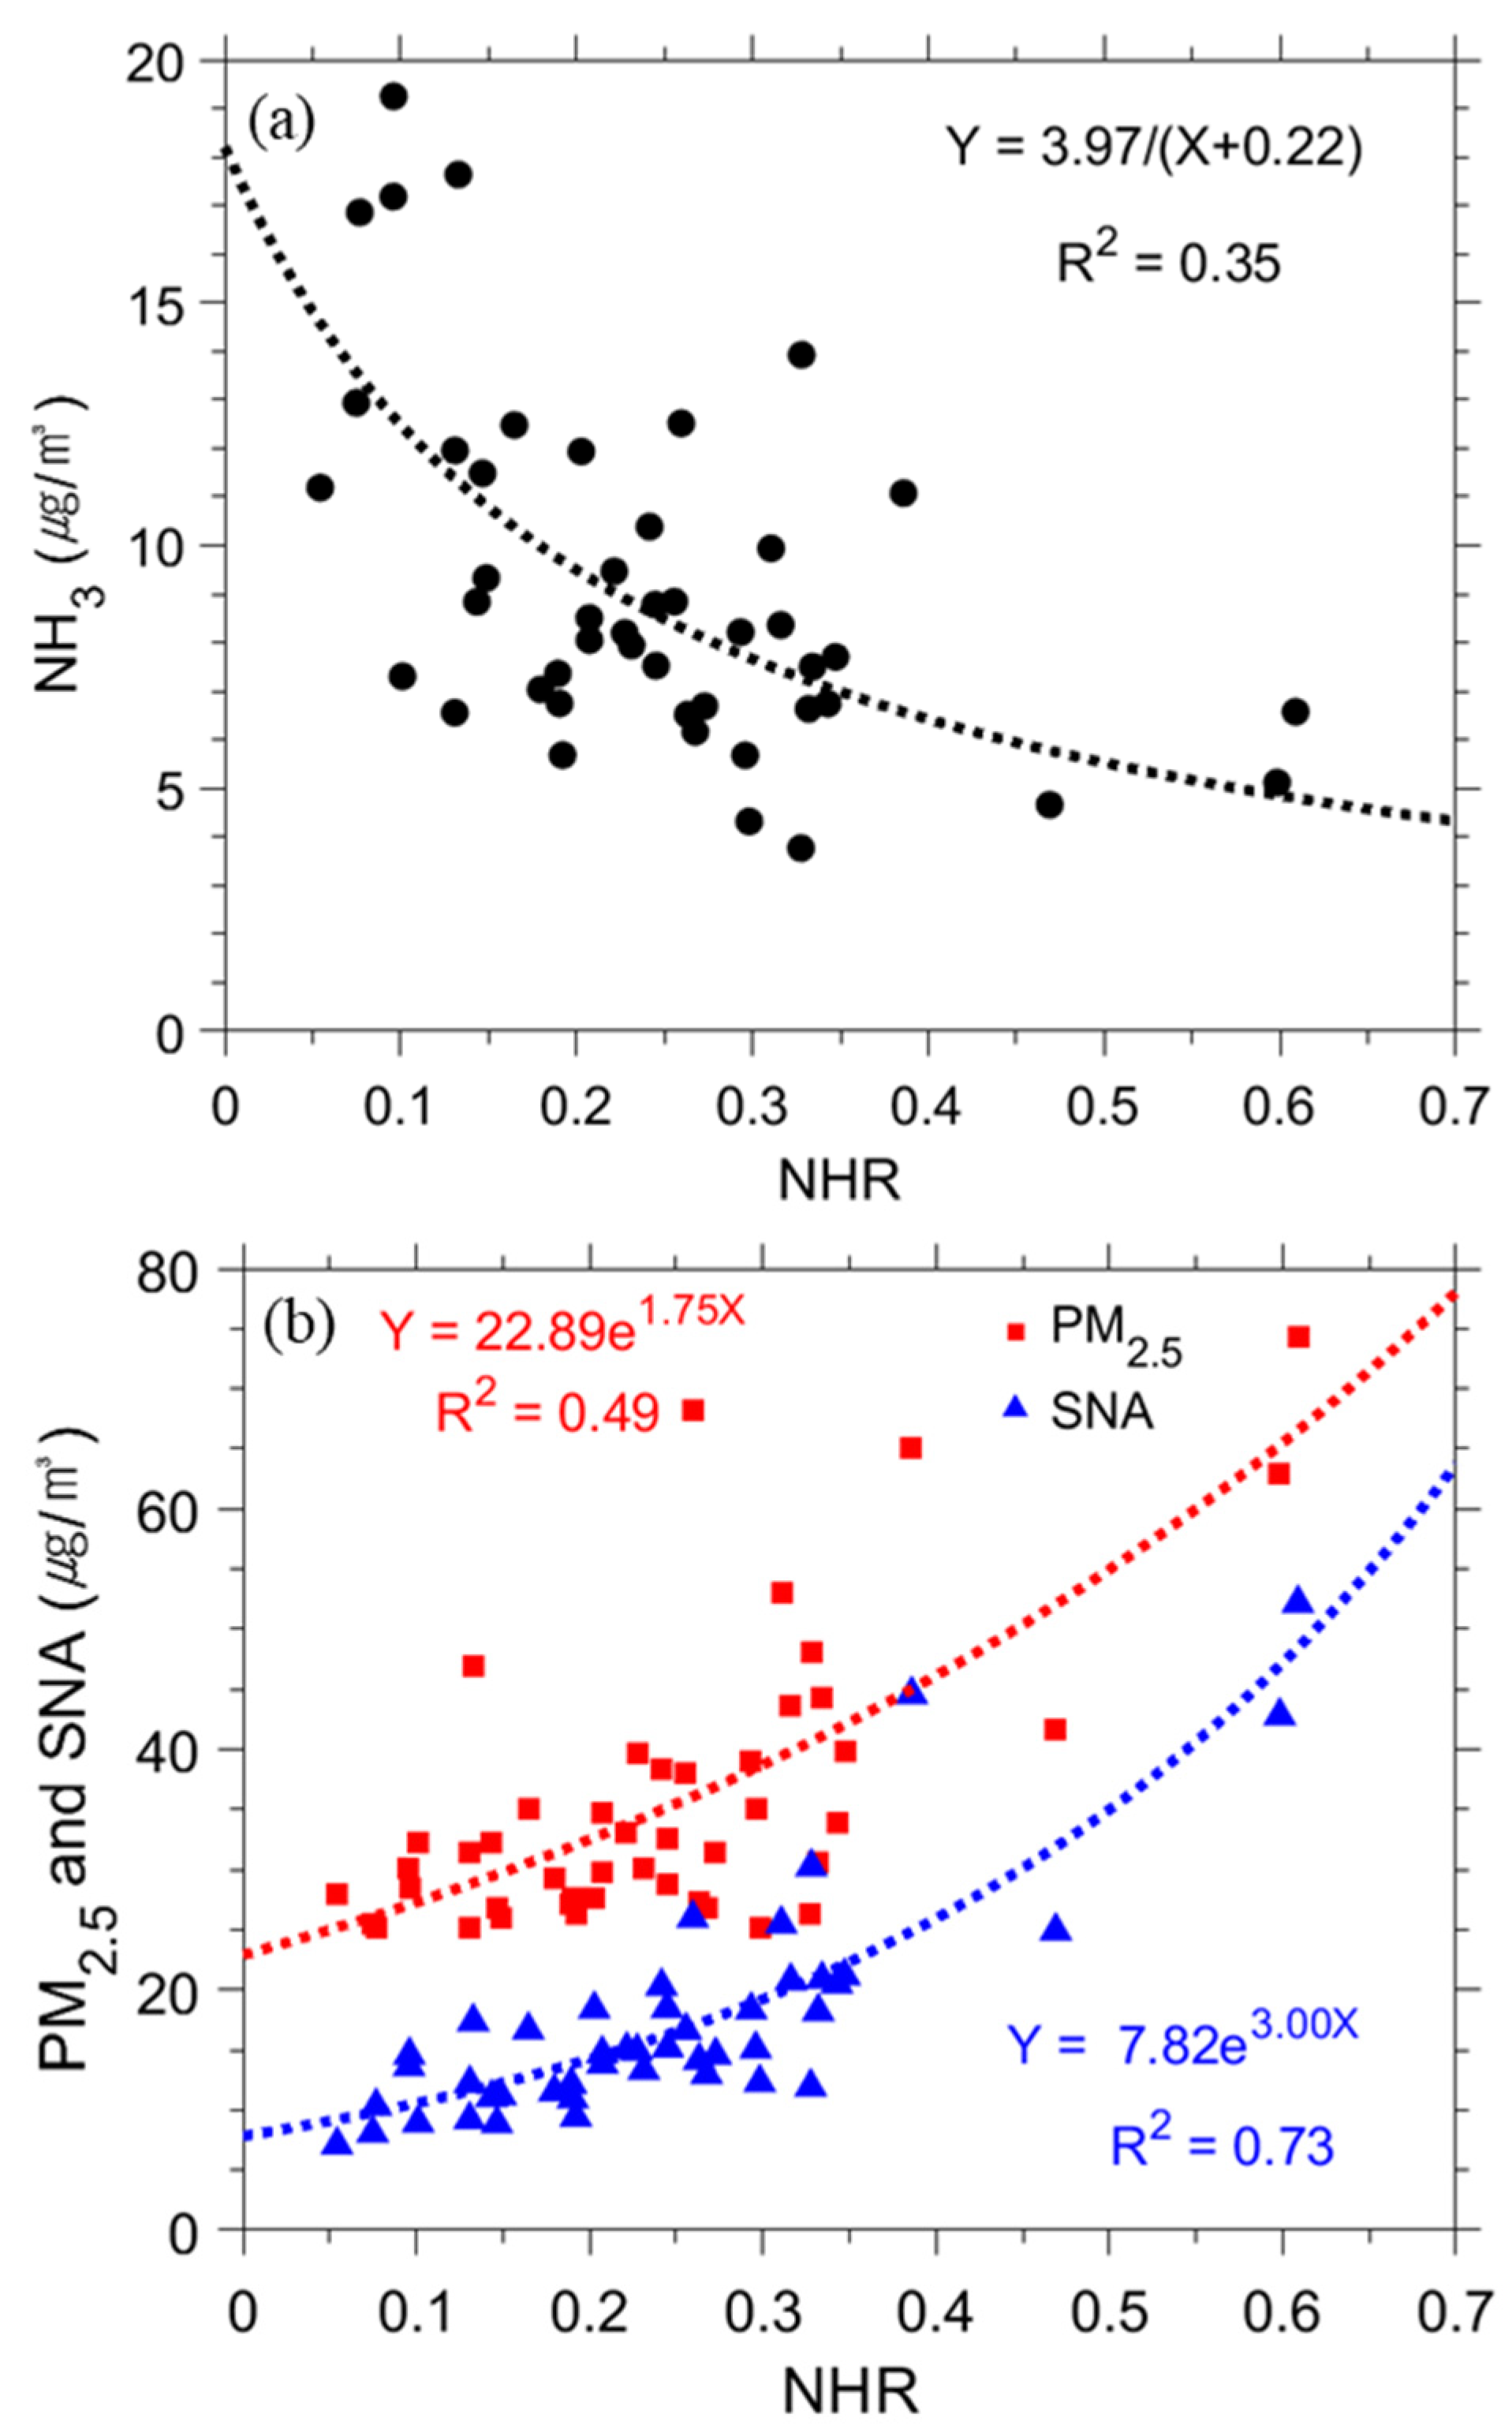
Illustrated in Figure 6a is the relationship between NHR and NH3 on PM2.5 pollution. The NHR was inversely proportional to the atmospheric NH3 concentrations (Figure 6a), and the atmospheric NH3 decreased as the NHR increased. These data reflect the inter-conversion between atmospheric gases and particles [9], thus, suggesting that NH3 was converted to NH4+ on PM2.5 pollution, resulting in high PM2.5 concentration. Moreover, as the NHR increased, the PM2.5 and SNA concentrations increased exponentially with R2 values of 0.49 and 0.73, respectively (Figure 6b). This indicates that the increase in PM2.5 concentration was facilitated by the reactions of gaseous NH3 with acidic species that converted the NH3 to particulate NH4+ [8,9,36].
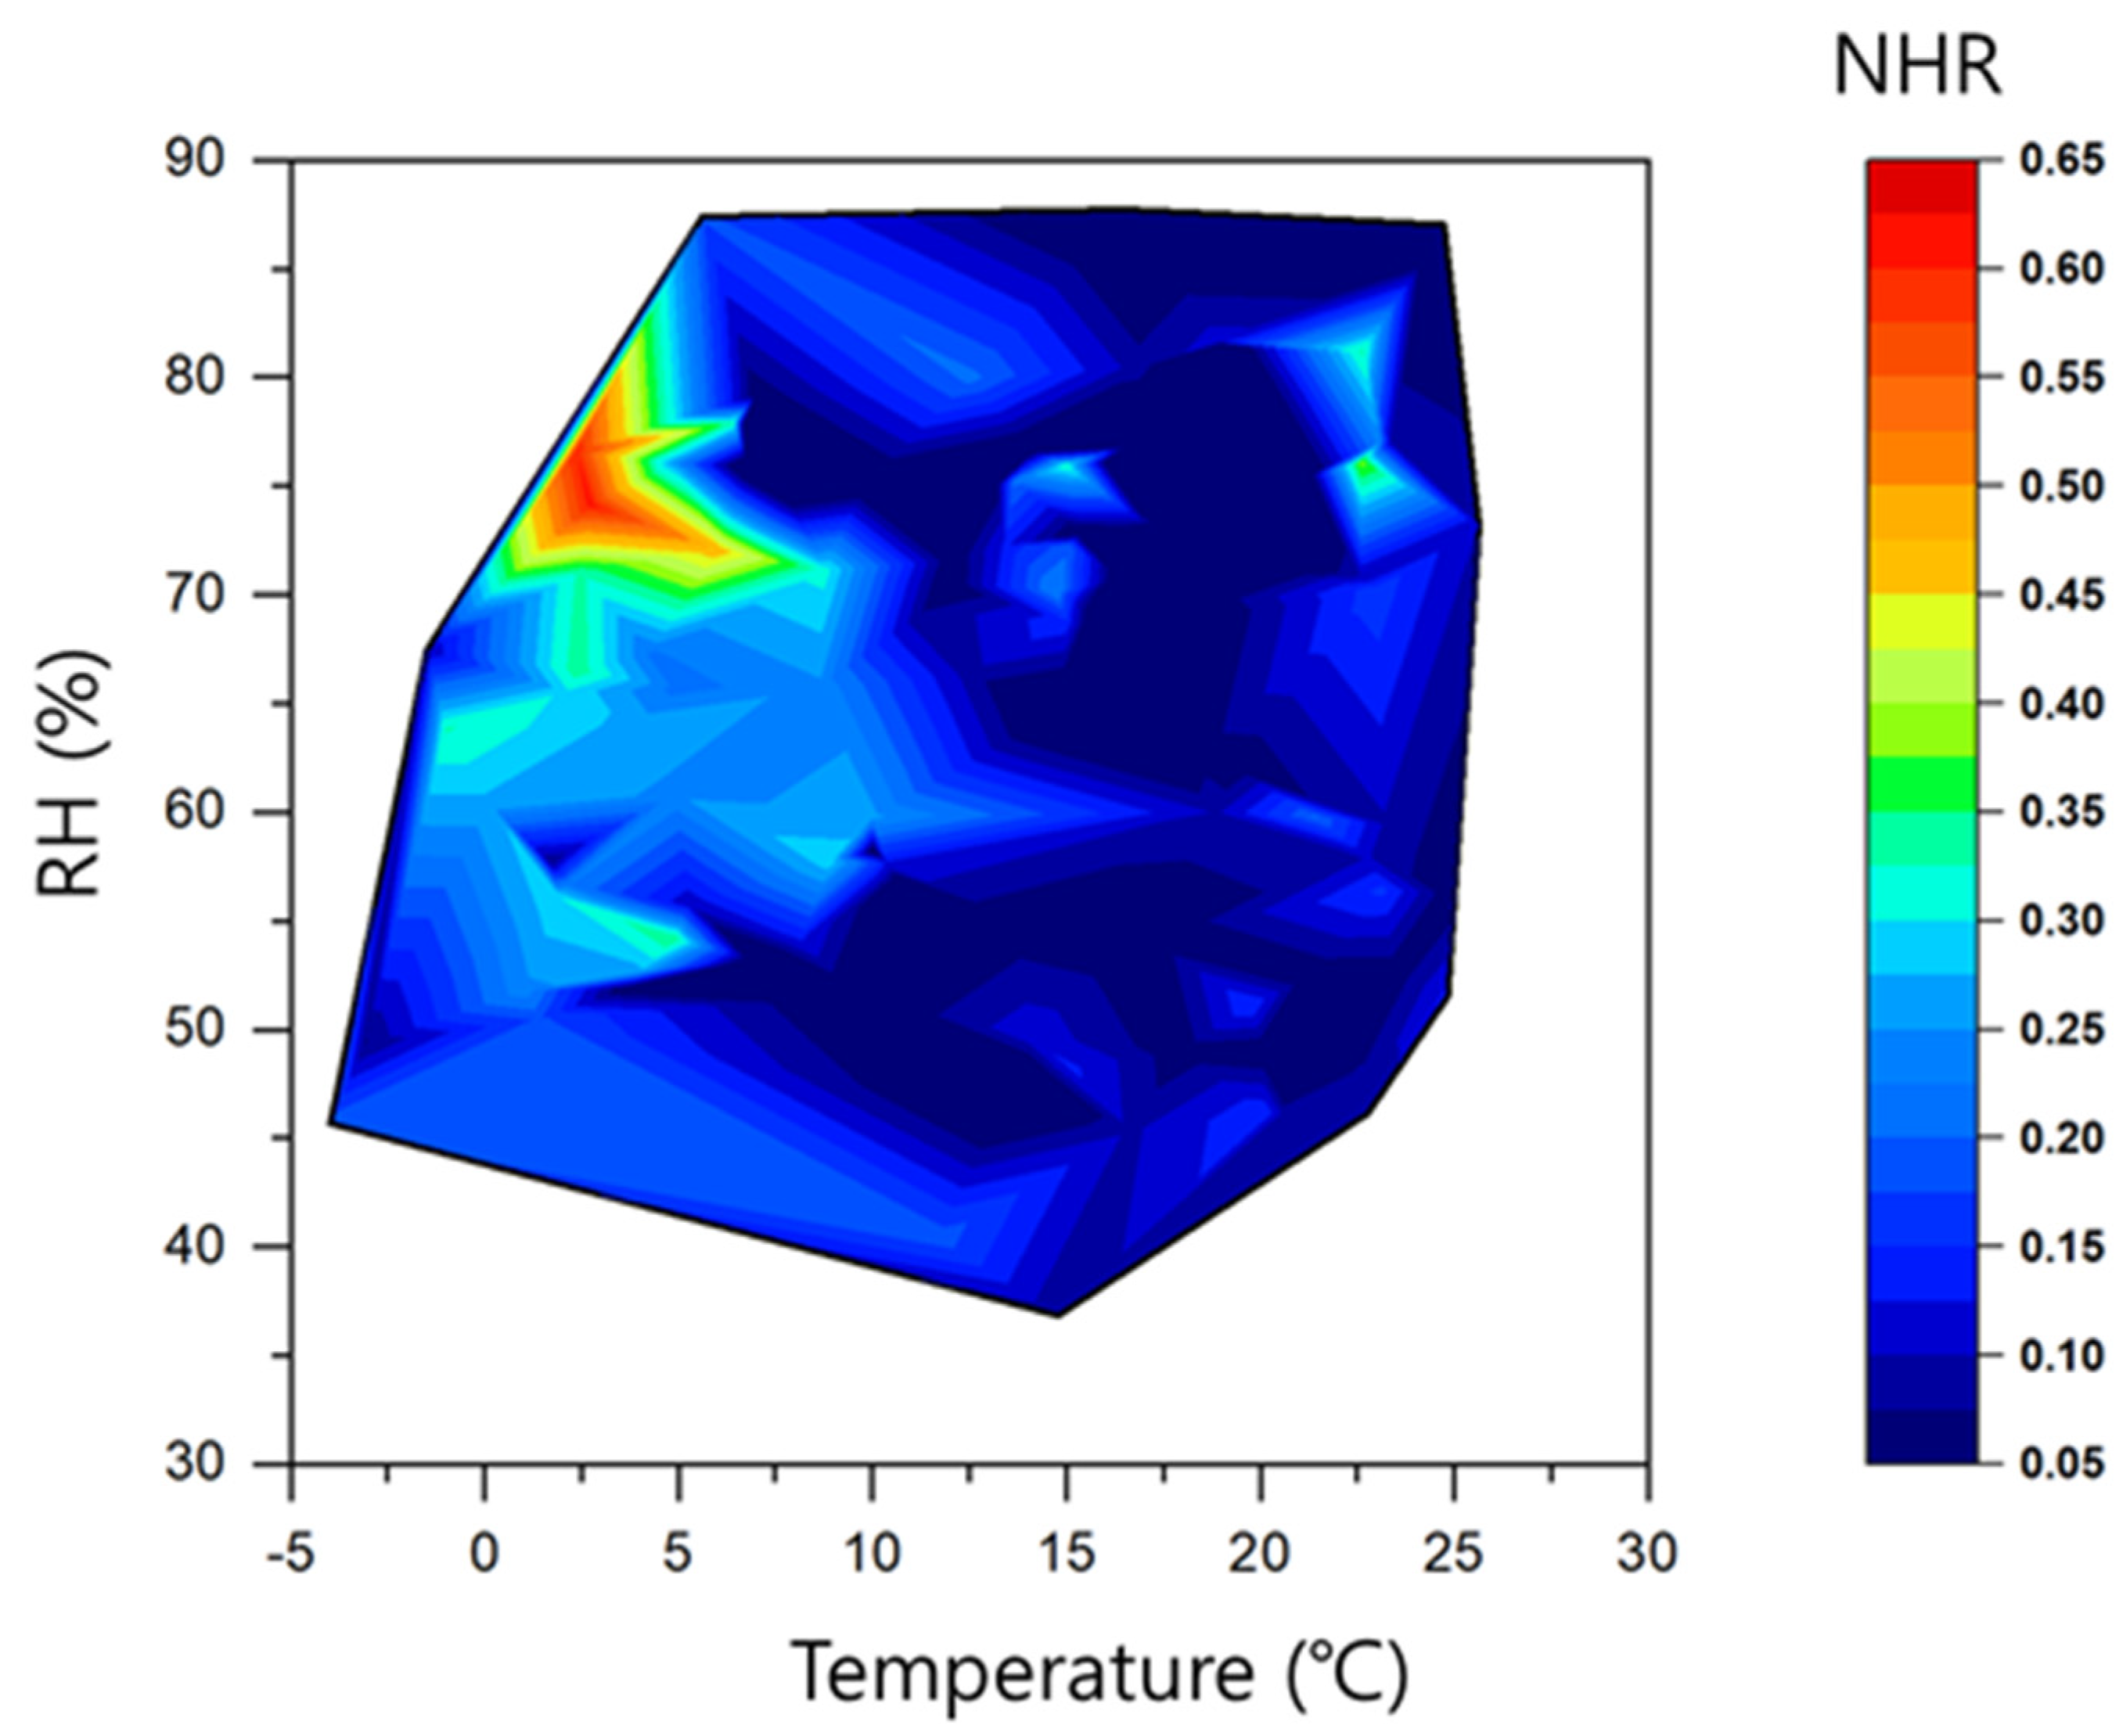
NH3 is considered to be neutralized by sulfuric acid to form (NH4)2SO4, and then the excess NH3 reacts with other gaseous acidic species (i.e., HNO3 and HCl) to form NH4NO3 and NH4Cl [69]. Sung et al. [18] measured NH3, NO3−, and HNO3 at the same urban site from 2009 to 2018 (average NH3: ~7.8 µg/m3, NO3−: ~3.0 µg/m3, and HNO3: ~1.7 µg/m3) and reported that the urban area was under NH3-rich conditions based on the calculation of adjusted gas ratio of ~4, AdjGR = ([NH3] + [NO3−])/([NO3−] + [HNO3]) [70]. This indicates that, in the urban site, NH3 could be enough to form (NH4)2SO4, and then the excess NH3 could react with other gaseous acidic species to form NH4NO3 and NH4Cl. In this study, based on the molar ratio of ([NO3−]/[SO42−])/([NH4+]/[SO42−]), NH4+-rich conditions were observed (Figure S6), again suggesting NH4NO3 formation during the SIA formation. NH4NO3 is a semi-volatile species; thus, it can exist in different phase states depending on the temperature and humidity [69]. As shown in Figure 5c and Figure 7, a high NHR (>0.3) was found under NH4+-rich, low temperature (7.9 ± 7.6 °C) and high RH (71.7 ± 7.0%) conditions, which are the conditions of higher deliquescence RH of NH4NO3 [71]. These data indicate that in the study site, NH4NO3 was likely present in mainly the aqueous phase.
3.3. Origin of Total NH3
To examine the origin of NH3 during the measurement period, we used air quality simulation with the photochemical model. The simulated NH3 and NH4+ were evaluated with the observations (Figures S7–S9 and Figure 2). The simulated NH4+ concentrations agreed well with the observations in the urban site. Moreover, the simulated NH3 concentrations were overestimated by 2–6 ppb for spring, autumn, and winter in the site, which can be attributable to the uncertainty in the NH3 emissions inventory [72].
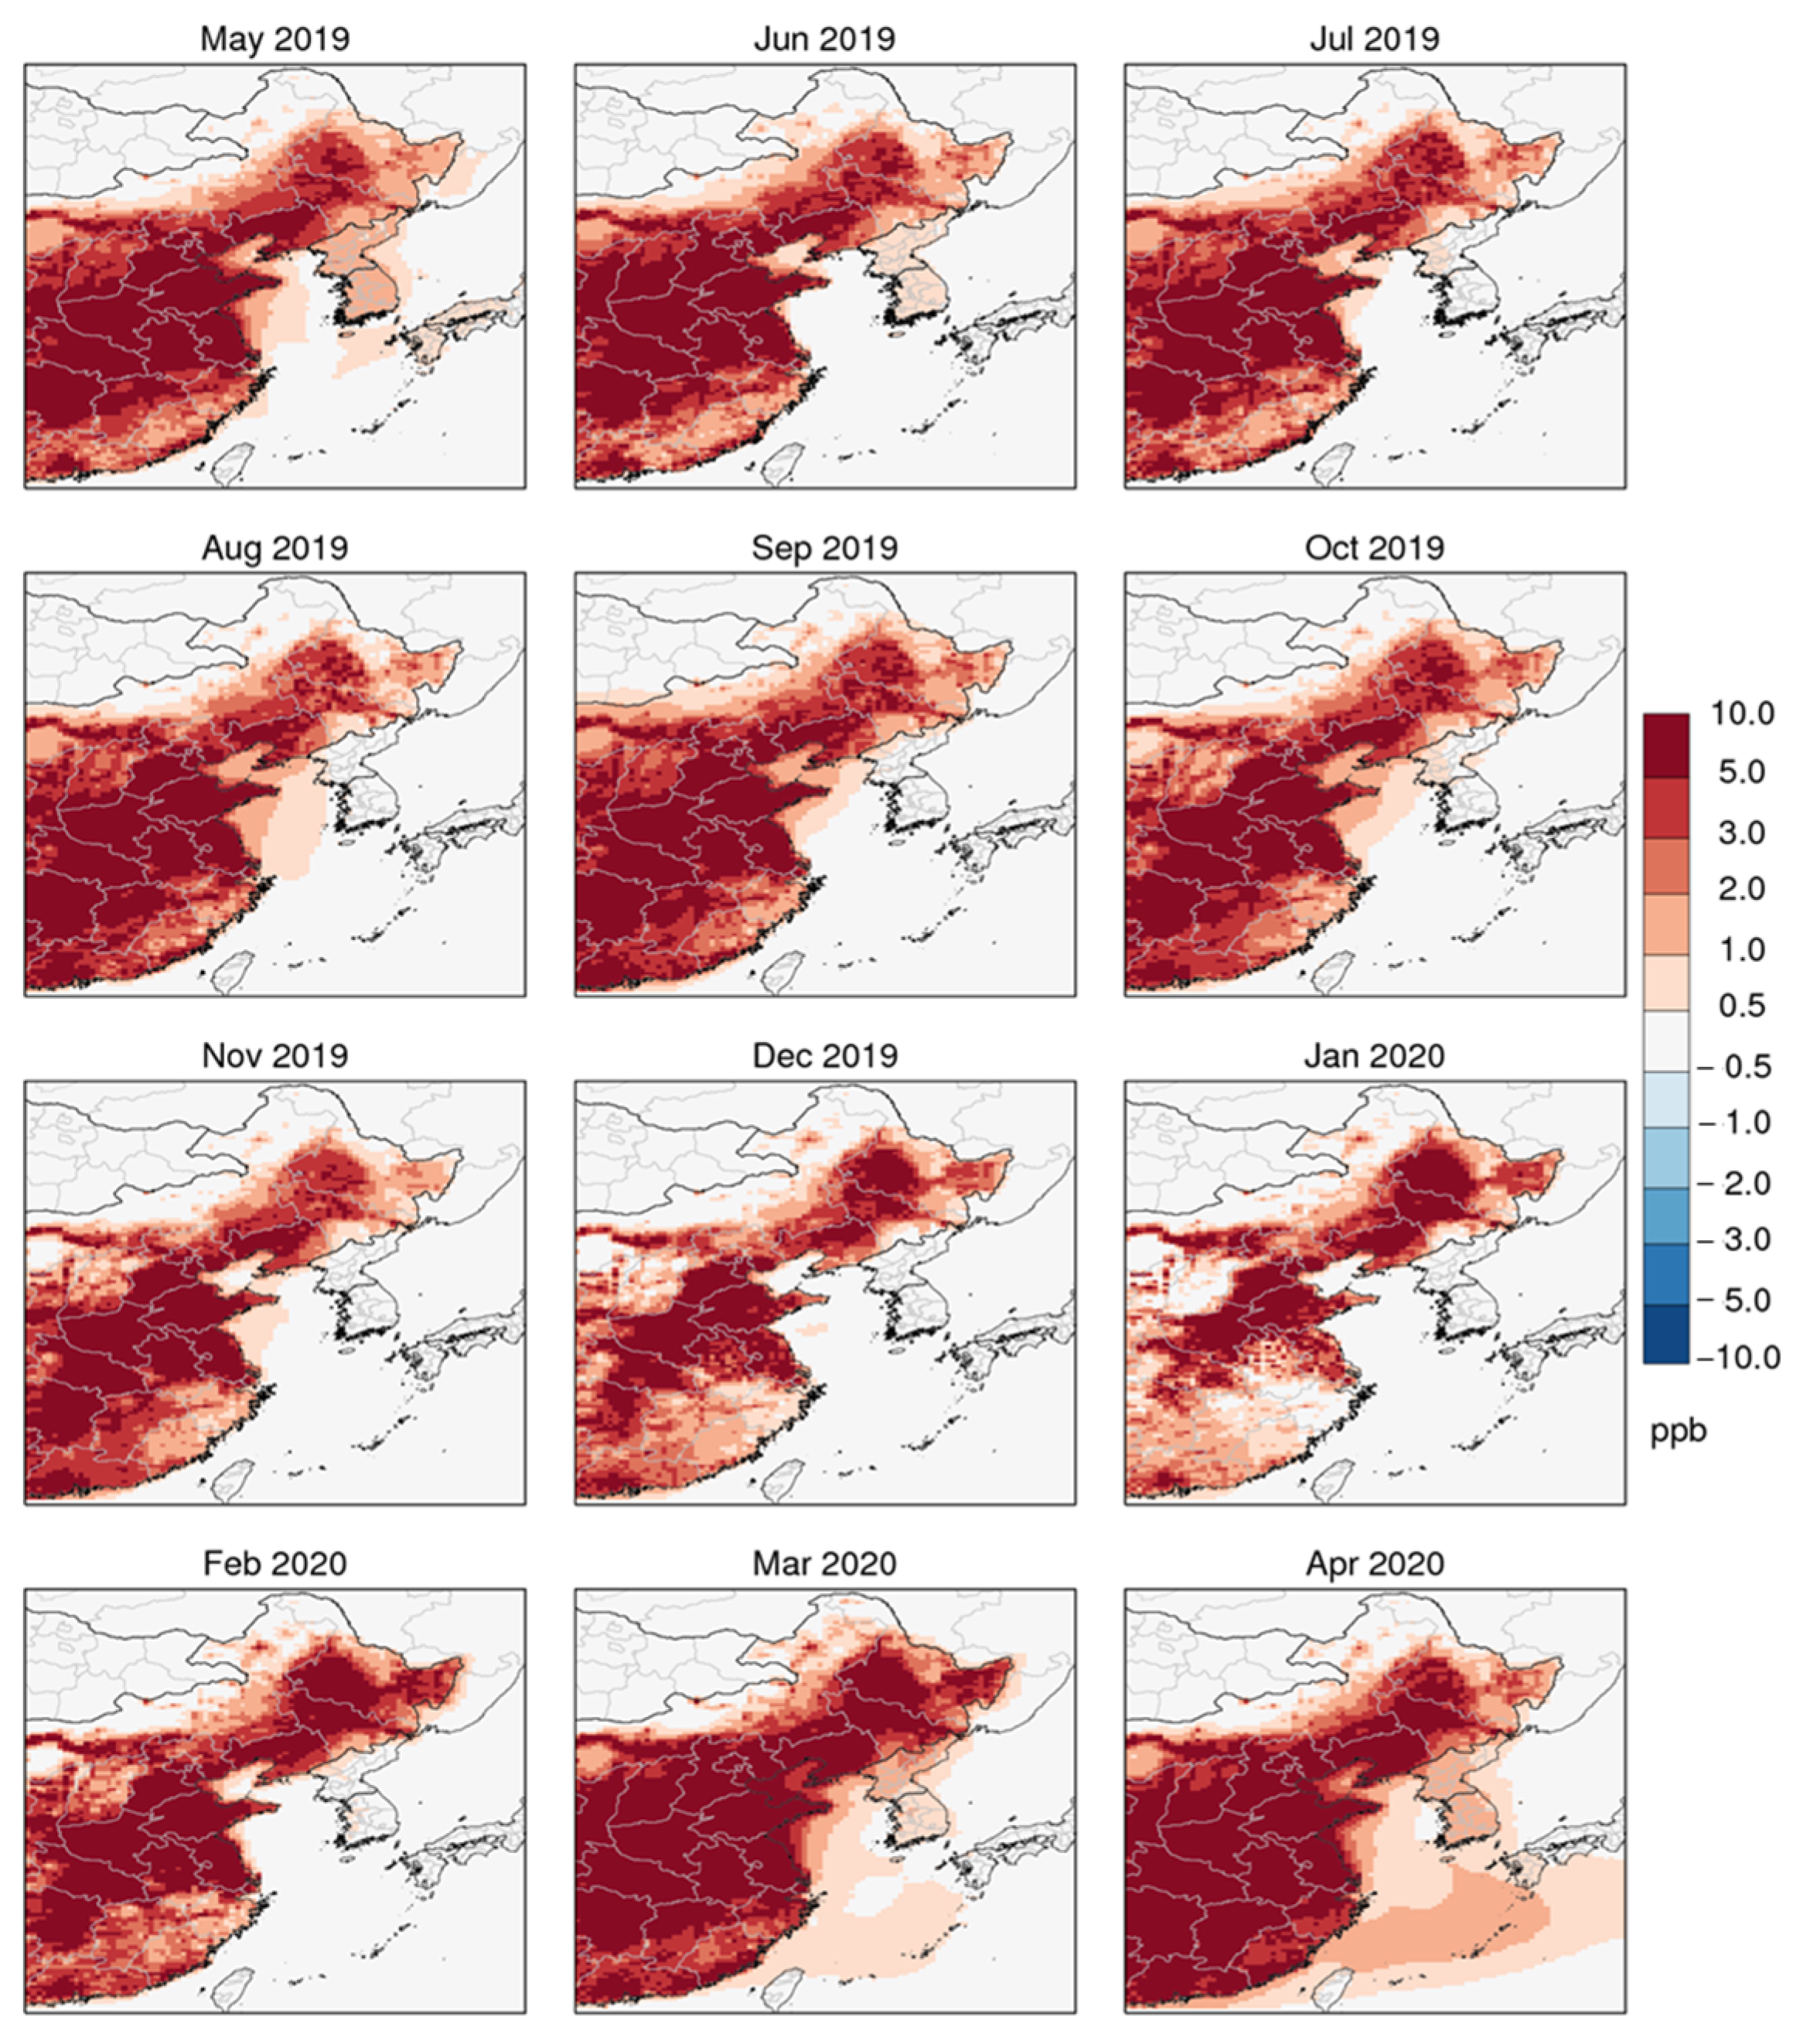
Figure 8 shows the monthly ZOC of Chinese NH3 emissions in Northeast Asia. The ZOC averaged over China was as high as ~5.3 ppb. For South Korea, however, the ZOC was as low as ~0.5 ppb, except during spring, when NH3 emissions increased due to agricultural activities. It is known that transboundary transport of air pollutants from China to South Korea increases during spring compared to the other seasons [73,74]. However, the calculations yielded an NH3 concentration of just ~2 ppb, which is significantly lower than the measured value during spring (~12 ppb) (Figure 3). This suggests that domestic influences remain strong even during the spring.
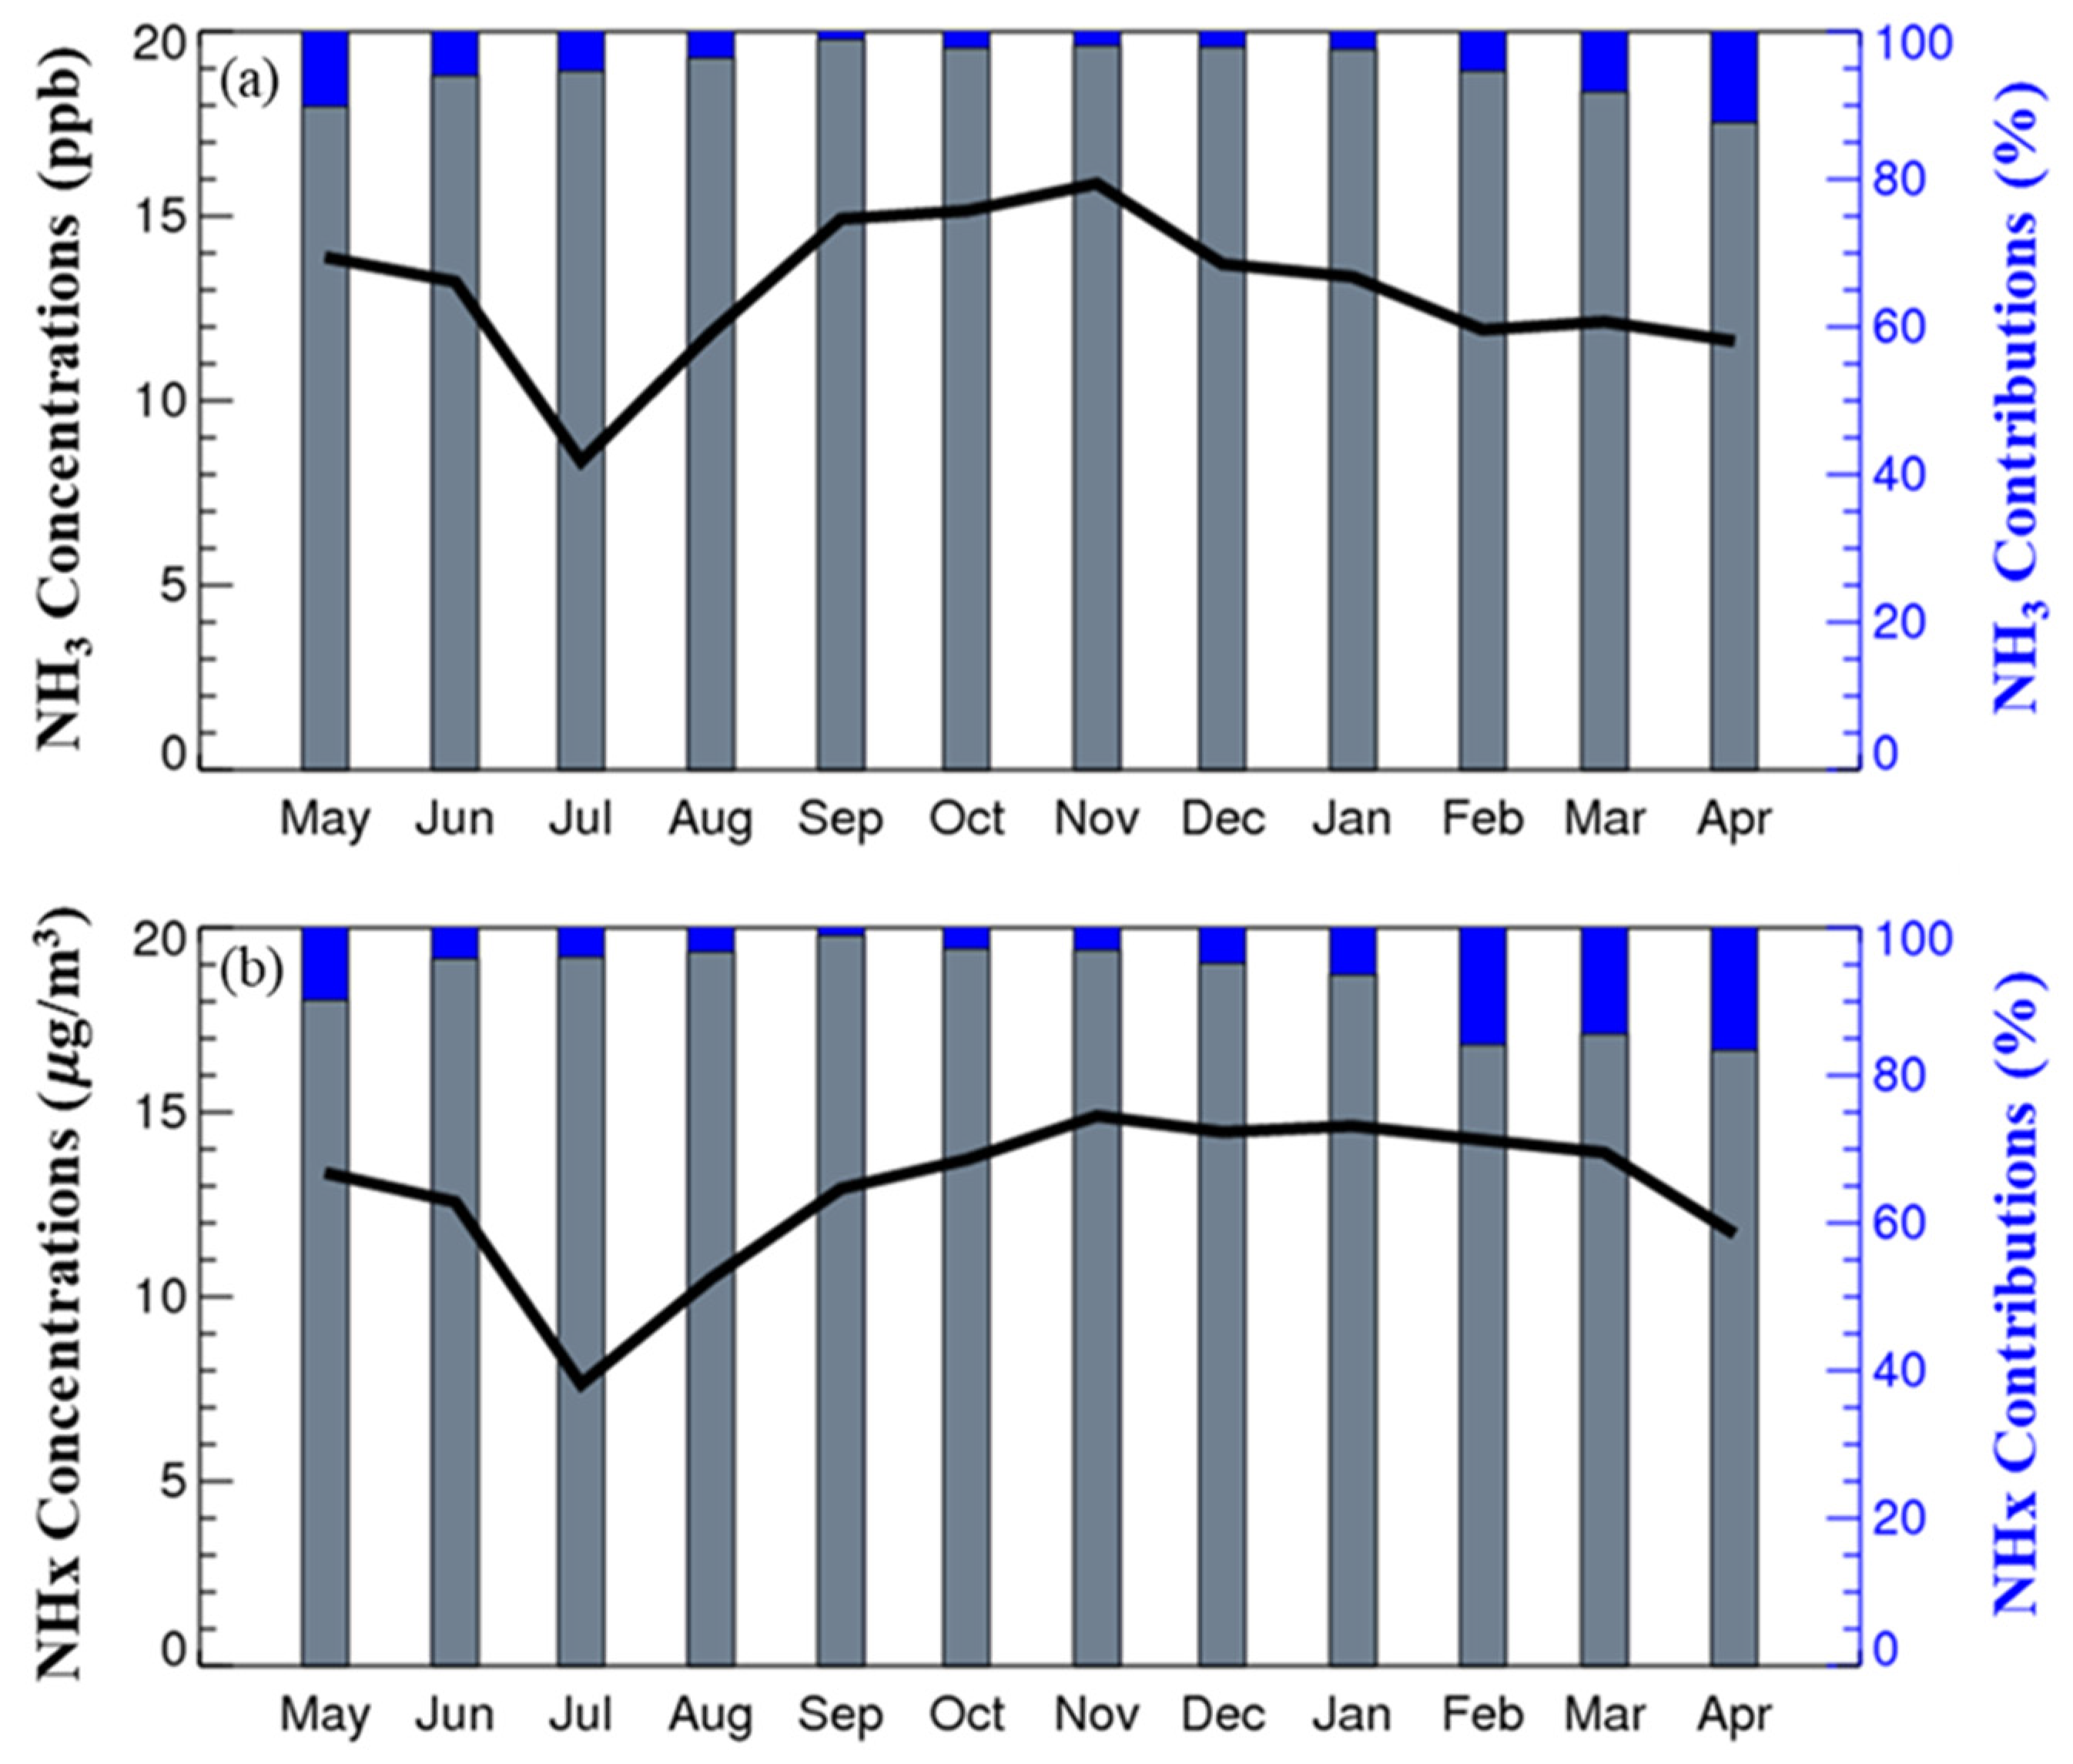
Figure 9 shows the simulated monthly NH3 concentrations and the relative contributions of NH3 emissions released from China and South Korea, respectively, in Samcheon-dong, South Korea. NHx was also added because NH3 can be converted into NH4+ during the long-range transport. During the study period, the relative NH3 contributions from South Korea were dominant, ranging from 88% to 99%, despite the uncertainties that still existed in the simulation results associated with the input emissions and meteorology data. This is because most NH3 originating from China is converted into NH4+ after the long-range transport, considering the short residence time of NH3 in the atmosphere (one day or less) [75,76]. Although the simulations overestimated NH3 concentrations in Samcheon-dong (Figure S8), they clearly confirmed that most NH3 originated from South Korea, rather than China, during the measurement period.
4. Conclusions
In this study, we measured the concentrations of NH3, PM2.5, and its water-soluble SNA to determine the effect of NH3 on PM2.5 pollution at an urban area, Jeonju, South Korea from May 2019 to April 2020. During the entire period, the hourly average concentration of atmospheric NH3 was 10.5 ± 4.8 ppb and the daily average concentration of PM2.5 was 24.0 ± 12.8 μg/m3 with 4.4 ± 4.9 μg/m3 for NO3−, 4.3 ± 3.1 μg/m3 for SO42−, and 1.6 ± 1.8 μg/m3 for NH4+. Seasonal variations showed that the atmospheric NH3 was enhanced in summer, while the PM2.5 was increased in winter at the monitoring site. Further, when the level of atmospheric NH3 enhanced, the concentration showed a late afternoon peak due to the influence of nearby rural areas by agricultural activities. This was evident in spring and summer; on the other hand, in winter, the two peaked during high traffic times.
During PM2.5 pollution episodes (daily PM2.5 average ≥ 25 μg/m3), we observed a remarkable increase in the fraction of NH4+ and NO3− in PM2.5. In addition, the daily average NHR increased dramatically to 0.24 (with a maximum ratio of ~0.61 in January) when high PM2.5 concentration was observed. This was comparable to the result of the NHR-value of 0.06 for clean days (PM2.5 < 25 μg/m3). We also observed an inversely proportional correlation between the NHR and NH3, and a strong positive exponential correlation between the NHR and PM2.5 and SNA, suggesting that NH3 contributed significantly to SNA formation by gas-to-particle conversion. To explore the origin of the NH3 at the monitoring site, we performed three-dimensional photochemical models using CMAQ and BFM. The modeling results showed that most of the NH3 originated from South Korea, rather than China, during the studied period. The simulations proved that most NH3 originated from South Korea, rather than China, during the measurement period. Overall, our results provided an in-depth understanding of the chemistry and origin of PM precursors and aerosol pollution in the atmosphere. This knowledge can further contribute to the development of effective air quality improvement strategies, such as regulation policies for air pollutants.
Supplementary Materials
The following are available online at https://0-www-mdpi-com.brum.beds.ac.uk/article/10.3390/atmos12121676/s1, Figure S1: Calibration of the NH3 analyzer using a diluted standard gas mixture of NH3 and N2. Figure S2: A result of polar plot during the measuring period in Jeonju. Figure S3: Relationship between hourly NH3 concentrations and ambient temperature at the Samcheon-dong monitoring station during May 2019 to April 2020. Figure S4: Hourly averaged concentration of NH3 versus the precipitation per hour during the measuring period (temperature > 30 °C). Figure S5: Monthly variation in (a) temperature and the ratio of NH4+ to total NH3 (NHR) and (b) concentrations of NH3, SNA, and PM2.5 at the monitoring site in January 2020. Figure S6: NO3− to SO42− molar ratio and NH4+ to SO42− molar ratio used for the analysis of NH4+ conditions during polluted periods. Figure S7: Cluster analysis for 72 h backward trajectories at the monitoring site from May 2019 to April 2020. Figure S8: Seasonally observed (left) and simulated (right) ammonia (NH3) concentrations in Samcheon-dong. Figure S9: Time series for the observed and simulated NH4+ concentrations in the six supersites (Baengnyeong, Seoul, Daejeon, Gwangju, Jeju, and Ulsan) in South Korea from May 2019 to April 2020. Table S1: Monthly average concentrations of PM2.5 and its ionic species, and NH3, and meteorological conditions in Jeonju from May 2019 to April 2020. Table S2: Model performance evaluation for NH4+ concentrations in the six supersites (Baengnyeong, Seoul, Daejeon, Gwangju, Jeju, and Ulsan) in South Korea from May 2019 to April 2020.
Author Contributions
M.S. designed this study. J.P., S.O., H.K. and M.S. conducted field measurements and analyzed the data. E.K. and S.K. calculated model predictions and wrote the section. M.S. and J.P. prepared the manuscript with contributions of E.K., H.K., S.K., Y.P.K. and S.O. All authors have read and agreed to the published version of the manuscript.
Funding
This Research was supported by the Technology Development Program to Solve Climate Changes of the National Research Foundation (NRF) funded by the Korea government (MSIT) (NRF-2019M1A2A2103956), and Cooperative Research Program for Agriculture Science and Technology Development (PJ014248022021) funded by the Rural Development Administration, Republic of Korea.
Institutional Review Board Statement
Not applicable.
Informed Consent Statement
Not applicable.
Data Availability Statement
The publicly available Hybrid Single-Particle Lagrangian Integrated Trajectory (HYSPLIT) model can be found at https://www.ready.noaa.gov (accessed on 1 May 2021) and run either online or offline. The data can be found data from the link: ftp://arlftp.arlhq.noaa.gov/pub/archives/gdas1/ (accessed on 1 May 2021). In this study, the PM2.5 mass concentration analysis method used the methodology provided by EPA, which can be found from the link: https://www.epa.gov/amtic/compendium-methods-determination-inorganic-compounds-ambient-air (accessed on 15 November 2021).
Acknowledgments
Mijung Song would like to thank Jaeyoun Ryoo for providing meteorological condition data.
Conflicts of Interest
The authors declare no conflict of interest.
References
- Xu, R.; Tian, H.; Pan, S.; Prior, S.A.; Feng, Y.; Batchelor, W.D.; Chen, J.; Yang, J. Global ammonia emissions from synthetic nitrogen fertilizer applications in agricultural systems: Empirical and process-based estimates and uncertainty. Glob. Chang. Biol. 2019, 25, 314–326. [Google Scholar] [CrossRef] [PubMed] [Green Version]
- Zhan, X.; Adalibieke, W.; Cui, X.; Winiwarter, W.; Reis, S.; Zhang, L.; Bai, Z.; Wang, Q.; Huang, W.; Zhou, F. Improved estimates of ammonia emissions from global croplands. Environ. Sci. Technol. 2021, 55, 1329–1338. [Google Scholar] [CrossRef]
- Sutton, M.A.; Reis, S.; Riddick, S.N.; Dragosits, U.; Nemitz, E.; Theobald, M.R.; Tang, Y.S.; Braban, C.F.; Vieno, M.; Dore, A.J.; et al. Towards a climate-dependent paradigm of ammonia emission and deposition. Philos. Trans. R. Soc. B 2013, 368. [Google Scholar] [CrossRef]
- Koerkamp, P.W.G.G.; Metz, J.H.M.; Uenk, G.H.; Phillips, V.R.; Holden, M.R.; Sneath, R.W.; Short, J.L.; White, R.P.; Hartung, J.; Seedorf, J.; et al. Concentrations and emissions of ammonia in livestock buildings in Northern Europe. J. Agric. Eng. Res. 1998, 70, 79–95. [Google Scholar] [CrossRef]
- Weerden van der, T.J.; Jarvis, S.C. Ammonia emission factors for nitrogen fertilisers applied to two contrasting grassland soils. Environ. Pollut. 1997, 95, 205–211. [Google Scholar] [CrossRef]
- Zhao, M.; Wang, S.; Tan, J.; Hua, Y.; Wu, D.; Hao, J. Variation of urban atmospheric ammonia pollution and its relation with PM2.5 chemical Property in winter of Beijing. China. Aerosol Air Qual. Res. 2016, 16, 1378–1389. [Google Scholar] [CrossRef] [Green Version]
- Huntzicker, J.J.; Cary, R.A.; Ling, C. Neutralization of sulfuric acid aerosol by ammonia. Environ. Sci. Technol. 1980, 14, 819–824. [Google Scholar] [CrossRef]
- Meng, Z.; Xu, X.; Lin, W.; Ge, B.; Xie, Y.; Song, B.; Jia, S.; Zhang, R.; Peng, W.; Wang, Y.; et al. Role of ambient ammonia in particulate ammonium formation at a rural site in the North China Plain. Atmos. Chem. Phys. 2018, 18, 167–184. [Google Scholar] [CrossRef] [Green Version]
- Wang, S.; Nan, J.; Shi, C.; Fu, Q.; Gao, S.; Wang, D.; Cui, H.; Saiz-Lopez, A.; Zhou, B. Atmospheric ammonia and its impacts on regional air quality over the megacity of Shanghai, China. Sci. Rep. 2015, 5, 15842. [Google Scholar] [CrossRef] [PubMed] [Green Version]
- Behera, S.N.; Sharma, M.; Aneja, V.P.; Balasubramanian, R. Ammonia in the atmosphere: A review on emission sources, atmospheric chemistry and deposition on terrestrial bodies. Environ. Sci. Pollut. Res. 2013, 20, 8092–8131. [Google Scholar] [CrossRef] [PubMed]
- Ye, X.; Ma, Z.; Zhang, J.; Du, H.; Chen, J.; Chen, H.; Yang, X.; Gao, W.; Geng, F. Important role of ammonia on haze formation in Shanghai. Environ. Res. Lett. 2011, 6, 2–7. [Google Scholar] [CrossRef] [Green Version]
- Chang, L.T.C.; Tsai, J.H.; Lin, J.M.; Huang, Y.S.; Chiang, H.L. Particulate matter and gaseous pollutants during a tropical storm and air pollution episode in Southern Taiwan. Atmos. Res. 2011, 99, 67–79. [Google Scholar] [CrossRef]
- Pinder, R.W.; Adams, P.J.; Pandis, S.N. Ammonia emission controls as a cost-effective strategy for reducing atmospheric particulate matter in the Eastern United States. Environ. Sci. Technol. 2007, 41, 380–386. [Google Scholar] [CrossRef] [PubMed] [Green Version]
- Krupa, S.V. Effects of atmospheric ammonia (NH3) on terrestrial vegetation: A review. Environ. Pollut. 2003, 124, 179–221. [Google Scholar] [CrossRef]
- Bhattarai, G.; Lee, J.B.; Kim, M.H.; Ham, S.; So, H.S.; Oh, S.; Sim, H.J.; Lee, J.C.; Song, M.; Kook, S.H. Maternal exposure to fine particulate matter during pregnancy induces progressive senescence of hematopoietic stem cells under preferential impairment of the bone marrow microenvironment and aids development of myeloproliferative disease. Leukemia 2020, 34, 1481–1484. [Google Scholar] [CrossRef] [Green Version]
- Park, R.S.; Lee, S.; Shin, S.K.; Song, C.H. Contribution of ammonium nitrate to aerosol optical depth and direct radiative forcing by aerosols over East Asia. Atmos. Chem. Phys. 2014, 14, 2185–2201. [Google Scholar] [CrossRef] [Green Version]
- Xu, L.; Penner, J.E. Global simulations of nitrate and ammonium aerosols and their radiative effects. Atmos. Chem. Phys. 2012, 12, 9479–9504. [Google Scholar] [CrossRef] [Green Version]
- Sung, M.Y.; Park, J.S.; Lim, J.H.; Park, H.Y.; Cho, S.Y.A. Long term trend of gaseous and particulate acid/base species and effects of ammonia reduction on nitrate contained in PM2.5. J. Korean Soc. Atmos. Environ. 2020, 36, 249–261. [Google Scholar] [CrossRef]
- Park, J.; Ryoo, J.; Jee, J.; Song, M. Origins and distributions of atmospheric ammonia in Jeonju during 2019~2020. J. Korean Soc. Atmos. Environ. 2020, 36, 2, 262–274. [Google Scholar] [CrossRef]
- Chang, Y.; Zou, Z.; Zhang, Y.; Deng, C.; Hu, J.; Shi, Z.; Dore, A.J.; Collett, J.L. Assessing contributions of agricultural and nonagricultural emissions to atmospheric ammonia in a Chinese megacity. Environ. Sci. Technol. 2019, 53, 1822–1833. [Google Scholar] [CrossRef]
- Zhou, C.; Zhou, H.; Holsen, T.M.; Hopke, P.K.; Edgerton, E.S.; Schwab, J.J. Ambient ammonia concentrations across New York State. J. Geophys. Res. Atmos. 2019, 124, 8287–8302. [Google Scholar] [CrossRef] [Green Version]
- Huy, D.H.; Thanh, L.T.; Hien, T.T.; Noro, K.; Takenaka, N. Characteristics of ammonia gas and fine particulate ammonium from two distinct urban areas: Osaka, Japan, and Ho Chi Minh City, Vietnam. Environ. Sci. Pollut. Res. 2017, 24, 8147–8163. [Google Scholar] [CrossRef]
- Phan, N.T.; Kim, K.H.; Shon, Z.H.; Jeon, E.C.; Jung, K.; Kim, N.J. Analysis of ammonia variation in the urban atmosphere. Atmos. Environ. 2013, 65, 177–185. [Google Scholar] [CrossRef]
- Gong, L.; Lewicki, R.; Griffin, R.J.; Flynn, J.H.; Lefer, B.L.; Tittel, F.K. Atmospheric ammonia measurements in Houston, TX using an external-cavity quantum cascade laser-based sensor. Atmos. Chem. Phys. 2011, 11, 9721–9733. [Google Scholar] [CrossRef] [Green Version]
- Pandolfi, M.; Amato, F.; Reche, C.; Alastuey, A.; Otjes, R.P.; Blom, M.J.; Querol, X. Summer ammonia measurements in a densely populated Mediterranean city. Atmos. Chem. Phys. 2012, 12, 7557–7575. [Google Scholar] [CrossRef] [Green Version]
- Gupta, A.K.; Karar, K.; Ayoob, S.; John, K. Spatio-temporal characteristics of gaseous and particulate pollutants in an urban region of Kolkata, India. Atmos. Res. 2008, 87, 103–115. [Google Scholar] [CrossRef]
- Lee, H.S.; Kang, C.M.; Kang, B.W.; Kim, H.K. Seasonal variations of acidic air pollutants in Seoul, South Korea. Atmos. Environ. 1999, 33, 3143–3152. [Google Scholar] [CrossRef]
- Stelson, A.W.; Seinfeld, J.H. Thermodynamic prediction of the water activity, NH4NO3 dissociation constant, density and refractive index for the NH4NO3-(NH4)2SO4-H2O system at 25 °C. Atmos. Environ. 1982, 16, 2507–2514. [Google Scholar] [CrossRef]
- Doyle, G.J.; Tuazon, E.C.; Graham, R.A.; Mischke, T.M.; Winer, A.M.; Pitts, J.N. Simultaneous concentrations of ammonia and nitric acid in a polluted atmosphere and their equilibrium relationship to particulate ammonium nitrate. Environ. Sci. Technol. 1979, 13, 1416–1419. [Google Scholar] [CrossRef]
- Van Donkelaar, A.; Martin, R.V.; Li, C.; Burnett, R.T. Regional estimates of chemical composition of fine particulate matter using a combined geoscience-statistical method with information from satellites, models, and monitors. Environ. Sci. Technol. 2019, 53, 2595–2611. [Google Scholar] [CrossRef] [PubMed] [Green Version]
- Gautam, S.; Patra, A.K.; Kumar, P. Status and chemical characteristics of ambient PM2.5 pollutions in China: A review. Environ. Dev. Sustain. 2019, 21, 1649–1674. [Google Scholar] [CrossRef]
- Li, Y.J.; Sun, Y.; Zhang, Q.; Li, X.; Li, M.; Zhou, Z.; Chan, C.K. Real-time chemical characterization of atmospheric particulate matter in China: A review. Atmos. Environ. 2017, 58, 270–304. [Google Scholar] [CrossRef]
- Cheng, Z.; Luo, L.; Wang, S.; Wang, Y.; Sharma, S.; Shimadera, H.; Wang, X.; Bressi, M.; de Miranda, R.M.; Jiang, J.; et al. Status and characteristics of ambient PM2.5 pollution in global megacities. Environ. Int. 2016, 89–90, 212–221. [Google Scholar] [CrossRef] [PubMed]
- Philip, S.; Martin, R.V.; Van Donkelaar, A.; Lo, J.W.H.; Wang, Y.; Chen, D.; Zhang, L.; Kasibhatla, P.S.; Wang, S.; Zhang, Q.; et al. Global chemical composition of ambient fine particulate matter for exposure assessment. Environ. Sci. Technol. 2014, 48, 13060–13068. [Google Scholar] [CrossRef] [Green Version]
- Guo, W.; Zheng, N.; Zhang, Z. Stable nitrogen isotopic signatures reveal the NH4+ evolution processes in pollution episodes in urban southwestern China. Atmos. Res. 2021, 253, 105474. [Google Scholar] [CrossRef]
- Saraswati; Sharma, S.K.; Saxena, M.; Mandal, T.K. Characteristics of gaseous and particulate ammonia and their role in the formation of secondary inorganic particulate matter at Delhi, India. Atmos. Res. 2019, 218, 34–49. [Google Scholar] [CrossRef]
- Ge, B.; Xu, X.; Ma, Z.; Pan, X.; Wang, Z.; Lin, W.; Ouyang, B.; Xu, D.; Lee, J.; Zheng, M.; et al. Role of ammonia on the feedback between AWC and inorganic aerosol formation during heavy pollution in the North China Plain. Earth Space Sci. 2019, 6, 1675–1693. [Google Scholar] [CrossRef] [Green Version]
- Meng, Z.; Lin, W.; Zhang, R.; Han, Z.; Jia, X. Summertime ambient ammonia and its effects on ammonium aerosol in urban Beijing, China. Sci. Total Environ. 2017, 579, 1521–1530. [Google Scholar] [CrossRef]
- Edgerton, E.S.; Saylor, R.D.; Hartsell, B.E.; Jansen, J.J.; Alan Hansen, D. Ammonia and ammonium measurements from the southeastern United States. Atmos. Environ. 2007, 41, 3339–3351. [Google Scholar] [CrossRef]
- Gao, J.; Wei, Y.; Shi, G.; Yu, H.; Zhang, Z.; Song, S.; Wang, W.; Liang, D.; Feng, Y. Roles of RH, aerosol pH and sources in concentrations of secondary inorganic aerosols, during different pollution periods. Atmos. Environ. 2020, 241, 117770. [Google Scholar] [CrossRef]
- Wu, Z.; Wang, Y.; Tan, T.; Zhu, Y.; Li, M.; Shang, D.; Wang, H.; Lu, K.; Guo, S.; Zeng, L.; et al. Aerosol liquid water driven by anthropogenic inorganic salts: Implying its key role in haze formation over the North China Plain. Environ. Sci. Technol. Lett. 2018, 5, 160–166. [Google Scholar] [CrossRef]
- Nguyen, T.K.V.; Zhang, Q.; Jimenez, J.L.; Pike, M.; Carlton, A.G. Liquid water: Ubiquitous contributor to aerosol mass. Environ. Sci. Technol. Lett. 2016, 3, 257–263. [Google Scholar] [CrossRef]
- Picarro Inc. G2103 Analyzer Datasheet—G2103-DS20-V1.2-AHDS-190917. 2019. Available online: http://www.picarro.com (accessed on 1 November 2021).
- Pogány, A.; Balslev-Harder, D.; Braban, C.F.; Cassidy, N.; Ebert, V.; Ferracci, V.; Hieta, T.; Leuenberger, D.; Martin, N.A.; Pascale, C.; et al. A metrological approach to improve accuracy and reliability of ammonia measurements in ambient air. Meas. Sci. Technol. 2016, 27, 115012. [Google Scholar] [CrossRef] [Green Version]
- Yao, L.; Kong, S.; Zheng, H.; Chen, N.; Zhu, B.; Xu, K.; Cao, W.; Zhang, Y.; Zheng, M.; Cheng, Y.; et al. Co-benefits of reducing PM2.5 and improving visibility by COVID-19 lockdown in Wuhan. Clim. Atmos. Sci. 2021, 4, 40. [Google Scholar] [CrossRef]
- Wang, X.; Zhang, R.; Yu, W. The Effects of PM2.5 Concentrations and Relative Humidity on Atmospheric Visibility in Beijing. J. Geophys. Res. Atmos. 2019, 124, 2235–2259. [Google Scholar] [CrossRef]
- Byun, D.; Schere, K.L. Review of the Governing Equations, Computational Algorithms, and Other Components of the Models-3 Community Multiscale Air Quality (CMAQ) Modeling System. Appl. Mech. Rev. 2006, 59, 51–77. [Google Scholar] [CrossRef]
- Skamarock, W.C.; Klemp, J.B. A time-split nonhydrostatic atmospheric model for weather research and forecasting applications. J. Comput. Phys. 2008, 227, 3465–3485. [Google Scholar] [CrossRef]
- Benjey, W.; Houyox, M.; Susick, J. Implementation of the SMOKE Emission Data Processor and SMOKE Tool Input Data Processor in Models-3. In Proceedings of the Emission Inventory Conference, Denver, CO, USA, 1–4 May 2001; Available online: https://cfpub.epa.gov (accessed on 20 November 2021).
- Park, R.J.; Oak, Y.J.; Emmons, L.K.; Kim, C.H.; Pfister, G.G.; Carmichael, G.R.; Saide, P.E.; Cho, S.-Y.; Kim, S.; Woo, J.-H.; et al. Multi-model intercomparisons of air quality simulations for the KORUS-AQ campaign. Elementa 2021, 9. [Google Scholar] [CrossRef]
- Woo, J.-H.; Kim, Y.; Kim, J.; Park, M.; Jang, Y.; Kim, J.; Bu, C.; Lee, Y.; Park, R.; Oak, Y.; et al. KORUS Emissions: A comprehensive Asian emissions information in support of the NASA/NIER KORUS-AQ mission. Elementa. 2021, in press. [Google Scholar]
- Clean Air Policy Support System (CAPSS). 2017 Korea National Air Pollutants Emission. 2019. Available online: https://airemiss.nier.go.kr (accessed on 1 May 2021).
- Burr, M.J.; Zhang, Y. Source apportionment of fine particulate matter over the Eastern US, Part I: Source sensitivity simulations using CMAQ with the Brute Force method. Atmos. Pollut. Res. 2011, 2, 300–317. [Google Scholar] [CrossRef] [Green Version]
- Kim, H.C.; Kim, E.; Bae, C.; Hoon Cho, J.; Kim, B.U.; Kim, S. Regional contributions to particulate matter concentration in the Seoul metropolitan area, South Korea: Seasonal variation and sensitivity to meteorology and emissions inventory. Atmos. Chem. Phys. 2017, 17, 10315–10332. [Google Scholar] [CrossRef] [Green Version]
- Kim, E.; Kim, B.U.; Kim, H.C.; Kim, S. Sensitivity of fine particulate matter concentrations in South Korea to regional ammonia emissions in Northeast Asia. Environ. Pollut. 2021, 273, 116428. [Google Scholar] [CrossRef] [PubMed]
- Bae, M.; Kim, B.U.; Kim, H.C.; Kim, S. A multiscale tiered approach to quantify contributions: A case study of PM2.5 in South Korea during 2010–2017. Atmosphere 2020, 11, 141. [Google Scholar] [CrossRef] [Green Version]
- Li, X.; Zhang, Q.; Zhang, Y.; Zheng, B.; Wang, K.; Chen, Y.; Wallington, T.J.; Han, W.; Shen, W.; Zhang, X. Source contributions of urban PM2.5 in the Beijing–Tianjin–Hebei region: Changes between 2006 and 2013 and relative impacts of emissions and meteorology. Atmos. Environ. 2015, 123, 229–239. [Google Scholar] [CrossRef] [Green Version]
- Zhang, Z.; Wang, W.; Cheng, M.; Liu, S.; Xu, J.; He, Y.; Meng, F. The contribution of residential coal combustion to PM2.5 pollution over China’s Beijing-Tianjin-Hebei region in winter. Atmos. Environ. 2017, 159, 147–161. [Google Scholar] [CrossRef]
- Zbieranowski, A.L.; Aherne, J. Ambient concentrations of atmospheric ammonia, nitrogen dioxide and nitric acid across a rural-urban-agricultural transect in southern Ontario, Canada. Atmos. Environ. 2012, 62, 481–491. [Google Scholar] [CrossRef]
- Dammers, E.; Schaap, M.; Haaima, M.; Palm, M.; Kruit, R.J.W.; Volten, H.; Hensen, A.; Swart, D.; Erisman, J.W. Measuring atmospheric ammonia with remote sensing campaign: Part 1—Characterisation of vertical ammonia concentration profile in the centre of The Netherlands. Atmos. Environ. 2017, 169, 97–112. [Google Scholar] [CrossRef]
- Zöll, U.; Brümmer, C.; Schrader, F.; Ammann, C.; Ibrom, A.; Flechard, C.R.; Nelson, D.D.; Zahniser, M.; Kutsch, W.L. Surface-atmosphere exchange of ammonia over peatland using QCL-based eddy-covariance measurements and inferential modelling. Atmos. Chem. Phys. 2016, 16, 11283–11299. [Google Scholar] [CrossRef] [Green Version]
- Oh, S.; Kim, S.; Lee, J.; Park, J.; Jee, J.; Hong, S.; Kwon, K.; Song, M. Spatial distributions of atmospheric ammonia in a rural area in south Korea and the associated impact on a nearby urban area. Atmosphere 2021, 12, 1411. [Google Scholar] [CrossRef]
- Jo, G.; Kim, D.; Song, M. PM2.5 Concentrations and Chemical Compositions in Jeonju from 2017 to 2018. J. Korean Soc. Atmos. Environ. 2018, 34, 876–888. [Google Scholar] [CrossRef]
- Mutuku, K.J.; Lee, Y.Y.; Chang-Chien, G.P.; Lin, S.L.; Chen, W.H.; Hou, W.C. Chemical fingerprints for PM2.5 in the ambient air near a raw material storage site for iron ore, coal, limestone, and sinter. Aerosol Air Qual. Res. 2021, 21, 1–17. [Google Scholar] [CrossRef]
- Ricciardelli, I.; Bacco, D.; Rinaldi, M.; Bonafè, G.; Scotto, F.; Trentini, A.; Bertacci, G.; Ugolini, P.; Zigola, C.; Rovere, F.; et al. A three-year investigation of daily PM2.5 main chemical components in four sites: The routine measurement program of the Supersito Project (Po Valley, Italy). Atmos. Environ. 2017, 152, 418–430. [Google Scholar] [CrossRef]
- Cao, J.J.; Shen, Z.X.; Chow, J.C.; Watson, J.G.; Lee, S.C.; Tie, X.X.; Ho, K.F.; Wang, G.H.; Han, Y.M. Winter and Summer PM2.5 Chemical Compositions in Fourteen Chinese Cities. J. Air Waste Manag. Assoc. 2012, 62, 1214–1226. [Google Scholar] [CrossRef]
- WHO (World Health Organization). Air Quality Guidelines: Global Update 2005; WHO: Geneva, Switzerland, 2006; Available online: https://wedocs.unep.org/20.500.11822/8712 (accessed on 20 November 2021).
- Hu, G.; Zhang, Y.; Sun, J.; Zhang, L.; Shen, X.; Lin, W.; Yang, Y. Variability, formation and acidity of water-soluble ions in PM2.5 in Beijing based on the semi-continuous observations. Atmos. Res. 2014, 145–146, 1–11. [Google Scholar] [CrossRef]
- Seinfeld, J.; Pandis, S. Atmospheric Chemistry and Physics: From Air Pollution to Climate Change, 3rd ed.; Wiley: Hoboken, NJ, USA, 2016; ISBN 978-1-118-94740-1. [Google Scholar]
- Pinder, R.W.; Dennis, R.L.; Bhave, P.V. Observable indicators of the sensitivity of PM2.5 nitrate to emission reductions—Part I: Derivation of the adjusted gas ratio and applicability at regulatory-relevant time scales. Atmos. Environ. 2008, 42, 1275–1286. [Google Scholar] [CrossRef]
- Winston, P.W.; Bates, D.H. Saturated solutions for the control of humidity in biological research. Ecology 1960, 41, 232–237. [Google Scholar] [CrossRef]
- Kim, E.; Kim, B.U.; Kim, H.C.; Kim, S. Direct and cross impacts of upwind emission control on downwind PM2.5 under various NH3 conditions in Northeast Asia. Environ. Pollut. 2021, 268, 115794. [Google Scholar] [CrossRef]
- Kumar, N.; Park, R.J.; Jeong, J.I.; Woo, J.H.; Kim, Y.; Johnson, J.; Yarwood, G.; Kang, S.; Chun, S.; Knipping, E. Contributions of International Sources to PM2.5 in South Korea. Atmos. Environ. 2021, 118542. [Google Scholar] [CrossRef]
- Bae, C.; Kim, B.U.; Kim, H.C.; Yoo, C.; Kim, S. Long-range transport influence on key chemical components of PM2.5 in the Seoul Metropolitan Area, South Korea, during the years 2012–2016. Atmosphere 2020, 11, 48. [Google Scholar] [CrossRef] [Green Version]
- Zhu, L.; Henze, D.K.; Bash, J.O.; Cady-Pereira, K.E.; Shephard, M.W.; Luo, M.; Capps, S.L. Sources and impacts of atmospheric NH3: Current understanding and frontiers for modeling, measurements, and remote sensing in North America. Curr. Pollut. Rep. 2015, 1, 95–116. [Google Scholar] [CrossRef] [Green Version]
- Galperin, M.V.; Sofiev, M.A. The long-range transport of ammonia and ammonium in the Northern Hemisphere. Atmos. Environ. 1998, 32, 373–380. [Google Scholar] [CrossRef]
Figure 1.
Map of the measurement site in Jeonju, South Korea (35°47′56.4’’ N, 127°7′19.2’’ E).

Figure 2.
Seasonality of hourly averaged diurnal variations of atmospheric NH3 at the monitoring station during 2019–2020. Spring: May 2019, and March and April 2020. Summer: June and August 2019. Autumn: September–November 2019. Winter: December 2019 to February 2020.
Figure 2.
Seasonality of hourly averaged diurnal variations of atmospheric NH3 at the monitoring station during 2019–2020. Spring: May 2019, and March and April 2020. Summer: June and August 2019. Autumn: September–November 2019. Winter: December 2019 to February 2020.

Figure 3.
Seasonal NH3 concentrations at the monitoring site. Box lines represent the 75th quartile and the 25th quartile, and whiskers represent the minimum and maximum concentration values, excluding outliers. The black dot indicates average concentration of NH3 for each season, and the red line indicates median concentration.

Figure 4.
Monthly variations in (a) meteorological parameters, (b) NH3 and PM2.5 concentrations, (c) SO42−, NO3−, and NH4+ (SNA) concentrations in PM2.5, and (d) the ratio of NH4+ to total NH3 (NHR) from May 2019 to April 2020.
Figure 4.
Monthly variations in (a) meteorological parameters, (b) NH3 and PM2.5 concentrations, (c) SO42−, NO3−, and NH4+ (SNA) concentrations in PM2.5, and (d) the ratio of NH4+ to total NH3 (NHR) from May 2019 to April 2020.

Figure 5.
Comparisons of (a) SO42−, NO3−, and NH4+ of PM2.5, (b) NH3 concentrations, and (c) the ratio of NH4+ to total NH3 (NHR) on clean (PM2.5 < 25 μg/m3) versus polluted (PM2.5 ≥ 25 μg/m3) days.
Figure 5.
Comparisons of (a) SO42−, NO3−, and NH4+ of PM2.5, (b) NH3 concentrations, and (c) the ratio of NH4+ to total NH3 (NHR) on clean (PM2.5 < 25 μg/m3) versus polluted (PM2.5 ≥ 25 μg/m3) days.

Figure 6.
Relationship between the daily average ratio of NH4+ to total NH3 (NHR) and (a) NH3 concentrations, and (b) daily average PM2.5 and SO42−, NO3−, and NH4+ (SNA) concentrations during PM2.5 pollution days (PM2.5 ≥ 25 µg/m3).
Figure 6.
Relationship between the daily average ratio of NH4+ to total NH3 (NHR) and (a) NH3 concentrations, and (b) daily average PM2.5 and SO42−, NO3−, and NH4+ (SNA) concentrations during PM2.5 pollution days (PM2.5 ≥ 25 µg/m3).

Figure 7.
Daily average conversion ratios of NH3 to NH4+ (NHR) as a function of temperature and relative humidity (RH) during the entire measurement period.
Figure 7.
Daily average conversion ratios of NH3 to NH4+ (NHR) as a function of temperature and relative humidity (RH) during the entire measurement period.

Figure 8.
Simulated monthly NH3 zero-out contributions of Chinese NH3 emissions in Northeast Asia from May 2019 to April 2020. The darker red color represents the higher Chinese NH3 emission impacts.
Figure 8.
Simulated monthly NH3 zero-out contributions of Chinese NH3 emissions in Northeast Asia from May 2019 to April 2020. The darker red color represents the higher Chinese NH3 emission impacts.

Figure 9.
Simulated monthly (a) NH3 and (b) total ammonia (NHx) concentrations (black line) and its relative contributions (blue and gray bars) in Samcheon-dong, Korea. The blue bar represents the contribution of NH3 and NHx emissions in China and the gray bar represents the contribution from South Korea.


Table 1.
Concentrations of atmospheric NH3 in various environments.
| Location | Period | Type | NH3 (Mean ± Std) (Unit: ppb) | Reference |
|---|---|---|---|---|
| Jeonju, Korea | May 2019–April 2020 | Urban | 10.5 ± 4.8 | This study |
| Seoul, Korea | October 1996–September 1997 September 2010–August 2011 | Urban | 6.0 10.9 ± 4.25 | Lee et al., 1999 [27] Phan et al., 2013 [23] |
| Shanghai, China | July 2013–September 2014 | Urban Rural Industrial | 6.2 ± 4.6 12.4 ± 9.1 17.6 ± 9 | Wang et al., 2015 [9] |
| Osaka, Japan | February–March 2015 July–September 2015 | Urban | 1.98 ± 0.93 4.21 ± 2.30 | Huy et al., 2017 [22] |
| New Delhi, India | January 2013–December 2015 | Urban | 19.6 ± 3.5 | Saraswati et al., 2019 [36] |
| Ho Chi Minh, Vietnam | May 2015–June 2015 | Urban | 8.34 ± 2.47 | Huy et al., 2017 [22] |
| Ontario, Canada | March 2010–March 2011 | Rural | 4.7 | Zbieranowski and Aherne 2012 [59] |
| Barcelona, Spain | May 2011–September 2011 May 2011–June 2011 | Urban background Urban | 2.9 ± 1.3 7.5 ± 2.8 | Pandolfi et al., 2012 [25] |
| Houston, TX, USA | February 2010–March 2010 August 2010–September 2010 | Urban | 2.4 ± 1.2 3.1 ± 2.9 | Gong et al., 2011 [24] |
Publisher’s Note: MDPI stays neutral with regard to jurisdictional claims in published maps and institutional affiliations. |
© 2021 by the authors. Licensee MDPI, Basel, Switzerland. This article is an open access article distributed under the terms and conditions of the Creative Commons Attribution (CC BY) license (https://creativecommons.org/licenses/by/4.0/).
Share and Cite
MDPI and ACS Style
Park, J.; Kim, E.; Oh, S.; Kim, H.; Kim, S.; Kim, Y.P.; Song, M. Contributions of Ammonia to High Concentrations of PM2.5 in an Urban Area. Atmosphere 2021, 12, 1676. https://0-doi-org.brum.beds.ac.uk/10.3390/atmos12121676
AMA Style
Park J, Kim E, Oh S, Kim H, Kim S, Kim YP, Song M. Contributions of Ammonia to High Concentrations of PM2.5 in an Urban Area. Atmosphere. 2021; 12(12):1676. https://0-doi-org.brum.beds.ac.uk/10.3390/atmos12121676
Chicago/Turabian StylePark, Junsu, Eunhye Kim, Sangmin Oh, Haeri Kim, Soontae Kim, Yong Pyo Kim, and Mijung Song. 2021. "Contributions of Ammonia to High Concentrations of PM2.5 in an Urban Area" Atmosphere 12, no. 12: 1676. https://0-doi-org.brum.beds.ac.uk/10.3390/atmos12121676
Note that from the first issue of 2016, this journal uses article numbers instead of page numbers. See further details here.