Next Article in Journal
Adsorption of Gas-Phase Cyclohexanone on Atmospheric Water Films
Next Article in Special Issue
Changes of Extreme Agro-Climatic Droughts and Their Impacts on Grain Yields in Rain-Fed Agricultural Regions in China over the Past 50 Years
Previous Article in Journal
Four- and Five-Carbon Dicarboxylic Acids Present in Secondary Organic Aerosol Produced from Anthropogenic and Biogenic Volatile Organic Compounds
Previous Article in Special Issue
A Study on the Appropriateness of the Drought Index Estimation Method Using Damage Data from Gyeongsangnamdo, South Korea
 
 
Correction published on 22 February 2022, see Atmosphere 2022, 13(3), 365.
Article

Future Projection of Drought Vulnerability over Northeast Provinces of Iran during 2021–2100

by
Iman Babaeian
1,
Atefeh Erfani Rahmatinia
2,
Alireza Entezari
2,
Mohammad Baaghideh
2,
Mohammad Bannayan Aval
3 and
Maral Habibi
4,*
1
Atmospheric Science and Meteorological Research Center, Climate Research Institute, Tehran 1493845161, Iran
2
Faculty of Geography and Environmental Science, Hakim Sabzevari University, Sabzevar 9617976487, Iran
3
Department of Agronomy, Faculty of Agriculture, Ferdowsi University of Mashhad, Mashhad 9177948974, Iran
4
Department of Geography and Regional Science, University of Graz, 8010 Graz, Austria
*
Author to whom correspondence should be addressed.
Submission received: 14 October 2021 / Revised: 10 December 2021 / Accepted: 17 December 2021 / Published: 20 December 2021 / Corrected: 22 February 2022
(This article belongs to the Special Issue Advances in Drought Monitoring, Simulation and Prediction)

Abstract

:
Future projection of drought vulnerability is vital for northern provinces of Iran, including North Khorasan, Khorasan-Razavi, and South Khorasan, due to the highly dependent of their economy on agriculture. The study is motivated by the fact that no research has been conducted to project the future Drought Vulnerability Index (DVI). DVI consist of three components of exposure, sensitivity, and adaptation capacity. More exposure levels of drought, higher sensitivity value, and lower adaptation capacity lead to a higher amount of vulnerability. Combined ERA-Interim-observation meteorological data, CMIP5 models under RCP4.5 and RCP8.5 scenarios, and national census data are used to estimate DVI in the past and future periods. CanESM2, GFDL-ESM2M, and CNRM-CM5 General Circulation Model (GCM) are selected from CMIP5 based on Taylor diagram results. The delta-change technique was selected for statistical downscaling of GCM outputs because it is most widely used. The study period is regarded as 1986–2005 as observation and four future 20-years periods during 2021–2100. Results indicated that the dissipation of the class of “very low” vulnerability is eminent in the near future period of 2021–2040 under the RCP4.5 scenario, and all provinces would experience a new worse class of “very high” vulnerability at 2081–2100, both under RCP4.5 and RCP8.5 scenarios.

1. Introduction

Global surface temperature will continue to increase until at least the mid-century under all emissions scenarios considered. Each of the last four decades has been successively warmer than any decade that preceded it since 1850. The global surface temperature was 1.09 °C higher in 2011–2020 than in 1850–1900. Compared to 1850–1900, the average global surface temperature over 2081–2100 is very likely to be 1.4 °C under the very low GHG emissions scenario of SSP1-1.9, and by 4.4 °C under the very high Greenhouse Gas (GHG) emissions of Shared Socioeconomic Pathway (SSP) scenario of SSP5-8.5. A key advance in the recent Intergovernmental Panel on Climate Change (IPCC) report is the supporting the best estimate of Equilibrium Climate Sensitivity (ECS) with a likely range of 2.5 to 4 °C is narrower than the AR5 possible range of 1.5 to 4.5 °C [1]. In this regard, in the context of human-induced ongoing changes in climate and environmental systems, the frequency and severity of extreme weather and climate events such as heatwaves, heavy precipitation, droughts, and tropical cyclones with their adverse effects are increasing almost everywhere in the world. Climate change is already affecting every inhabited region globally [1,2,3,4,5,6,7,8,9,10,11]. As global warming increases the frequency and severity of drought, vulnerability to drought is also expected to increase. Therefore, future projection of drought vulnerability is the prerequisite step in any climate change impacts analysis and action plans.
Physiography of Iran can be divided into four regions: Caspian, Central Plateau (Kavir and Lut deserts), Zagros, and the Southern coastal plain. Iran is located in the arid belt, and more than 50 percent of the land area is mountainous, and around 30 percent of the total land area (situated in the central plateau) receives low annual precipitation (50–250 mm). Only the Caspian Plain in the north receives more than 1000 mm per year. The average annual precipitation and temperature are 235 mm and 19.1 °C during 1988–2017, while its potential evaporation is estimated to be more than 4000 mm in the central part of Iran [12,13]. All-weather stations of Iran with precipitation recorded in 1951–2017 have experienced at least two main periods characterized by long and extremely severe drought. In the west and north-west, long periods of severe droughts occurred during 1999–2017. In the Central Plateau, the stations show extremely severe drought in the past decade. East of the Caspian Sea, an extremely severe drought condition was indicated in 2008 and 2014. There was a severe drought in the southeast from 1999 to 2005. country’s northeast shows the change of climate type from semi-arid to arid. Over Iran, studies show that under different climate change scenarios, the average temperature will increase to about 2.4–4.8 °C over the 2071–2100 period, accompanied by a relative decrease in precipitation by +2% to −10%, while increasing the temperature will lead to a significant increase in annual evapotranspiration, drought frequency and severity [14,15,16]. The northeast of Iran has also been experiencing extreme climatic events, such as heatwaves, droughts, flash flood rainfalls, dust storms, rising mean temperature, evapotranspiration, and decreasing precipitation. The mean average temperature and evapotranspiration are expected to increase by 2.4–5.8 °C and 9.8–18.9% in 2081–2100. Meanwhile, future projection of precipitation is relatively uncertain and ranges from 0.1 to −14.8% during the same period [17,18,19,20,21]. Many kinds of research also confirm the increasing global mean and extreme climatic events under global warming effects [22,23].
Drought can simultaneously be a current hazard, directly and indirectly, influence future vulnerability [24]. Drought develops slowly; its main characteristics, such as the onset, duration, and severity, are not easily quantified [25]. Droughts can be typically divided into four types: meteorological, hydrological, agricultural, and socioeconomic droughts, depending on various hydrological cycle deficits [26]. The complex nature of droughts makes them one of the most challenging climate hazards to perceive. For example, hydrological drought is closely related to human activities, such as irrigation. Thus accurate prediction necessitates the modeling of human activities. Other recurrent weather-related hazards such as heatwaves, floods, and windstorms can be skillfully forecasted in some instances [27]. Droughts are among the costliest natural hazards in the world. The severity of the hazard is closely related to a region’s ability to cope and recover from the event, an ability that depends on the region’s sensitivity and adaptive capacity [21]. The drought vulnerability in each region is directly related to the region’s level of exposure, adaptation, infrastructure, economic and social sensitivity [22]. Reducing drought vulnerability is a basis for sustainable development in agriculture, water, and society.
Many drought vulnerability methods have been used worldwide, ranging from simple equal weighting to more sophisticated weighting techniques. From 1978 to 2018, agricultural drought vulnerability using the entropy weight method showed a decreasing trend in China, with less vulnerable to mildly vulnerable cities and less highly vulnerable cities. At the same time, there is a trend where highly vulnerable cities have been converted to mildly vulnerable cities, whereas mildly vulnerable cities have been converted to less vulnerable cities [28]. Investigation of spatial characteristics of drought vulnerability in China showed that the level of vulnerability in southern and eastern China would be in the low to medium range on a regional scale, while the highest vulnerability level is expected in northern and western China [29]. The most important factor on drought vulnerability in Greece using the Standardized Drought Vulnerability Index (SDVI) and the Environmentally Sensitive Areas Index (ESAI) is the deficits in water resources, either due to lower than usually expected rainfall or to higher societal water demand [30]. Drought vulnerability over Mexican was computed based on a set of socioeconomic and environmental indicators that the method combines using an objective analytic procedure that identifies the most vulnerable states and municipalities from social, economic, and environmental perspectives, all of which converge in overall vulnerability to drought. The results indicated that 38.9% of the Mexican population inhabits municipalities with high and very high degrees of overall vulnerability to drought. In this regard, it is necessary to continue implementing actions and preventive and mitigation strategies via public policies and social programs to decrease the country’s vulnerability to the occurrence of drought events [31]. The vulnerability to the drought of each state within the contiguous U.S. is assessed as a function of exposure, sensitivity, and adaptive capacity, using socio-economic, climatic, and environmental indicators. The resulting geographic distribution of relative vulnerability of the states is partially a reflection of their heterogeneous climates. It highlights the importance of sustainable adaptation of the local economy to water availability to reduce sensitivity and limit the impact of drought. As such, the study at handovers insights to local and regional planners on how to effectively distribute funds and plan accordingly to reduce state-level drought vulnerability today and in the future [22]. Socioeconomic factors over 81 provinces of Turkey were also used to estimate Drought Vulnerability Index (DVI) [32].
There is abundant literature on the future projection of weather and climate extremes, with less emphasis on how climate change alters future drought vulnerability over Iran and especially over the northeast part, which consists of three provinces of north, south, and central Khorasan. The projected increases in dry days and precipitation over short durations throughout a year under future climate scenarios would produce changes in drought and flood periods and ultimately impact the frequency and severity of hydrological droughts in the Central Desert Basin of Iran. Under RCP4.5, an increase in the frequencies of moderate and severe meteorological/hydrological droughts would further affect the basin. Under RCP2.6 and RCP8.5, the frequencies of severe and extreme droughts would increase, but the drought area would be smaller than that under RCP4.5, demonstrating less severe drought conditions [33]. Zarafshan et al. [34] provided a conceptual framework for drought vulnerability and modeled pre- and post-drought vulnerabilities. The results showed that farmers’ vulnerability in western Iran is related to their socioeconomic structures and infrastructure. To develop the Climate Vulnerability Index (VCI), a five-year VCI was calculated by Ahmadi et al. [35] on a county scale over Sistan- Baluchistan province in the east of Iran. The results showed that although the province’s adaptation capacity has increased compared to before, the vulnerability rate has increased by 16.3% due to increased exposure and climate sensitivity. The number of very vulnerable areas has increased from 57.5% to 100% of the whole province, indicating the spatial expansion of vulnerability.
In future climate change, prolonged and intense drought will affect more expansive areas in Iran. Consequently, steps must be taken to monitor, predict, and adapt to drought in the region. A comprehensive drought management system requires sufficient information from different parts of the region and sufficient knowledge of the dangers and harmful effects of drought and the vulnerability of the study area to appropriate reactions and decisions to reduce the risks and damages. Understanding drought vulnerability is the first step in implementing comprehensive drought management [36,37,38]. Due to the economy being mainly dependent on agriculture in the northeastern provinces of Iran and the region’s increasing migration from neighboring areas inside Iran and neighboring countries due to widespread drought and political tensions, understanding current and future drought vulnerability in the region is essential for sustainable development. This study aims to provide a perspective of the 21st century Drought Vulnerability Index (DVI) in the study area under IPCC-RCP scenarios. For this purpose, climatological data from the meteorological organization and socioeconomically data from budget and planning organizations have been used.

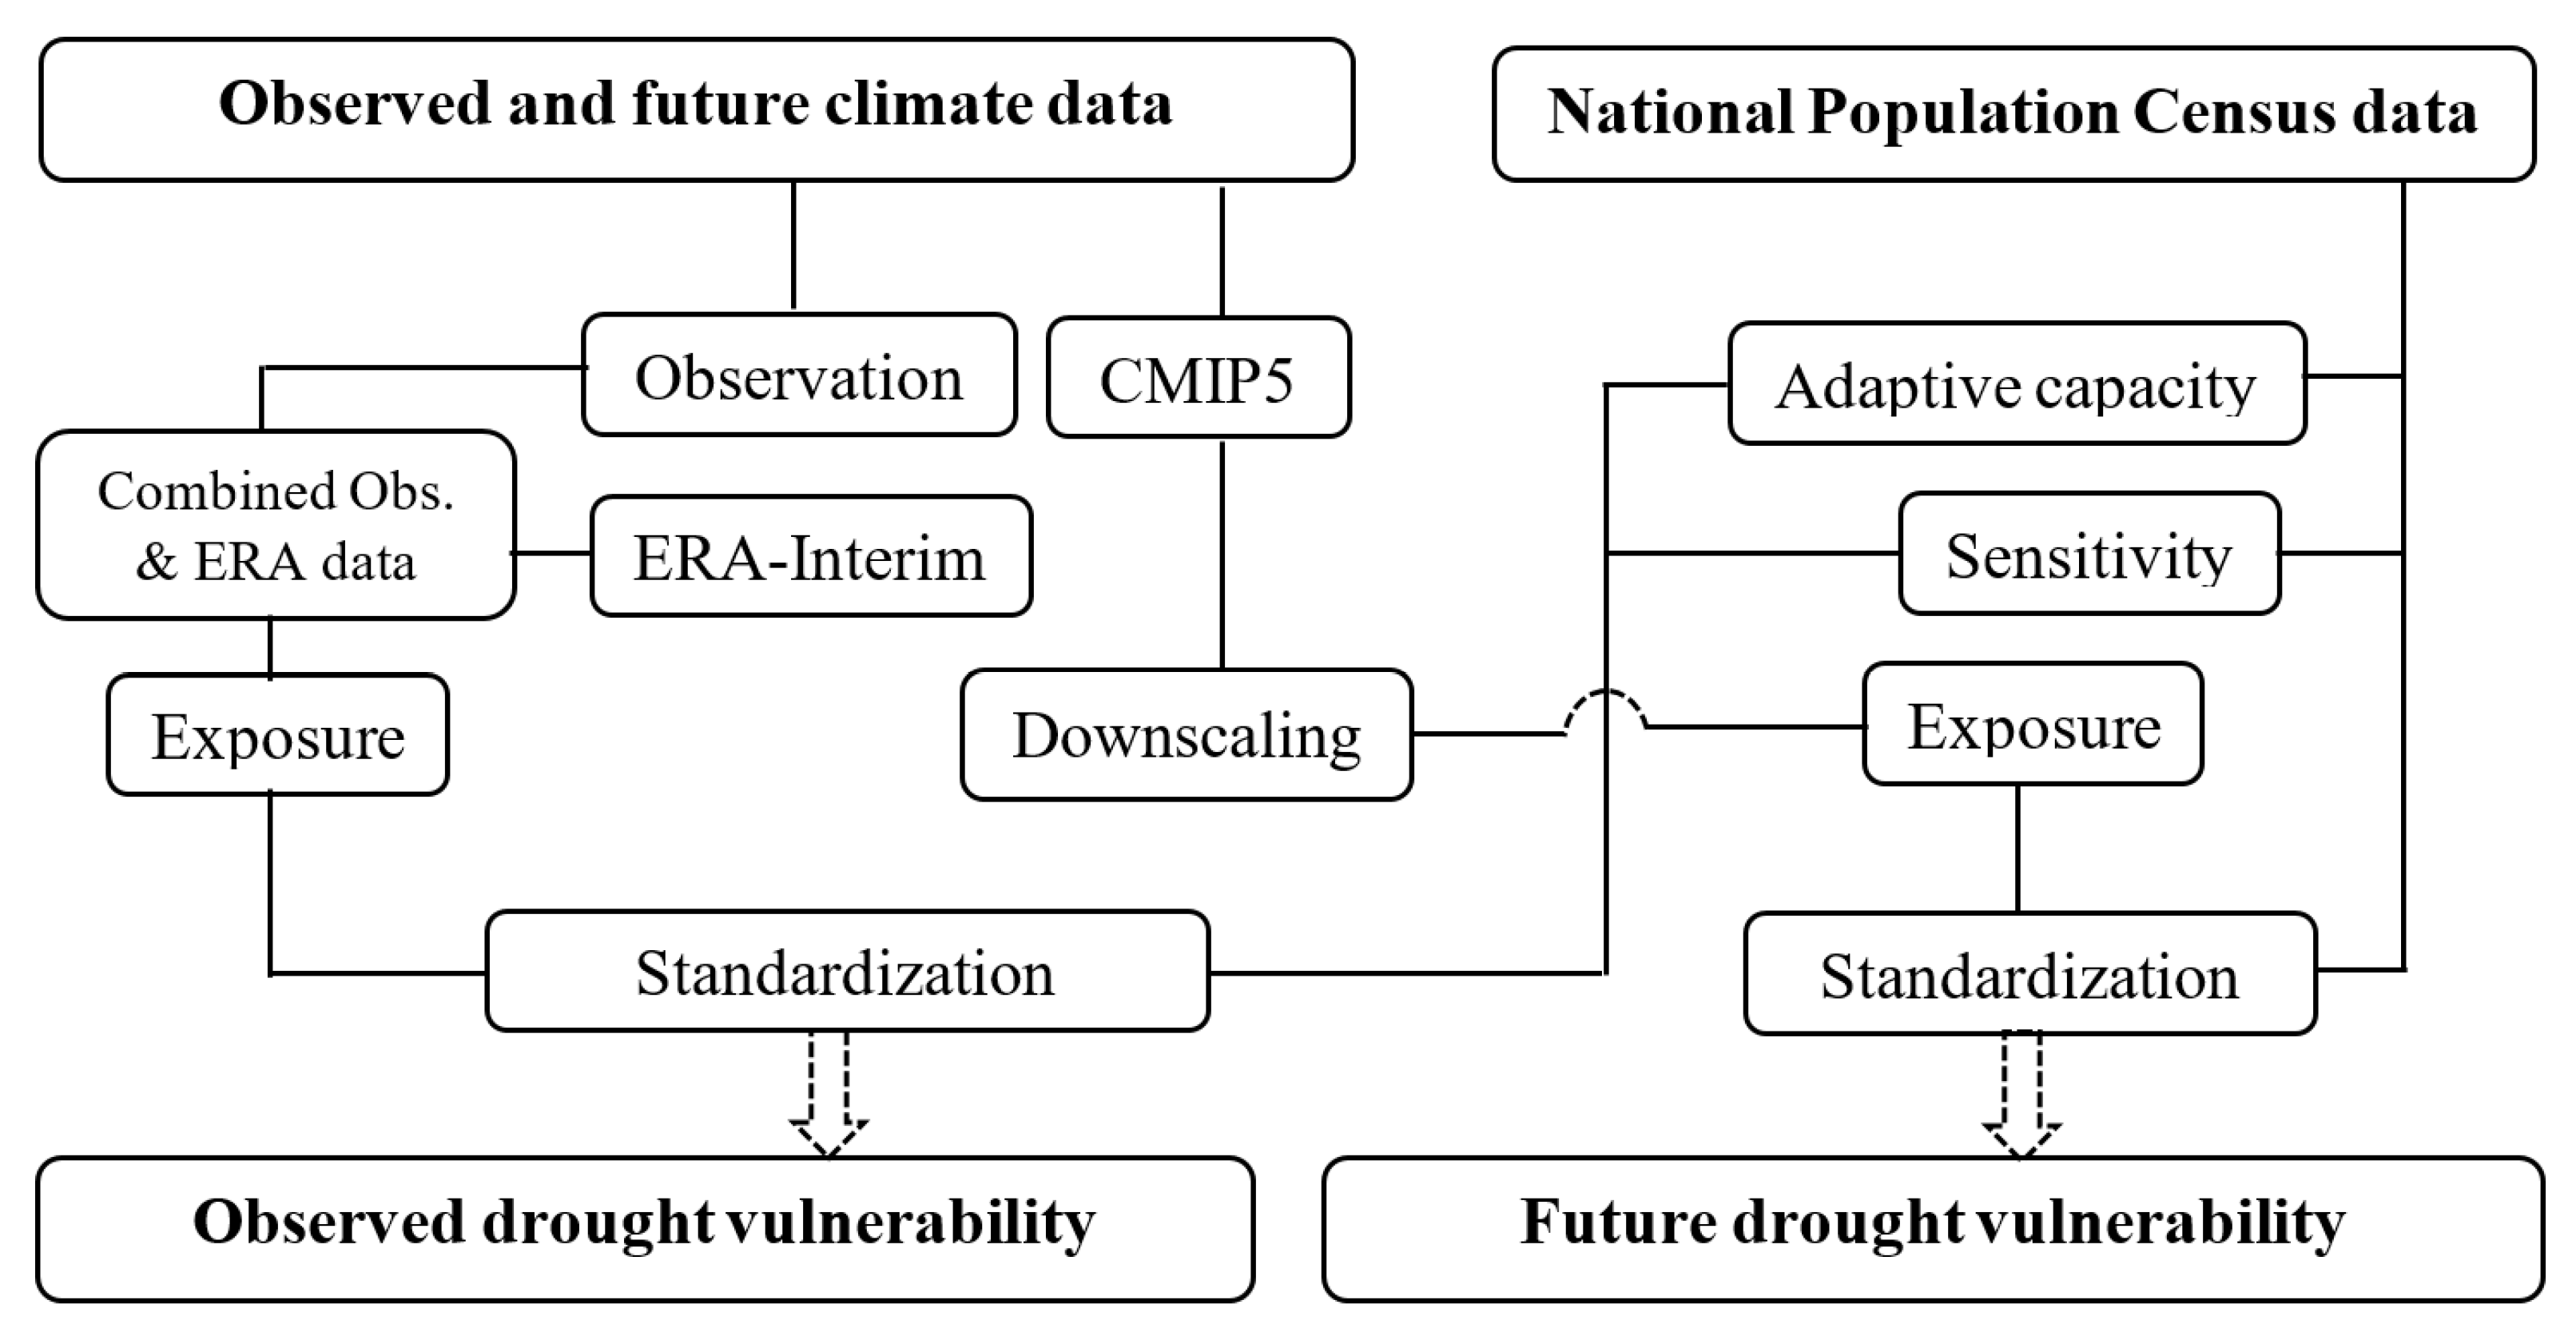
2. Materials and Methods

Figure 1 illustrates the overview of the research plan and methodology used in this study. Three input datasets describing the observed climate, future climate, and national population census data were used. A combined observation-ERA interim database was developed due to some counties’ lack of weather stations or missed data.
Future Exposure (E) of drought calculated using observed and downscaled CMIP5 data. The national population census data were used for each county to estimate sensitivity (S) and Adaptive Capacity (AD). All components of exposure, sensitivity and adaptive capacity were standardized to estimate Drought Vulnerability Index. Details will be explained in the methodology section.

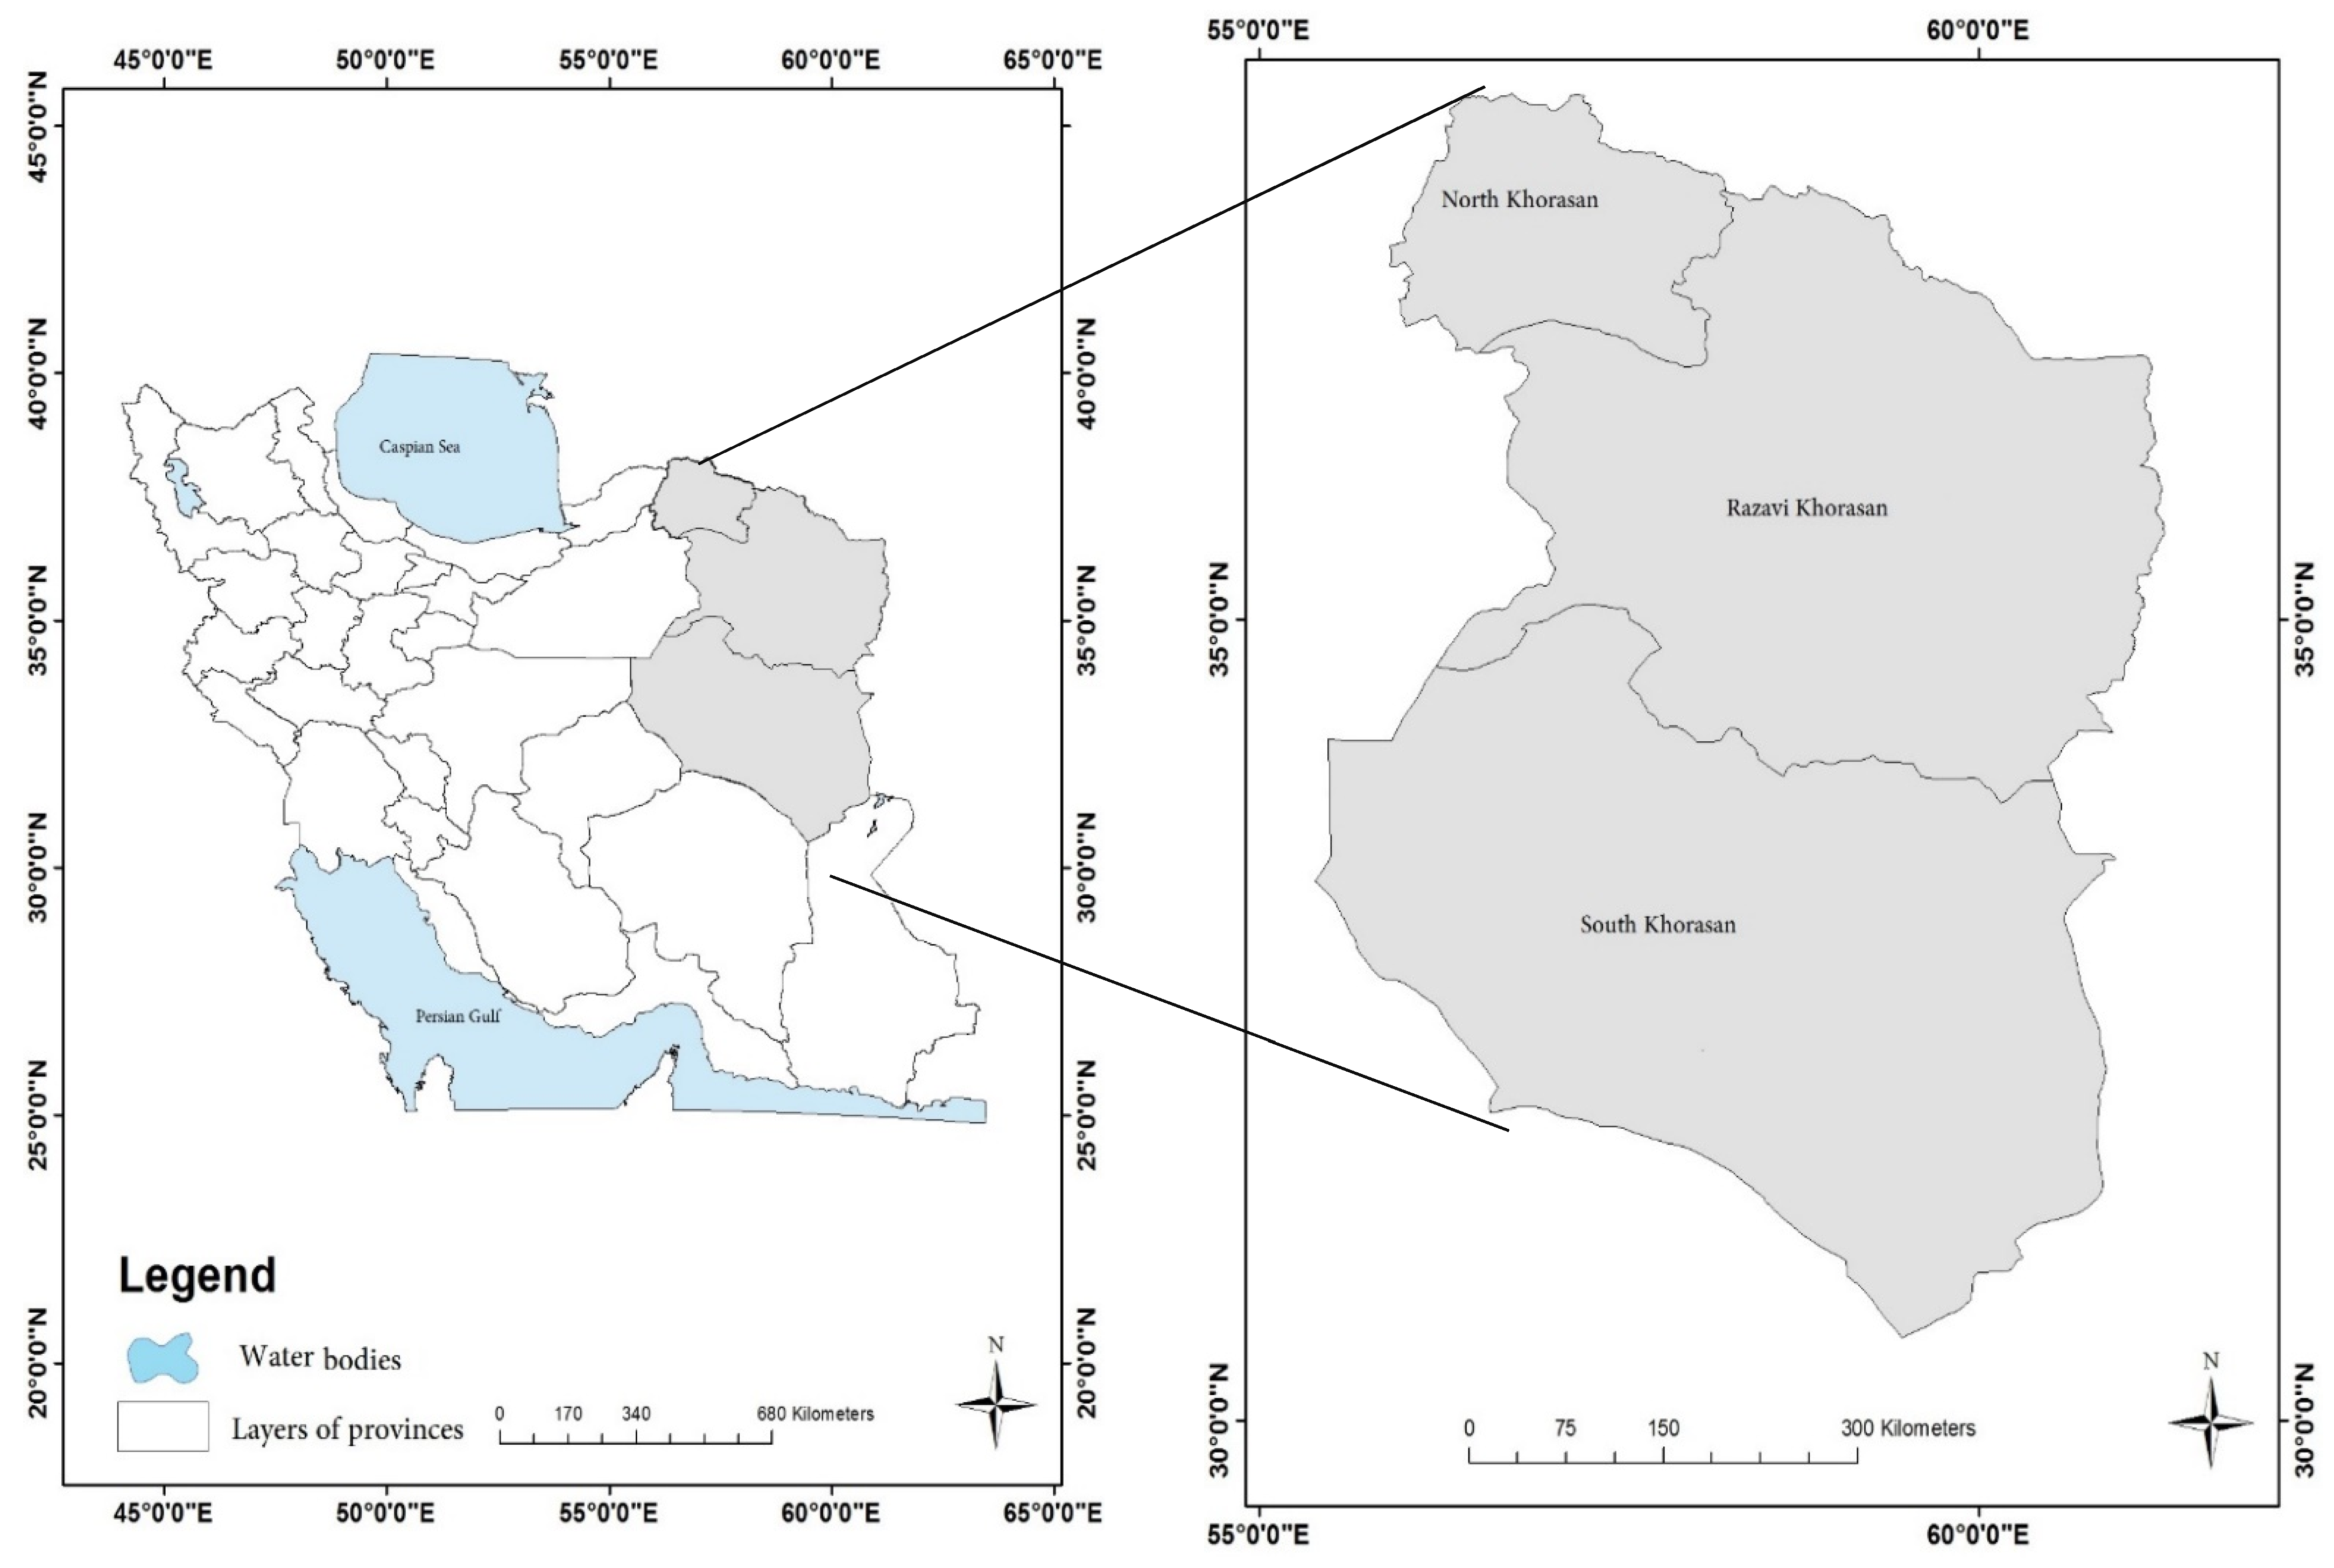
2.1. Area and Period of Study
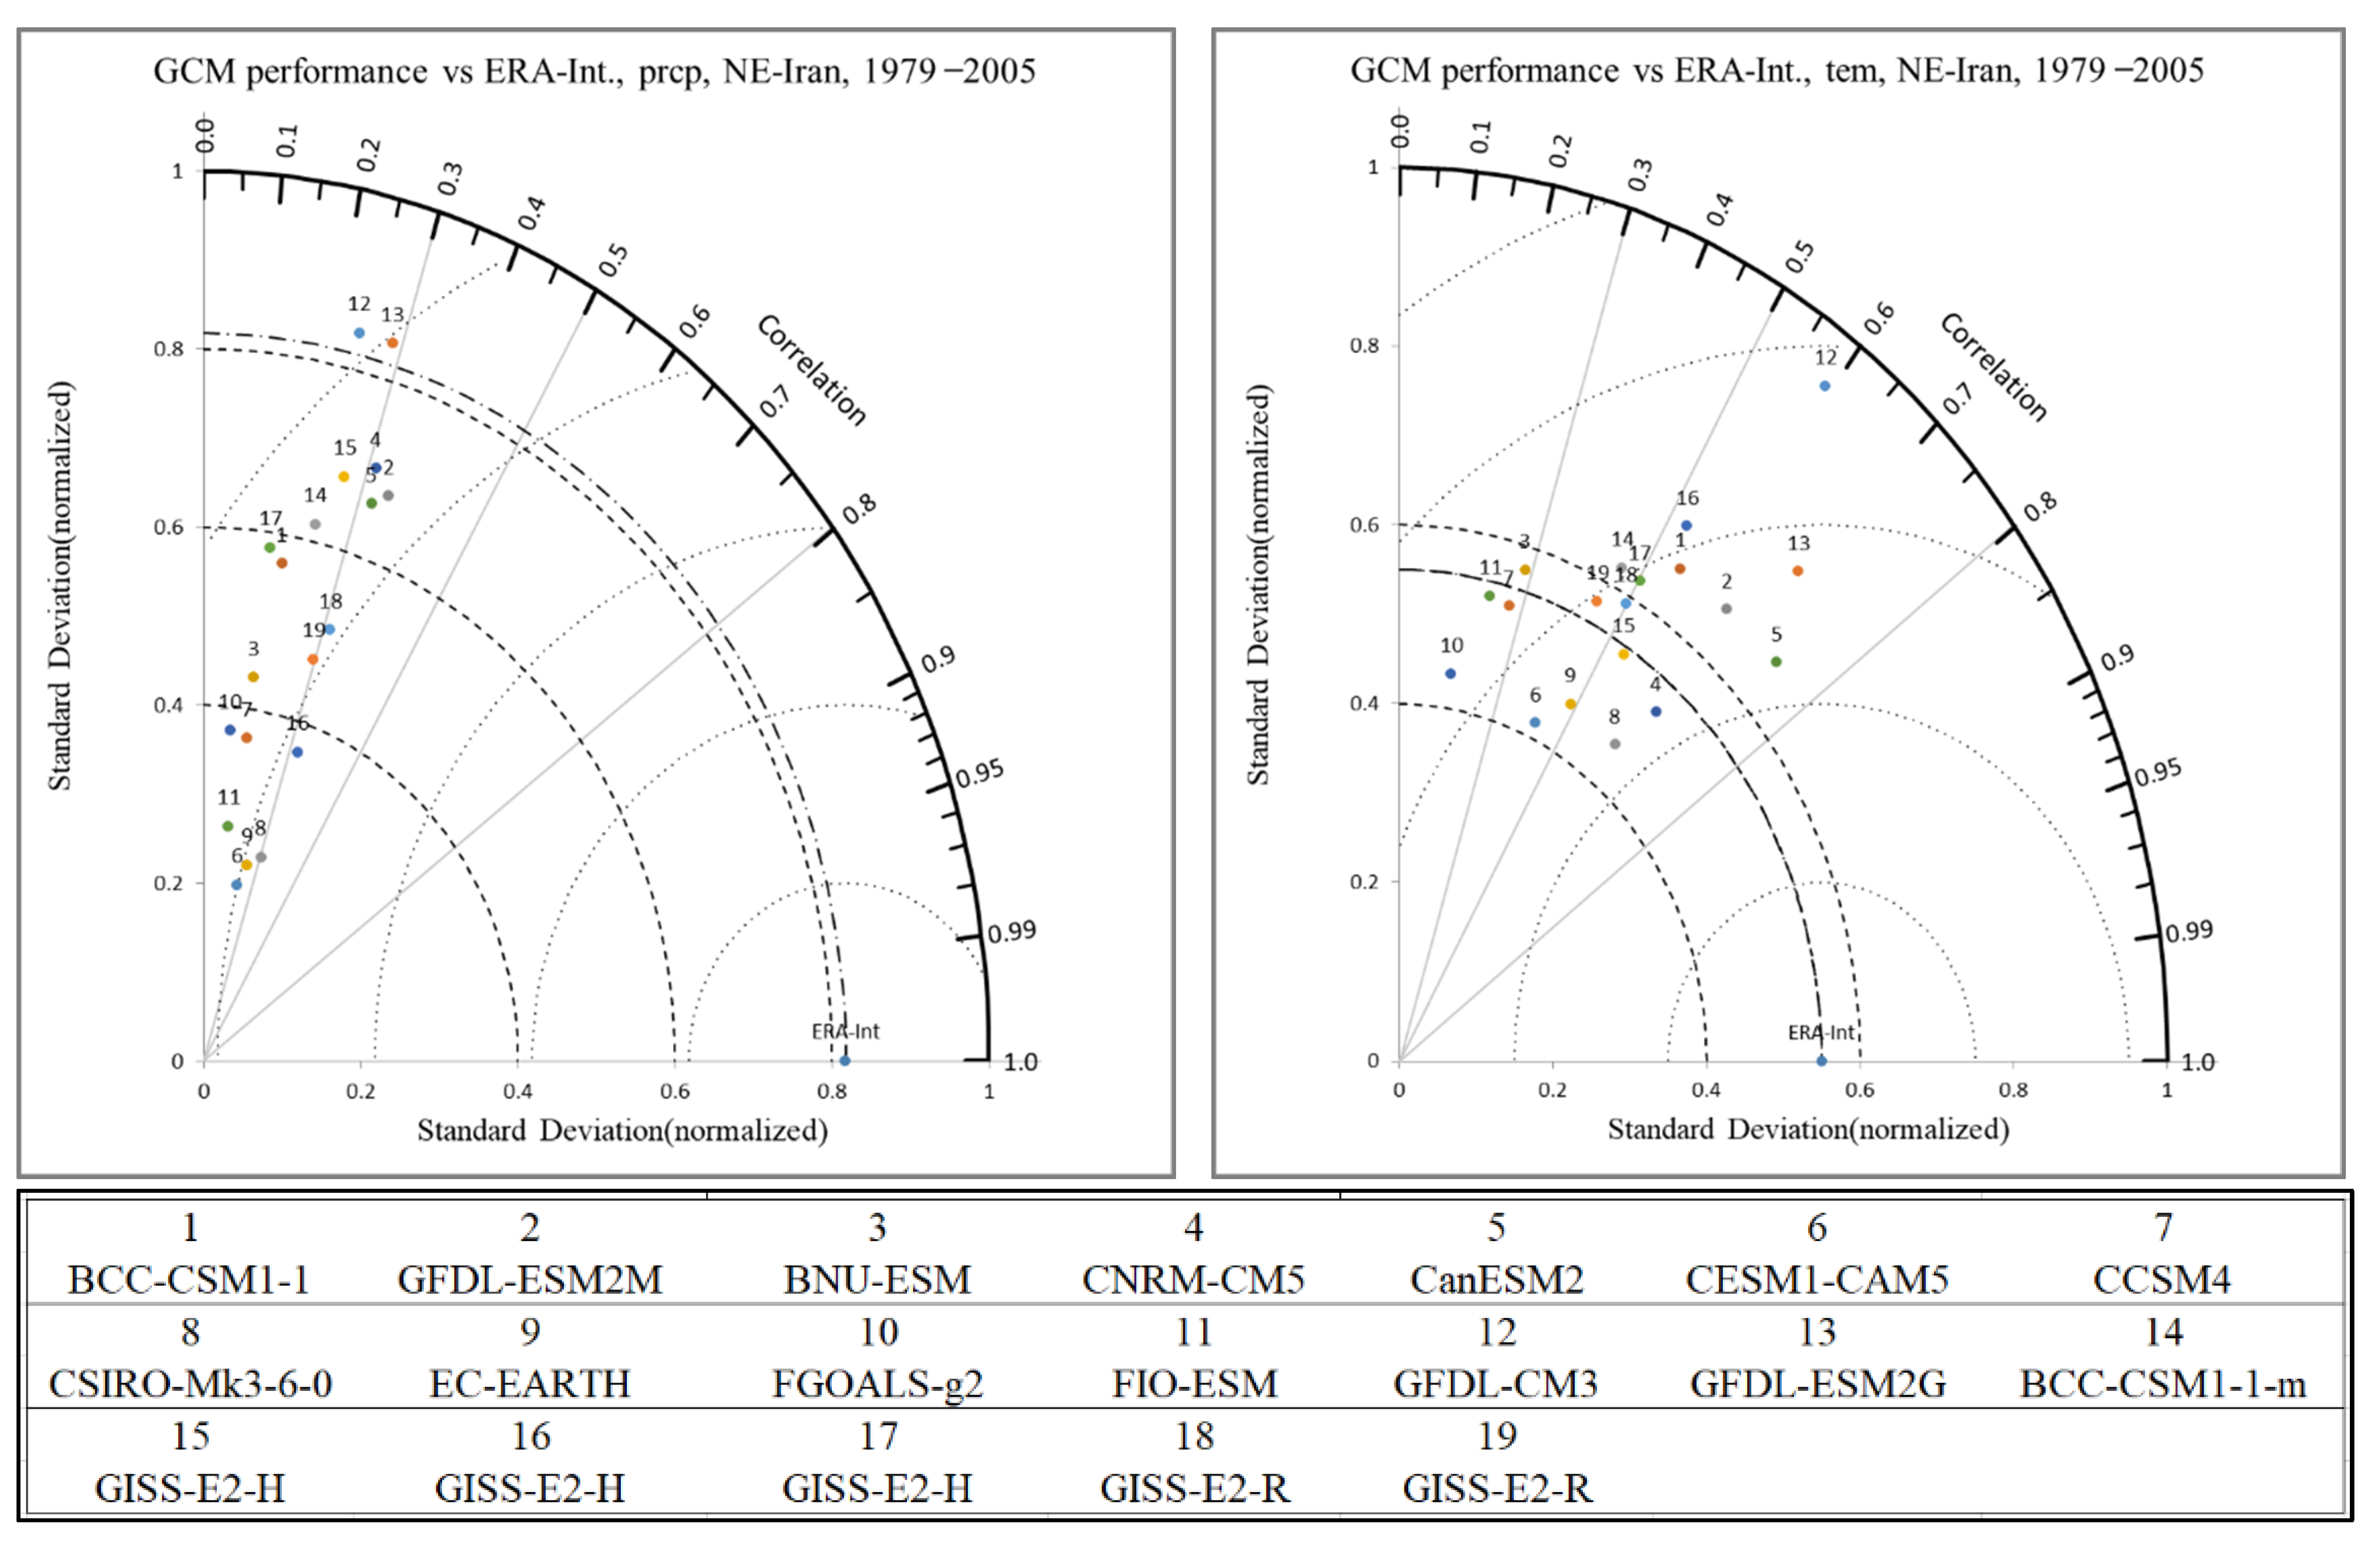
The study area covers three provinces of Iran, including Khorasan-Razavi, North Khorasan, and South Khorasan, which is situated in the latitudes between 30.4 and 37.8 north and longitudes between 55.3 and 61.3 east in west Asia. The region has bordered Afghanistan on the east side and Turkmenistan on the north side. The southern and eastern border of the area is demarcated mainly by two extensive deserts of Lut and Dasht-e-Kavir (Figure 2). This area’s southern and western parts are mainly desert land with annual precipitation around 100 mm. The mentioned provinces have been experienced moderate-severe drought during the past two decades. Drought and other natural disasters such as floods, dust, and sandstorms have mainly affected agriculture, livestock, rangelands, and soil of the region. The study period is considered 1985–2006 as observation, and 2021–2100 as the future projection period.

2.2. Data

Four types of data were used in this study, including: (1) meteorological observation from weather counties, (2) ERA-Interim reanalysis data, (3) socioeconomic data prepared by the National Planning and Budget Organization, and (4) The output of CMIP5 model under RCP4.5 and RCP8.5 scenarios. Meteorological data for cities without meteorological stations or substantial gaps were estimated using a bias-corrected ERA-Interim 0.125 × 0.125-degree resolution dataset. ERA-interim were used for those counties which have no meteorological stations. Performance of ERA-Interim data has already been confirmed over Iran [39]. CMIP5 global climate models of CanESM2, GFDL-ESM2M, and CNRM-CM5, shown in Table 1, are considered for future precipitation and temperature projection over the region. CMIP5 data were prepared for the historical period of 1986–2005 and the future period of 2021–2100 under RCP4.5 and RCP8.5 scenarios. Socioeconomic data needed to estimate adaptation capacity and sensitivity were received from the National Planning and Budget Organization (NPBO) based on the two most recent national censuses. The socioeconomic data covers per capita income, percentage of people covered by insurance, percentage of unemployed people, percentage of people working in the agriculture sector, area of agriculture land, water demand, number of hospital beds, length of highways, and railways, so on.

2.3. Statistical Downscaling

The delta-change technique was selected for statistical downscaling of GCM outputs because it is most widely used [40,41]. The delta change technique is easy to apply (one needs to apply a coefficient to historical time series) and preserve important statistical characteristics (spatial correlations, interdependence) in downscaled time series. Its main limitation is that it does not allow for a change in variance in the future and misses the risk generated by a possible change in climate variables distributions in the future [42]. However, in this method, the variance of future data is at least equal to the observation period. The delta change method applies differences (relative changes) of simulated current and future climate conditions from a GCM added to observed time series of temperature (precipitation), using the following equations [43,44,45].
Δ p i = [   p ¯ GCM , Fut , i   p ¯ GCM , bais , i ]
Δ T i = (   T ¯ GCM , fut , i   T ¯ GCM , bais , i )
T = T obs + Δ T
p = p obs   × Δ p
where Δ T i and Δ p i represent the delta change scenario, which is additive for temperature and multiplicative for precipitation, respectively.   p ¯ GCM , Fut , i .   and   T ¯ GCM , fut , i indicate the precipitation and temperature output of the GCM model for the future period,   p ¯ GCM , bais , i is the precipitation corresponding to the historical period of the same model.     T obs and p obs   are the mean observed monthly temperature and precipitation from 1986 to 2005, respectively, P and T are the downscaled precipitation and temperature for the future period.

2.4. Exposure (E)

Exposure is the level of drought intensity in the region measured by the Standard Precipitation Evapotranspiration Index (SPEI), as a meteorological drought index. This is determined using monthly precipitation and temperature from 1986 to 2005. Procedure computing SPEI is explained by which was introduced by Vicente Serrano et. al. [46] as bellow:
The water balance equation is defined as the following equation:
D i = P i PET i
where P and PET are the precipitation and Evapotranspiration, respectively, D is their difference, and i is the desired month number. After calculating the D values, an approach like the Standard Precipitation Index (SPI) calculates the SPEI. For this purpose, D’s sequential values in different windows are first calculated; If x is the cumulative series of D in a given window, a suitable probability distribution fits on the x series in the next step. The log-logistic distribution can well model x -series [46]. The distribution form density function is expressed as follows:
f ( x ) β α ( x Υ α ) β 1 [ 1 + ( x Υ α ) β ] 2
where α, β, and Υ are scale, shape and origin, and, x is the cumulative series D in a given window. Drought thresholds are shown in Table 2. In this study, classifications were divided into sub-classes to capture county’s exposure in detail.

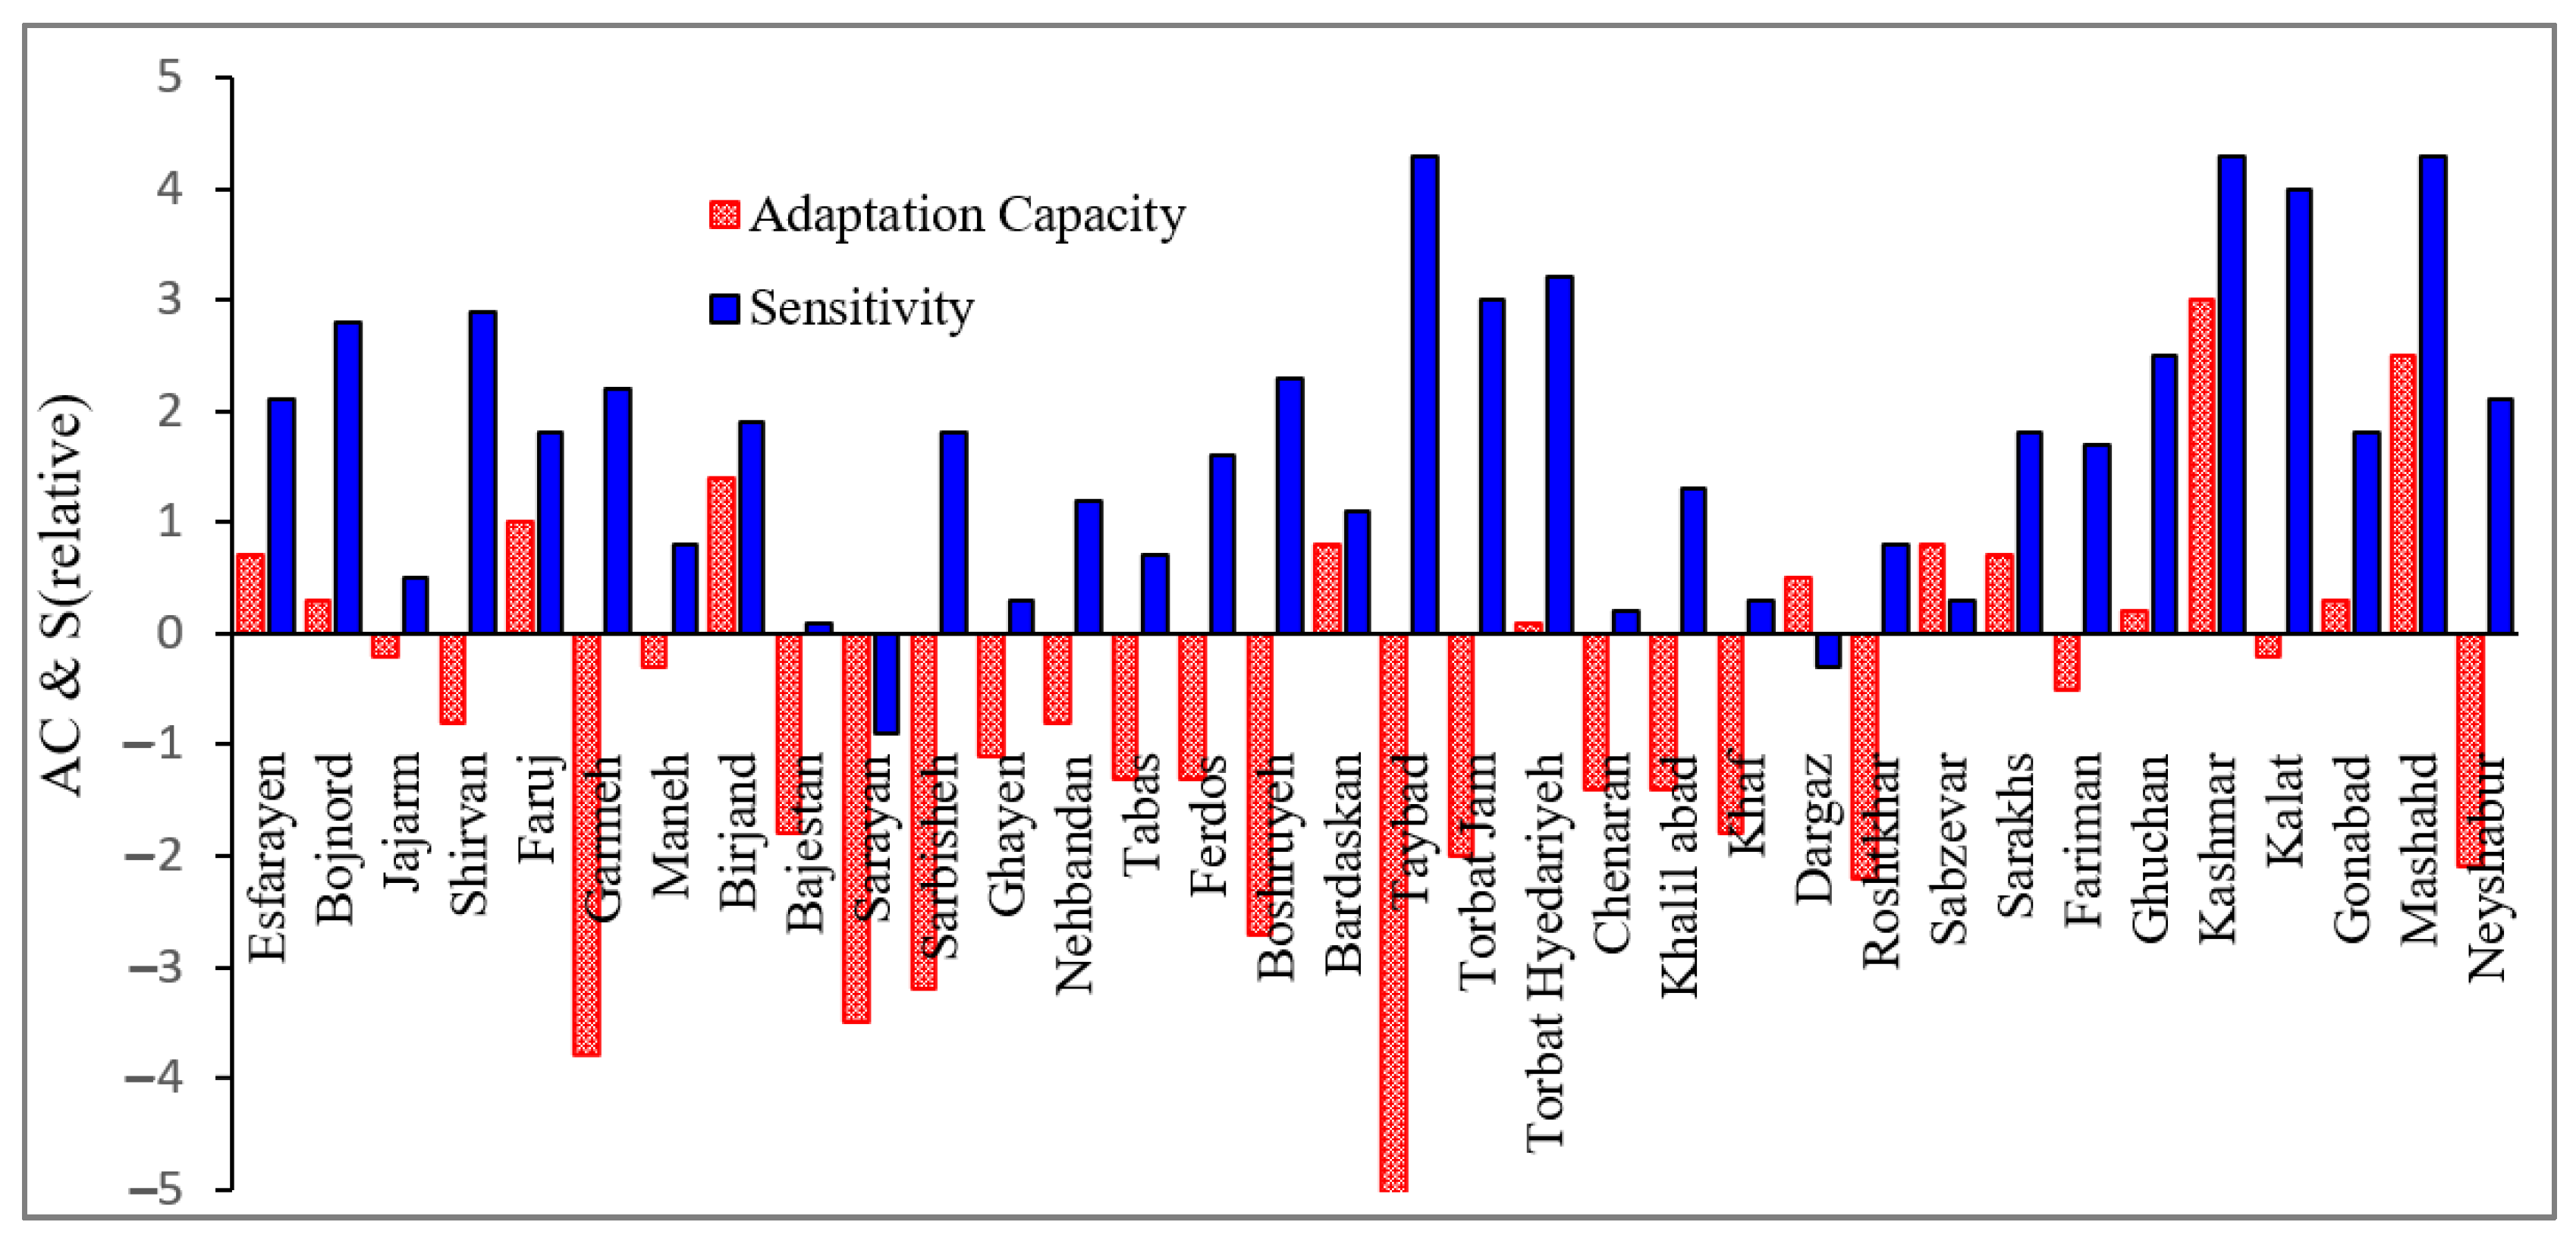
2.5. Sensitivity (S)

Sensitivity is the socioeconomic frailty of society, represented by indicators such as human insecurity, dependence, illiteracy, social inequality, unemployment, inflation, debt, and environmental degradation. These indicators reflect relative weaknesses or deterioration conditions that aggravate the direct effects of dangerous phenomena. Even if these effects are not necessarily cumulative and could sometimes be considered redundant or correlated, they are important in the economic and social context [47]. Table 3 presents main sensitivity indicators, related sub-indicators with a simple expression of their relationship to the vulnerability index. For example, the number of vulnerable people with age less than 15 and older than 64-year-old is increasing, which causes the sensitivity component to increase. At the same time, a higher amount of employment is a factor decreasing sensitivity to drought.

2.6. Adaptive Capacity (AC)

The Adaptive Capacity (AC) component reflects the ability of a county/province and its population to adapt to and recover from drought when it occurs. Indicators include both the economic strength of the county, but also regional policies and private mitigation strategies [22]. Vulnerability varies from one region to another due to diverse economic and social influences [34]. Thus, some groups suffer more than other groups in the community. This difference in vulnerability is due to different individuals (e.g., gender, age, education, attitude), socioeconomic (e.g., social class, access to resources, income diversification, availability of social insurance, education, infrastructural constraints, poor technology, water resource, and access to infrastructural sources and public services). To take into account the maximum indicators affecting adaptive capacity over three regions under study, and by considering the limitations of the types of data available from the national department of Management and Planning Organization (MPO) of Iran, the most important indicators expressing socioeconomic conditions and infrastructure of each county are listed in Table 4. The table shows the simple relationship of each indicator to vulnerability; for example, the amount of forecast area and water withdrawal from groundwater increases the total vulnerability. The strong economy, income, and robust infrastructure such as having an airport and more railway transportation make a county less vulnerable to drought. It is more likely to have the infrastructure and financial muscles to mitigate and recover from the drought hazard than a county with limited infrastructure financial means-the lower the literate population, the lower the society’s degree of adaptation. In Table 4, the arrow direction in the last column shows each indicator’s increasing or decreasing effect.

2.7. Drought Vulnerability Index (DVI)

While there are numerous definitions for vulnerability, a specific definition of vulnerability may not be justified. The scientific use of “vulnerability” has roots in geography and natural hazards research. Still, this term is now a central concept in various other research contexts such as agriculture, ecology, public health, poverty and development, secure livelihoods and famine, sustainability science, land change, climate impacts, and adaptation [34]. The relative Drought Vulnerability Index (DVI) consists of three components of Exposure (E), Sensitivity (S), and Adaptation Capacity (AC). E is the level of exposure shown here by the SPEI drought index, S and AC are the degree of sensitivity and potential of adaptation capacity of each county, respectively. All three components were explained before. The total vulnerability caused by drought is shown in the following equation [29]. Based on Equation (7), exposure and sensitivity are directly related to vulnerability, while adaptive capacity reduces it.
DVI = E + S + ( 1 AC ) 3
Each county’s 12-monthly SPEI drought index is considered the level of drought exposure, both in the historical period of 1986–2005 and future projected periods of 2021–2040, 2041–2060, 2061–2080, and 2081–2100. The indicators of exposure, sensitivity and adaptive capacity have different scales. Once their positive or negative impact on vulnerability to drought was identified, values were scaled to 0–100 standards using the United Nations Development Program method [47]. For those indicators having a direct relationship with vulnerability, the following equation is used:
X i = 100 × ( x i x m a x m m a x x m i n )
However, for the indicators having an inverse relationship with vulnerability, the following equation is used:
X i = 100 × ( x m a x x i m m a x x m i n )
Both equations are the scaled value of the variable and are the minimum and maximum values of the dataset, respectively [31]. Vulnerability indices were classified into five equally sized categories, which defined five degrees of vulnerability, as shown in Table 5.

3. Results

As shown in Figure 3, 19 model data were downloaded from Erath System Grid Federation (ESGF) portal, which is available at: https://esgf-node.llnl.gov, accessed on 10 March 2019. Performance of the models mentioned above in simulation of precipitation (temperature) during the past period as shown in the left (right) panel of Figure 3 using the Taylor diagram. Results showed that the variability of precipitation data in most models is less than the observation, while in the case of temperature, the variability of most models is closer to the observational variability. Among all GCMs with available data, three GCMs of CanESM2, GFDL-ESM2M, and CNRM-CM5, which had a higher rank in Taylor diagrams of precipitation and temperature, were selected for this study. The ranks of GCMs were estimated by comparing historical outputs of GCMs with ERA-Interim data during 1979–2005.
The amount of exposure, represented by SPEI drought index, has an important role in estimating drought vulnerability. In this regard, individual weight for each GCM is calculated by incorporating their inverse RMSE error in the historical period. Then, a multi-model weighting averaging has been applied to calibrate the historical SPEI index by considering the weight of each model. It was observed that the correlation obtained from the weighting method is higher than the individual models, and the root mean square error of multi-model weighting is the smallest among all individual models (Table 6).

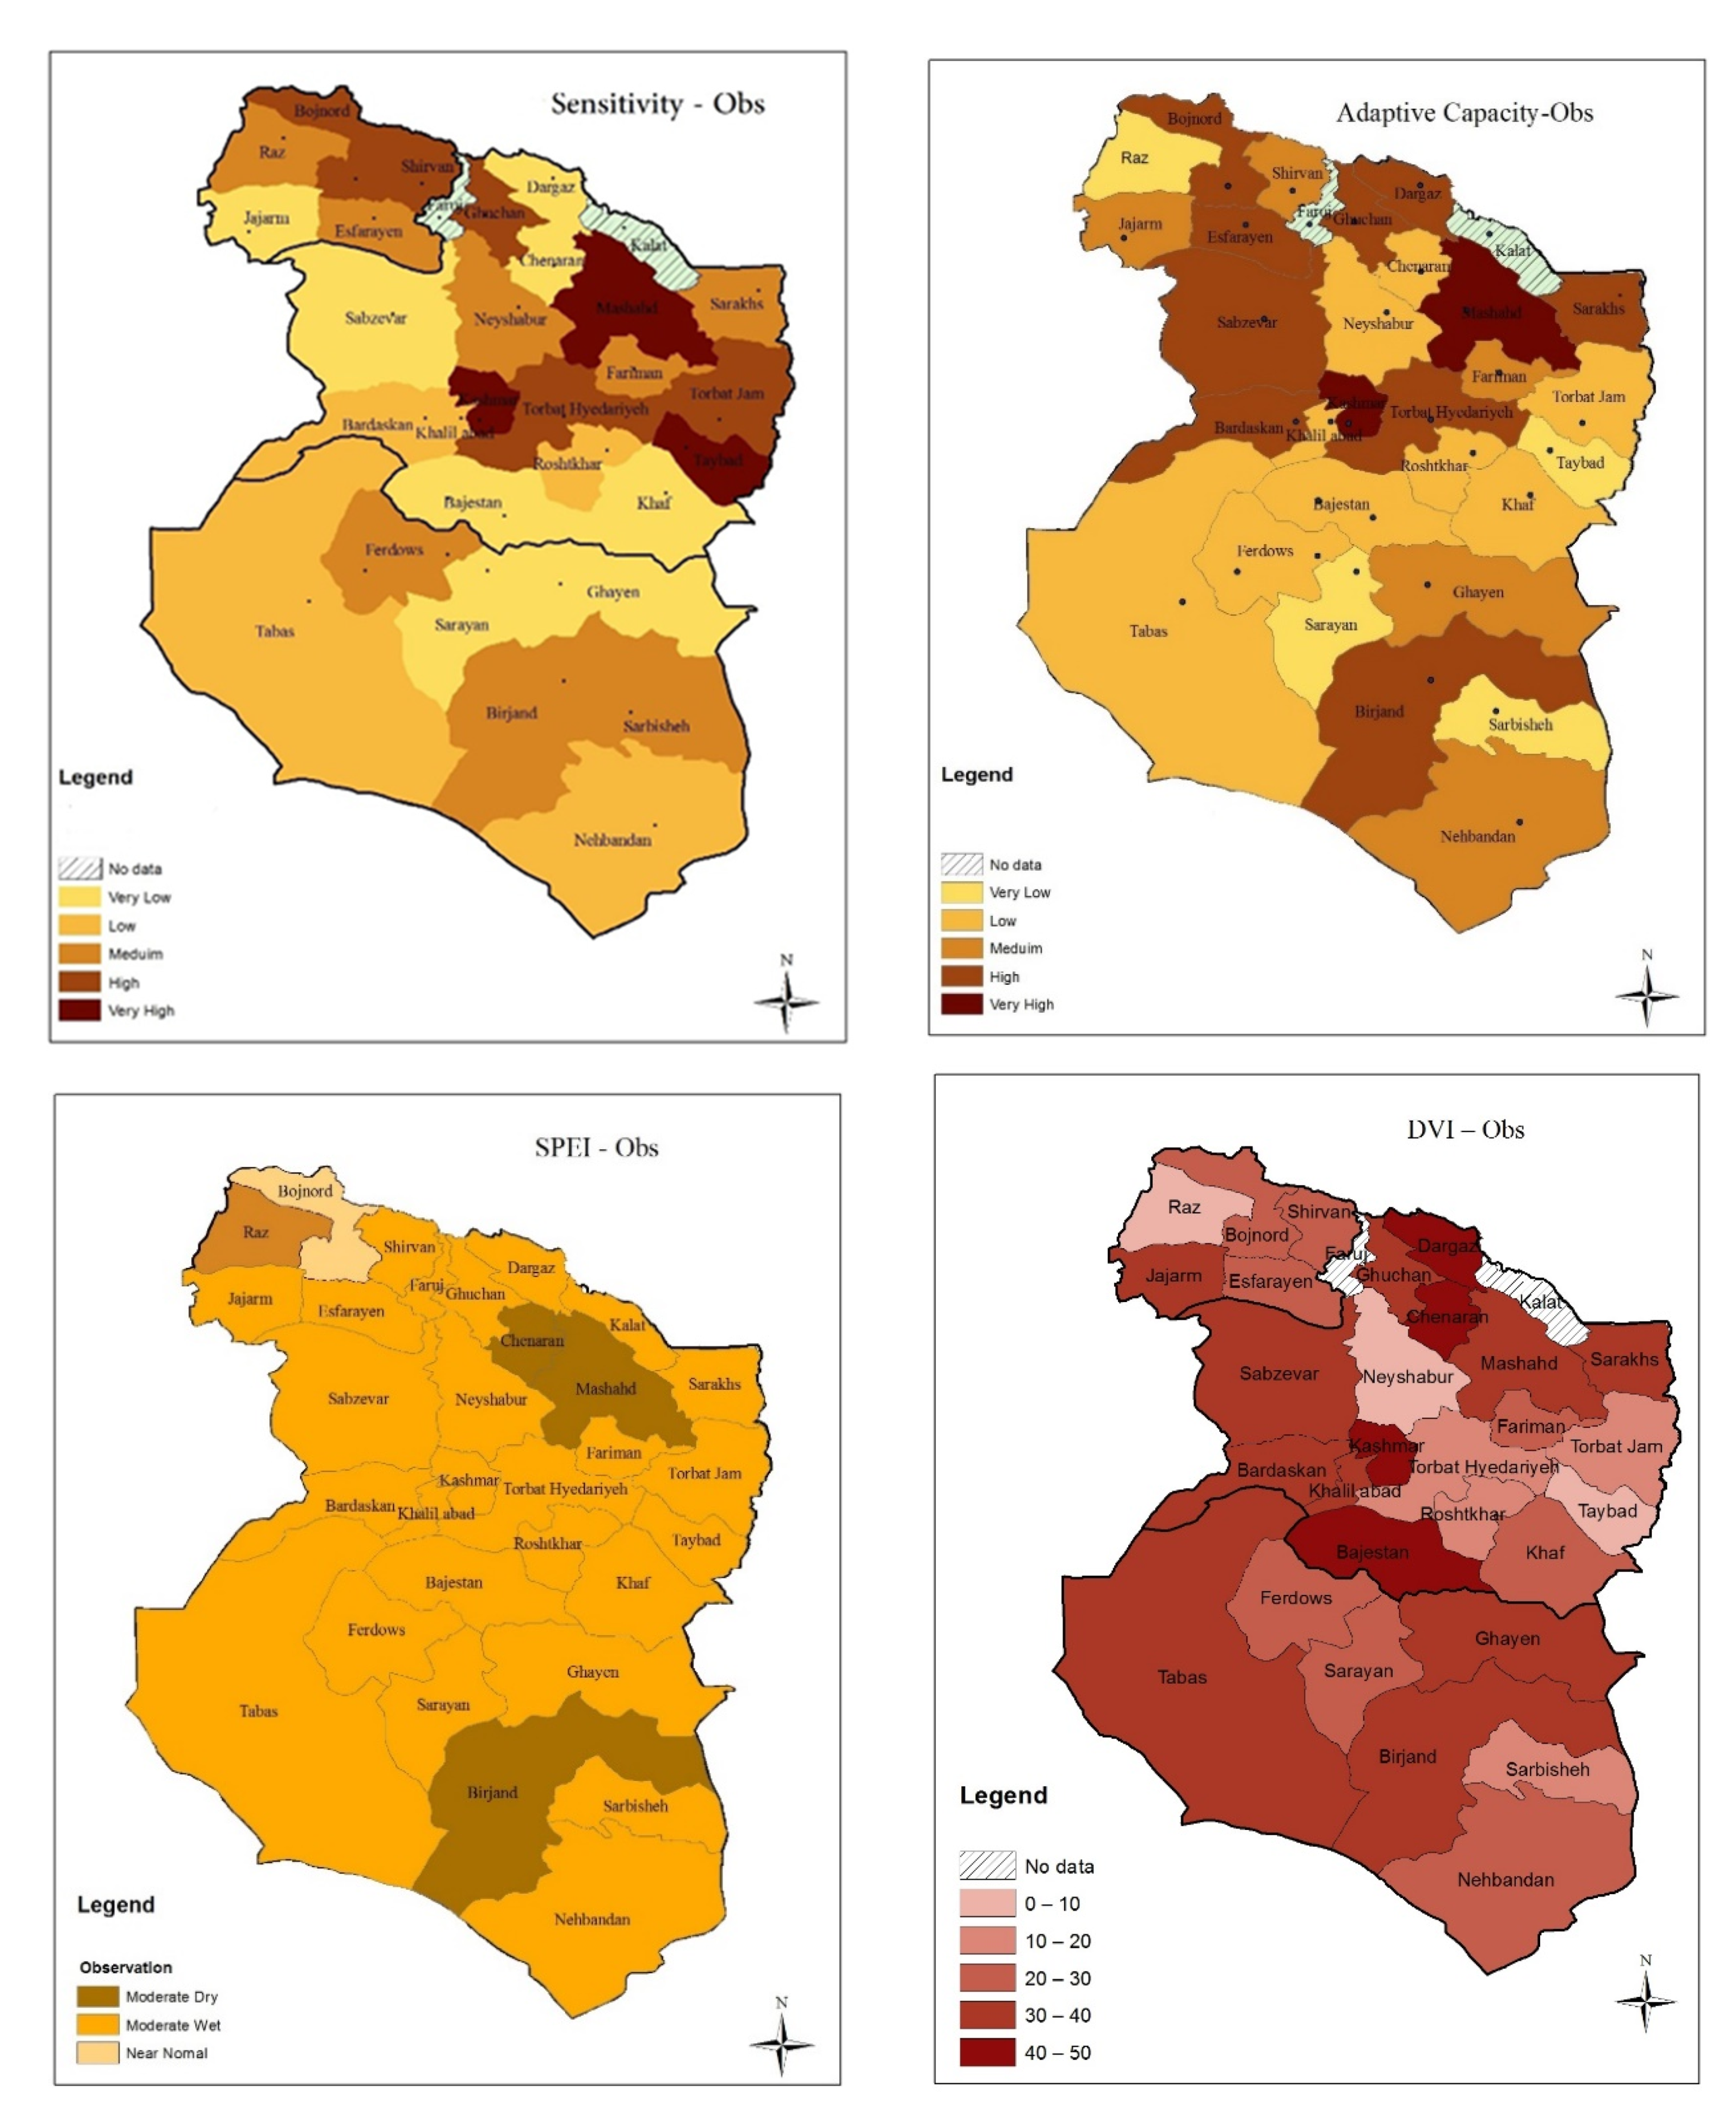
3.1. Observed Vulnerability

Figure 4 shows the histogram of relative sensitivity and adaptive capacity over all the counties located in three provinces of North-Khorasan, Khorasan-Razavi, and South-Khorasan. The figure shows that, on average, most cities in the three northeastern provinces of Iran are sensitive to drought. Various socioeconomic factors are involved in estimating a county’s sensitivity to drought. Due to the limitations in recording socioeconomic data in the study region, an attempt was made to use the maximum available common socioeconomic factors among all counties in estimating the sensitivity. Normalized sensitivity indices show that the three counties of Mashhad, Kashmar, and Taybad have very high sensitivity, while Sarayan, Dargaz, and Bajestan have very low sensitivity. According to the MPO data, Mashhad, the capital of the Khorasan-Razavi province, has a higher unemployed population than other counties due to its migratory capacity and high population. A higher amount of water consumption has made Mashhad has a higher amount of sensitivity. Kashmar also has a high amount of sensitivity to drought. It may be due to the high ratio of agricultural area to the county’s total area among all counties. In Sarayan, Chenaran, and Dargaz, the ratio of agricultural lands is low, and the social insurance index for pensioners is low compared to the county’s population, so the sensitivity index is estimated to be also low. Adaptive capacity is another factor incorporated in estimating drought vulnerability, indicating the degree of drought resistance. Higher adaptive capacity may reduce drought-related damage to the region, while lower adaptive capacity makes the region more vulnerable to drought [35]. It can be inferred from Figure 4 that Taybad, Garmeh, Sarayan counties have the minimum adaptive capacity, while Kashmar, Mashhad, and Birjand have higher adaptive capacity among all counties under study. The higher adaptive capacity of Kashmar is a relatively higher per capita hospital beds and health centers than other counties. However, the most deprived counties, such as Taybad, Jajarm, and Sarayan have unfavorable adaptive capacity. Three counties of Kalat, Farooj, and Bajestan have no long_term socioeconomic data to estimate sensitivity and adaptive capacity due to their new established.
Figure 5 shows a spatial overview of SPEI, indicative of Exposure, Adaptation Capacity, Sensitivity, and resulting Drought Vulnerability Index (DVI) during the observation period of 1986–2005. Among them, birjand, Mashhad, and Chenaran have experienced a higher exposure (SPEI) index due to frequent droughts during the observation period.
After estimating the three main components determining the drought vulnerability index, the overall vulnerability in the observed period (1986–2005) was estimated by incorporating three components of Exposure (E), Sensitivity (S), and Adaptive Capacity (AC), using Equation (7). The resulting relative vulnerability index of the counties in the three provinces is shown in Figure 5. Kashmar, Chenaran, and Dargaz have the highest Drought vulnerability among all counties in the three provinces under study. The higher DVI index in Dargaz and Chenaran, among other cities, may be due to their much higher exposure, the SPEI drought index. Additionally, the higher DVI index in Kashmar may be due to its higher amount of sensitivity among other counties. Taybad city shows the least Drought Vulnerability Index (DVI due to the medium exposure (SPEI drought index). On the provincial scale, Khorasan-Razavi has experienced the highest drought vulnerability in the observation period of 1986–2005.

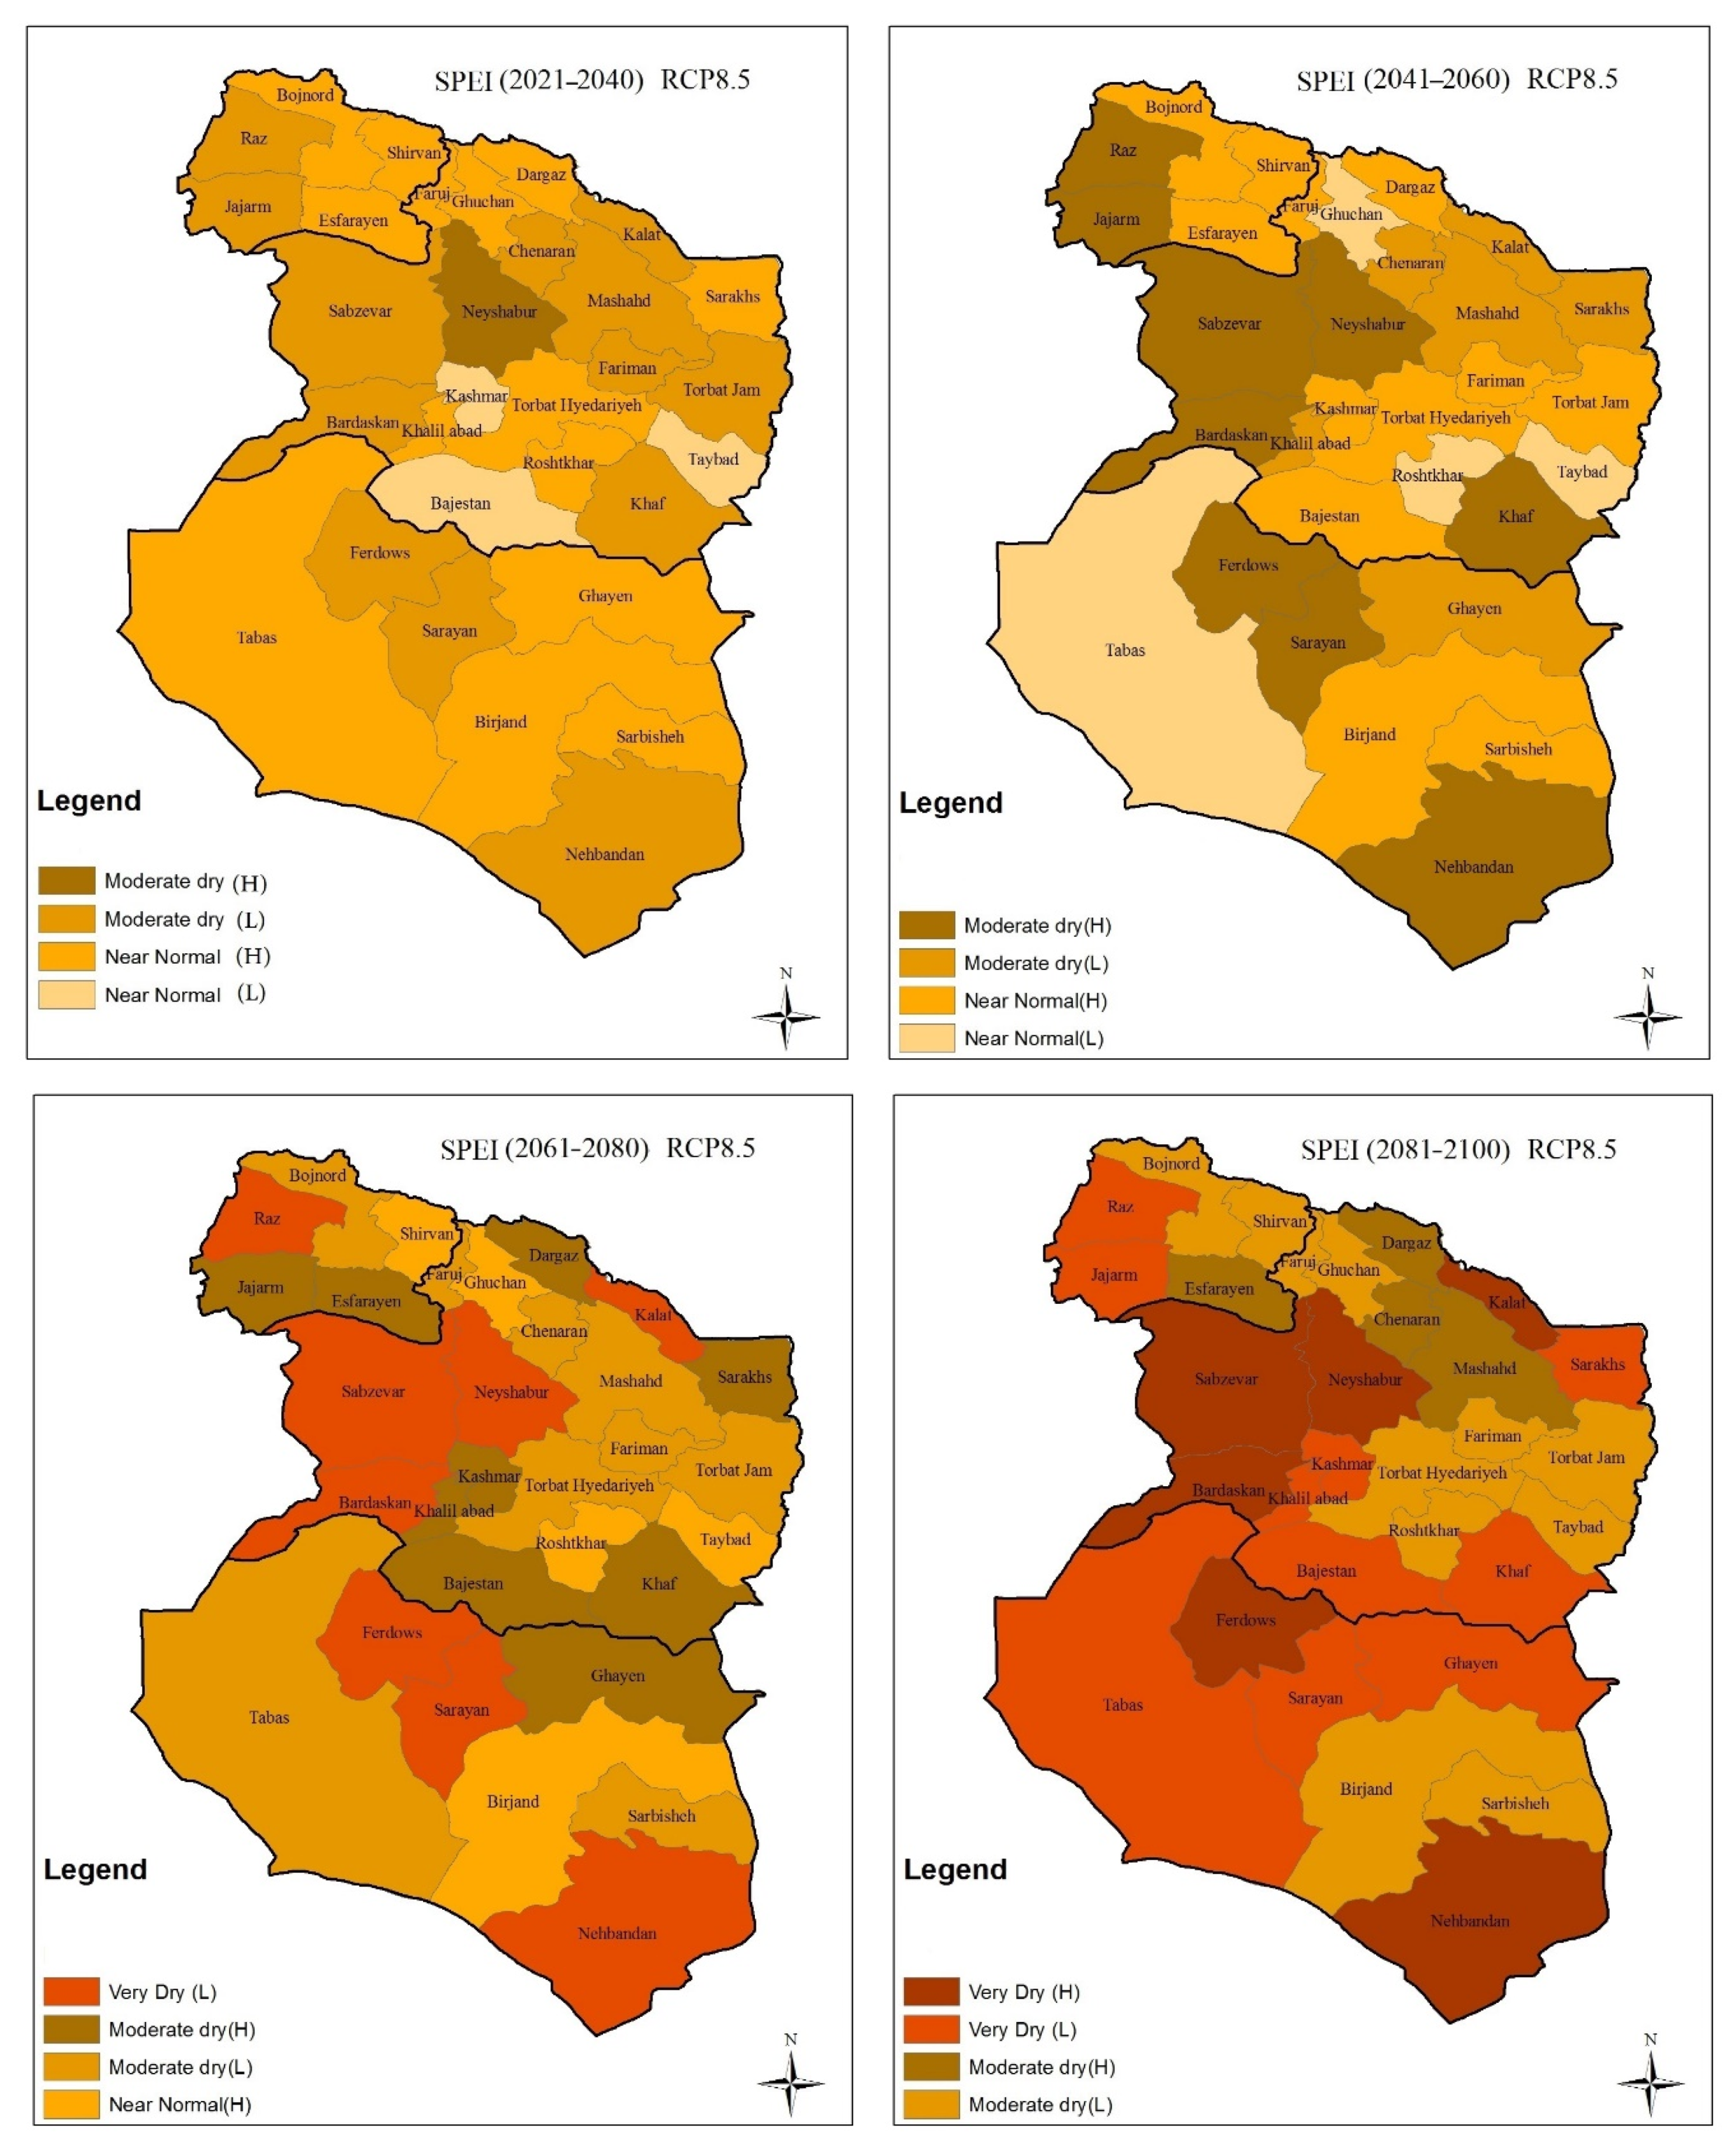
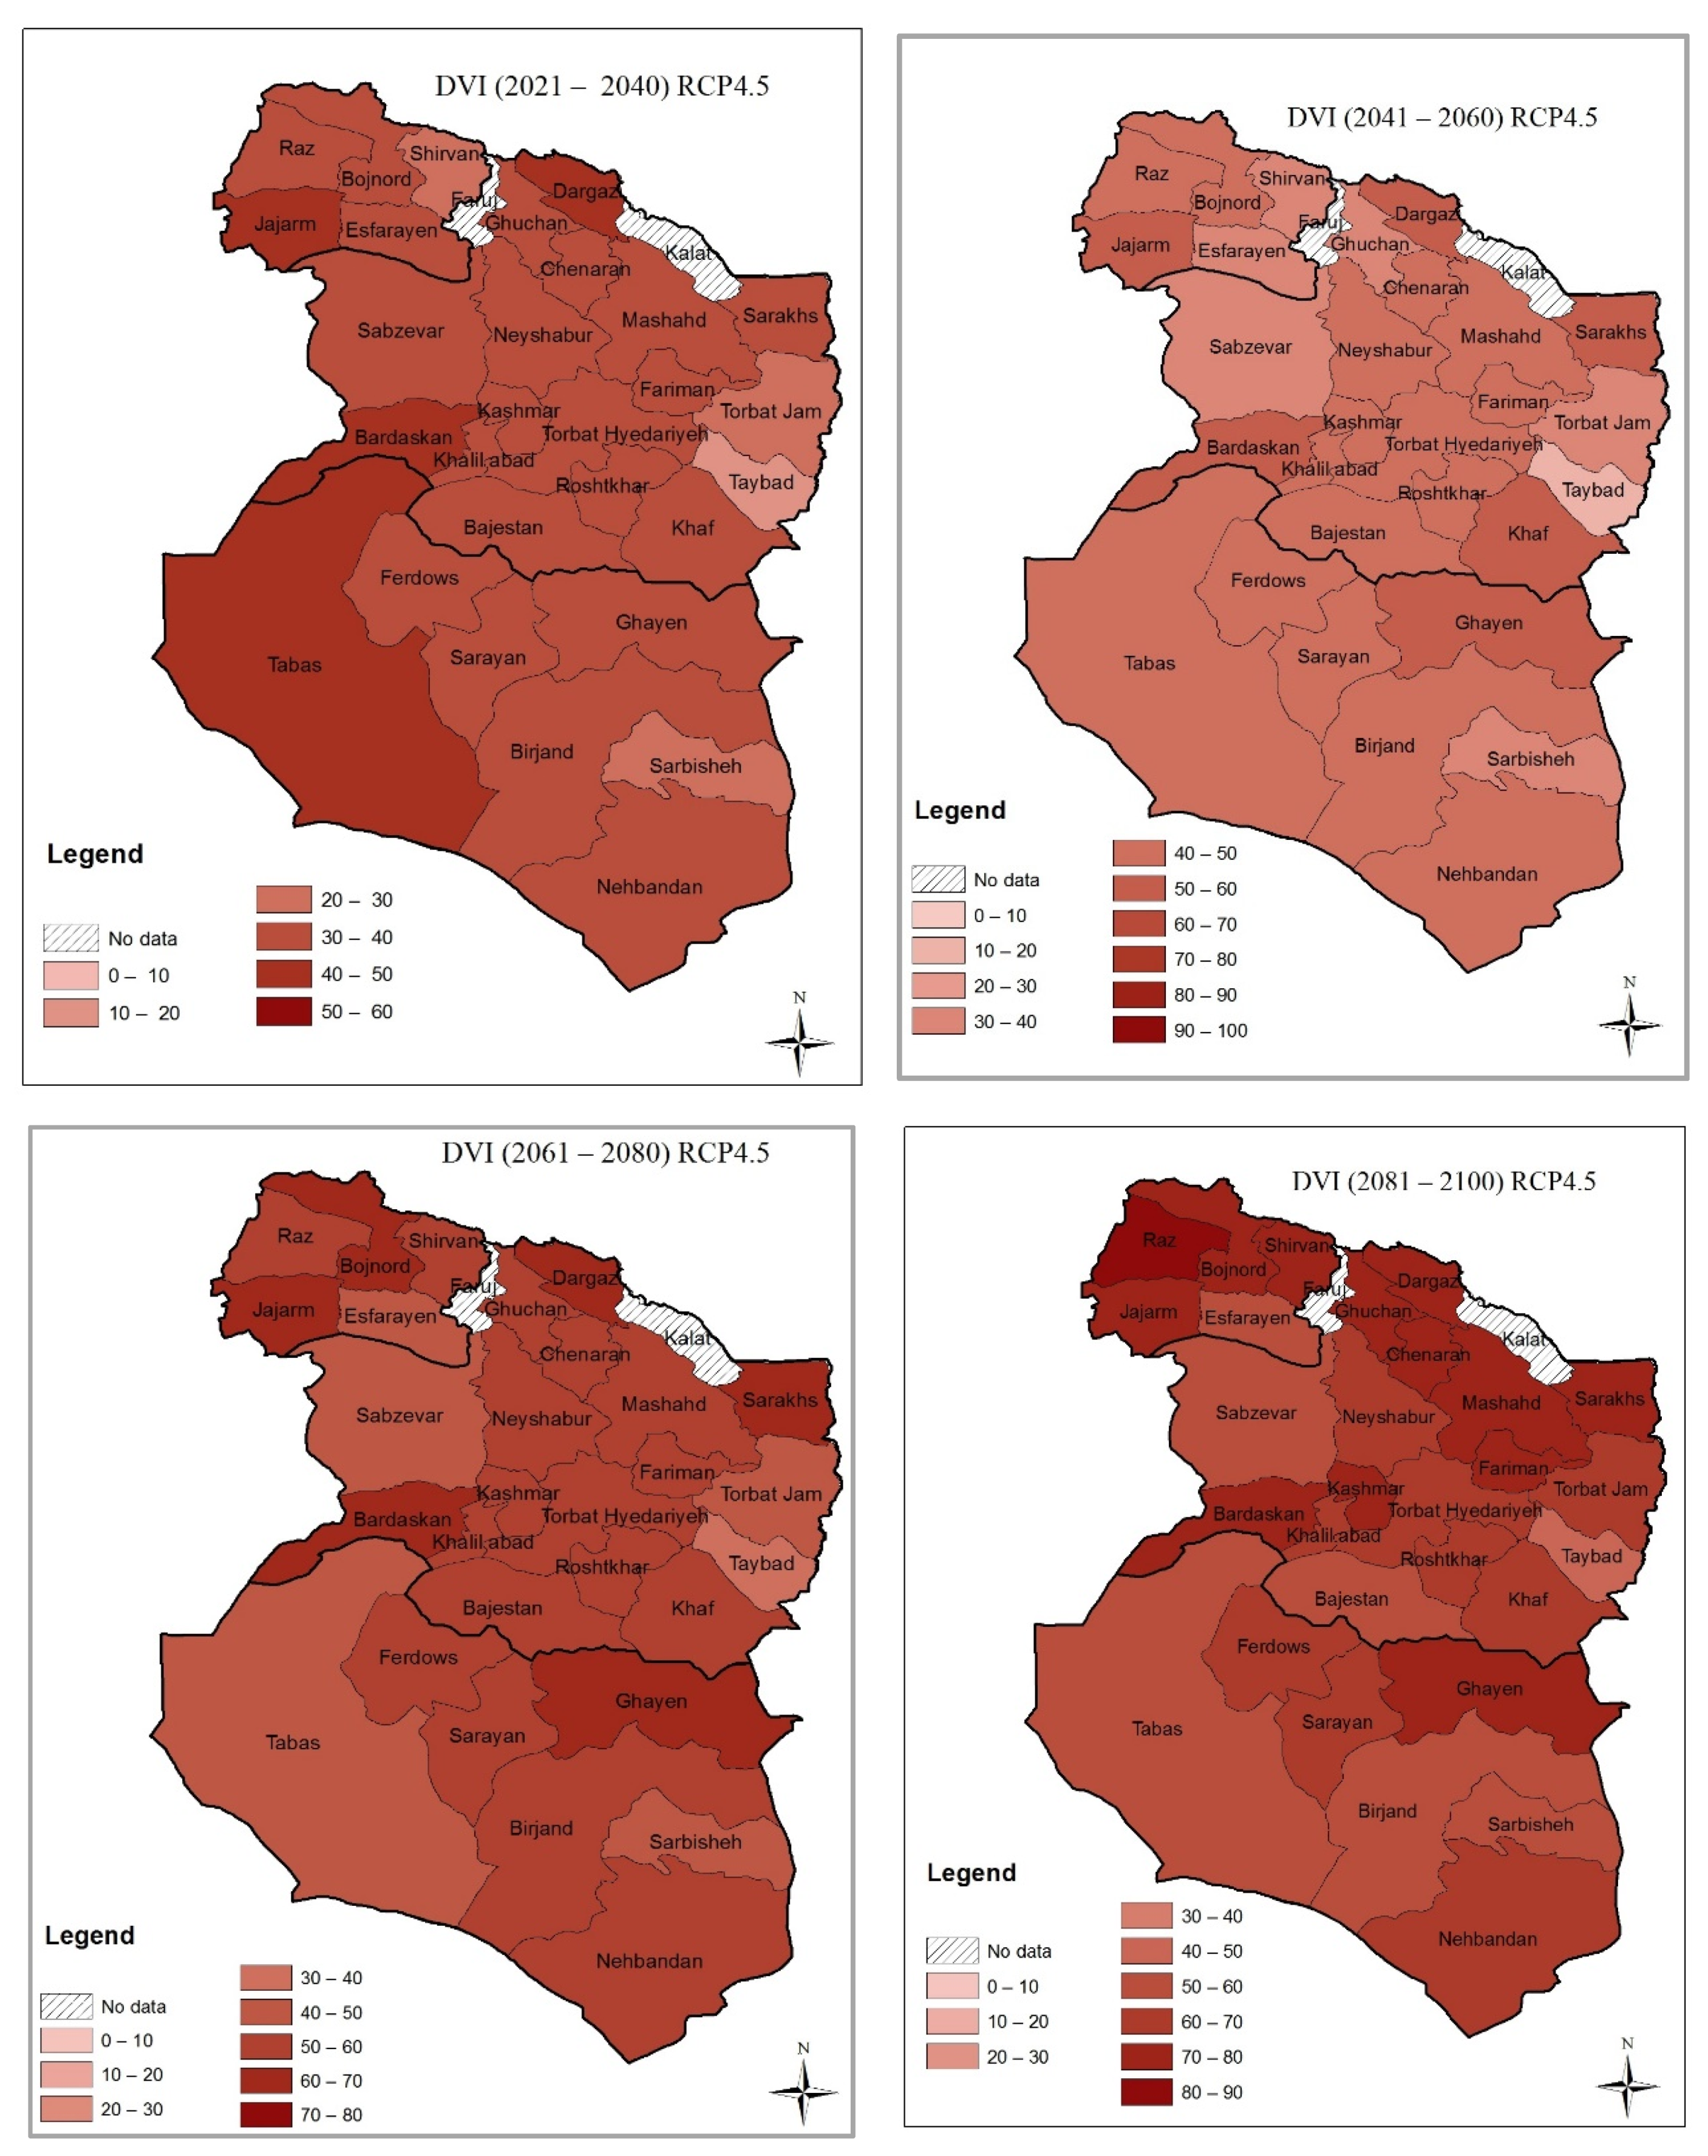
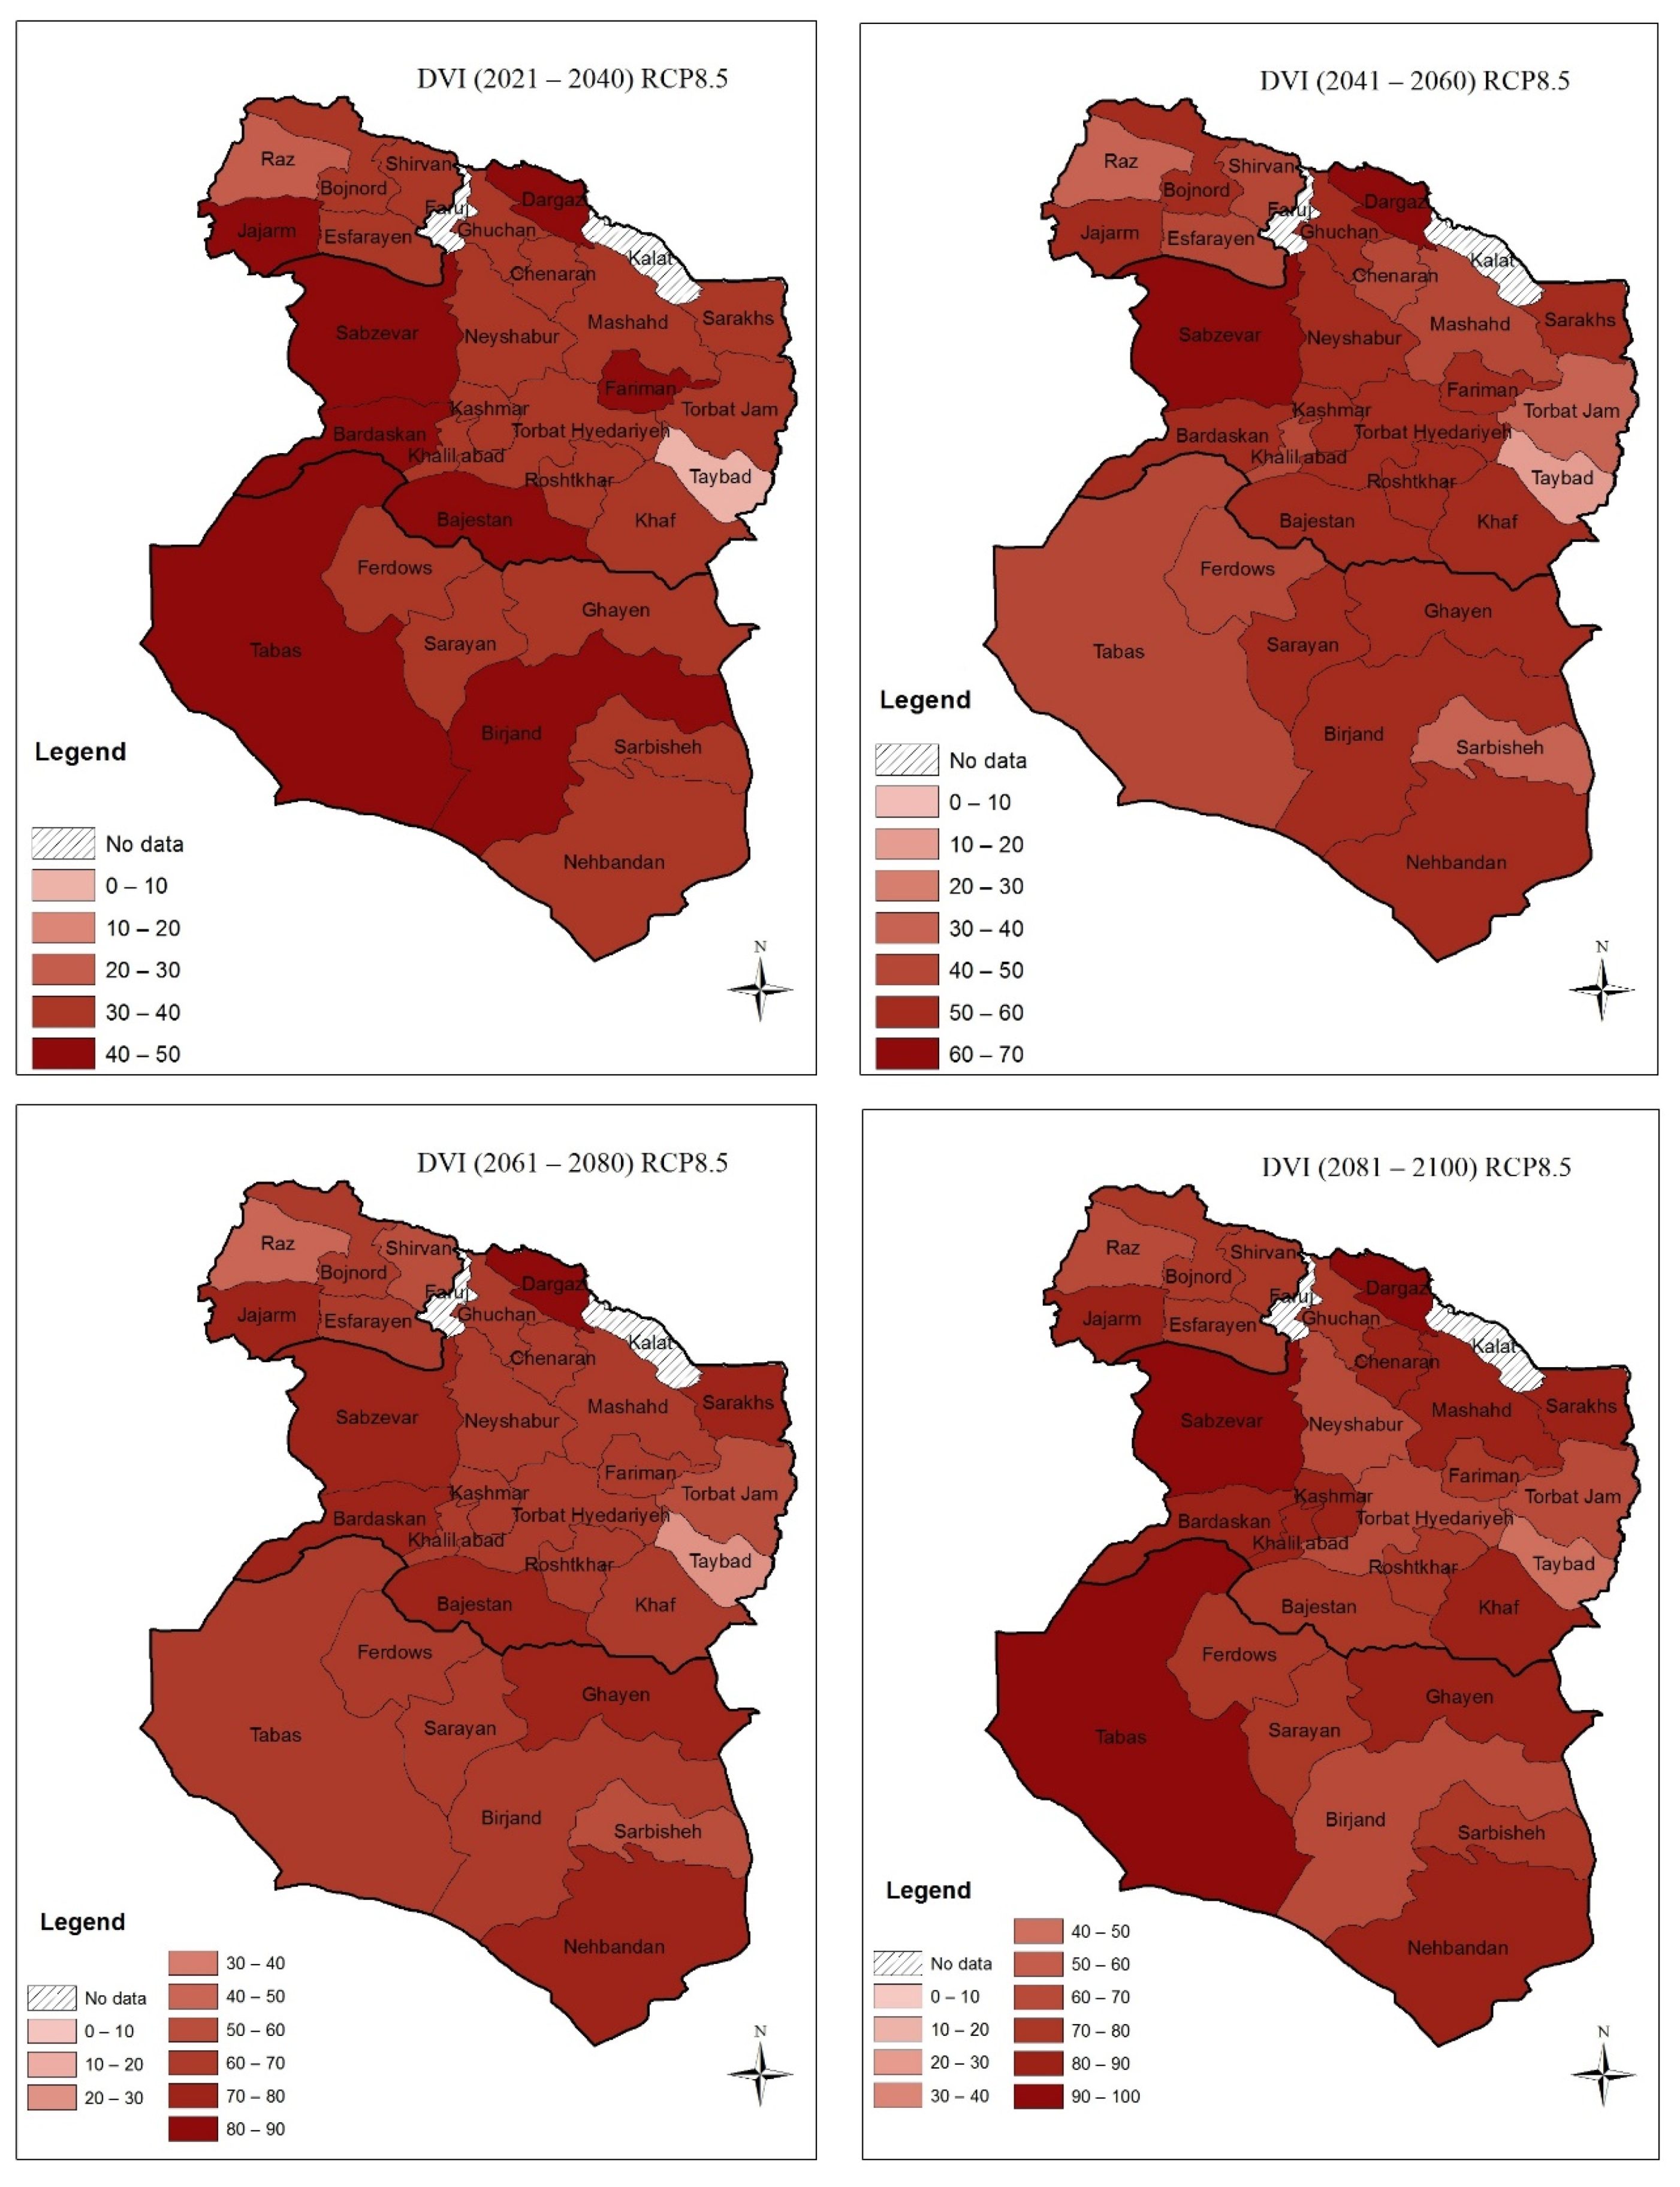
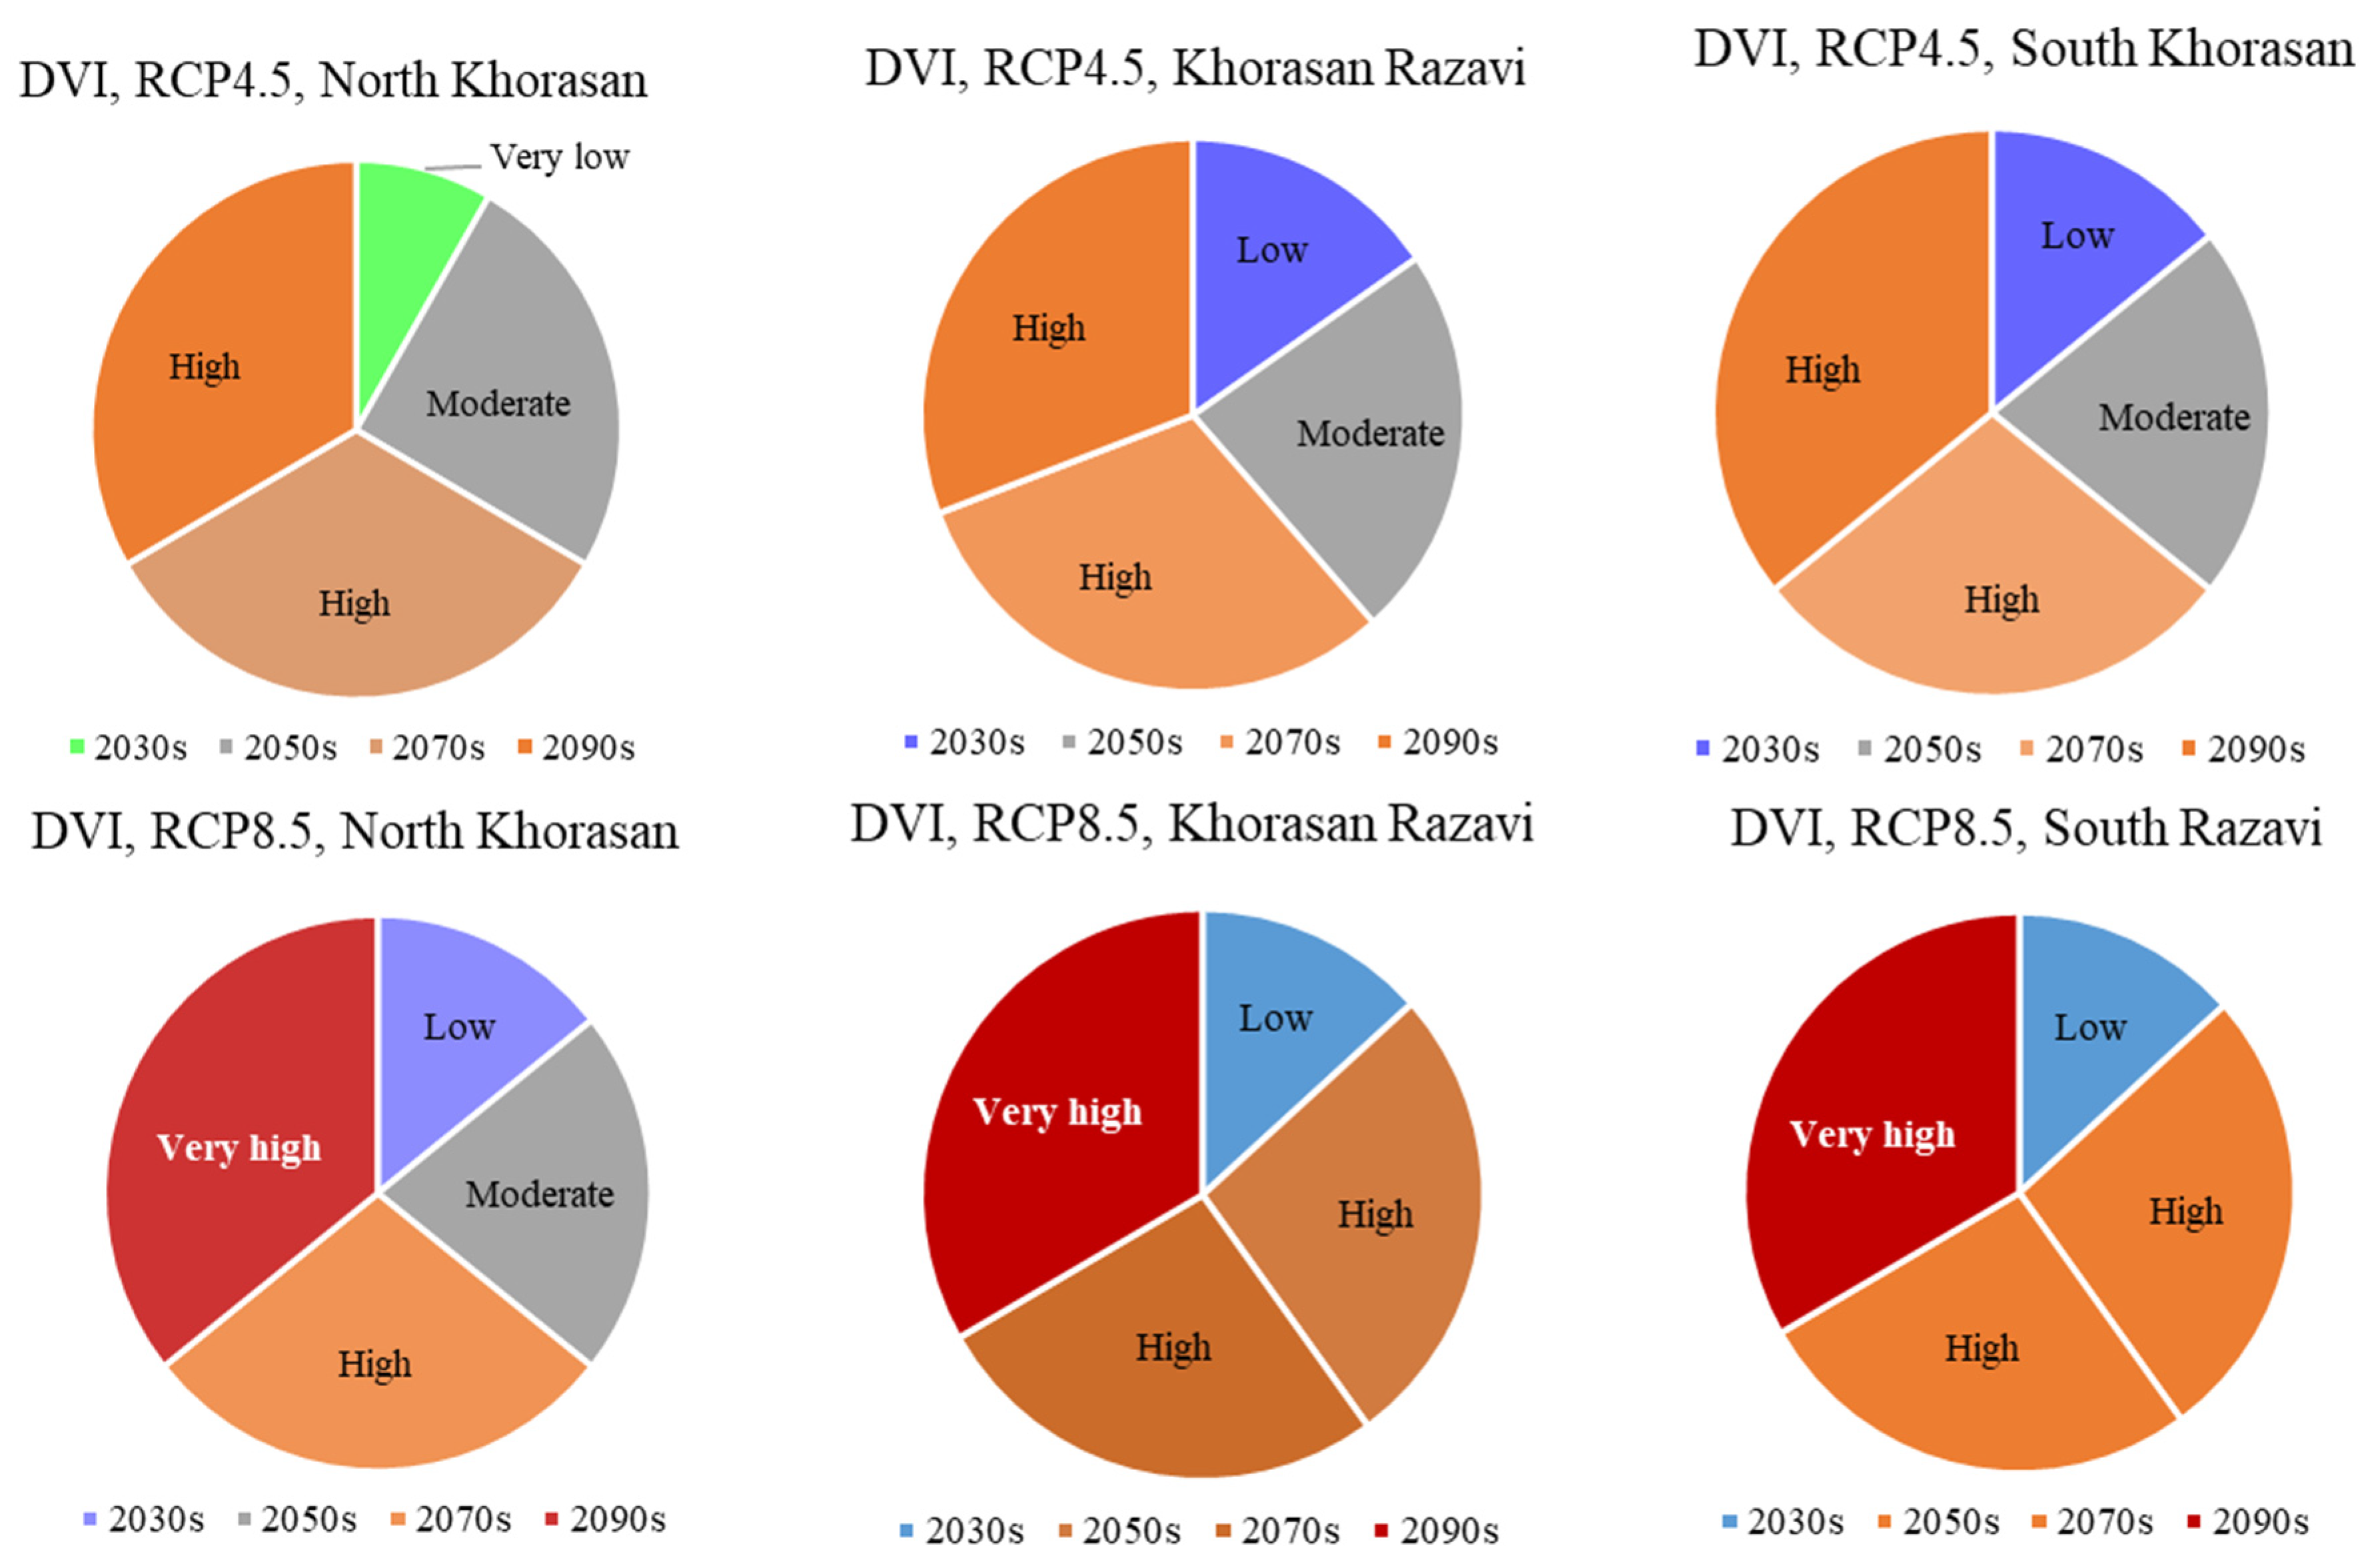
3.2. Future Vulnerability

In order to project future drought vulnerability in the northeast of Iran, it is necessary to estimate the level of exposure by considering the SPEI drought index and the sensitivity and adaptation capacity. The annual (12-month running) SPEI drought index was calculated for the next four coming periods under RCP4.5 and RCP8.5 scenarios (Figure 6 and Figure 7). The drought index in all three provinces under the study is expected to increase on average compared to the observation period, and its values in the RCP8.5 scenario are higher than RCP4.5. While in the RCP4.5 scenario, a very severe drought would occur in the last decade of the 21st century, i.e., 2081–2100, in the RCP8.5 scenario, a very severe drought would occur one decade earlier, i.e., in 2061–2080. Severe drought is projected at the latest decade over the majority of cities. In the observed period, the drought class of all cities is in the normal category, while mild drought is detected in the near future period of the 2030s. As the projection period’s length increases, the number of cities affected by drought increases. Although this trend is seen in both scenarios, the severity of drought in RCP8.5 is higher than in RCP4.5. It is expected that Nehbandan, Ferdows, Neishabour, Sabzevar, Bardaskan, and Kalat (in RCP8.5) and Bardaskan (in RCP4.5) would experience “very severe drought” in the period of 2090s. The cities in the southern and western parts of the region under study, including Neishabour, Bardaskan, Sabzevar, Tabas, Bashrueieh, and Nehbandan, are expected to experience more drought in the future than in the observation period.
Level of exposure, sensitivity, and adaptation capacity are three components to estimate future drought vulnerability using Equation (7). In this research, while the future exposure level was projected using SPEI drought index, the amount of future sensitivity and adaptation capacity was considered the same as the base period due to the complexity and low predictability socioeconomic variables. After estimating drought vulnerabilities, their amount was scaled to 0–100 based on Equations (8) and (9). The overall results showed that the region would be more vulnerable to drought than the base period (Figure 8 and Figure 9). We calculated the mean vulnerability class to be 20–30 in the observation period, while it is estimated to jump to the upper vulnerability class of 30–40 in the near future of the 2030s, with higher magnitude in the northeastern, eastern, and central part of the region. The western half of the region, including Bardaskan, Jajarm, Sabzevar, Tabas, which are generally in the neighborhood of the desert area, is expected to face an increase in vulnerability in the near future period. In the same decade, northern counties, including Dargaz and Sarakhs, and the eastern part of Khaf and Qaen, would experience the highest increase in vulnerability class compared to other counties. However, the increase in vulnerability class in the number of counties located in the west of the study region is higher than those counties in the eastern and central regions. Both RCP scenarios indicate an increase in drought vulnerability classes, but its severity in RCP8.5 is greater than RCP 4.5. The highest drought vulnerability index in the observed and near-future period was estimated for Dargaz county with 43.7 and 49.7, respectively. It seems that the higher vulnerability of Dargaz is due to its poor infrastructure (lowest adaptive capacity), high sensitivity, and higher exposure (projected drought class in the near future). Although the mean annual precipitation of this city is rarely 220 mm, rice is cultivated in the northern part of this county, which negatively affects the level of sensitivity. In the 2050s, the minimum vulnerability class is 30 in both RCP scenarios, showing an increasing trend compared to the 2030s. In the 2090s, even the vulnerability class of 90–100 was projected under the RCP8.5 scenario. In the middle decades, the Sabzevar county vulnerability index is projected to be the highest among all counties (58.4, 70.2, and 82.8 in 2050, 2070, and 2090, respectively). The reason for the highest amount of DVI in Sabzevar may be due to the fact that its future drought class is in the highest projected class. The lowest drought vulnerability both in the observed and future periods is related to Taybad city. In the observation period, three cities of Taybad, Neyshabur, and Razhave the minimum amount of DVI, while future projected drought in Taybad is a lower class of drought compared to other counties.
The highest relative increase among the study region belongs to Sabzevar and Bardaskan, respectively. The results showed that Sabzevar DVI’s magnitude is expected to increase by 47% in the 2050s compared to the 2030s. Its DVI in the 2090s was 82% higher than the observed period. It is necessary to point out that its SPEI index in the 2030s and 2050s is estimated to be −0.46 and −0.97, respectively. The county’s SPEI index has been detected to increase from −0.46 in the 2030s to −0.97 in the 2050s. In RCP8.5, the value has been projected to be −1.54 in 2070 and −2.07 in 2090. Because of many shortcomings or lack of socioeconomic data, it was impossible to estimate the adaptation capacity and sensitivity in the two counties of Farouj (North Khorasan) and Kalat (Khorasan Razavi).
The region means DVI in the observation period is 33 (out of 100), while the future projection is 67 and 78 in RCP4.5 and RCP8.5, respectively. It indicates a 2 to 3-fold increase in the vulnerability of northeast Iran compared to the observation period. Results also indicate an increasing trend in the mean regional amount of DVI index under RCP4.5 and RCP8.5 scenarios during the near future of 2021–2040 (the 2030s) to the far future (2090s) periods.
Figure 10 shows the mean provincial DVI from the near future (the 2030s) to the far future (2090s). South Khorasan is expected to experience the highest increase in drought vulnerability index, especially in the RCP8.5 scenarios. Its province vulnerability index in the 2030s and 2050s is 31 and 47.4, respectively. It has increased to 79 in the last decade of the 21st century, mainly due to rising SPEI drought due to reduced rainfall and increased temperatures when compared to two other provinces of Khorasan Razavi and North Khorasan. in Khorasan Razavi province, the highest amount of drought vulnerability is projected to be in the 2030s and 2050s under RCP4.5 and RCP8.5 scenarios, while in South Khorasan, the highest amount of DVI expected to be in the 2070s and 2090s, under both scenarios.
In the 2050s under RCP8.5 scenarios, a large area in the northeast region is more vulnerable than RCP84.5 scenarios. However, the area of severe drought vulnerability in the 2070s under RCP8.5 is estimated to be 96.3% higher than observation. In contrast, according to RCP4.5, 77% of the Northeast region will experience severe drought vulnerability compared to the observation. In order to explain the projections uncertainties, the 25th and 75th percentile of all projections retrieved from different models-scenarios were considered. Figure 11 shows mean regional drought vulnerability arising from different model scenarios during observation and future periods of the 2030s–2090s. The figure also shows the DVI’s deviation from the 50th percentile (black-dashed line), which corresponds to the range of DVI’s uncertainties across decades. It can be depicted that projection length increases the width of uncertainty. The most uncertain projection period is the 2090s.

4. Discussion

Several methods have been proposed to estimate drought vulnerability as a basis for preparing future regional drought policies. These methods range from simple equal weighting methods such as Ahmadi et al. [35] to rather more sophisticated entropy weighted methods such as Guo et al. [28]. In this study, a simple equal weighting approach was used.

4.1. Observation Vulnerability

The observed DVI is calculated by having exposure (SPEI drought index), sensitivity, and adaptive capacity. Values of sensitivity and adaptive capacity of each county were estimated using scaled socioeconomic data from two national censuses. Results showed that most cities in the study region are sensitive to drought. The highest amount of sensitivity belongs to Mashhad, Kashmar, and Taybad. In contrast, the lowest amount of vulnerability belongs to Sarayan, Dargaz, and Bajestan, which are consistent with their socioeconomic conditions, i.e., the population of migrants, the ratio of agricultural land to the county’s total area, social insurance, and the list goes on. Adaptive capacity, which is the degree of resistance of each county to drought, may reduce vulnerability. Results show that Taybad, Garmeh, Sarayan counties have the minimum adaptive capacity, while Kashmar, Mashhad, and Birjand have higher adaptive capacity among all counties under study. Almost most counties with low adaptation capacity are located in less developed areas. During the observation period (1986–2005), Birjand, Mashhad, and Chenaran had a higher exposure (drought) among all counties. The highest exposure (droughts) caused Dargaz and Mashhad to suffer the most vulnerability during the observation. Additionally, the lower amount of exposure caused Taybad to have a minimum amount of baseline vulnerability. We found that Khorasan-Razavi had the highest vulnerability among the three study provinces. Our finding is inconsistent with the results of Ahmadi et al. [35] over Sistan and Baluchistan province, a neighboring province to the current study region, and Purtaheri et al., Masoudi et al. over all provinces of Iran and Carrao et al. over all countries [48,49,50].

4.2. Future Vulnerability
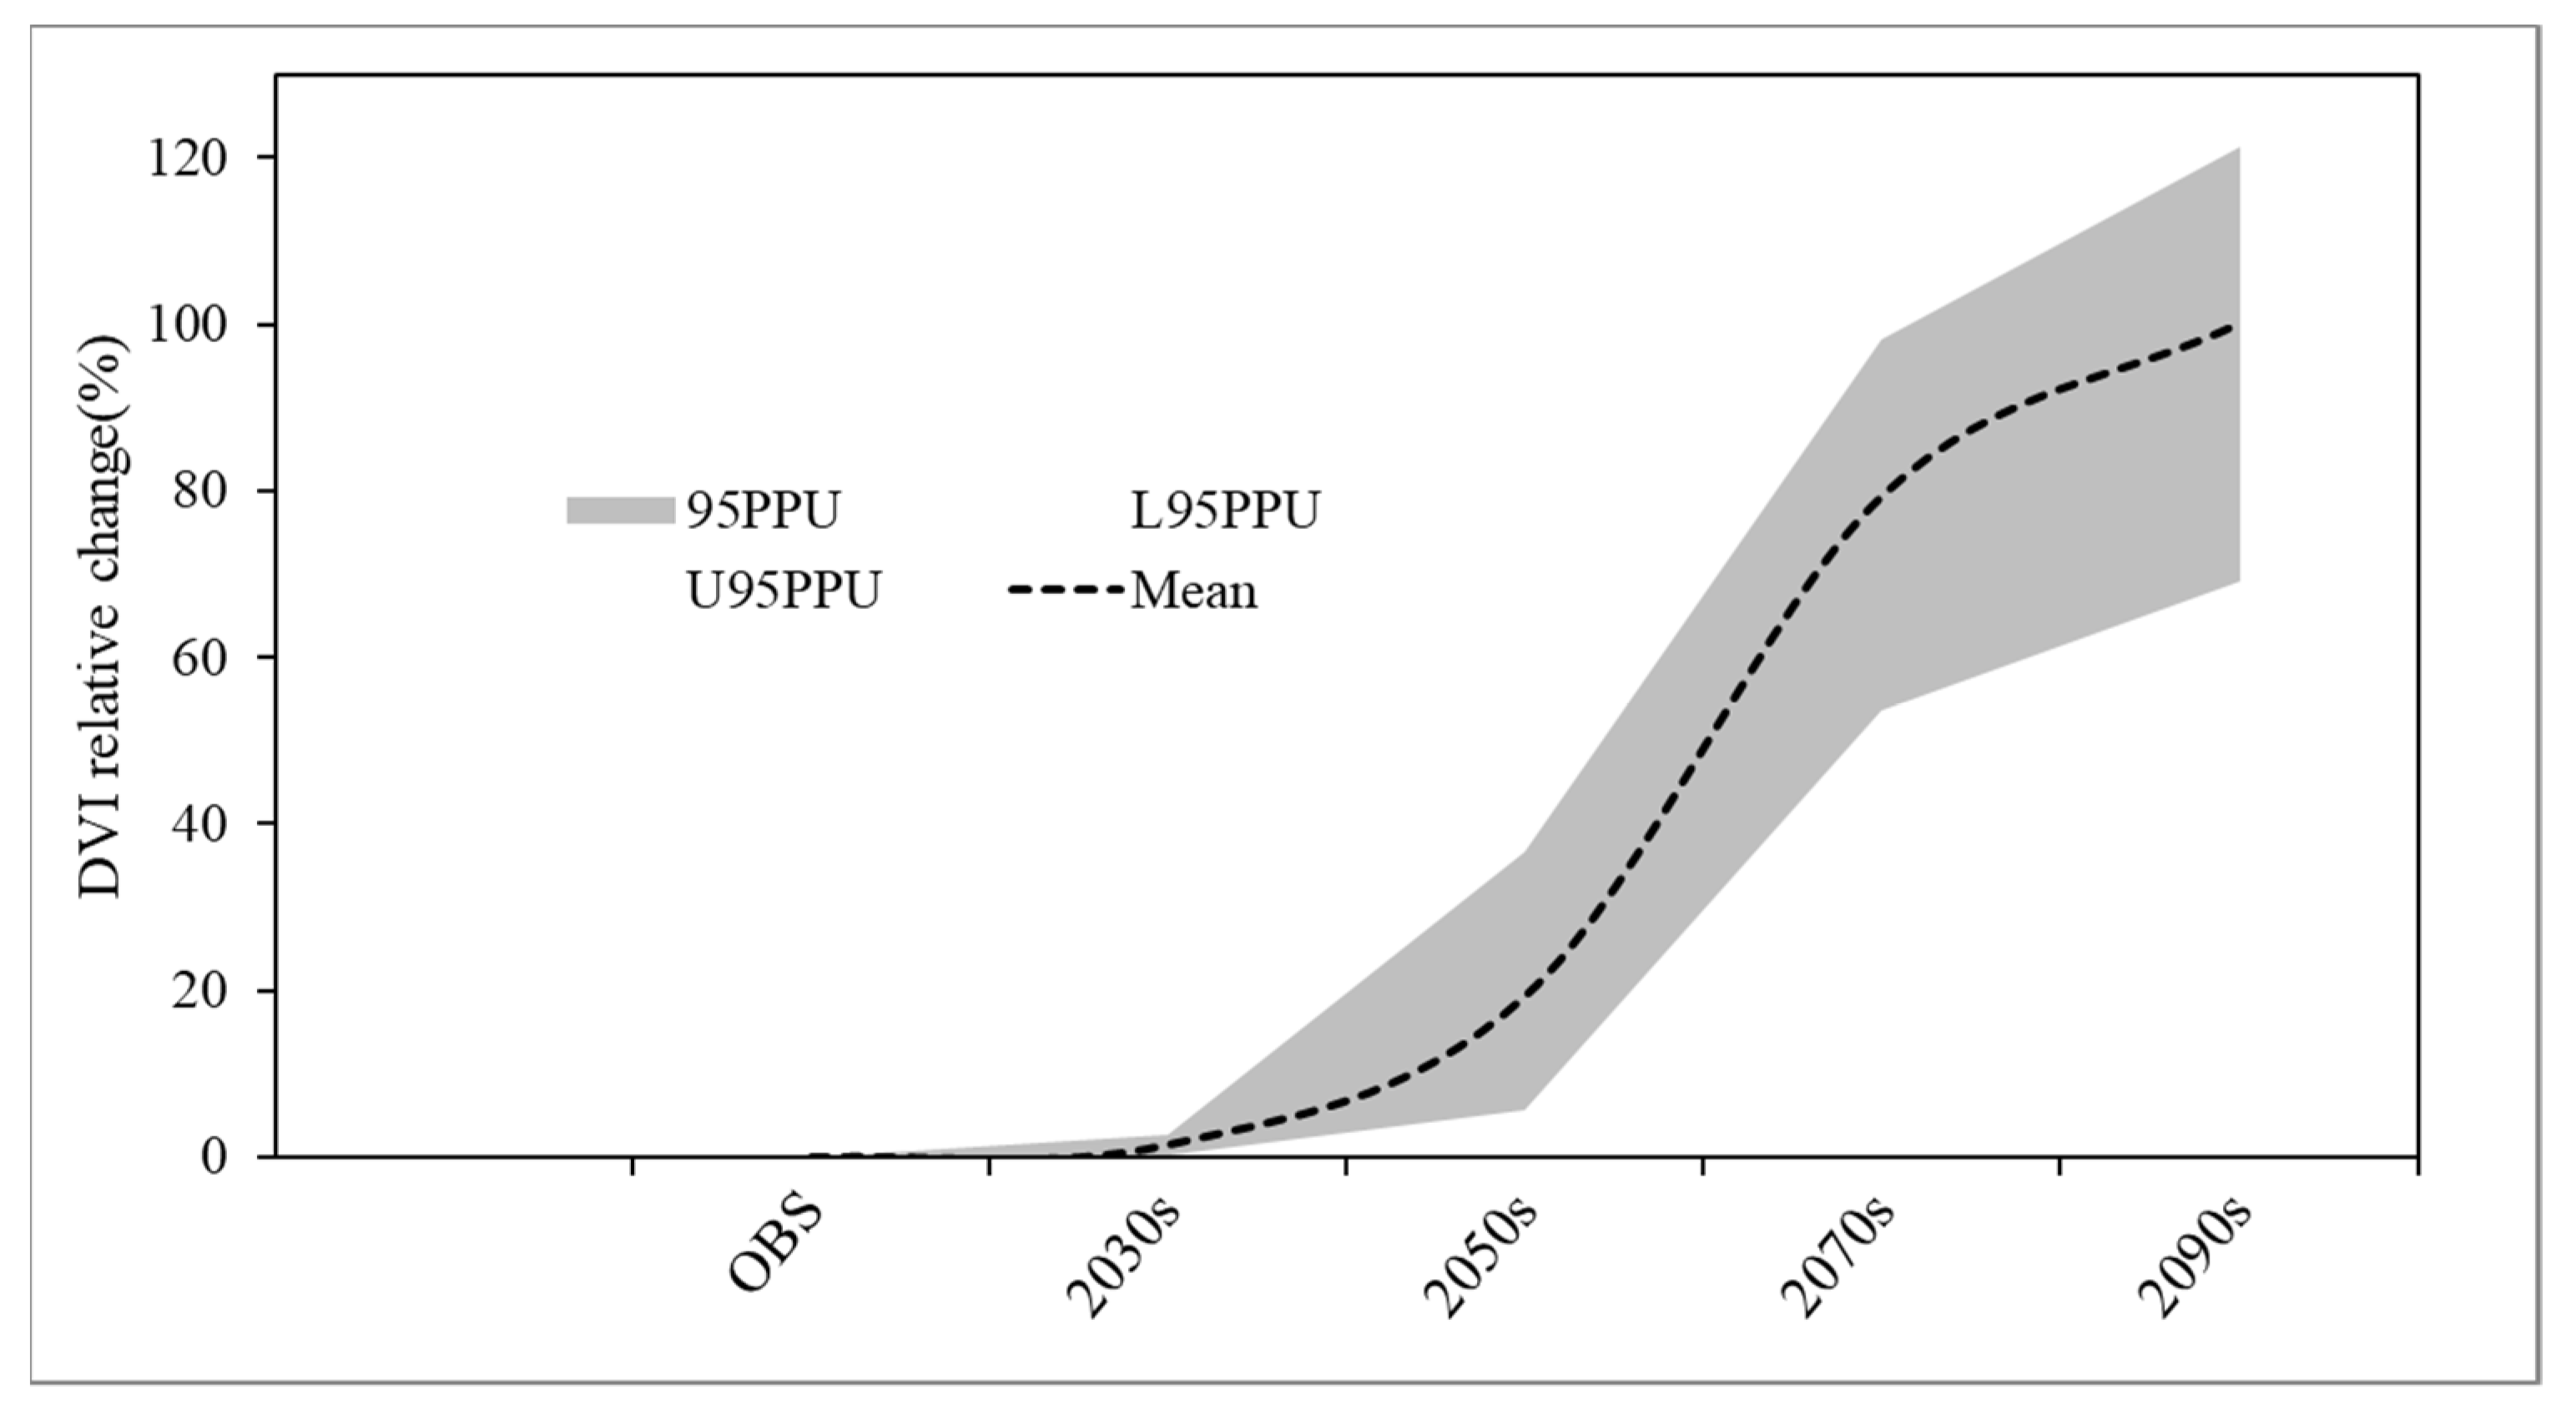
It seems that there are no significant studies related to future drought vulnerability projection over Iran. In this regard, comparing the current study’s findings with other studies is very hard. However, when considering the exposure component of DVI, many studies have indicated the increase of drought events and intensity over Iran, including IPCC [1], Zhao et al., Lu et al., Vaghefi et al., and Khazanedari et al. [51,52,53,54], To project future evolution of drought vulnerability over study region, one may project all components involved in vulnerability, including exposure, sensitivity, and adaptive capacity. Here, we have considered sensitivity and adaptive capacity to be constant in the future, and exposure is projected by the projection of drought using SPEI index for all counties located in the region. Results indicated that vulnerability would be increased under RCP4.5 and RCP8.5 compared to the observation period, and as an average, vulnerability under RCP8.5 is greater than RCP4.5. A Maximum amount of vulnerability is expected to occur at the end of 21st century, i.e., 2081–2100, but in RCP8.5, it is expected to occur one decade earlier. In the latest decade, most of the counties are expected to face with “high” to “very high” class of vulnerability, while their class in the observation period was “very low” to “low” as an average. A higher amount of vulnerability is projected to be under RCP8.5 and at the end of the current century. It is expected that, by the end of the 21st century, the study region would experience a drought vulnerability index ranging from 67 and 78 (high vulnerability), which is 2 to 3 times than the observation period. All worse class of vulnerability projected to occur in South-Khorasan and Khorasan-Razavi provinces, with the worst case in south Khorasan

4.3. Uncertainty

All projection members arise from three GCMs, and two scenarios, a total of six members, explain the uncertainty of future drought vulnerability projection. To this end, thresholds of 25th and 75th percentile of all member runs were incorporated in explaining uncertainty for each county. In general, it can be concluded that uncertainty increases with the increasing length of projection. Most of the uncertainty belongs to the latest decade of the 21st century.

5. Conclusions

This paper simulates future drought vulnerability over the northeast of Iran, which are highly dependent on water due to their economy being mainly based on agriculture and animal husbandry. Reducing drought vulnerability requires accurate and continuous assessment of three vulnerability components of exposure, adaptive capacity, and sensitivities. This study computed the observed vulnerability components based on meteorological and socioeconomic data retrieved from related organizations. Most reliable CMIP5 GCMs over the region were extracted through 19 GCMs by comparing historical outputs with the observation dataset. Then future drought vulnerability is projected by incorporation baseline adaptation capacity and sensitivity and projected level of exposure. We projected that the class of vulnerability over study region, especially in South Khorasan and Khorasan-Razavi, expected to increase 2–3 times than observation, so that its class of vulnerability expected to change from “very low to low” to “high to very high” at the end of 21st century. In other words, the results indicated that only in North Khorasan province is expected to have a vulnerability class of “very low,” and in none of the provinces, the vulnerability class of “very high” under the RCP4.5 scenario. In the RCP8.5 scenario, however, the “very low” vulnerability class is not estimated for any of the provinces, and by the end of the 21st century, all studied provinces are expected to experience a new, worse vulnerability class of “very high”. As the contribution of the sensitivity and adaptation capacity in vulnerability is of high importance, it is recommended to regional officials and senior planners to reduce the region’s sensitivity to drought and increase adaptation capacity. This research also can be improved by modifying sensitivity and adaptation capacity as a constant to dynamic and projectable components in the future period.

Author Contributions

Conceptualization, I.B., A.E.R., M.H., M.B. and A.E.; methodology, I.B., A.E.R., M.B., M.B.A. and A.E.; software, I.B. and A.E.R.; validation, I.B. and A.E.R.; formal analysis, I.B. and A.E.R.; investigation, I.B. and A.E.R.; data curation, I.B. and A.E.R.; writing—original draft preparation, I.B. and A.E.R.; writing—review and editing, I.B., A.E.R. and M.H.; visualization, I.B. and A.E.R. All authors have read and agreed to the published version of the manuscript.

Funding

Open Access Funding by the University of Graz.

Data Availability Statement

All data used in this study are available upon request.

Acknowledgments

The authors acknowledge the financial support provided by the University of Graz. We would like to thank all the Data providers. Data were provided by Iran Meteorological Organization, the European Centre for Medium-Range Weather Forecasts (ECMWF) and Integrated Climate Data Center−ICDC, National Planning and Budget Organization (NPBO), we also acknowledge the World Climate Research Program’s Working Group on Coupled Modeling, which is responsible for CMIP.

Conflicts of Interest

The authors declare that they have no conflict of interest.

Code Availability

The software was used in this study was R, which has been using as a programming language and free software for statistical computing and graphics.

Ethics Approval

(1) This material is the authors’ original work, which has not been previously published elsewhere. (2) The paper is not currently being considered for publication elsewhere. (3) The paper reflects the authors’ research and analysis wholly and truthfully. (4) The paper properly credits the meaningful contributions of co-authors and co-researchers. (5) The results are appropriately placed in the context of prior and existing research. (6) All sources used are correctly disclosed (correct citation). Copying of text must be indicated as such by using quotation marks and giving proper reference. (7) All authors have been personally and actively involved in substantial work leading to the paper and will take public responsibility for its content. The violation of the Ethical Statement rules may result in severe consequences. I agree with the above statements and declare that this submission follows Solid-State Ionics’ policies outlined in the Guide for Authors and the Ethical Statement.

Consent to Participate

I am a corresponding author; on behalf of the other authors, I declare that we are satisfied with participating in the research.

Consent for Publication

I am a corresponding author; on behalf of the other authors, I declare that we are pleased to publish this valuable Journal research.

References

  1. IPCC. Climate Change 2021: The Physical Science Basis. In Contribution of Working Group I to the Sixth Assessment Report of the Intergovernmental Panel on Climate Change; Masson-Delmotte, V., Zhai, P., Pirani, A., Connors, S.L., Péan, C., Berger, S., Caud, N., Chen, Y., Goldfarb, L., Gomis, M.I., et al., Eds.; Cambridge University Press: Cambridge, UK, 2021; in press. [Google Scholar]
  2. Adaawen, S. Understanding Climate Change and Drought Perceptions, Impact and Responses in the Rural Savannah, West Africa. Atmosphere 2021, 12, 594. [Google Scholar] [CrossRef]
  3. Li, Z.; Sun, Y.; Li, T.; Chen, W.; Ding, Y. Projections of South Asian Summer Monsoon under Global Warming from 1.5 °C to 5 °C. J. Clim. 2021, 34, 7913–7926. [Google Scholar] [CrossRef]
  4. Angélil, O.; Stone, D.; Wehner, M.; Paciorek, C.J.; Krishnan, H.; Collins, W. An Independent Assessment of Anthropogenic Attribution Statements for Recent Extreme Temperature and Rainfall Events. J. Clim. 2017, 30, 5–16. [Google Scholar] [CrossRef]
  5. Chen, H.; Sun, J. Changes in Drought Characteristics over China Using the Standardized Precipitation Evapotranspiration Index. J. Clim. 2015, 28, 5430–5447. [Google Scholar] [CrossRef]
  6. Stott, P.A.; Christidis, N.; Otto, F.E.L.; Sun, Y.; Vanderlinden, J.P.; van Oldenborgh, G.J.; Vautard, R.; von Storch, H.; Walton, P.; Yiou, P.; et al. Attribution of extreme weather and climate-related events. WIREs Clim. Chang. 2016, 7, 23–41. [Google Scholar] [CrossRef]
  7. Babaeian, I.; Najafinik, Z.; Zabol-Abbasi, F.; Habibi-Nokhandan, M.; Adab, H.; Malbusi, S. Climate change assessment over Iran during 2010–2019 using downscaling of ECHO-G GCM model. Geogr. Dev. 2010, 7, 135–152. [Google Scholar]
  8. Ghahreman, N.; Gharakhni, A. Trend analysis of mean wind speed in different climatic regions of Iran. Iran. J. Lrrigation Drain. 2010, 4, 31–43. [Google Scholar]
  9. Yueyue, H.; Changchun, Z.; Tanveer, A. Vulnerability assessment of rural social-ecological system to climate change: A case study of Yunnan Province, China. Intl. J. Clim. Chang. Strateg. Manag. 2021, 13, 162–180. [Google Scholar]
  10. Buda, S.; Jinlong, H.; Sanjit, K.M.; Jianqing, Z.; Yanjun, W.; Shanshan, W.; Miaoni, G.; Yanran, L.; Shan, J.; Tong, J.; et al. Insight from CMIP6 SSP-RCP scenarios for future drought characteristics in China. Atmos. Res. 2021, 250, 105375. [Google Scholar]
  11. Shanshan, W.; Anqian, W.; Hui, T.; Khalid, M.; Jinlong, H.; Jianqing, Z.; Cheng, J.; Ghulam, R.; Buda, S. Population exposed to drought under the 1.5 °C and 2.0 °C warming in the Indus River Basin. Atmos. Res. 2019, 218, 296–305. [Google Scholar]
  12. Emadodin, I.; Reinsch, T.; Taube, F. Drought and Desertification in Iran. Hydrology 2019, 6, 66. [Google Scholar] [CrossRef] [Green Version]
  13. Abbasi, F.; Kuhi, M.; Javanshiri, Z.; Malbusi, S.; Falamarzi, Y.; Babaeian, I.; Habibi-Nokhandan, M. Climate change detection update over weather stations of Iran. J. Clim. Res. 2020, 11, 46. [Google Scholar]
  14. Babaeian, I.; Karimian, M.; Modirian, R.; Mirzaei, E. Future Climate Change Projection over Iran using CMIP5 Data during 2020–2100. Nivar 2019, 43, 62–71. [Google Scholar]
  15. Saburi, G.; Musavi-Baygi, M.; Babaeian, I. Study of changes in Iran’s climatic zones until 2100 under the Global Warming using statistical downscaling of GCM models. In Proceeding of the Fifth Regional Climate Change Conference, Tehran, Iran, 25 February 2016. [Google Scholar]
  16. Mosadegh, E.; Babaeian, I.; Baygi, M. Uncertainty Assessment of GCM Models in Predicting Temperature, Precipitation and Solar Radiation Under Climate Change Impact in Tehran, Iran. In Proceedings of the Climate Change Impacts on Water Resources, Belgrade, Serbia, 17–18 October 2013. [Google Scholar]
  17. Bannayan, B.; Mohamadian, A.; Alizadeh, A. On Climate Variability in North-East of Iran. J. Water Soil 2010, 24, 118–131. [Google Scholar]
  18. Babaeian, I.; Karimian, M.; Modiriyan, R.; Falamarzi, Y.; Koohi, M. Future Precipitation and Temperature Projection over Eastern Provinces of Iran using Combined Dynamical–Statistical Downscaling Technique. Clim. Chang. Res. 2021, 2, 41–58. [Google Scholar]
  19. Salimi-Fard, M.; Sanaei-Nejad, H.; Jabari-Noghabi, M.; Sabet-Dizavandi, L. Detecting the effect of climate change on extreme temperature events in Khorasan Razavi province Case study: 1990–2015. J. Clim. Res. 2017, 29, 111–124. [Google Scholar]
  20. Kouzegaran, S.; Mousavi-Baygi, M. Investigation of Meteorological Extreme Events in the North-East of Iran. J. Water Soil 2015, 29, 750–764. [Google Scholar]
  21. Babaeian, I.; Koohi, M. Agroclimatic Indices Assessment over Some Selected Weather Stations of Khorasan Razavi Province Under Climate Change Scenarios. J. Water Soil 2012, 26, 953–967. [Google Scholar]
  22. Engström, J.; Jafarzadegan, K.; Moradkhani, H. Drought Vulnerability in the United States: An Integrated Assessment. Water 2020, 12, 2033. [Google Scholar] [CrossRef]
  23. Adger, W.N. Vulnerability. Glob. Env. Chang. 2006, 16, 268–281. [Google Scholar] [CrossRef]
  24. Kristie, L.; Kathryn-Bowen, E. Extreme events as sources of health vulnerability: Drought as an example. Weather. Clim. Extrem. 2016, 11, 95–102. [Google Scholar]
  25. Dai, A. Drought under global warming: A review. Wiley Interdiscipl. Rev. Clim. Chang. 2011, 2, 45–65. [Google Scholar] [CrossRef] [Green Version]
  26. Wilhite, D.A.; Glantz, M.H. Understanding: The drought phenomenon: The role of definitions. Water Int. 1985, 10, 111–120. [Google Scholar] [CrossRef] [Green Version]
  27. Spinonia, J.; Barbosa, P.; De Jager, A.; McCormick, N.; Naumann, G.; Vogt, J.V.; Magni, D.; Masante, D.; Mazzeschi, M. A new global database of meteorological drought events from 1951. Hydrol. Reg. Stud. 2019, 22, 100593. [Google Scholar] [CrossRef] [PubMed]
  28. Guo, H.; Chen, J.; Pan, C. Assessment on Agricultural Drought Vulnerability and Spatial Heterogeneity Study in China. Int. J. Environ. Res. Public Health 2021, 18, 4449. [Google Scholar] [CrossRef]
  29. Duong, H.; Thuc, H.; Ribbe, T. Assessing and Calculating a Climate Change Vulnerability Index for Agriculture Production in the Red River Delta, Vietnam. Redefining Divers. Dyn. Nat. Resour. Manag. Asia 2017, 2, 27–40. [Google Scholar]
  30. Tsesmelis, D.E.; Karavitis, C.A.; Oikonomou, P.D.; Alexandris, S.; Kosmas, C. Assessment of the Vulnerability to Drought and Desertification Characteristics Using the Standardized Drought Vulnerability Index (SDVI) and the Environmentally Sensitive Areas Index (ESAI). Resources 2019, 8, 6. [Google Scholar] [CrossRef] [Green Version]
  31. Ortega-Gaucin, D.; Bartolón, J.C.; Bahena, H.V.C. Drought Vulnerability Indices in Mexico. Water 2018, 10, 1671. [Google Scholar] [CrossRef] [Green Version]
  32. Dabanli, I. Drought Risk Assessment by Using Drought Hazard and Vulnerability Indexes. Nat. Hazards Earth Syst. Sci. Discuss. 2018. [CrossRef]
  33. Noorisameleh, Z.; Khaledi, S.; Shakiba, A.; Zeaiean-Firouzabadi, P.; Gough, W.A.; Qader-Mirza, M. Comparative evaluation of impacts of climate change and droughts on river flow vulnerability in Iran. Water Sci. Eng. 2020, 13, 265–274. [Google Scholar] [CrossRef]
  34. Zarafshani, K.; Sharafi, L.; Azadi, H.; Van Passel, S. Vulnerability assessment models to drought: Toward a conceptual framework. Sustainability 2016, 8, 588. [Google Scholar] [CrossRef] [Green Version]
  35. Ahmadi, E.; Hejazizadeh, Z.; Alijani, B.; Saligheh, M.; Danaiefard, H. A New Climate Vulnerability Index Sistan and Baluchistan province. Res. Geogr. Sci. 2015, 15, 73–96. [Google Scholar]
  36. Ekrami, M.; Fatehimarj, A.; Barkhordaeu, J. Assessment Agricultural Drought Vulnerability in Arid and S-arid climates using GIS and AHP, A Case Study for Taft Township: Yazd Province-Iran. Irrig. Water J. 2015, 5, 107–117. [Google Scholar]
  37. Hoseini, S.S.; Nazari, M.R.; Araghinejad, S. Investigating the impacts of climate on agricultural sector with emphasis on the role of adaptation strategies in this sector. Iran. J. Agric. Econ. Dev. Res. 2013, 44, 1–16. [Google Scholar]
  38. Fatehimarj, A.; Hassaniabadi, F. Developing an Agricultural Drought Risk Management Plan: Pilot Project for Alamut-Ghazvin; Final Project Report; Soil Conservation and Watershed Management Research Institute: Tehran, Iran, 2012. [Google Scholar]
  39. Raziei, T.; Sotoudeh, F. Investigation of the accuracy of the European Center for Medium Range Weather Forecasts (ECMWF) in forecasting observed precipitation in different climates of Iran. J. Earth Space Phys 2017, 43, 133–147. [Google Scholar]
  40. Maraun, D.; Wetterhall, F.; Ireson, A.M.; Chandler, R.E.; Kendon, E.J.; Widmann, M.; Brienen, S. Precipitation downscaling under climate change: Recent developments to bridge the gap between dynamical models and the end user. Rev. Geophys. 2010, 48, 1–34. [Google Scholar] [CrossRef]
  41. Themeßl, M.; Gobiet, A.; Leuprecht, A. Empirical-statistical downscaling and error correction of daily precipitation from regional climate models. Int. J. Climatol. 2011, 31, 1531–1544. [Google Scholar]
  42. Sarr, M.A.; Seidou, O.; Tramblay, Y.; El Adlouni, S. Comparison of downscaling methods for mean and extreme precipitation in Senegal. J. Hydrol. Reg. Stud. 2015, 4, 369–385. [Google Scholar] [CrossRef] [Green Version]
  43. Xuewei, F.; Jiang, L.; Jiaojiao, G. Statistical downscaling and projection of future temperatures across the Loess Plateau, China. Weather. Clim. Extrem. 2021, 32, 100328. [Google Scholar]
  44. Smid, M.; Cristina-Costa, A. Climate projections and downscaling techniques: A discussion for impact studies in urban systems. Int. J. Urban Sci. 2018, 22, 277–307. [Google Scholar] [CrossRef] [Green Version]
  45. Ruti, P.; Ruti, P.M.; Somot, S.; Giorgi, F.; Dubois, C.; Flaounas, E.; Obermann, A.; Dell’Aquila, A.; Pisacane, G.; Harzallah, A.; et al. MED-CORDEX initiative for Mediterranean Climate studies. Bull. Amer. Met. Soc. 2016, 97, 1187–1208. [Google Scholar] [CrossRef] [Green Version]
  46. Vicente-Serrano, S.M.; Begueria, S.; Lopezmoreno, J.L. A multiscalar drought index sensitive to global warming: The standardized precipitation evapotranspiration index. J. Clim. 2010, 23, 1696–1718. [Google Scholar] [CrossRef] [Green Version]
  47. UNDP. Calculating the Human Development Indices; Technical Note 1 in Human Development Report; UNDP: New York, NY, USA, 2002; 253p. [Google Scholar]
  48. Purtaheri, M.; Eftekhari, R.; Kazemi, N. Level and degree of drought vulnerability in rural areas of Iran from farmers views. J. Geogr. Res. 2016, 48, 19–31. [Google Scholar]
  49. Masoudi, M.; Hakimi, S. A new model for vulnerability assessment of drought in Iran using Percent of Normal Precipitation Index (PNPI). Iran. J. Sci. Technol. Trans. A Sci. 2014, 38, 435–440. [Google Scholar]
  50. Carrao, H.; Naumann, G.; Barbosa, P. Mapping global patterns of drought risk: An empirical framework based on sub-national estimates of hazard, exposure and vulnerability. J. Glob. Environ. Chang. 2016, 39, 108–124. [Google Scholar] [CrossRef]
  51. Zhao, T.; Dai, A. The Magnitude and Causes of Global Drought Changes in the Twenty-First Century under a Low–Moderate Emissions Scenario. J. Clim. 2015, 28, 4490–4512. Available online: https://journals.ametsoc.org/view/journals/clim/28/11/jcli-d-14-00363.1.xml (accessed on 18 November 2021). [CrossRef]
  52. Lu, J.; Carbone, G.J.; Grego, J.M. Uncertainty and hotspots in 21st century projections of agricultural drought from CMIP5 models. Sci. Rep. 2019, 9, 4922. [Google Scholar] [CrossRef]
  53. Vaghefi, S.A.; Keykhai, M.; Jahanbakhshi, F.; Sheikholeslami, J.; Ahmadi, A.; Yang, H.; Abbaspour, K.C. The future of extreme climate in Iran. Sci. Rep. 2019, 9, 1464. [Google Scholar] [CrossRef] [PubMed] [Green Version]
  54. Khazanedari, L.; Zabol-abbasi, F.; Ghandhari, S.; Kuhi, M.; Malbusi, S. Drought conditions in the next thirty years in Iran. J. Geograpgy Reg. Dev. 2009, 7, 83–98. [Google Scholar] [CrossRef]
Figure 1. Overview of research design.
Atmosphere 12 01704 g001
Figure 2. Area under study, situated in the east of Iran.
Atmosphere 12 01704 g002
Figure 3. Taylor diagram showing performance of 19 GCMs (listed in the bottom of the figure) for precipitation (left) and temperature (right) during 1979–2005 with comparing ERA-interim data (blue-colored dot on the horizontal axis) with historical data of GCMs.
Atmosphere 12 01704 g003
Figure 4. Amount of adaptation capacity and sensitivity of each county, using data retrieved from national MPO.
Atmosphere 12 01704 g004
Figure 5. Maps showing an overview of Exposure/SPEI (upper-left panel), Adaptation Capacity (upper-right panel), and Sensitivity (lower-left panel) and resulting DVI (lower-right panel) during 1986–2005.
Atmosphere 12 01704 g005
Figure 6. Future drought projection over study region using SPEI under RCP4.5 scenarios for 2021–2040, 2041–2060, 2061–2080, and 2081–2100.
Atmosphere 12 01704 g006
Figure 7. Future drought projection over study region using SPEI under RCP8.5 scenarios for 2021–2040, 2041–2060, 2061–2080 and 2081–2100.
Atmosphere 12 01704 g007
Figure 8. Drought vulnerability index for the 2030s, 2050s, 2070s, and 2090s under RCP4.5 scenarios. Counties with white hachure show lack of data.
Atmosphere 12 01704 g008
Figure 9. Drought vulnerability index for the 2030s, 2050s, 2070s, and 2090s under RCP8.5 scenarios. Counties with white hachure show lack of data.
Atmosphere 12 01704 g009
Figure 10. Maps showing the projected level of Drought Vulnerability Index (DVI) over North Khorasan, Khorasan-Razavi, and South Khorasan provinces under RCP4.5 (above) and RCP8.5 (below).
Atmosphere 12 01704 g010
Figure 11. DVI’s mean regional uncertainty over northeast of Iran.
Atmosphere 12 01704 g011
Table 1. Summary of CMIP5 climate models used in this study.
ModelInstituteResolution
(Longitude × Latitude)
CanESM2Canadian Centre for Climate Modelling and Analysis (CCCMA)2.77 × 2.8125
GFDL-ESM2MNOAA Geophysical Fluid Dynamics Laboratory (GFDL)2.02 × 2.5
CNRM-CM5Centre National de Recherches Météorologiques/Centre Européen de Recherche et Formation1.40 × 1.40
Table 2. SPEI drought classification for dry and wet grades [5].
CategorySPEI Classification
Extremely Dry≤2
Severely Dry−1.99 to −1.5
Moderately Dry−1.49 to −1.0
Near Normal−0.99 o 0.99
Moderate Wet1.0 to 1.49
Severely Wet1.5 to 1.99
Extremely Wet≥2
Table 3. Sensitivity indicators and sub-indicators and their functional relationship with drought vulnerability.
IndicatorSub-IndicatorRelationship
PopulationVulnerable peoples (age ≥ 64 or age ≤ 15)
Population of female-headed households
Illiterate population
people working in agriculture
ResidentialPopulation living in villages
Population living on the outskirts of megacities
Households with dirt floor
EmploymentEmployment rate
Number of industrial workshops
Number of technical and vocational centers
Table 4. Adaptive capacity indicators and their functional relationship with vulnerability to drought.
IndicatorSub-IndicatorRelationship
Vegetation CoverForest area
Rangland area
Poor rangeland area
Desert area
Water resourcesWater withdrawal from deep and semi-deep wells
InfrastructureRailway length
Metro length
Freeway length
Length of the main road
Airports
EducationLiterate population
Ratio of higher education to total literacy
HealthAvailability of health insurance
Per capita treatment bed
Per capita health care centers
EconomyPer capita general income
Revenue to urban cost ratio
Revenue to rural cost ratio
Inactive population percentage
Percentage of unemployed population
Percentage of public sector employees
Public servicesHousehold without heat source (gas and electricity)
Household without drinking water network
Table 5. Degree and values of vulnerability [31].
Degree of VulnerabilityValues of Vulnerability
Very low0 < V ≤ 20
Low20 < V ≤ 40
Moderate40 < V ≤ 60
High60 < V ≤ 80
Very high80 < V ≤ 100
Table 6. Comparison of individual SPEI drought index and weighted SPEI during period of 1986–2005.
CanESMCNRM-CM5GFDL-ESM2MMulti-Model
SPEI0.630.590.580.59
Correlation0.140.360.260.41
Bias0.120.080.080.09
RMSE14.910.3812.187.48
Weighs0.350.470.18
Publisher’s Note: MDPI stays neutral with regard to jurisdictional claims in published maps and institutional affiliations.

