1. Introduction
In the last few years, tornadoes are receiving growing attention in Italy. This is due to a combination of different factors. On one hand, the greater attention to environmental issues in TV channels and journals is putting more emphasis on climate- and weather-related risks, including severe weather episodes in the context of climate change (the press release from the Italian National Research Council (CNR) about the updated climatology of tornadoes in Italy in 2018 was cited by the most important Italian news programs and newspapers). On the other hand, social media and the diffusion of smartphones have made it possible for a large audience of weather amateurs to share pictures and videos of tornadoes, contributing to an important crowdsourcing activity. Such documents are often posted in web journals and magazines, becoming popular among a large number of web surfers.
In addition, the number of Italian tornado studies has increased in the last 20 years. In the 2000s, just a handful of papers were published in a decade, mainly concerning tornadoes that affected the northeastern Italian regions [
1,
2,
3,
4]; also, a historical chronicle of tornadoes in the extreme southeastern “heel-of-the-boot” (from 1546 onward) was published [
5]. Giaiotti et al. (2007) [
4] gave an important contribution in the field, providing a climatology of Italian tornadoes and waterspouts from 1991 to 2000 nearly 30 years after [
6]. They identified the conditions favorable to tornado development with the use of proximity soundings and determined the values of convective available potential energy (CAPE) and of low and deep wind shear typical for Italian tornadoes.
In the 1990s and in the following years, many reports of intense events, mainly affecting the northern Italian regions, were also made available on the web (refs. [
7,
8], just to mention a few). This “gray” literature has the undoubted merit to create a bibliography of Italian supercells and tornadoes, often investigated with professional analysis, and to share and to promote the interest in the fields among the amateurs (ref. [
9] for a comprehensive bibliography on Italian tornadoes).
In the meanwhile, two dramatic events rose the attention of the media on Italian tornadoes, promoting new scientific studies on the topic. The first one reached category 3 in the enhanced Fujita scale (EF3); the vortex hit the Ilva steel plant in Taranto on 28 November 2012, killed one worker and was responsible for about 60 M€ of damage. The vortex was very well documented with several videos, which were able to identify the different phases of the tornado-spawning supercell lifetime and to document its exceptional features for Europe, e.g., its unusual vortex dimension and translational speed [
10]. The mechanisms responsible for the tornado were deeply investigated, highlighting the key role of the orography [
11] and of the sea surface temperature [
12] in the genesis of this tornado. The second event, on 8 July 2015, was one of the few EF4 Italian tornadoes in the historical record, and produced one death, 72 casualties, and 20 M€ damages in the surroundings of Venice, destroying a 17th-century villa [
13,
14]. In these two cases, the first (to our knowledge) damage surveys of Italian tornadoes published in the scientific literature were provided [
15,
16].
The need for a pan-European comprehensive database of severe weather events, comparable with the US Severe Weather Database, was promoted by Nikolas Dotzek, who founded the European Severe Storm Laboratory (ESSL;
https://www.essl.org) and started to organize a European Severe Weather Database (ESWD; [
17]). These data gave the opportunity to elaborate pan-European climatologies of tornadoes and of other severe weather events [
18,
19] and to identify the mesoscale conditions favorable to their development [
20,
21,
22]. ESWD also represented the basis for the development of tornado climatology in Mediterranean countries [
23,
24], including Italy, where Miglietta and Matsangouras (2018) [
25] (MM18 hereafter) developed a new climatology for tornadoes and waterspouts covering the 10-year period 2007–2016.
In addition, the European Storm Forecast Experiment (known as ESTOFEX) produced the first attempt for convective outlooks over Europe: on a daily basis, predictions of severe weather in European regions are issued at the forecast range 12–36 h. In the wake of the European initiative, a similar activity was developed at the national level by the website pretemp.it, with the objective of creating an experimental center for the prediction of severe weather in Italy. This activity goes in the direction proposed in [
10], about the opportunity of a tornado (and severe convection) warning system over Italy.
The project “Comparison of Tornadic Supercells and their environmental conditions in Japan and Italy”, funded by the cooperation program between the Japan Society for the Promotion of Science (JSPS) and the Italian National Research Council (CNR), promoted further research on tornadoes in Italy. Starting from the analysis of a tornado-spawning supercell in northeastern Italy [
26], which showed peculiar mesoscale environmental conditions compared to those typical, for example, of the US Great Plains, the project had the objective of identifying similarities and differences in the environments conducive to tornadogenesis in Italy with respect to Japan and the US. A waterspout over the Liguria region was deeply investigated during the project [
27], showing that waterspouts of modest intensity can be identified using radar reflectivity and Doppler radar velocity, even when the vortex is a few tens of km away from the radar site.
An additional result of the cooperation project is the present paper. Tochimoto and Niino (2016; hereafter TN16) [
28] and Tochimoto and Niino (2018; TN18) [
29] analyzed composites of large-scale and mesoscale fields during tornado occurrences associated with extratropical cyclones (ECs) in the US and in Japan, respectively. Here, composites of reanalysis from 2007 to 2016 are used to investigate the characteristics of ECs causing tornadoes in Italy, considering their seasonal variations. The paper is organized as follows: the methodology is described in
Section 2, results are analyzed in
Section 3. Conclusions and future plans are finally drawn in
Section 4.
2. Methods
In the perspective of analyzing the environmental conditions conducive to tornado occurrences in Italy, we use the Japanese 55-year Reanalysis dataset (JRA-55; [
30,
31]) that provides 6-hourly data with a resolution of 1.25° × 1.25° over 37 vertical levels (grid spacing of 25 hPa from 1000 to 750 hPa and from 250 to 100 hPa, 50 hPa from 750 to 250 hPa). To calculate the storm relative helicity (
SREH; [
32]), wind components are interpolated linearly to height levels at 250-m intervals.
The ECs are detected by using the tracking algorithm in [
33,
34] to 6-hourly 900 hPa relative vorticity, which is truncated to T42 horizontal resolution in order to focus on synoptic-scale cyclones [
35,
36]. The algorithm has detected ECs reasonably well in several past studies (e.g., [
36] and related bibliography). The tracking method is applied to the region 30°–60° N, 0°–30° E, which is considered wide enough to include all the tornado-related cyclones. Tornado occurrences are taken from the dataset developed in MM18, which is largely based on the ESWD produced by ESSL, and covers the 10 years from 2007 to 2016, a period during which the number of tornadoes of enhanced Fujita category 1 or higher (EF1+) does not show any obvious trend (Figure 10 in MM18).
ECs provide environments favorable for the development of tornadoes, particularly in the warm sector [
37]. As the tracks of ECs over the Mediterranean vary with the time of the year [
38], the ECs are classified into three categories based on the season: spring (March, April, and May: MAM), autumn (September, October, and November: SON), and winter (December, January, and February: DJF). Since EC activity is minimal in summer, we exclude those cyclones from our analysis.
Following TN16, the definition of a tornadic EC (TEC) is an EC accompanied by a tornado within 10° (in longitude and latitude) from its center and within 3 h of the time of JRA-55 reanalysis. The key time (KT) is the time at which the reanalysis fields relative to the tornado refers to.
The JRA-55 coarse reanalyses are not fully representative of the mesoscale atmospheric conditions associated with the tornado occurrence. In addition, considering that the reanalyses are available only every 6 h, they provide a snapshot of the atmospheric conditions that may differ from the time of the tornado occurrence up to 3 h. Since ECs and their fronts may be assumed to move with translational speeds of about 20–50 km h−1, the displacement in 3 h is 60–150 km, thus smaller than or comparable with the JRA-55 grid spacing of 120 km. Thus, one may estimate that the error in the relative location of tornadoes and fronts is of the order of one grid point. A more refined analysis, able to identify clearly the detailed mesoscale features evolving over a much shorter temporal scale, would require finer temporal and spatial data. This may be relevant in the Mediterranean, where the complex coastlines and orography can significantly modulate mesoscale parameters even over relatively short distances.
The characteristics of the ECs are identified using composite analysis, i.e., meteorological variables are superposed with respect to the TEC center, defined as the 900 hPa vorticity maximum. The composite analysis is performed at KT.
Environmental parameters associated with severe storms, based on moisture, instability, and shear, were analyzed to distinguish tornadic from non-tornadic storms and tornado outbreaks from non-outbreaks [
39,
40,
41,
42]. The relationships between synoptic conditions and tornadogenesis were extensively studied for US tornadoes [
43,
44,
45,
46].
Storm relative helicity (
SREH) and convective available potential energy (
CAPE) are considered in the present study among the mesoscale parameters that characterize tornadic storm environments.
SREH measures the streamwise vorticity within the inflow environment of a convective storm, which gives the potential for storm rotation; it is defined as:
where
is the environmental wind,
is the storm motion,
is the estimated inflow depth, and
is a unit vertical vector. We adopt
and estimate
following [
47]. Using a mesoscale model, the capacity of convective parameters in discriminating between tornadic and non-tornadic thunderstorms was analyzed for some severe convective cases in the US [
43], concluding that
SREH was useful to identify areas favorable to supercell development. Davies-Jones et al. (1990) [
32] found that the 0–1 km
SREH is a useful parameter to distinguish tornadic from non-tornadic environments [
39,
40,
48].
CAPE is the positive buoyant energy available for a parcel rising from its initial height level to the level of neutral buoyancy (
LNB), according to:
where
is the parcel potential temperature,
is the potential temperature of the environment,
g is the gravity acceleration, and
LFC (
LNB) is the level of free convection (neutral buoyancy). In the present study, the initial height level of the lifted parcel was set to the closest pressure level of JRA-55 above the ground (surface-based
CAPE;
SBCAPE).
3. Results
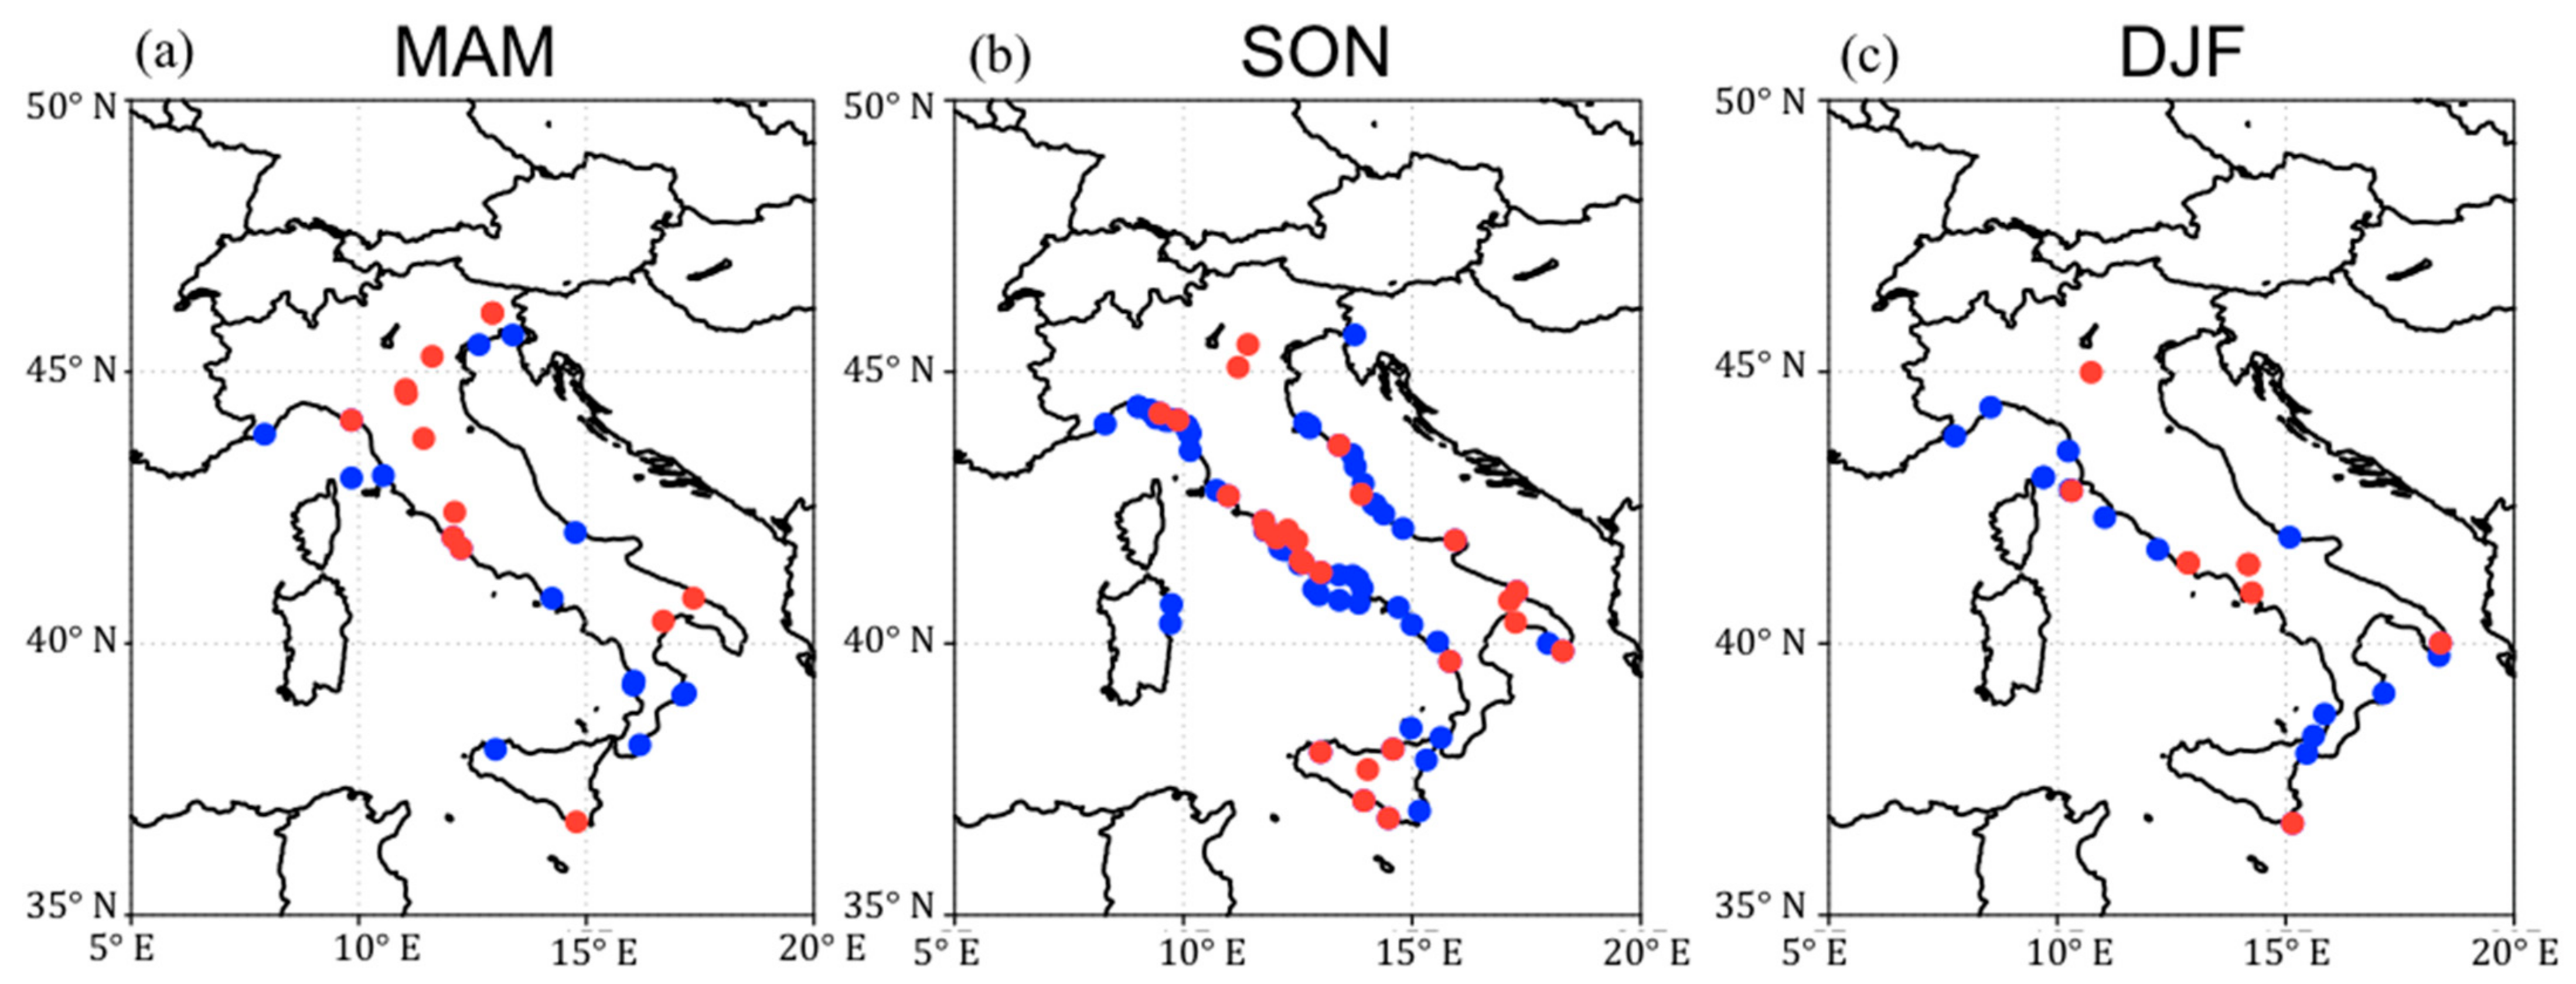
In the present Section, the tornado locations and the environmental parameters are shown with respect to the cyclone center (composite fields) and discussed hereafter. The tornadoes associated with ECs are grouped by season in
Figure 1. As discussed in MM18, spring cases are associated with the outbreak of cold mid-troposphere air crossing the Alps. Although they may occasionally occur along the coasts, the highest frequency is in the Po valley; we found that most of these tornadoes are EF1+. Autumn is the season (together with summer) with the highest number of tornado reports. As shown in MM18, they occur mainly along the coastlines of northern and southern Italian regions, usually generated as waterspouts. Lastly, the cases in winter are less frequent than in autumn, and they are mainly confined to the central and southern coastal regions.
Figure 2 shows tracks of TECs for spring, autumn and winter. There are three major groups of tracks around Italy: the first includes cyclones moving from northern Africa to the southern Mediterranean: they occur mainly in autumn, when they may occasionally evolve from ECs into tropical-like cyclones [
49]; the second group includes cyclones moving at higher latitudes, from the Atlantic to western Europe, which affects the northern Italian regions through the southern part of the associated cyclonic circulation; the third refers to cyclones formed in the Mediterranean, mainly in autumn and winter, which cross the peninsular regions: the lower latitudes, where these cyclones develop, explain the higher frequency of tornadoes in central and southern Italy in these two seasons. Thus, the seasonal variability in the distribution of tornadoes is somewhat explained by the difference in the cyclone tracks.
A composite of tornado locations relative to the cyclone center at KT is shown in
Figure 3. Different from the US and Japan (TN16, TN18), many tornadoes in Italy do not occur in the warm sector of ECs. In fact, tornadoes are distributed sporadically around the cyclone location, within a window of 10° × 10° around the center. Most of them are in the southern and eastern side of the cyclones, but a significant number also occur in the northwestern quadrant, especially during spring. The presence of EF0 tornadoes makes the interpretation of these results difficult since the mechanisms of development for landspouts and weak waterspouts may be very different from those for mesocyclonic tornadoes. Thus, in order to obtain less ambiguous results, we focus on the most intense tornadoes, EF1+ and EF2+, in the middle and right panels of
Figure 3, respectively. Although the number of cases is limited, results show that the most intense tornadoes occur in the southeastern and southwestern quadrants: they are observed mainly in the warm sector or along the cold front. The six EC-associated EF2+ tornadoes develop in the warm sector, apart from one event located in the southwestern quadrant, along the cold front and quite far from the cyclone center.
The composite analysis of mesoscale environmental parameters identifies the environmental conditions associated with tornado occurrences in the different seasons.
Figure 4 shows
CAPE and 0–1 km
SREH. As discussed hereafter, significant differences exist in the seasonal distributions of both dynamic and thermodynamic parameters.
During autumn (middle panel), positive
CAPE regions exist southeast of the cyclone center.
CAPE values are the highest in this season (as also noted for Japan in TN18), as the peak is greater than 180 J kg
−1, and values above 100 J kg
−1 cover a wide region, extending from the cyclone center to the extreme southeastern corner of the panel (
Figure 4). The highest values of
CAPE are a few hundred km far from the cyclone center; most tornadoes occur northwest of this area, along a corridor passing through the center.
About SREH, the highest values (above 180 m2 s−2) are northeast of the cyclone location (as in TN18), while values above 90 m2 s−2 extend from northeast to south of the cyclone center, covering most of the southeastern quadrant. Thus, the locations of several tornadoes occurring in the southwestern quadrant, associated with a cold front, do not overlap the region of high SREH.
Most winter cases (
Figure 4, right) occur near the cyclone center, north of the region of maximum
CAPE, in an area of moderate
SREH. The highest values of
CAPE are much smaller than in autumn (less than 80 m
2 s
−2) and are confined in the warm sector within a few hundred km on the southern side of the cyclone or close to the cold front. Although the highest values of SREH are comparable to those in autumn, they cover a wider region, as the isoline of 90 m
2 s
−2 includes most of the area east of the cyclone center; this difference partly reflects the location and intensity of the jet streams in the two seasons (see later).
The composite in spring (
Figure 4, left) shows two distinct peaks in
SREH: one northeast of the cyclone center, almost overlapping the peak in autumn, and another far south, apparently affected by the position of the jet stream. The maximum values of
CAPE are comparable to the winter ones, but the pattern is different. In fact, some spots of intense
CAPE are elongated in the northeast-southwest direction passing through the cyclone center. Most tornadoes are reported around the central spot, near the cyclone center, mainly on the northwestern side; thus, most cases do not overlap with the areas of high
SREH in spring.
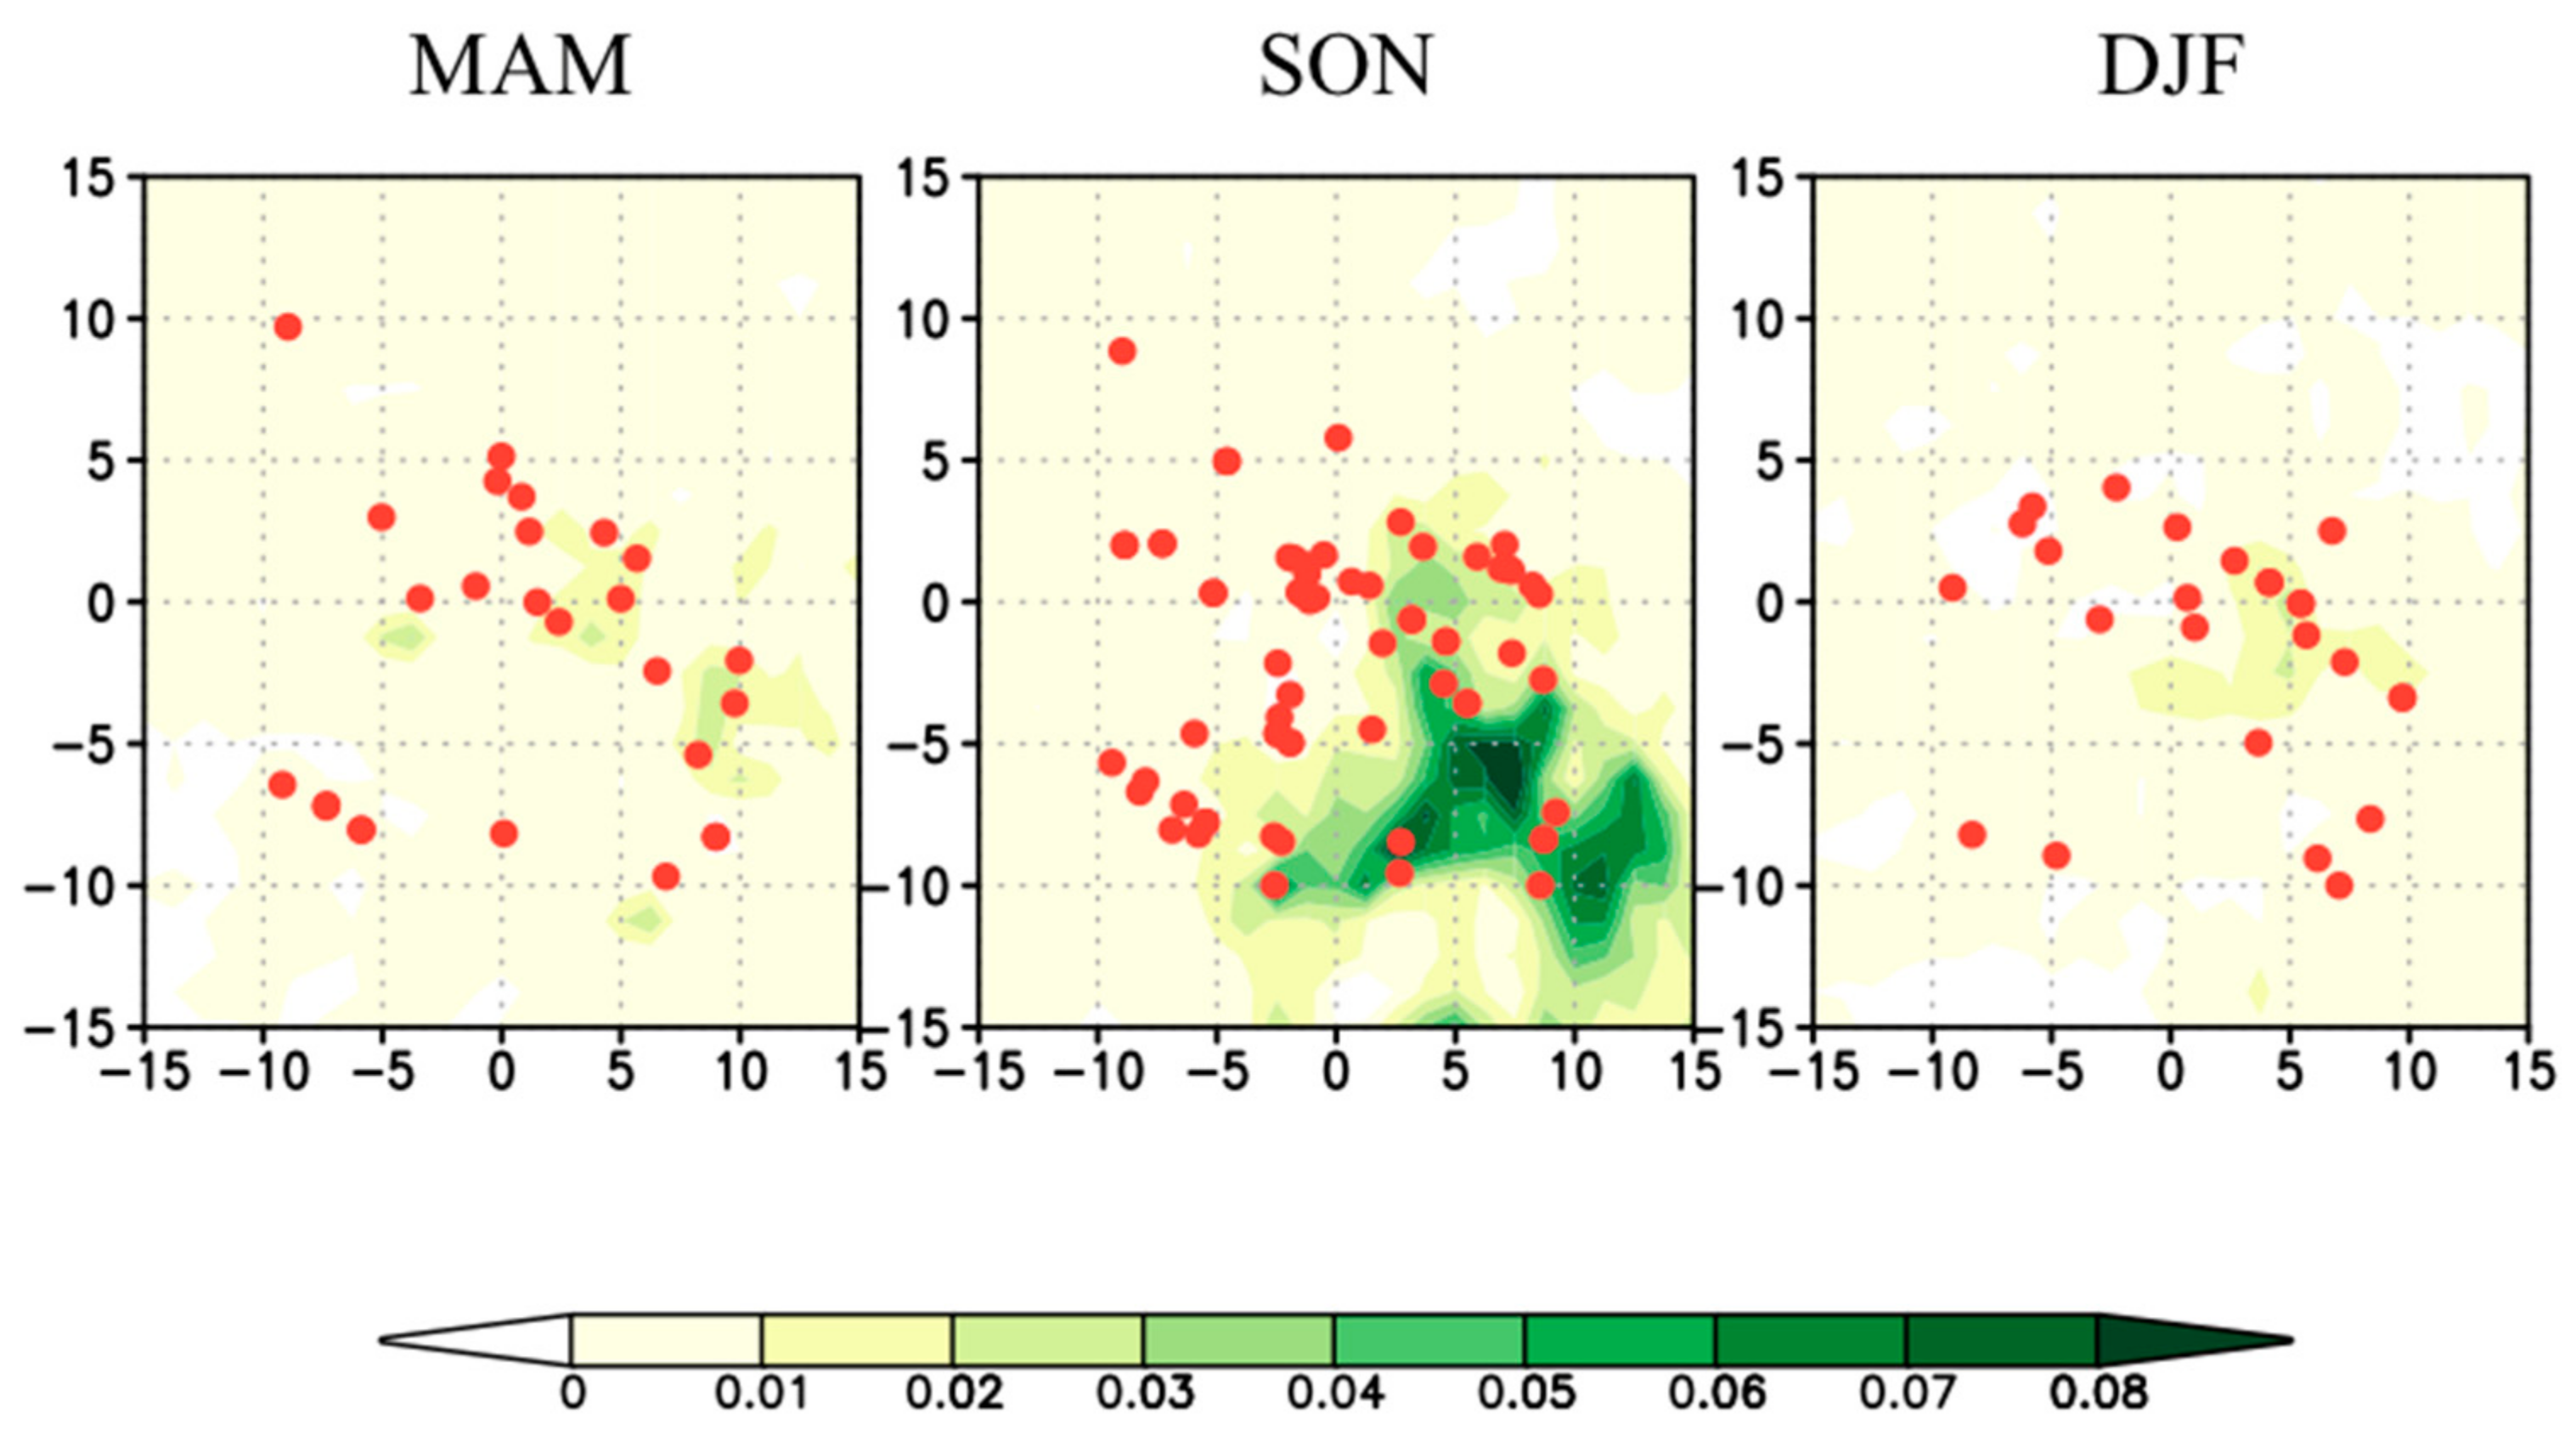
The specific conditions conducive to Italian tornadoes are also represented in
Figure 5, where the energy helicity index (
EHI) is based on 0–1 km
SREH [
50] is shown:
Rasmussen (2003) [
39] suggested that
EHI was the best discriminator between tornadic and non-tornadic storms. Due to the smaller
CAPE and
SREH, the values of
EHI for Italian tornadoes are much lower than those for US tornadoes (cfr. with Figure 8 in TN16); however, they are comparable to those for Japanese tornadoes (cfr. with Figures 3, 7, 10 and 14 in TN18), showing a similar seasonal variation in
EHI intensity, ranging from a minimum in winter to a maximum in autumn.
Differences in
CAPE among the seasons may be partially explained by the low-level specific humidity
QV. As shown in
Figure 6, tornadoes in autumn occur in the warm sector and along the cold front, respectively north and west of the area of higher
QV (above 8 g kg
−1), which nearly overlaps with the region of maximum
CAPE (above 100 J kg
−1). In autumn, the stronger evaporation over the warm Mediterranean Sea affects the low-level humidity distribution, determining higher humidity (and
CAPE), thus leading to conditions more favorable to tornado development. In winter, the majority of tornadoes occur along or near the northernmost isoline of
QV equal to 5 g kg
−1, while in spring, they mostly occur within the northwestern end of the tongue of warm and moist air (above 6 g kg
−1). Obviously, high values of
CAPE are not only due to high low-level humidity and temperature but also depend on the presence of cool air in the upper levels, which is associated with potential vorticity (
PV) anomalies, as shown in
Figure 7.
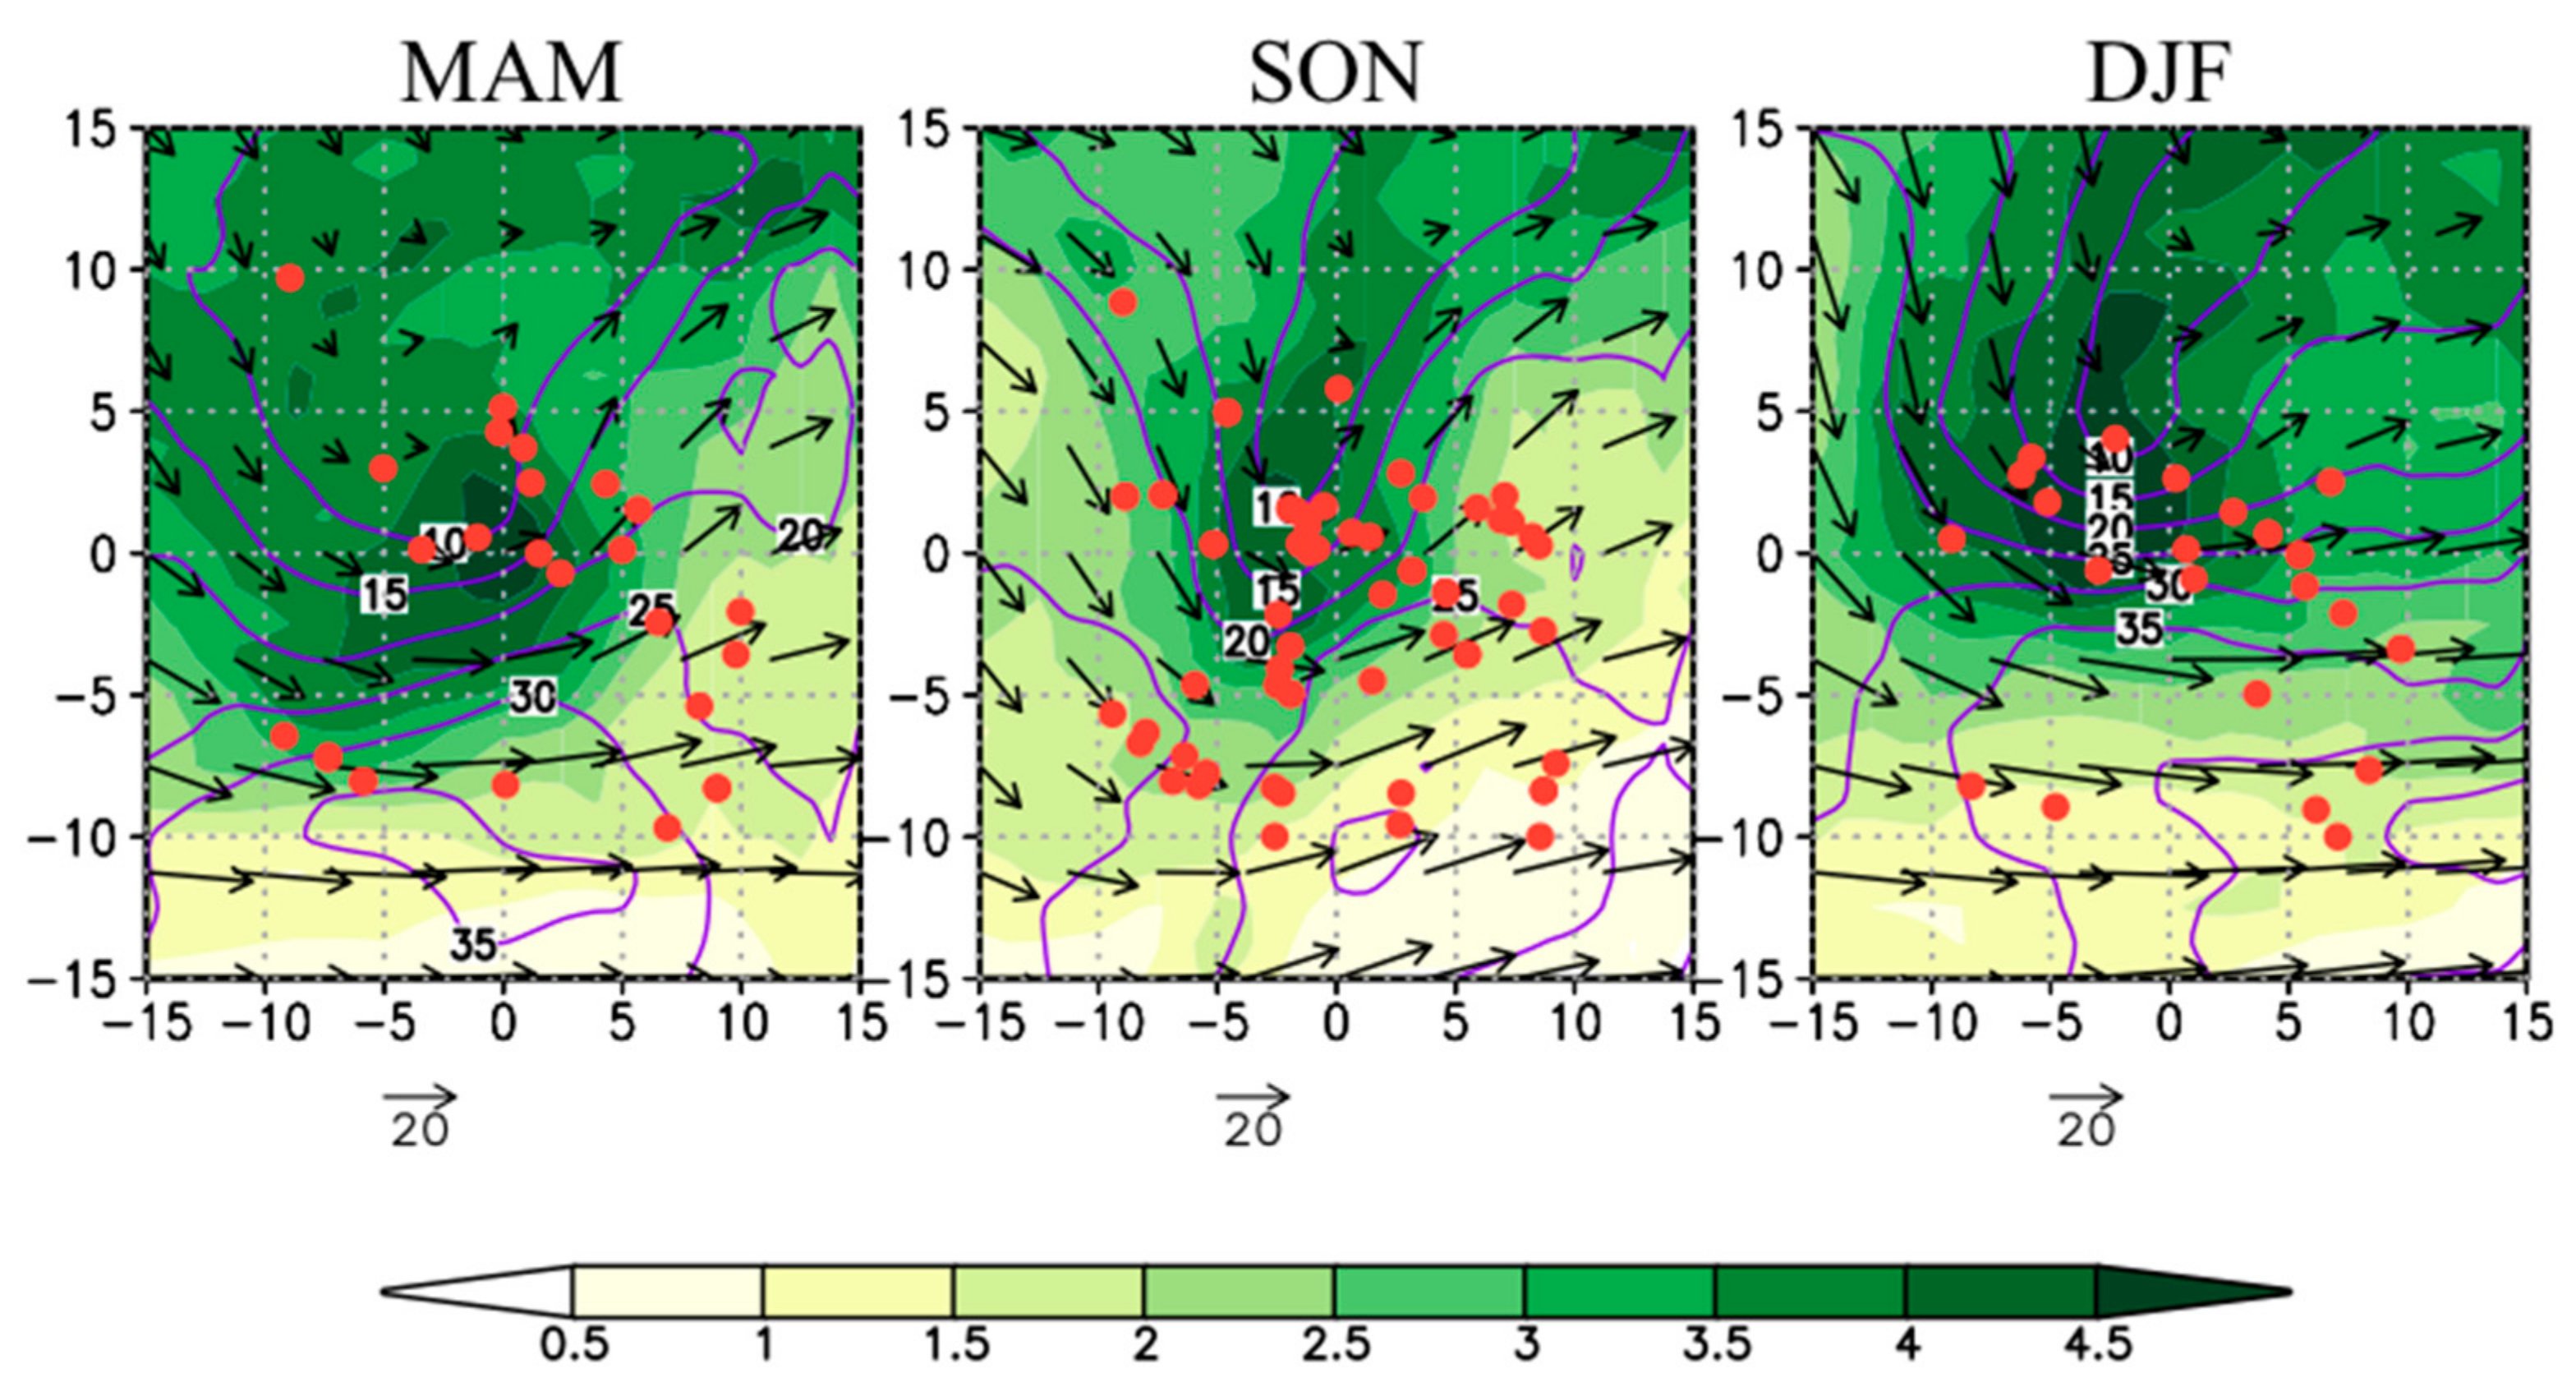
Upper-level
PV anomalies often affect tornado development: for example, upper-level
PV influenced a tornado outbreak in the US on 3–4 May 1999 [
51]. Composite of
PV for each season at 250 hPa is shown in
Figure 7 together with the 250 hPa wind. During autumn, tornadoes occur mainly within and around the area of maximum
PV anomaly, north of the jet stream axis, which is located south of the cyclone center. In winter, the jet stream is more intense and is located southeast of the cyclone center; tornadoes occur mainly in the region surrounding the area of maximum
PV near the cyclone center.
In spring, the maximum wind is south-southwest of the cyclone center; tornadoes occur mainly in the jet left exit area, east of the maximum PV, which is nearly superimposed with the cyclone center and is more elongated toward lower latitudes than in the other two seasons. In fact, upper-level PV anomalies exceeding 4.5 PVU (PV units; 1 PVU = 10−6 m2 s−1 K kg−1), accompanied by a cold air mass, intrude from the northwest to above the cyclone center, also affecting the northern side of the warm sector and contributing to the higher potential instability in this area. Additionally, as discussed in TN18, the PV anomaly may induce stronger large-scale upward motion, which contributes to the destabilization of the low-to-mid level troposphere. Furthermore, considering that tornadoes develop near the jet left exit area, which is more favorable to ascending motion, one may conclude that the upper-level dynamics are more relevant in spring, in agreement with TN18. In contrast, the weaker PV anomaly and its different position (slightly west of the cyclone center) suggest that tornadoes in autumn are associated with less mature cyclones.
4. Discussion
The distribution of
CAPE in
Figure 4 suggests that the mechanism active in autumn may be similar to that described in [
11,
12], relative to a waterspout that made landfall over southeastern Italy. The vortex developed north of an area of high
CAPE, which rapidly moved eastward, crossing the southern Mediterranean; its location was pretty far from the cyclone, which was centered over the Tyrrhenian Sea. Although the maximum potential instability was several hundred km farther south, the increase in
CAPE was sufficient to fuel convection, which was triggered by orographic uplift [
11]. These considerations suggest that potential instability is an important element for tornadogenesis in autumn.
Considering that
Figure 4 shows composites of reanalysis data, whose resolution is coarse, the peak values of 0–1 km
SREH above 180 m
2 s
−2 in autumn, located east to the cyclone center, can be considered very high: they are comparable with those observed for tornado outbreaks in the US (TN16) and higher than those reported in Japan (TN18). In TN18, the increased surface friction was considered responsible for the increased shear (and
SREH) in US tornadoes compared to Japan, as most of the ECs in the US are located inland, while around Japan they generally develop over the sea (where surface friction is lower). The results of the present study suggest that other factors may be relevant as well, considering that, east of the cyclone location, where
SREH is maximum, the low-level flow is southerly, which means over the Mediterranean Sea in most Italian cases. Tochimoto and Niino (2017) [
52] showed that the detailed structure of the cyclones, in particular the jet stream, contributes to differences in
SREH.
The patterns of
CAPE and
SREH observed during tornadoes in the US (TN16) and in Japan in autumn (TN18) are similar to the Italian composite in autumn (
Figure 4, middle panel), which refers mainly to tornadoes in the southern Italian regions (as discussed in MM18). However, the values of
CAPE in Italy are much lower than those in the US: this is an indication of environmental conditions less favorable to tornadoes in Europe than in the US [
22]. In addition, the values of
CAPE in autumn are intermediate between those occurring in Japan, respectively north and south of 40° N (TN18) in the same season, suggesting that a latitudinal variation of
CAPE may be relevant in Italy too. This point will be the subject of additional investigation in a forthcoming paper.
5. Conclusions and Future Plans
This is the first study about the climatology of extratropical cyclones (ECs) that cause tornadoes in Italy. Statistical characteristics of EC structures and environments are analyzed between 2007 and 2016 using the JRA-55 reanalysis, considering separate composites for spring, autumn, and winter. Tornadoes are distributed sporadically around the cyclone location, within a window of 10° × 10° around the center. The difference in cyclone tracks partially explains the seasonal distribution of tornadoes.
The highest number of tornadoes associated with ECs occur south of the cyclone center, mainly in the warm sector, while a few occur along the cold front. This is not surprising, considering that the warm sector is often characterized by an upper-level westerly jet stream (
Figure 7), located not far from the center of the EC; this configuration strengthens the vertical shear, especially the deep-layer shear, but also the low-level shear (
Figure 4), and transports cool/dry air into the mid-upper troposphere, while low-level southerlies transport warm/moist air into the warm sector (
Figure 6), increasing potential instability (
Figure 4), thus favoring deep moist convection [
53]. The strong vertical wind shear and veering wind contribute to mesocyclone generation through the tilting of the horizontal vorticity. However, occasionally tornadoes may also form along the cold front; the location of the latter cases, occurring typically in spring, appear to be better correlated to the elongated upper-level
PV anomaly (
Figure 7) than to lower level features (
Figure 4 and
Figure 6).
A composite analysis of mesoscale parameters identifies the environmental conditions associated with tornado occurrences in the different seasons. During autumn, high CAPE regions exist southeast of the cyclone; CAPE (and EHI) values are much higher than in the other seasons. Thus, potential instability is an important element of tornadogenesis in autumn. The highest CAPE in autumn is associated with relatively high-temperature and water vapor content at low-levels, which are due to high sea surface temperatures responsible for the strong evaporation over the warm Mediterranean Sea. The distribution of upper-level PV anomalies, accompanied by cold air, is relevant from the viewpoint of static stability, mainly in spring and winter.
In autumn, warm-sector tornadoes develop in an area of moderate-to-high
SREH, while cold front tornadoes are generally associated with moderate-to-low
SREH. While tornadoes in winter occur in areas of relatively high
CAPE and
SREH, most cases in spring do not overlap with the areas of high
SREH. Overall, the environments analyzed here are similar to the high-shear, low-
CAPE (HSLC) environments typical of cool-season tornadoes in the southeastern US [
54]. On average,
CAPE values are lower than those of US Midwest tornadoes and comparable to Japanese ones (but lower than Japanese tornadoes south of 40° N in autumn), while
SREH is comparable to US tornadoes and higher than that of Japanese tornadoes, indicating that the environmental conditions for Italian tornadoes have peculiar characteristics.
The present study has a number of limitations that should be taken into consideration. First, the dataset is limited to 10 years of data; thus, the statistics are based on a small number of cases that may affect the robustness of the results. Second, the time and space resolution of the data, respectively 6 h and 1.25°, is coarse: while this is enough to provide a rough representation of the synoptic-scale environment, it is not sufficient to represent mesoscale features, e.g., the veering of the wind with height and CAPE, evolving in short temporal scales and small distances. This is true in particular in the Mediterranean, where the complex topography can modulate meteorological parameters even over relatively short distances. In order to solve these issues, a longer tornado dataset, covering 20 years, and ERA-5 reanalyses, with 1 h and 31 km resolution, will be used in a forthcoming study, where the mesoscale conditions favorable to tornado development will be identified for some Italian regions.
Additionally, the mesoscale parameters, which are discussed here for the entire Italian territory, should be better differentiated in regional clusters in order to take into consideration the different environments present in the peninsular regions compared to those typical of northern Italy. Such differences can be better understood by investigating the mechanisms of development in specific subregions: a study of the environmental conditions favorable to tornadoes in the Ionian Italian regions is currently in progress.
Finally, the present study has analyzed some peculiar characteristics of the Italian tornadoes in comparison with both Japanese and US Midwest cases. Following the work in [
55], we plan to define more clearly such differences and to identify the characteristics of European and US tornadoes from a rigorous statistical perspective.


 ,
, 


