
The Influence of Ocean Acidification and Warming on DMSP & DMS in New Zealand Coastal Water

 , , and
Abstract
:1. Introduction
2. Experiments
2.1. Mesocosm Experiments
2.2. Ancillary Measures
2.3. DMSP and DMS Analysis
2.4. Culture and Incubation of Dominant Diatom
2.5. Statistical Analysis
3. Results
3.1. Ancillary Measures
3.1.1. Chl-a
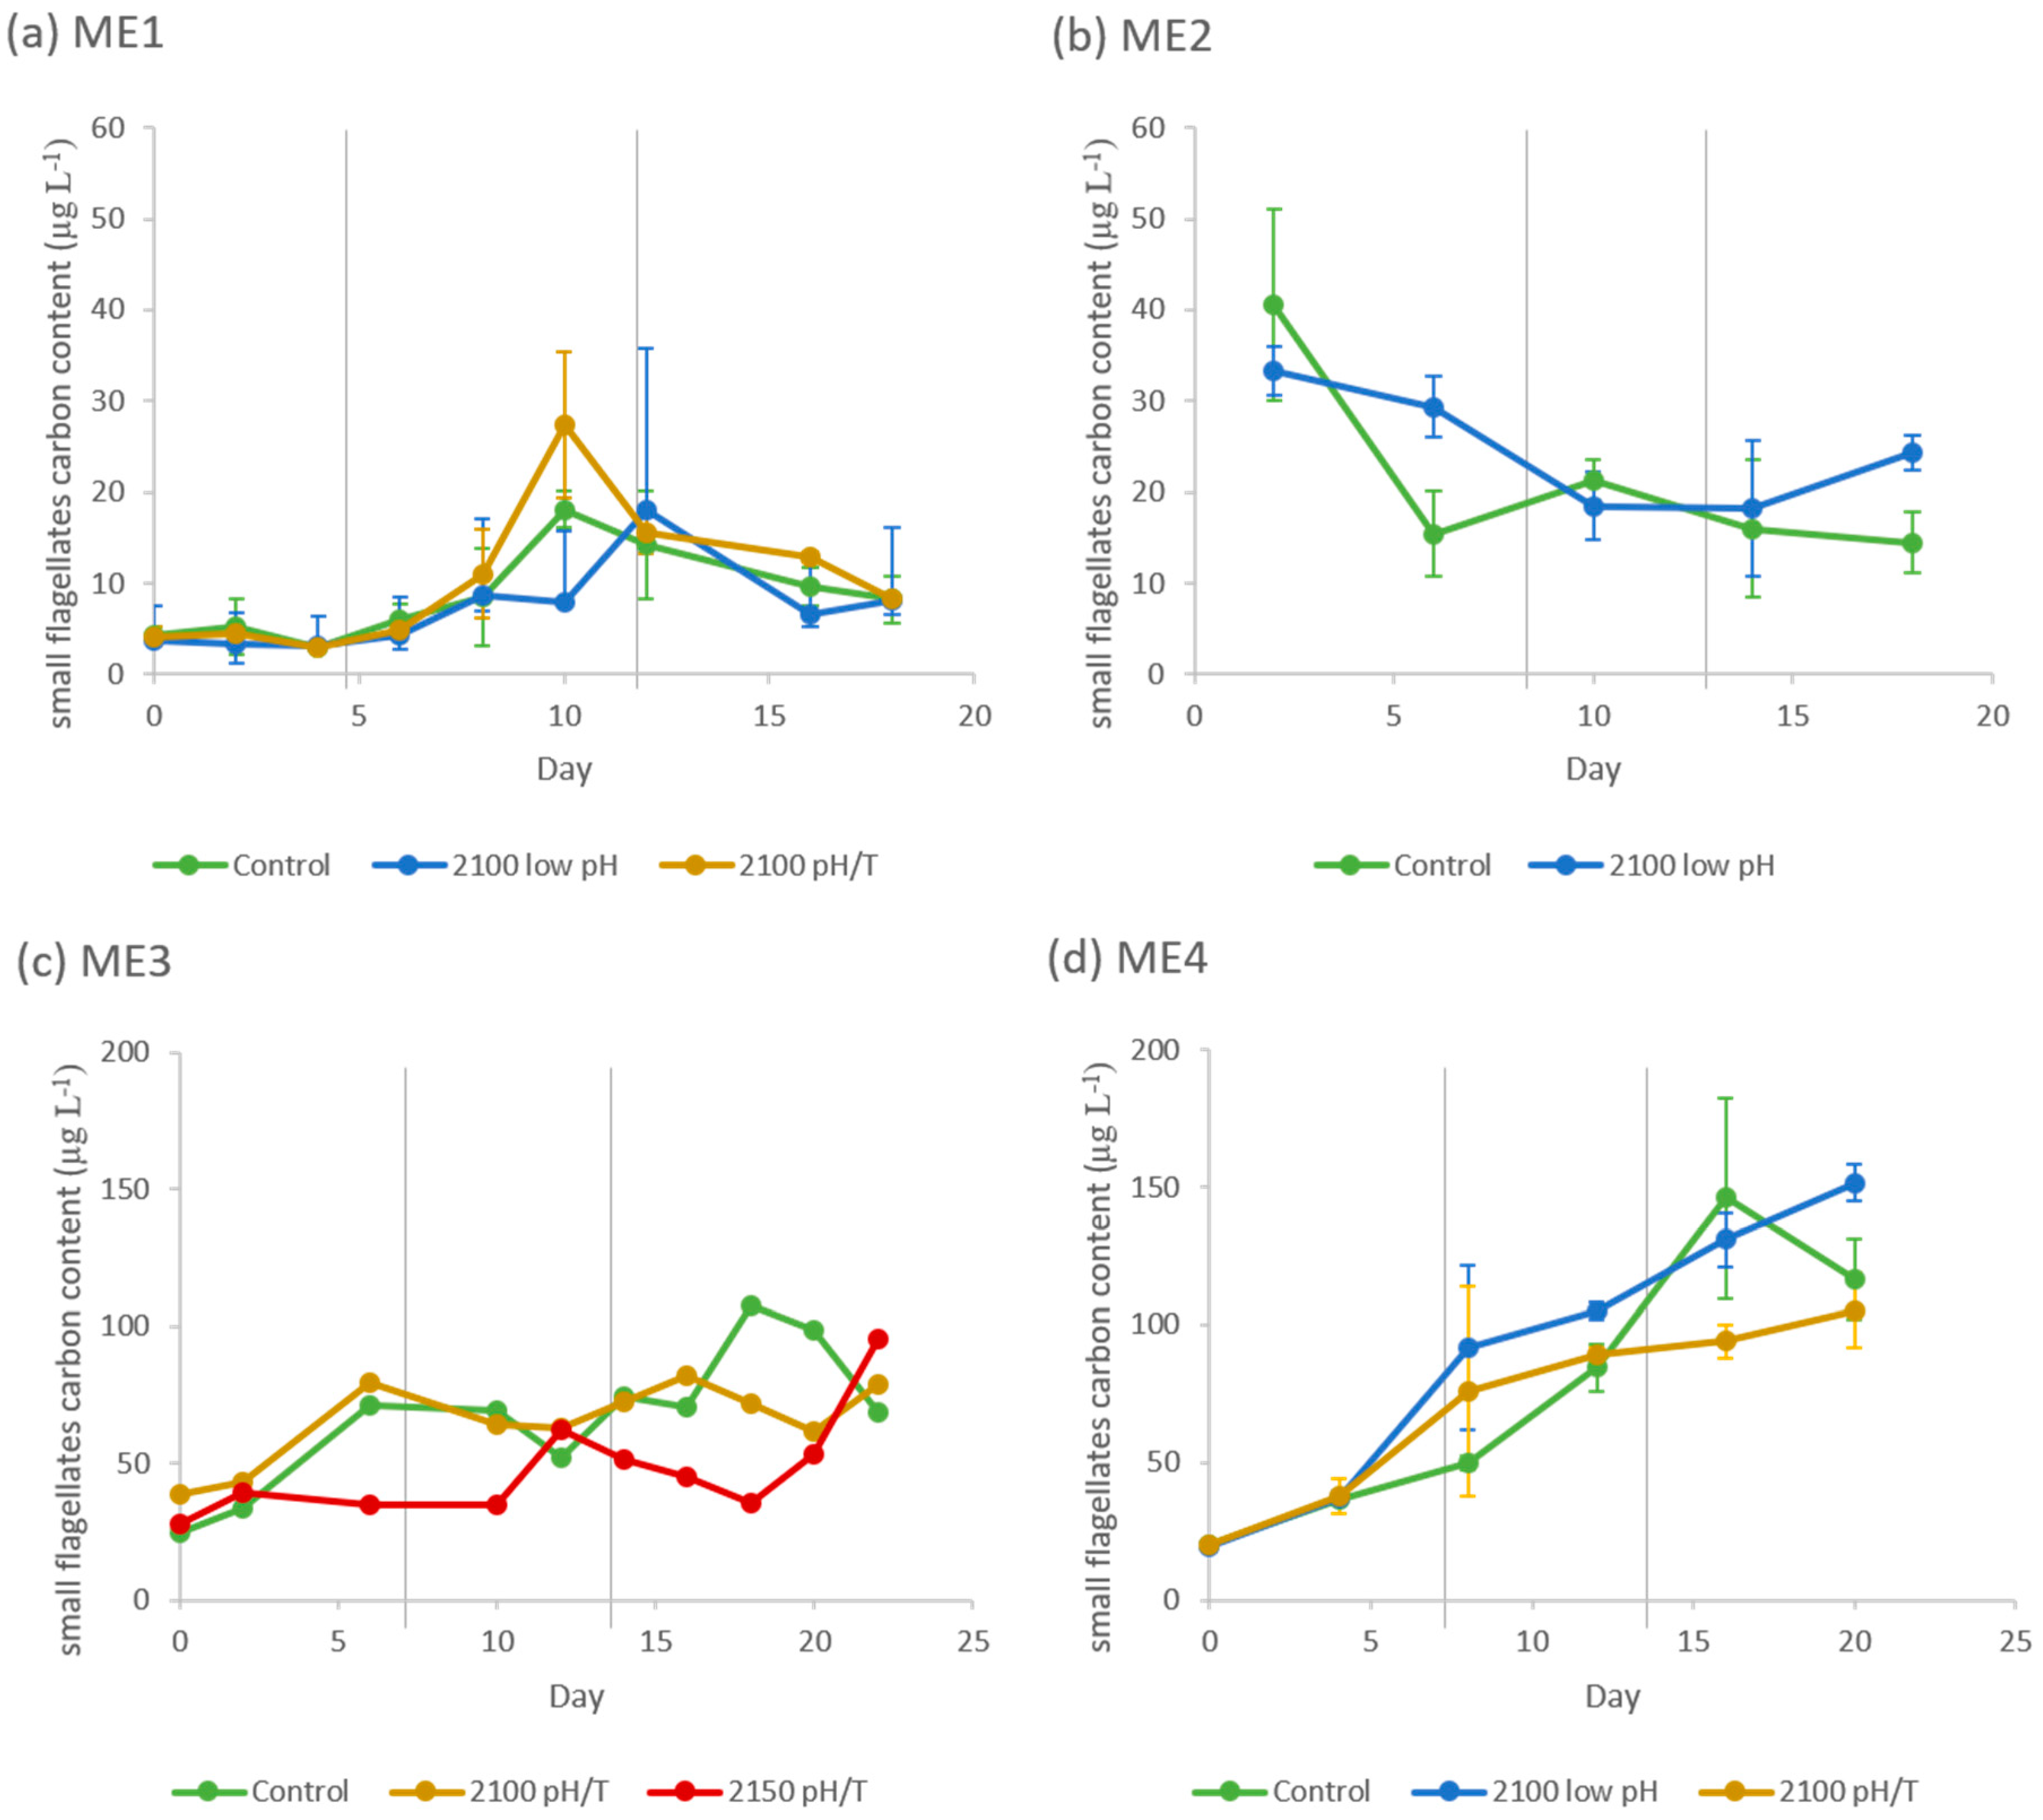
3.1.2. Phytoplanktonic Composition
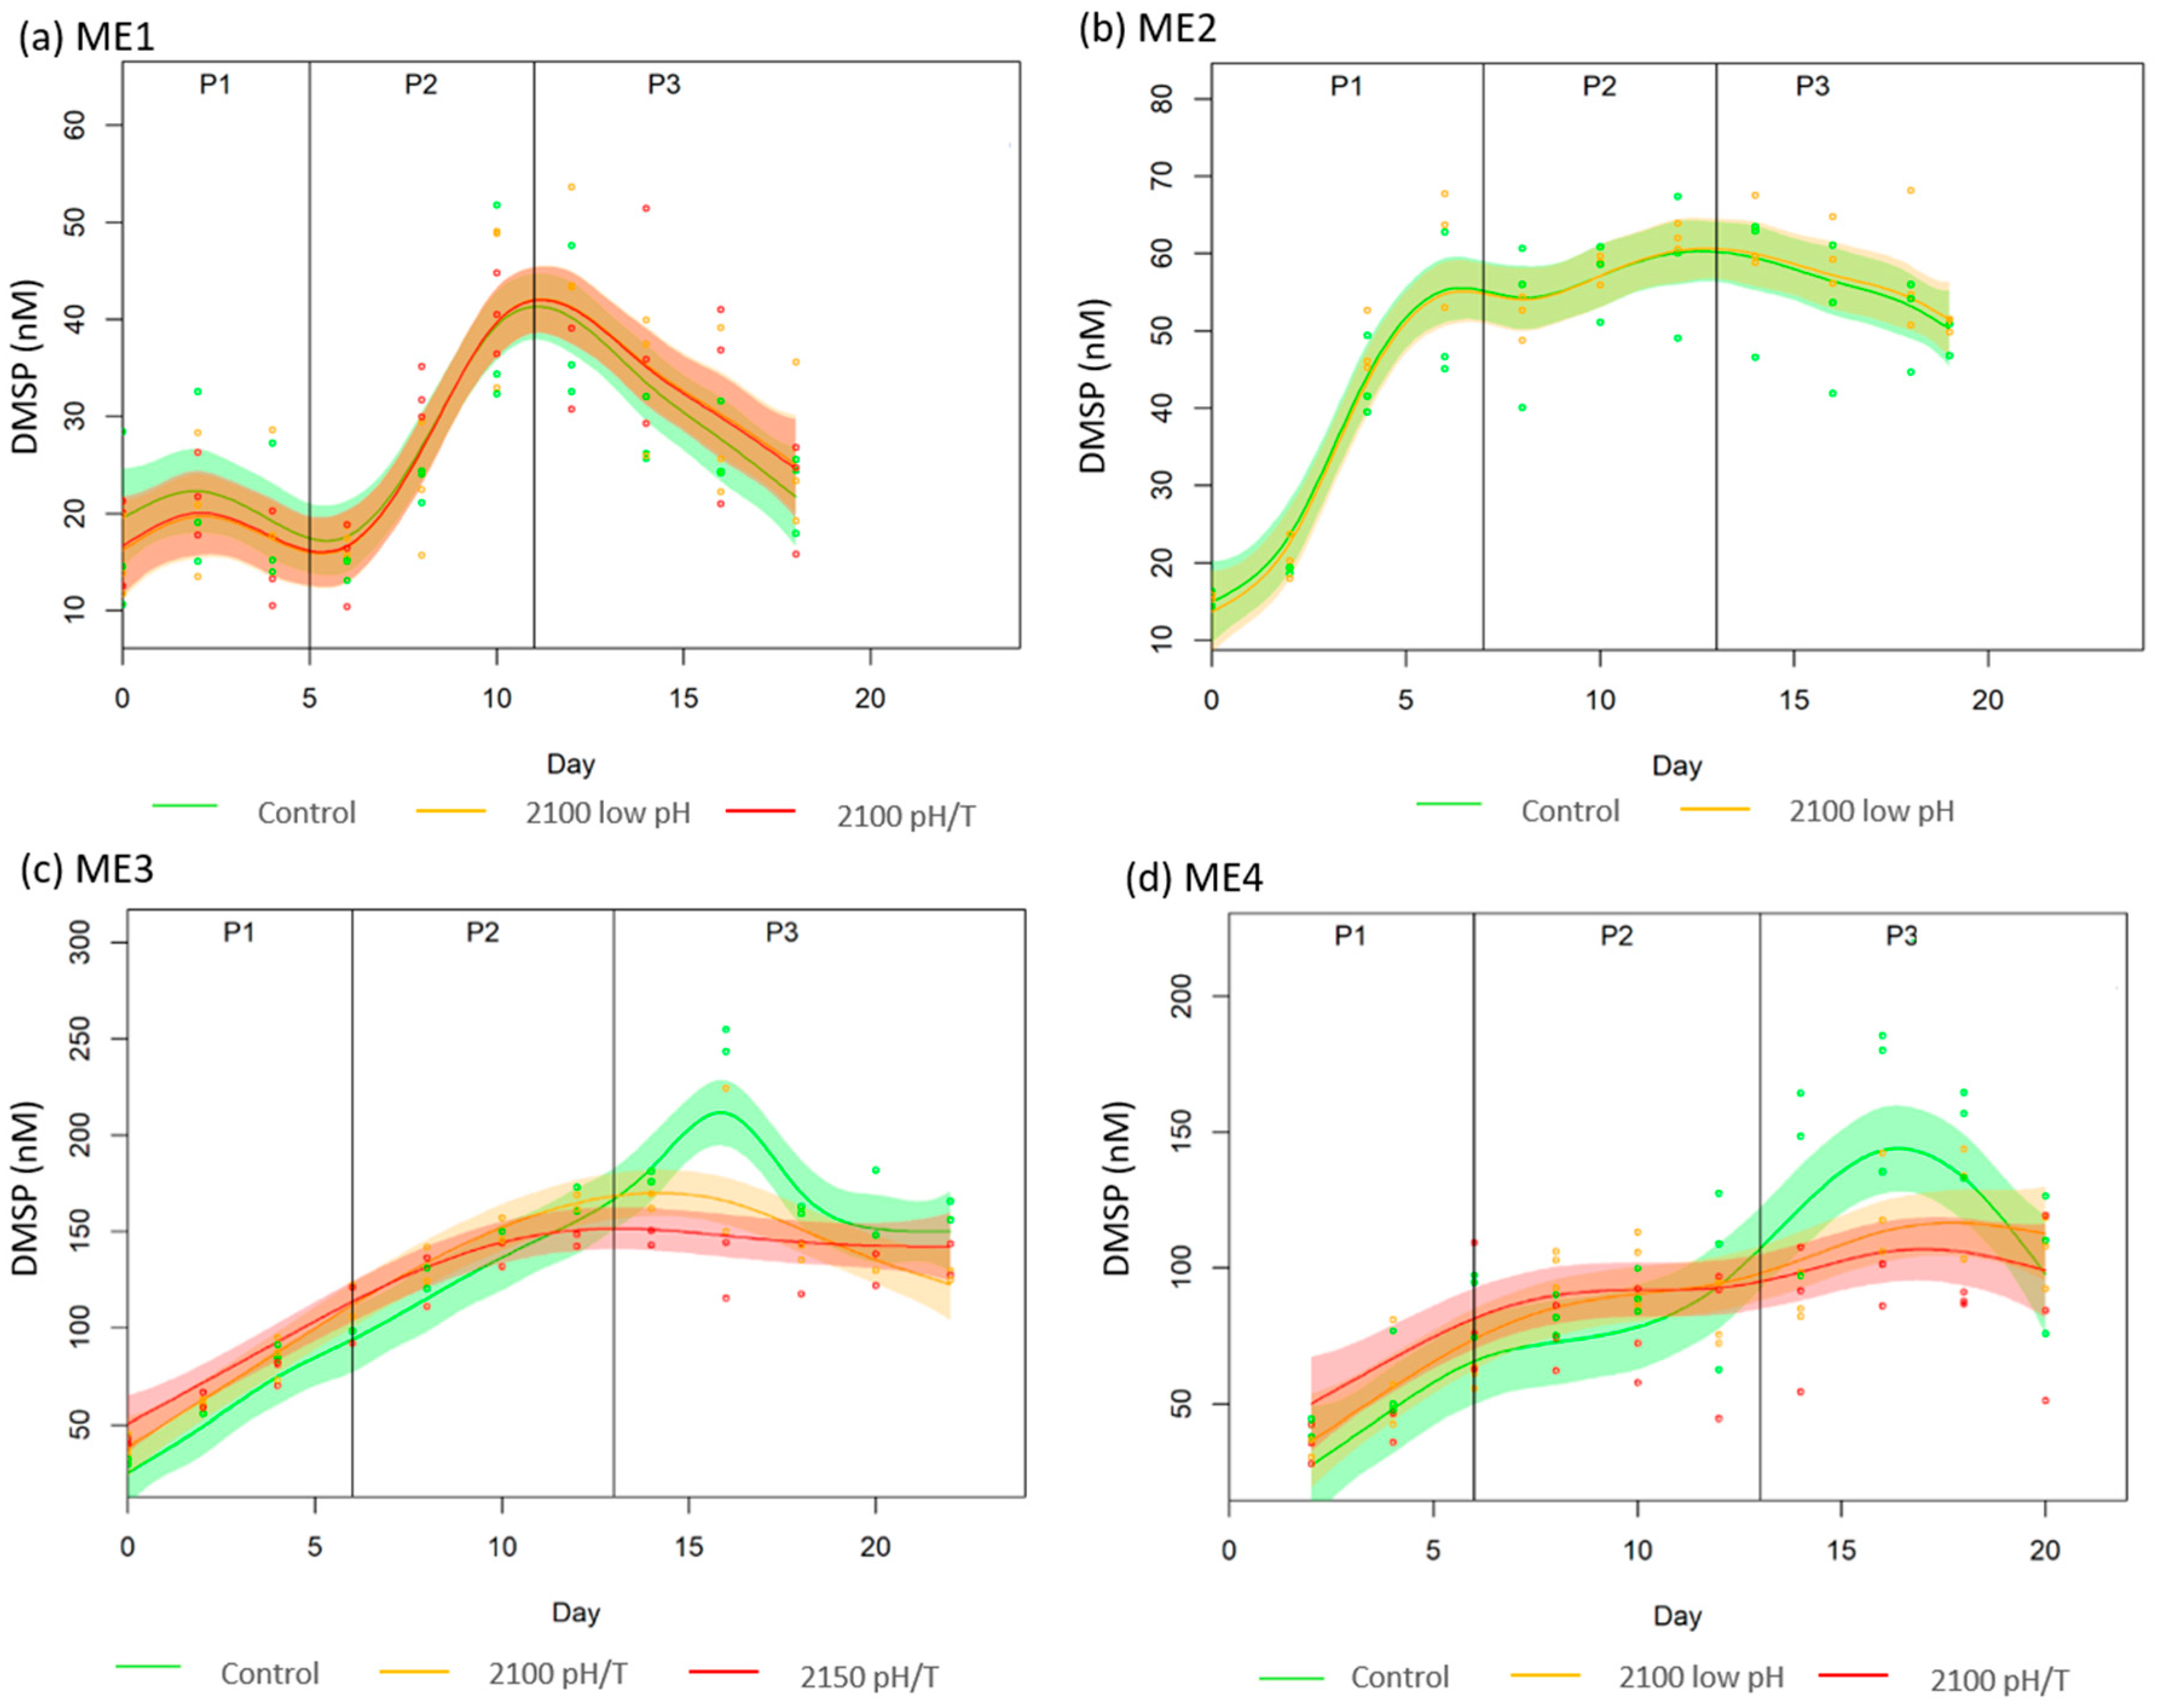
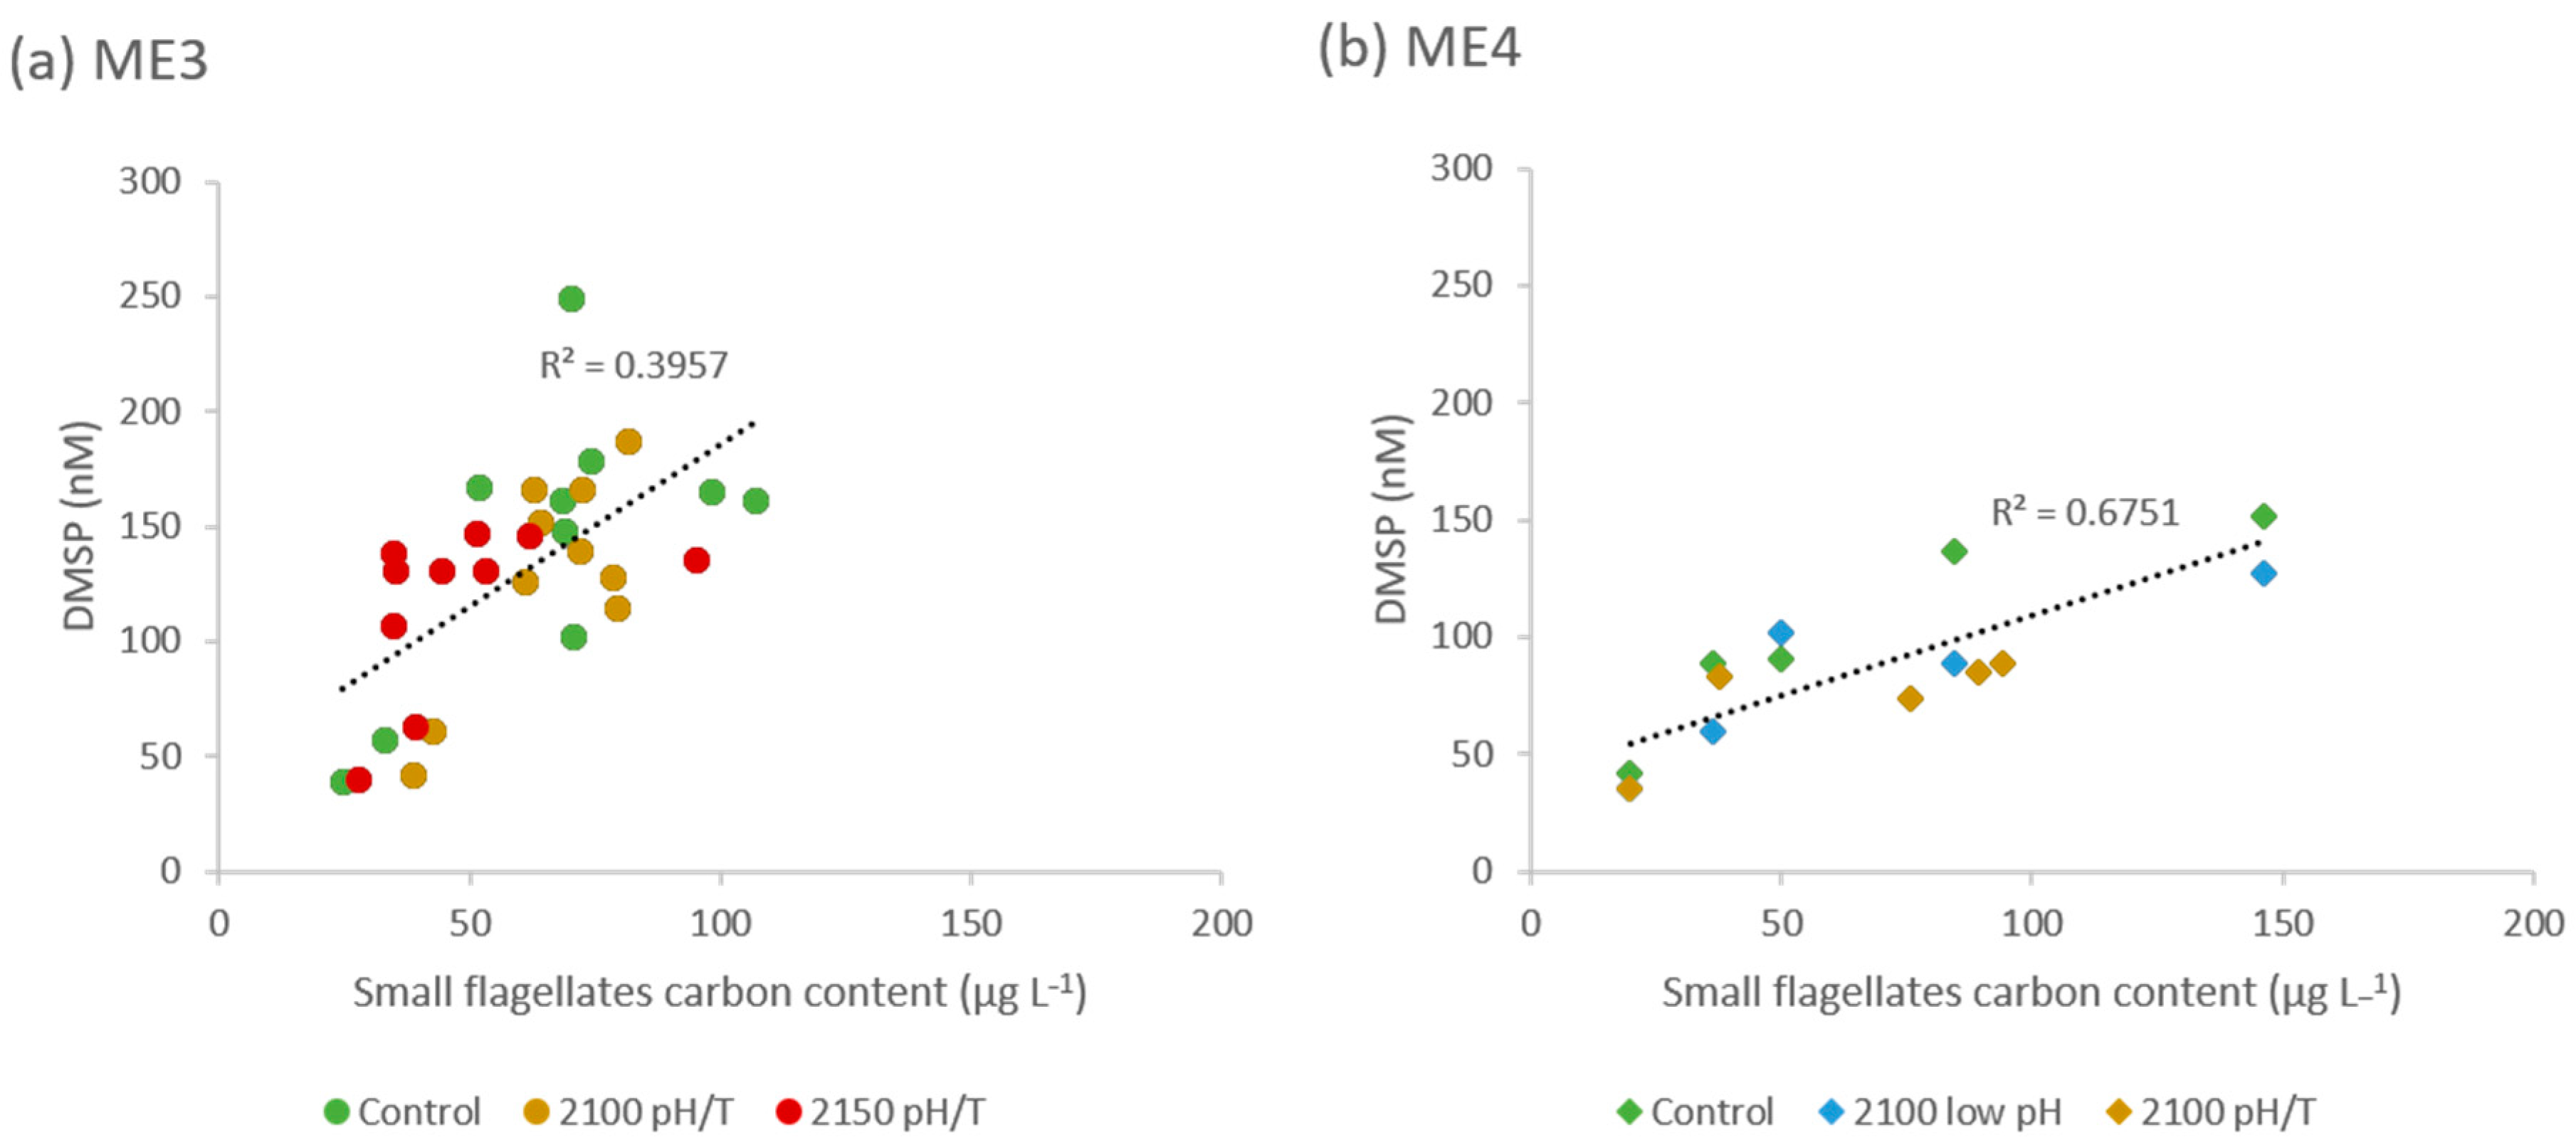
3.2. DMSP
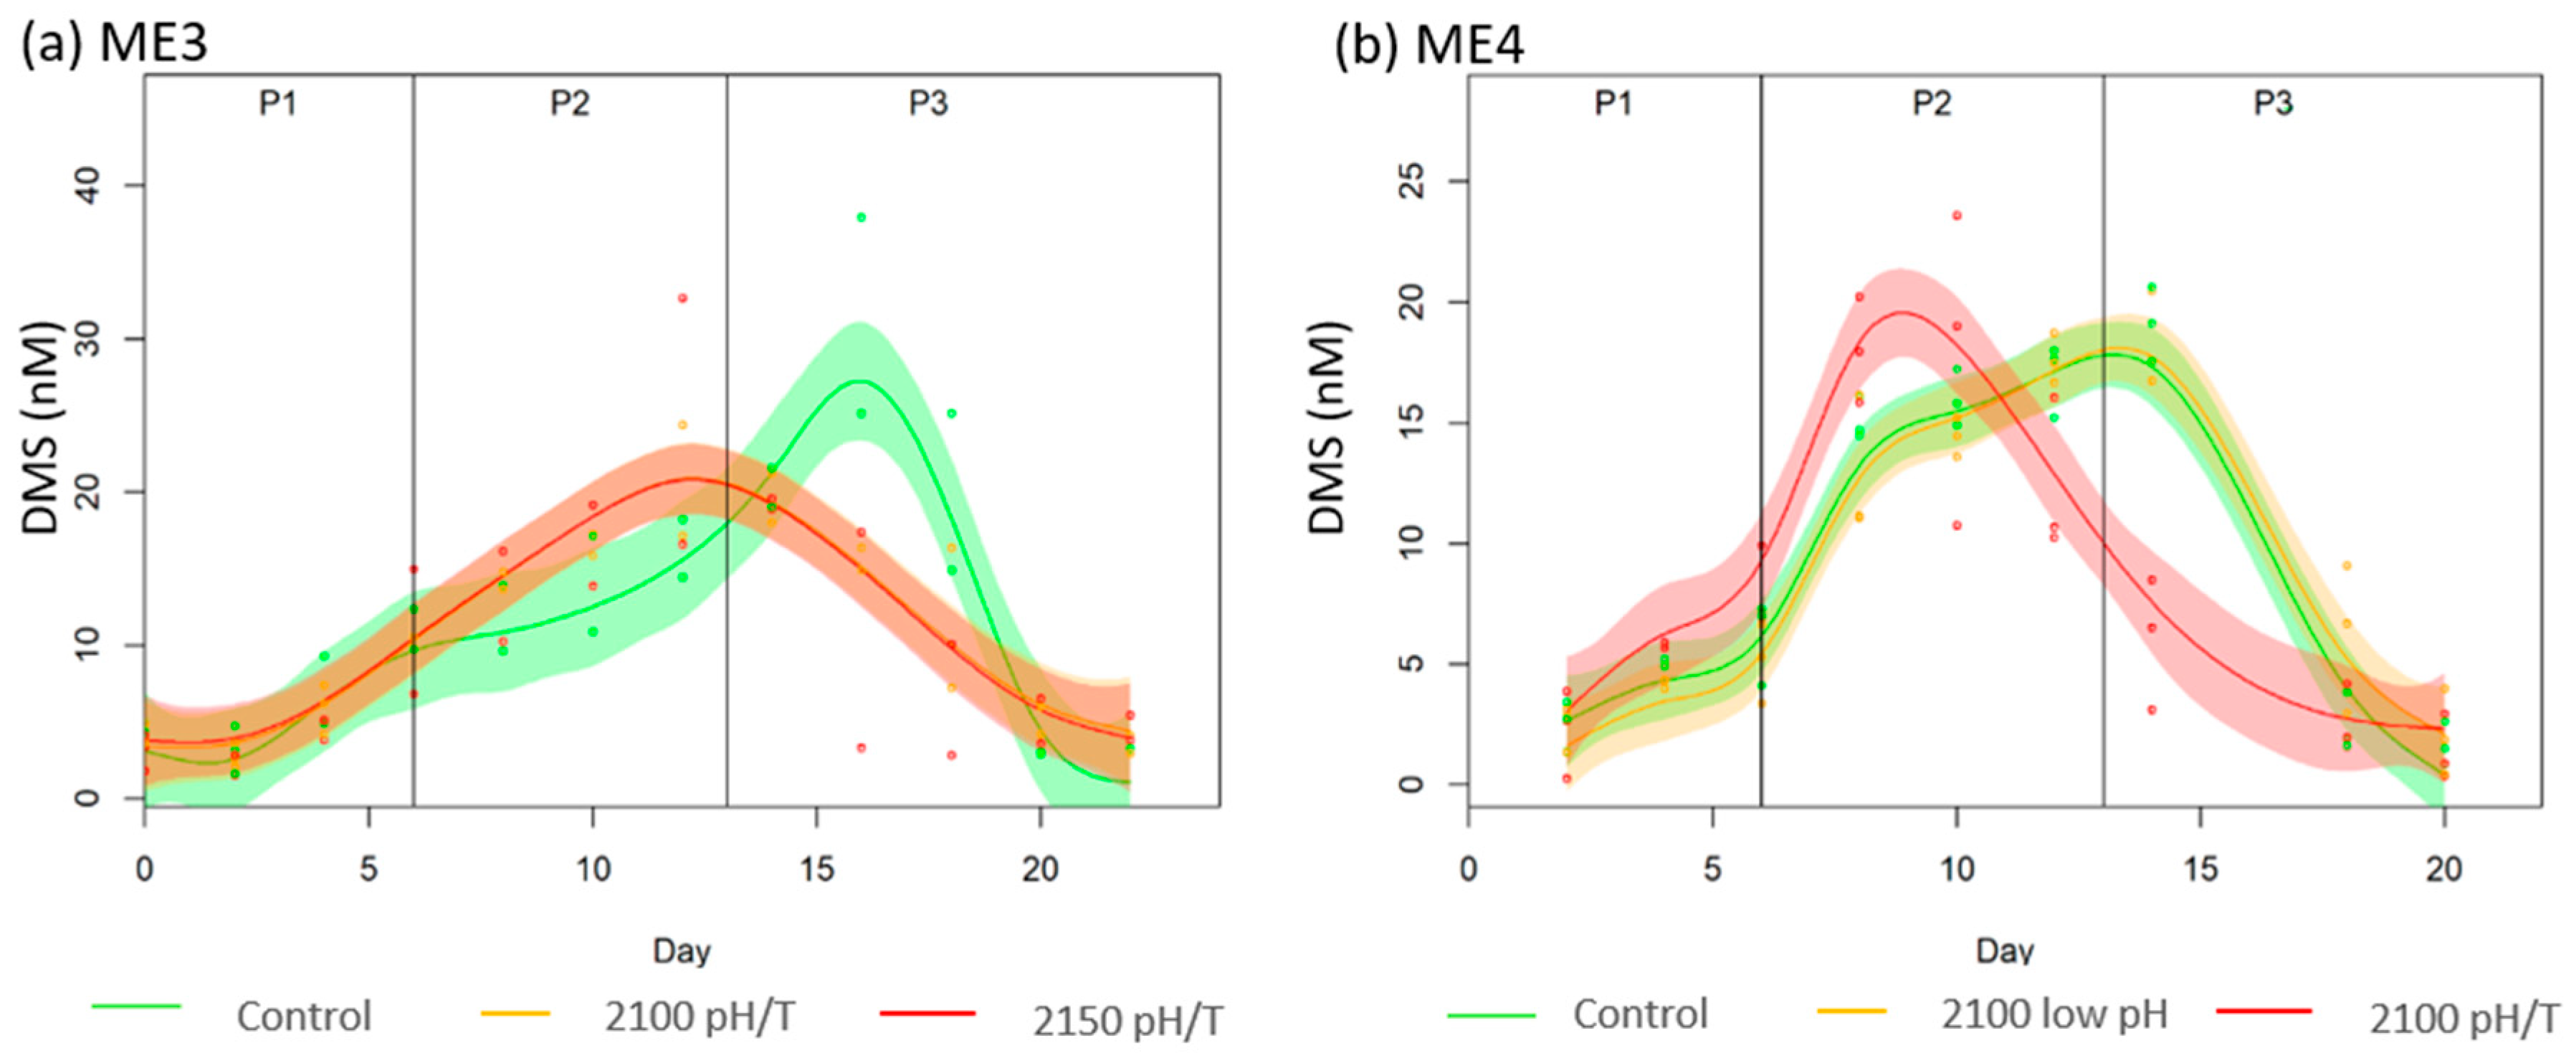
3.3. DMS
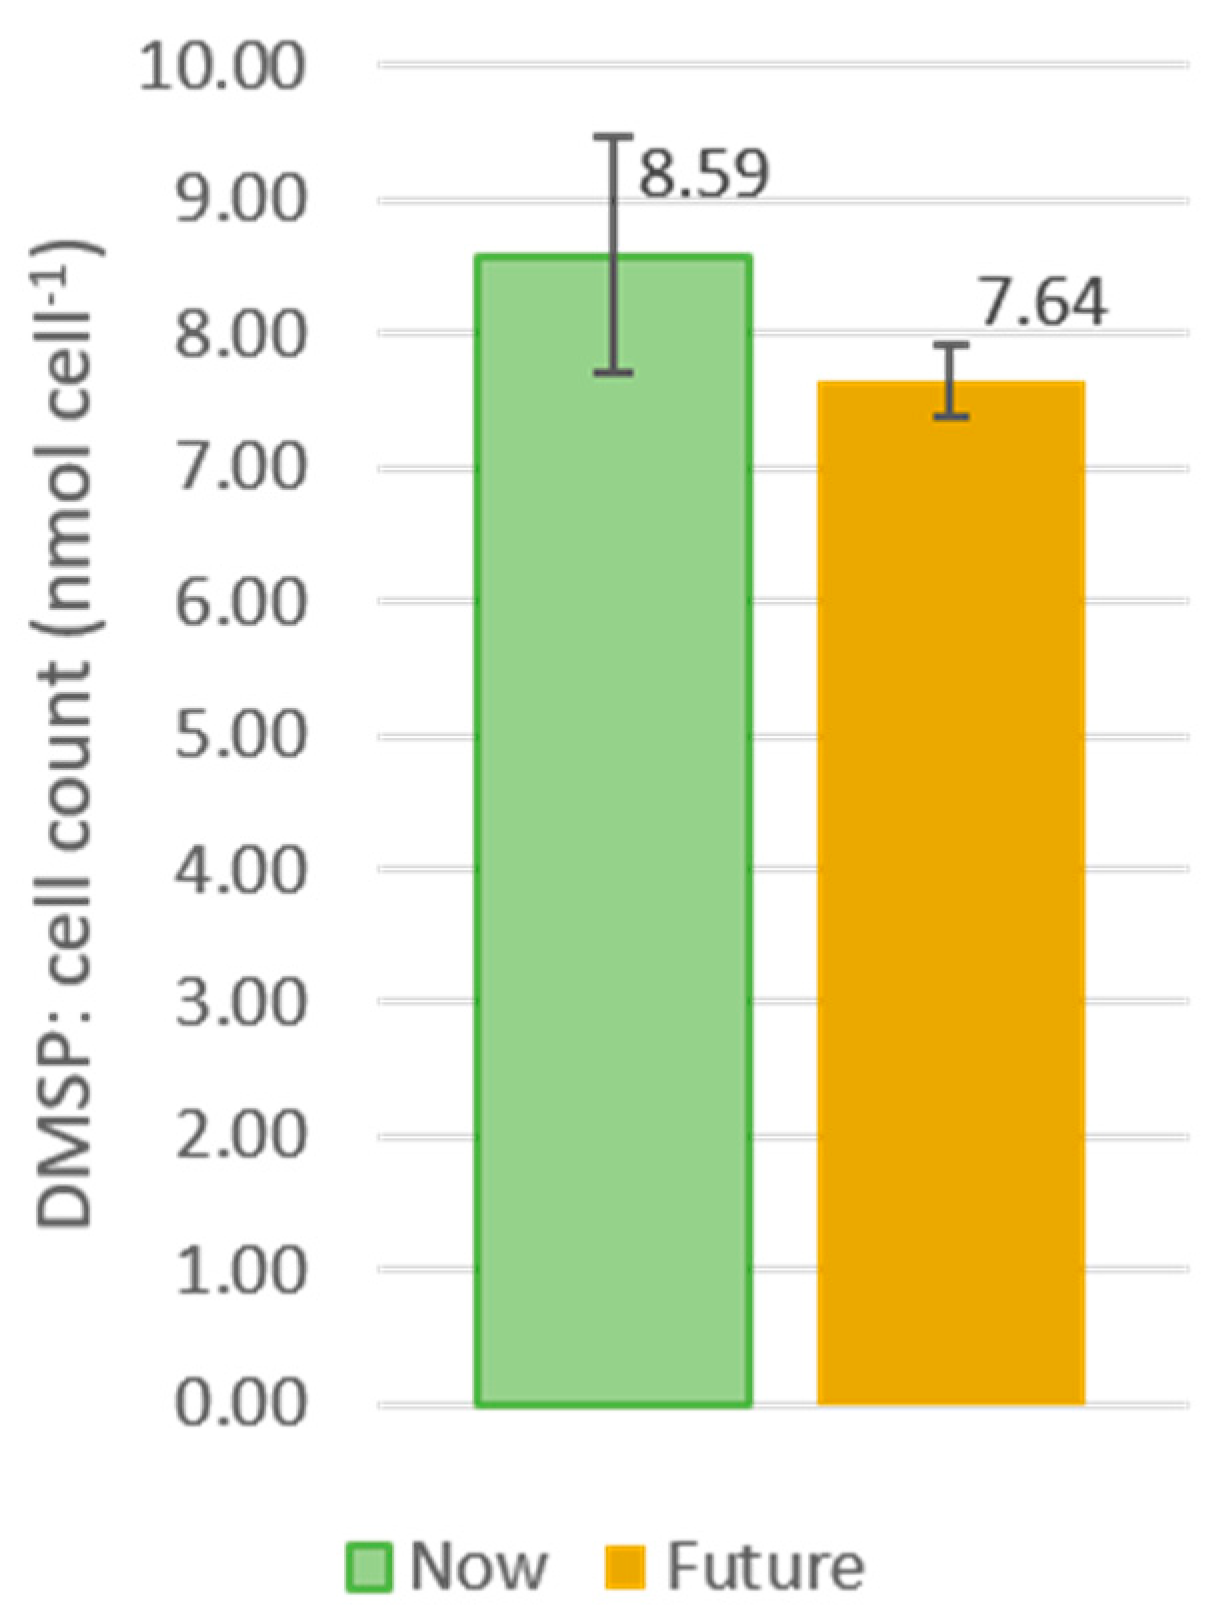
3.4. DMSP Production by Cylindrotheca Cultures
4. Discussion
5. Summary and Conclusions
- OA is not a critical determinant of future DMSP & DMS whereas warmer temperatures have a significant impact;
- Under future temperature and pH, with nutrient availability maintained, shifts in phytoplankton community structure that include a decrease in small flagellate biomass result in decreased DMSP concentrations;
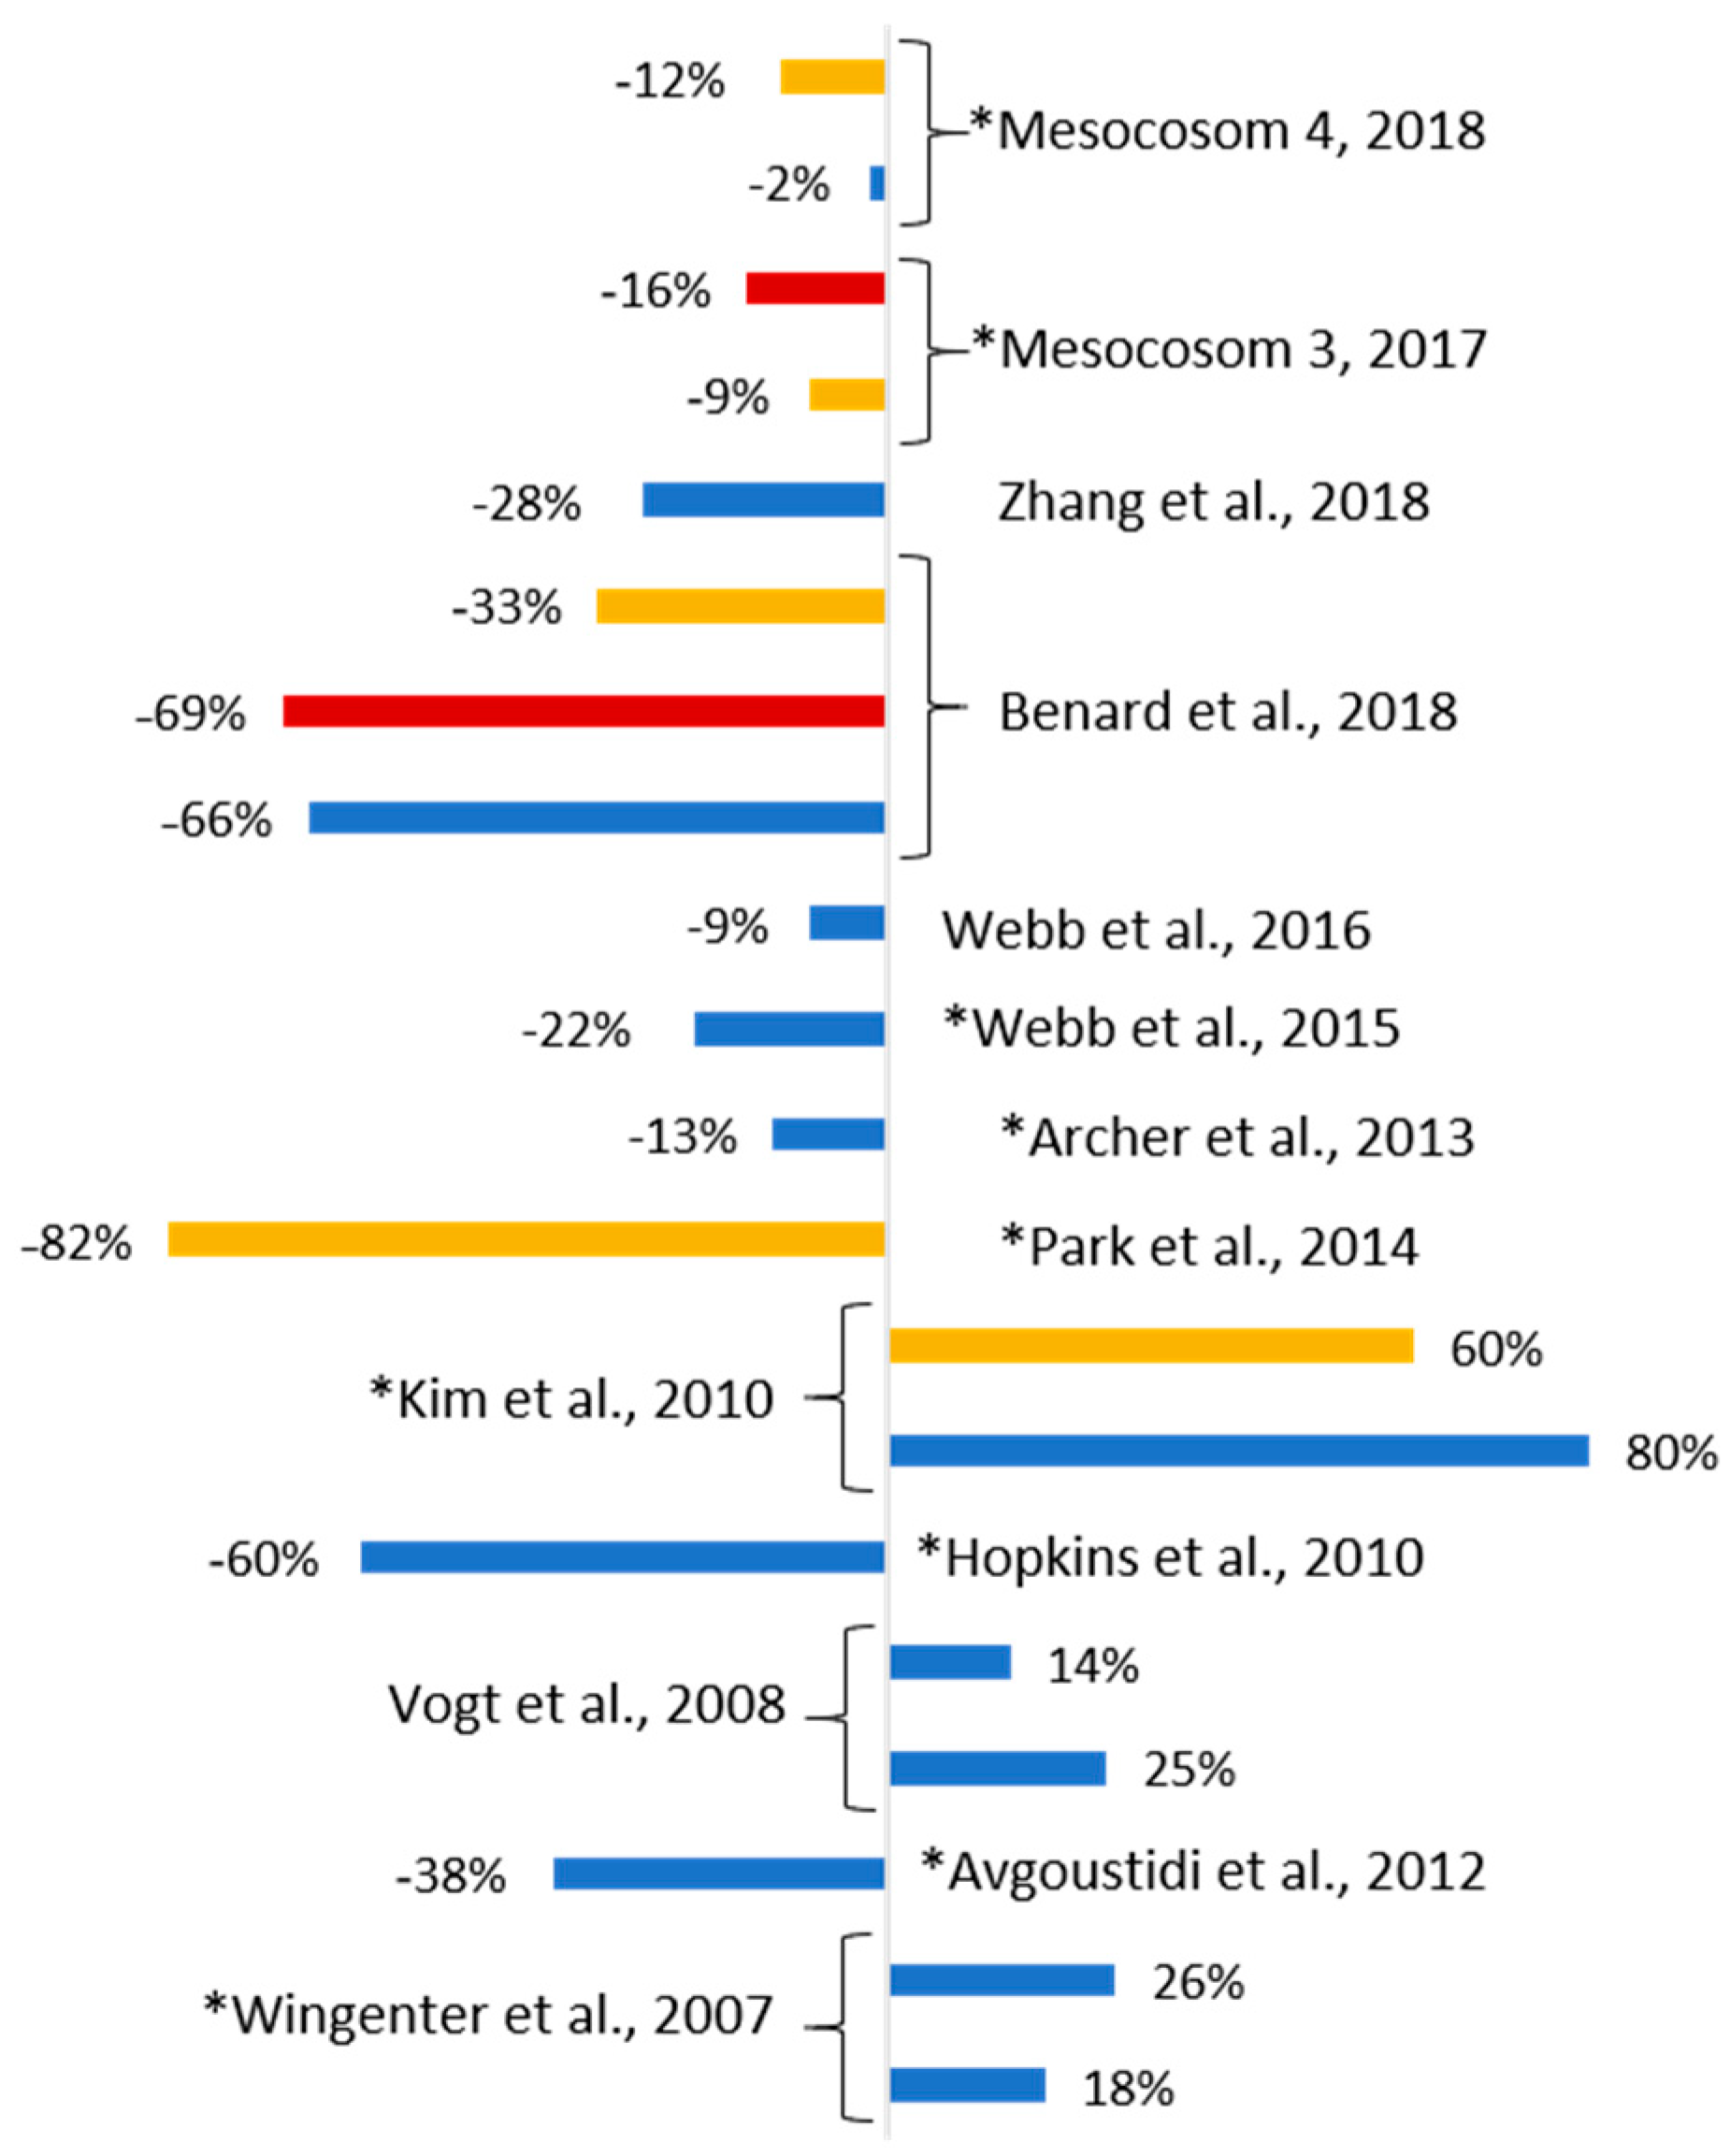
- although DMS concentration decreased under OA and warmer temperature this decrease was not as significant as reported by other studies;
- future changes in the temporal evolution of DMSP & DMS may have implications for sulfur and carbon cycling, and DMS emissions.
Author Contributions
Funding
Data Availability Statement
Acknowledgments
Conflicts of Interest
References
- Lovelock, J.E.; Maggs, R.J.; Rasmussen, R.A. Atmospheric Dimethyl Sulfide and the Natural Sulfur Cycle. Nature 1972, 237, 452–453. [Google Scholar] [CrossRef]
- Lana, A.; Simó, R.; Vallina, S.M.; Dachs, J. Re-examination of global emerging patterns of ocean DMS concentration. Biogeochemistry 2011, 110, 173–182. [Google Scholar] [CrossRef]
- Charlson, R.J.; Lovelock, J.E.; Andreae, M.O.; Warren, S.G. Oceanic phytoplankton, atmospheric sulphur, cloud albedo and climate. Nature 1987, 326, 655–661. [Google Scholar] [CrossRef]
- Quinn, P.K.; Bates, T.S. The case against climate regulation via oceanic phytoplankton sulphur emissions. Nature 2011, 480, 51–56. [Google Scholar] [CrossRef] [PubMed]
- Stefels, J.; Dijkhuizen, L. Characteristics of DMSP-lyase in Phaeocystis sp. (prymnesiophyceae). Mar. Ecol. Prog. Ser. 1996, 131, 307–313. [Google Scholar] [CrossRef]
- Kirst, G.O.; Thiel, C.; Wolff, H.; Nothnagel, J.; Wanzek, M.; Ulmke, R. Dimethylsulfoniopropionate (DMSP) in icealgae and its possible biological role. Mar. Chem. 1991, 35, 381–388. [Google Scholar] [CrossRef]
- Nishiguchi, M.K.; Somero, G.N. Temperature and concentration dependence of compatibility of the organic osmolyte B-dimethylsulfoniopropionate. Cryobiology 1992, 29, 118–124. [Google Scholar]
- Sunda, W.G.; Kieber, D.J.; Kiene, R.P.; Huntsman, S. An antioxidant function for DMSP and DMS in marine algae. Lett. Nat. 2002, 418, 317–320. [Google Scholar]
- Keller, M.D.; Bellows, W.K.; Guillard, R.L. Dimethyl Sulfide Production in Marine Phytoplankton. Biog. Sulfur Environ. 1989, 393, 167–182. [Google Scholar]
- Stefels, J.; Steinke, M.; Turner, S.; Malin, G.; Belviso, S. Environmental constraints on the production and removal of the climatically active gas dimethylsulphide (DMS) and implications for ecosystem modelling. Biogeochemistry 2007, 83, 245–275. [Google Scholar] [CrossRef] [Green Version]
- Yoch, D.C. Dimethylsulfoniopropionate: Its sources, role in the marine food web, and biological degradation to dimethylsulfide. Appl. Environ. Microbiol. 2002, 68, 5804–5815. [Google Scholar] [PubMed] [Green Version]
- Stefels, J. Physiological aspects of the production and conversion of DMSP in marine algae and higher plants. J. Sea Res. 2000, 43, 183–197. [Google Scholar] [CrossRef]
- Kiene, R.P.; Linn, L.J. The fate of dissolved dimethylsulfiniopropionate (DMSP) in seawater: Tracer studies using 35S-DMSP. Geochim. Cosmochim. Acta 2000, 64, 2797–2810. [Google Scholar] [CrossRef]
- Kiene, R.P.; Linn, L.J.; González, J.; Moran, M.A.; Bruton, J.A. Dimethylsulfoniopropionate and methanethiol are important precursors of methionine and protein-sulfur in marine bacterioplankton. Appl. Environ. Microbiol. 1999, 65, 4549–4558. [Google Scholar] [CrossRef] [PubMed] [Green Version]
- Simó, R.; Dachs, J. Global ocean emission of dimethylsulfide predicted from biogeophysical data. Glob. Biogeochem. Cycles 2002, 16, 26-1–26-10. [Google Scholar] [CrossRef]
- Poloczanska, E.; Mintenbeck, K.; Portner, H.O.; Roberts, D.; Levin, L.A. The IPCC Special Report on the Ocean and Cryosphere in a Changing Climate. In Proceedings of the 2018 Ocean Sciences Meeting, AGU, Portland, OR, USA, 11–16 February 2018. [Google Scholar]
- Vogt, M.; Steinke, M.; Turner, S.; Paulino, A.; Meyerhöfer, M.; Riebesell, U.; LeQuéré, C.; Liss, P. Dynamics of dimethylsulphoniopropionate and dimethylsulphide under different CO2 concentrations during a mesocosm experiment. Biogeosciences 2008, 5, 407–419. [Google Scholar] [CrossRef] [Green Version]
- Hopkins, F.E.; Turner, S.M.; Nightingale, P.D.; Steinke, M.; Bakker, D.; Liss, P.S. Ocean acidification and marine trace gas emissions. Proc. Natl. Acad. Sci. USA 2010, 107, 760–765. [Google Scholar]
- Park, K.T.; Lee, K.; Shin, K.; Yang, E.J.; Hyun, B.; Kim, J.M.; Noh, J.H.; Kim, M.; Kong, B.; Choi, D.H.; et al. Direct linkage between dimethyl sulfide production and microzooplankton grazing, resulting from prey composition change under high partial pressure of carbon dioxide conditions. Env. Sci. Technol. 2014, 48, 4750–4756. [Google Scholar] [CrossRef]
- Jian, S.; Zhang, J.; Zhang, H.-H.; Yang, G.-P. Effects of ocean acidification and short-term light/temperature stress on biogenic dimethylated sulfur compounds cycling in the Changjiang River Estuary. Environ. Chem. 2019, 16, 197–211. [Google Scholar]
- Hussherr, R.; Levasseur, M.; Lizotte, M.; Tremblay, J.-E.; Mol, J.; Thomas, H.; Gosselin, M.; Starr, M.; Miller, L.A.; Jarniková, T.; et al. Impact of ocean acidification on Arctic phytoplankton blooms and dimethyl sulfide concentration under simulated ice-free and under-ice conditions. Biogeosciences 2017, 14, 2407–2427. [Google Scholar] [CrossRef] [Green Version]
- Zhang, S.-H.; Yu, J.; Ding, Q.-Y.; Yang, G.-P.; Gao, K.-S.; Zhang, H.-H.; Pan, D.-W. Effect of elevated pCO2 on trace gas production during an ocean acidification mesocosm experiment. Biogeosciences 2018, 15, 6649–6658. [Google Scholar] [CrossRef] [Green Version]
- Bénard, R.; Levasseur, M.; Scarratt, M.; Michaud, S.; Starr, M.; Mucci, A.; Ferreyra, G.; Gosselin, M.; Tremblay, J.-E.; Lizotte, M.; et al. Contrasting effects of acidification and warming on dimethylsulfide concentrations during a temperate estuarine fall bloom mesocosm experiment. Biogeosciences 2019, 16, 1167–1185. [Google Scholar] [CrossRef] [Green Version]
- Mélançon, J.; Levasseur, M.; Lizotte, M.; Scarratt, M.; Tremblay, J.-E.; Tortell, P.; Yang, G.-P.; Shi, G.-Y.; Gao, H.; Semeniuk, D.; et al. Impact of ocean acidification on phytoplankton assemblage, growth, and DMS production following Fe-dust additions in the NE Pacific high-nutrient, low-chlorophyll waters. Biogeosciences 2016, 13, 1677–1692. [Google Scholar]
- Avgoustidi, V.; Nightingale, P.D.; Joint, I.; Steinke, M.; Turner, S.M.; Hopkins, F.E.; Liss, P.S. Decreased marine dimethyl sulfide production under elevated CO2 levels in mesocosm and in vitro studies. Environ. Chem. 2012, 9, 399–404. [Google Scholar] [CrossRef]
- Archer, S.D.; Suffrian, K.; Posman, K.M.; Bach, L.T.; Matrai, P.A.; Countway, P.D.; Ludwig, A.; Riebesell, U. Processes That Contribute to Decreased Dimethyl Sulfide Production in Response to Ocean Acidification in Subtropical Waters. Front. Mar. Sci. 2018, 5, 245. [Google Scholar] [CrossRef]
- Archer, S.D.; Kimmance, S.A.; Stephens, J.A.; Hopkins, F.E.; Bellerby, R.G.J.; Schulz, K.G.; Piontek, J.; Engel, A. Contrasting responses of DMS and DMSP to ocean acidification in Arctic waters. Biogeosciences 2013, 10, 1893–1908. [Google Scholar] [CrossRef] [Green Version]
- Webb, A.L.; Malin, G.; Hopkins, F.E.; Ho, K.L.; Riesebell, U.; Schulz, K.; Liss, P.S. Ocean acidification has different effects on the production of dimethylsulphide and dimethylsulphoniopropionate measured in cultures of Emiliania huxleyi RCC1229 and mesocosm study: A comparison of laboratory monocultures and community interactions. Environ. Chem. 2015, 13, 314–329. [Google Scholar] [CrossRef] [Green Version]
- Webb, A.L.; Leedham-Elvidge, E.; Hughes, C.; Hopkins, F.E.; Malin, G.; Bach, L.T.; Schulz, K.; Crawfurd, K.; Brussaard, C.P.D.; Stuhr, A.; et al. Effect of ocean acidification and elevated fCO2 on trace gas production by a Baltic Sea summer phytoplankton community. Biogeosciences 2016, 13, 4595–4613. [Google Scholar] [CrossRef] [Green Version]
- Wingenter, O.W.; Haase, K.B.; Zeigler, M.; Blake, D.R.; Rowland, F.S.; Sive, B.C.; Paulino, A.; Thyrhaug, R.; Larsen, A.; Schulz, K.; et al. Unexpected consequences of increasing CO2and ocean acidity on marine production of DMS and CH2ClI: Potential climate impacts. Geophys. Res. Lett. 2007, 34. [Google Scholar] [CrossRef] [Green Version]
- Kim, J.M.; Lee, K.; Yang, E.J.; Shin, K.; Noh, J.H.; Park, K.T.; Hyun, B.; Jeong, H.J.; Kim, J.H.; Kim, K.Y.; et al. Enhanced production of oceanic dimethylsulfide resulting from co2-induced grazing activity in a high CO2 world. Environ. Sci. Technol. 2010, 44, 8140–8143. [Google Scholar] [CrossRef]
- Hopkins, F.E.; Nightingale, P.D.; Stephens, J.A.; Moore, C.M.; Richier, S.; Cripps, G.L.; Archer, S.D. Dimethylsulfide (DMS) production in polar oceans may be resilient to ocean acidification. Biogeosciences 2018. [Google Scholar] [CrossRef]
- Law, C.S.; Rickard, G.J.; Mikaloff-fletcher, S.E.; Pinkerton, M.H.; Behrens, E.; Chiswell, S.M.; Currie, K. Climate change projections for the surface ocean around New Zealand. N. Z. J. Mar. Freshw. Res. 2018, 52, 309–335. [Google Scholar] [CrossRef]
- Available online: http://www.carim.nz/ (accessed on 28 November 2020).
- Safi, K.A.; Brian Griffiths, F.; Hall, J.A. Microzooplankton composition, biomass and grazing rates along the WOCE SR3 line between Tasmania and Antarctica. Deep Sea Res. Part I Oceanogr. Res. Pap. 2007, 54, 1025–1041. [Google Scholar] [CrossRef]
- Sun, J.; Liu, D. Geometric models for calculating cell biovolume and surface area for phytoplankton. J. Plankton Res. 2003, 25, 1331–1346. [Google Scholar] [CrossRef] [Green Version]
- Olenina, I.; Hajdu, S.; Edler, L.; Andersson, A.; Wasmund, N.; Busch, S.; Gobel, J.; Gromisz, S.; Huseby, S.; Huttunen, M.; et al. Biovolumes and size-classes of phytoplankton in the Baltic Sea. In Proceedings of the HELCOM Baltic Sea Environmental Proceedings, Helsinki, Finland, January 2006; p. 144. Available online: https://epic.awi.de/id/eprint/30141/1/bsep106.pdf (accessed on 28 January 2021).
- Montagnes, D.J.S.; Franklin, D.J. Effect of temperature on diatom volume, growth rate, and carbon and nitrogen content: Reconsidering some paradigms. Limnol. Oceanogr. 2001, 46, 2008–2018. [Google Scholar] [CrossRef] [Green Version]
- Eppley, R.W.; Reid, F.M.H.; Strickland, J.D.H. The Ecology of the Plankton Off La Jolla, California, in the Period April Through September, 1967. 1970: UC San Diego: Library–Scripps Digital Collection. Bull. Scripps Inst. Oceanogr. 1967, 17, 33–42. [Google Scholar]
- Menden-Deuer, S.; Lessard, E.J. Carbon to volume relationships for dinoflagellates, diatoms, and other protist plankton. Limnol. Oceanogr. 2000, 45, 569–579. [Google Scholar] [CrossRef] [Green Version]
- Walker, C.F.; Harvey, M.J.; Bury, S.J.; Chang, F.H. Biological and physical controls on dissolved dimethylsulfide over the north-eastern continental shelf of New Zealand. J. Sea Res. 2000, 43, 253–264. [Google Scholar] [CrossRef]
- Walker, C.F.; Harvey, M.J.; Smith, M.J.; Bell, T.G.; Saltzman, E.S.; Marriner, A.S.; McGregor, J.A.; Law, C.S. Assessing the potential for dimethylsulfide enrichment at the sea surface and its influence on air-sea flux. Ocean Sci. 2016, 12, 1033–1048. [Google Scholar] [CrossRef] [Green Version]
- Dickson, A.G.; Goyet, C. Handbook of Methods for the Analysis of the Various Parameters of the Carbon Dioxide System in Sea Water; Version 2; Oak Ridge National Lab: Oak Ridge, TN, USA, 1994. [Google Scholar]
- Hastie, T.; Tibshirani, R. Generalized Additive Models. Stat. Sci. 1986, 1, 297–318. [Google Scholar] [CrossRef]
- Pedersen, E.J.; Miller, D.L.; Simpson, G.L.; Ross, N. Hierarchical generalized additive models in ecology: An introduction with mgcv. PeerJ 2019, 7, e6876. [Google Scholar] [CrossRef] [PubMed] [Green Version]
- Keller, M.D.; Korjeff-Bellows, W. Physiological Aspects of the Production of Dimeyhtlsulfoniopropionate (DMSP) by Marine Phytoplankton, in Biological and Environmental Chemistry of DMSP and Related Sulfonium Compounds; Springer: Berlin, Germany, 1996; pp. 131–142. [Google Scholar]
- Li, P.-F.; Yang, G.-P.; Zhang, J.; Levasseur, M.; Liu, C.-Y.; Sun, J.; Yang, W. Impacts of elevated pCO2 on trace gas emissions in two microalgae: Phaeocystis globosa and Nitzschia closterium. Environ. Chem. 2017, 14, 425–441. [Google Scholar] [CrossRef]
- Chen, B.; Landry, M.R.; Huang, B.; Liu, H. Does warming enhance the effect of microzooplankton grazing on marine phytoplankton in the ocean? Limnol. Oceanogr. 2012, 57, 519–526. [Google Scholar] [CrossRef]
- De Souza, M.P.; Yoch, D.C. Purification and characterization of dimethylsulfoniopropionate lyase from an Alcaligenes-like dimethyl sulfide-producing marine isolate. Appl. Environ. Microbiol. 1995, 61, 21–26. [Google Scholar] [CrossRef] [Green Version]
- Li, C.-Y.; Wei, T.-D.; Zhang, S.-H.; Chen, X.-L.; Gao, X.; Wang, P.; Xie, B.-B.; Su, H.-N.; Qin, G.-L.; Zhang, X.-Y.; et al. Molecular insight into bacterial cleavage of oceanic dimethylsulfoniopropionate into dimethyl sulfide. Proc. Natl. Acad. Sci. USA 2014, 111, 1026–1031. [Google Scholar] [CrossRef] [Green Version]
- Vaqué, D.; Guagayol, O.; Peters, F.; Felipe, J.; Malits, A.; Pedrós-Alió, C. Differential response of grazing and bacterial heterotrophic production to experimental warming in Antarctic waters. Aquat. Microb. Ecol. 2009, 54, 101–112. [Google Scholar] [CrossRef]
- Vázquez-Domínguez, E.; Vaqué, D.; Gasol, J.M. Temperature effects on the heterotrophic bacteria, heterotrophic nanoflagellates, and microbial top predators of the NW Mediterranean. Aquat. Microb. Ecol. 2012, 67, 107–121. [Google Scholar]
- Tsai, A.Y.; Gong, G.C.; Shiau, W. Impact of short-term warming on seasonal variations in bacterial growth, grazing, and viral lysis in coastal waters of Taiwan. Aquat. Microb. Ecol. 2016, 76, 195–205. [Google Scholar] [CrossRef]
- Levasseur, M.; Scarratt, M.G.; Michaud, S.; Merzouk, A.; Wong, C.S.; Ary Chuk, M.; Richardson, W.; Rivkin, R.B.; Hale, M.; Wong, E.; et al. DMSP and DMS dynamics during a mesoscale iron fertilization experiment in the Northeast Pacific—Part I: Temporal and vertical distributions. Deep Sea Res. Part II Top. Stud. Oceanogr. 2006, 53, 2353–2369. [Google Scholar] [CrossRef]
- Merzouk, A.; Levasseur, A.; Scarratt, M.G.; Michaud, S.; Rivkin, R.B.; Hale, M.S.; Kiene, R.P.; Price, N.M.; Li, W.K.W. DMSP and DMS dynamics during a mesoscale iron fertilization experiment in the Northeast Pacific–Part II: Biological cycling. Deep Sea Res. Part II Top. Stud. Oceanogr. 2006, 53, 2370–2383. [Google Scholar] [CrossRef]
- Vance, J.; Currie, K.I.; Law, C.S.; Murdoch, J.; Zeldis, J. NZOA-ON: The New Zealand Ocean Acidification Observing Network. Mar. Freshw. Res. 2020, 71, 281–299. [Google Scholar] [CrossRef]
- Hofmann, G.E.; Smith, J.E.; Johnson, K.S.; Send, U.; Levin, L.A.; Micheli, F.; Paytan, A.; Price, N.N.; Peterson, B.; Takeshita, Y. High-frequency dynamics of ocean pH: A multi-ecosystem comparison. PLoS ONE 2011, 6, e28983. [Google Scholar] [CrossRef] [PubMed] [Green Version]
- Lee, P.A.; Rudisill, J.R.; Neeley, A.R.; Maucher, J.M.; Hutchins, D.A.; Feng, Y.; Hare, C.E.; Leblanc, K.; Rose, J.M.; Wihelm, S.W.; et al. Effects of increased pCO2 and temperature on the North Atlantic spring bloom. III. Dimethylsulfoniopropionate. Mar. Ecol. Prog. Ser. 2009, 388, 41–49. [Google Scholar] [CrossRef]
- Moore, J.K.; Lindsay, K.; Doney, S.C.; Long, M.C.; Misumi, K. Marine ecosystem dynamics and biogeochemical cycling in the community earth system model [CESM1(BGC)]: Comparison of the 1990s with the 2090s under the RCP4.5 and RCP8.5 scenarios. J. Clim. 2013, 26, 9291–9312. [Google Scholar] [CrossRef]
- Boyce, D.G.; Lewis, M.R.; Worm, B. Global phytoplankton decline over the past century. Nature 2010, 466, 591–596. [Google Scholar] [CrossRef] [PubMed]
- Schwinger, J.; Tjiputra, J.; Goris, N.; Six, K.D.; Kirkevåg, A.; Selang, O.; Heinze, C.; Ilyina, T. Amplification of global warming through pH dependence of DMS production simulated with a fully coupled Earth system model. Biogeosciences 2017, 14, 3633–3648. [Google Scholar] [CrossRef] [Green Version]
- Six, K.D.; Kloster, S.; Ilyina, T.; Archer, S.D.; Zhang, K.; Maier-Reimer, E. Global warming amplified by reduced sulphur fluxes as a result of ocean acidification. Nat. Clim. Chang. 2013, 3, 975–978. [Google Scholar] [CrossRef]
- Wang, S.; Maltrud, M.; Elliott, S.; Cameron-Smith, P.; Jonko, A. Influence of dimethyl sulfide on the carbon cycle and biological production. Biogeochemistry 2018, 138, 49–68. [Google Scholar]
- Deppeler, S.; Petrou, K.; Schulz, K.G.; Westwoog, K.; Pearce, I.; McKinlay, J.; Davidson, A. Ocean acidification of a coastal Antarctic marine microbial community reveals a critical threshold for CO2; tolerance in phytoplankton productivity. Biogeosciences 2018, 15, 209–231. [Google Scholar] [CrossRef] [Green Version]


| Exp | Start | Initial Temp (°C) | Initial pH | Initial Biomass (µg L−1 Chl-a) | Treatment Target | Treatment pH pH/T | Days | Nutrient Addition |
|---|---|---|---|---|---|---|---|---|
| ME1 | 8/04/16 18 days | 17.1 | 8.03 | 0.8 | 2100 pH 2100 pH/T | −0.33 −0.33/+3 °C | 18 | No |
| ME2 | 21/10/16 18 days | 13.4 | 8.03 | 0.35 | 2100 pH | −0.33 | 18 | N & P added every 3–4 days |
| ME3 | 1/11/17 22 days | 15.6 | 8.02 | 1.2 | 2100 pH/T 2150 pH/T | −0.33/+2.6 °C −0.5/+4.5 °C | 22 | Daily N, P & Si |
| ME4 | 24/09/18 20 days | 12.1 | 8.20 | 7.0 | 2100 pH 2100 pH/T | −0.4 −0.4/+3.5 °C | 20 | Daily N, P & Si |
| Full Experiment | Phase 3 | |
|---|---|---|
| ME1 | Control: 1.25 ± 0.46 | Control: 0.86 ± 0.23 |
| 2100 low pH: 1.34 ± 0.44 | 2100 low pH: 0.98 ± 0.17 | |
| 2100 pH/T: 1.34 ± 0.49 | 2100 pH/T: 1.04 ± 0.28 | |
| ME2 | Control: 1.52 ± 0.45 | Control: 1.19 ± 0.20 |
| 2100 low pH: 1.37 ± 0.47 | 2100 low pH: 1.02 ± 0.18 | |
| ME3 | Control: 2.07 ± 0.38 | Control: 2.07 ± 0.35 |
| 2100 pH/T: 2.22 ± 0.52 | 2100 pH/T: 2.47 ± 0.55 | |
| 2150 pH/T: 2.54 ± 0.70 | 2150 pH/T: 3.09 ± 0.70 | |
| ME4 | Control: 2.27 ± 0.80 | Control: 2.46 ± 0.42 |
| 2100 low pH: 2.24 ± 0.88 | 2100 low pH: 2.56 ± 0.32 | |
| 2100 pH/T: 2.59 ± 0.95 | 2100 pH/T: 3.31 ± 0.94 |
| Chl-a | Diatoms | Small Flagellates | DMSP | |
|---|---|---|---|---|
| ME1 | Control: 0.86 ± 0.23 | Control: 6.01 ± 3.52 | Control: 10.68 ± 4.28 | Control: 28.95 ± 6.75 |
| 2100 low pH: 0.98 ± 0.17 | 2100 low pH: 4.11 ± 1.48 | 2100 low pH: 10.87 ± 4.57 | 2100 low pH: 34.08 ± 9.17 | |
| 2100 pH/T: 1.04 ± 0.28 | 2100 pH/T: 7.13 ± 1.94 | 2100 pH/T: 12.16 ± 4.40 | 2100 pH/T: 33.02 ± 7.50 | |
| ME2 | Control: 1.19 ± 0.20 | Control: 92.57 ± 12.91 | Control: 15.22 ± 1.05 | Control: 52.75 ± 3.46 |
| 2100 low pH: 1.02 ± 0.18 | 2100 low pH: 102.85 ± 20.32 | 2100 low pH: 21.26 ± 4.43 | 2100 low pH: 57.70 ± 4.86 | |
| ME3 | Control: 2.07 ± 0.35 | Control: 12.41 ± 8.76 | Control: 83.71 ± 17.70 | Control: 188.39 ± 41.17 |
| 2100 pH/T: 2.47 ± 0.55 | 2100 pH/T: 63.96 ± 39.05 | 2100 pH/T: 73.17 ± 7.84 | 2100 pH/T: 151.54 ± 30.17 | |
| 2150 pH/T: 3.09 ± 0.70 | 2150 pH/T: 56.56 ± 29.18 | 2150 pH/T: 56.06 ± 23.13 | 2150 pH/T: 135.67 ± 7.87 | |
| ME4 | Control: 2.46 ± 0.42 | Control: 8.36 ± 3.04 | Control: 131.23 ± 29.66 | Control: 139.81 ± 26.79 |
| 2100 low pH: 2.56 ± 0.32 | 2100 low pH: 34.43 ± 37.17 | 2100 low pH: 141.21 ± 13.73 | 2100 low pH: 110.99 ± 17.37 | |
| 2100 pH/T: 3.31 ± 0.94 | 2100 pH/T: 24.72 ± 21.51 | 2100 pH/T: 99.62 ± 11.33 | 2100 pH/T: 88.57 ± 5.44 |
| Model (G) | Model (S) | Model (GS) | |
|---|---|---|---|
| ME1 | 603.4 | 618.1 | 605.4 |
| ME2 | 436.7 | 449.9 | 438.5 |
| ME3 | 725.4 | 702.5 | 706.9 |
| ME4 | 833.4 | 830.3 | 825.6 |
| Model (G) | Model (S) | Model (GS) | |
|---|---|---|---|
| ME3 | 480.5 | 456.9 | 453.8 |
| ME4 | 427.2 | 378.3 | 372.3 |
Publisher’s Note: MDPI stays neutral with regard to jurisdictional claims in published maps and institutional affiliations. |
© 2021 by the authors. Licensee MDPI, Basel, Switzerland. This article is an open access article distributed under the terms and conditions of the Creative Commons Attribution (CC BY) license (http://creativecommons.org/licenses/by/4.0/).
Share and Cite
Saint-Macary, A.D.; Barr, N.; Armstrong, E.; Safi, K.; Marriner, A.; Gall, M.; McComb, K.; Dillingham, P.W.; Law, C.S. The Influence of Ocean Acidification and Warming on DMSP & DMS in New Zealand Coastal Water. Atmosphere 2021, 12, 181. https://0-doi-org.brum.beds.ac.uk/10.3390/atmos12020181
Saint-Macary AD, Barr N, Armstrong E, Safi K, Marriner A, Gall M, McComb K, Dillingham PW, Law CS. The Influence of Ocean Acidification and Warming on DMSP & DMS in New Zealand Coastal Water. Atmosphere. 2021; 12(2):181. https://0-doi-org.brum.beds.ac.uk/10.3390/atmos12020181
Chicago/Turabian StyleSaint-Macary, Alexia D., Neill Barr, Evelyn Armstrong, Karl Safi, Andrew Marriner, Mark Gall, Kiri McComb, Peter W. Dillingham, and Cliff S. Law. 2021. "The Influence of Ocean Acidification and Warming on DMSP & DMS in New Zealand Coastal Water" Atmosphere 12, no. 2: 181. https://0-doi-org.brum.beds.ac.uk/10.3390/atmos12020181