Article

On the Use of the eStation Developed in the GMES & Africa EU Project: Results from the User Survey

by
Christophe Lavaysse
1,2,*,
Philippe Roudier
3,
Vijay Venkatachalam
1,
Jurriaan Van’t Klooster
1 and
Marco Clerici
1
1
European Commission, Joint Research Centre, 21027 Ispra, Italy
2
Institut des Geosciences de l’Environnement, UGA, CNRS, INPG, IRD, 38058 Grenoble, France
3
Agence Française de Développement, 75012 Paris, France
*
Author to whom correspondence should be addressed.
Submission received: 12 January 2021 / Revised: 1 February 2021 / Accepted: 10 February 2021 / Published: 15 February 2021

Abstract

:
In 2007, at the 2nd Africa-EU Summit, the development and implementation of earth observation based services to support sustainable development in Africa was agreed. A joint Africa-EU strategy created a framework for cooperation to this end called GMES & Africa. This cooperation aims to produce products and services relevant to the needs of Africans and implemented by African institutions. It is based in particular on the European Copernicus program. The themes covered by the cooperation include natural resource management, marine and coastal areas, water resource management, climate variability and change, disaster risk reduction and food security. Building on its early involvement in the previous projects, the Joint Research Centre has developed an operational and distributable open-source data processing tool, called eStation. One year before the end of the first phase of the project, a full survey of eStation users was conducted. The objective of the survey was to get a full overview of the use, strength, weakness and way to improve the eStation in an operational context. This study presents the main results of the survey. It identifies who are the users, what their operational tasks are and how they communicate the information to decision makers. In addition, the use of the station is described, its strengths and weaknesses are identified as well as the technical and thematic difficulties encountered. The survey underlines the importance of maintaining a constant dialogue between users and developers in order to offer technical and thematic supports to improve the efficiency of the use of the tools. This can be done by organising training and workshops and is essential for the proper use of the tools and products.

1. Introduction

1.1. On the Importance of Climate Services Program in Africa

The increase in anthropogenic greenhouse gas emissions is leading to significant changes in the climate at global and local scale. The recent report of the Intergovernmental Panel on Climate Change (IPCC, 2019) points out that even if global warming is limited to the Paris agreement targets, important effects will affect natural and human systems, with significant risks of impacts on ecosystems, health, agriculture and food security. The increase of greenhouse gas emissions are likely to reduce average crop yields and increase year-to-year variability [1,2,3,4]. This may have dramatic impacts in most of the African continent, where the populations are vulnerable and, in general, with low adaptation capacity. Recent research suggests that yields have already been affected. Ray et al. [5] analyse crop yield evolution for ten crop types—barley, cassava, maize, oil palm, rapeseed, rice, sorghum, soybean, sugar cane and wheat and highlight significant negative trends observed in several regions in the world such as over Southern Africa. Despite a large number of scientific publications and of datasets (including satellite and ground observations and atmospheric models) publicly available, many decision-makers and institutions are hampered by a lack of access to context-specific climate information. This is due to several obstacles and challenges that causes limitations to access to this information and its use in decision-making processes. These obstacles include:
  • the high complexity of the available datasets,
  • the basic computer skills of the users,
  • some technical aspects of the results (understanding of the uncertainties, probabilistic forecasts),
  • lack of relevant and usable information,
  • the adequacy of climate information (e.g., inappropriate spatial and temporal scales of the information provided, [6])
  • lack of knowledge of the end-users that implies no-common understanding between researchers and end-users [7,8]
Climate services have been developed to circumvent these difficulties between scientists and end-users. These services include simultaneously monitoring aspects and long-term (several years) climate projections as well as short-term (a few days) weather information [9]. Most activities and discussions on climate services are dominated by the provision and dissemination of climate observations and models, whereas the understanding and adaptation of the products to the user needs should be the priority [10]. Indeed, this should be the first step for effective climate services. Then the needs of the potential users must be translated into useful information. Because of political and economic reasons, there is a large diversity of users within sectors and among researchers and practitioners in some regions [11], such as West Africa. Moreover, the political and economic constraints may prevent user needs from being translated into action [12].
Over most of the African regions, climate services are in the early stages of development, with focus on ensuring appropriate data management and fully operational provision of monitoring and forecasting data [13,14]. Over this region, persistent lags are still present that require specific development for climate services to fulfill the needs of end users. Firstly, there is a potential gap between the spatial scales of most of the products and the needs, for both observational and forecast datasets. In particular, there are often needs to downscale the forecast on agriculture yields to fit with the scale of the local farmers. There are also some challenges to provide robust long-term climatological datasets, or climate data records. The gaps in historical records must be filled by merging different sources of datasets, which is already done in some cases for precipitation products. In addition, because of the economical restriction, the access to these datasets is also a challenge and freely available products is important.The building capacity is also an important element to strengthen, and it is of crucial importance to increase the sharing of knowledge of international organisations to local users by organizing training, and cross fertilizations, i.e., sharing the methodologies and best practices amongst the users. Recently, the study of [15] confirm the great need for supports from providers to users in order to solve the many issues related to current climate services particularly in West Africa. Vaughan et al. [16] identify priorities, specifically those activities that can strengthen evidence on access, use and impacts of climate services. Surveys are more and more used in order to better understand how to assess and improve Earth Observation (EO) products and services in Africa [17].
The European Union has launched, in 2019, the ‘intra-ACP Climate Services and related applications’ support program (ClimSA—see www.climsa.org, accessed on 11 February 2021), funded under the 11th European Development Fund. The aim is to support the climate service value chain with scientific and technical assistance, infrastructure and capacity building. The overall goal is fostering sustainable development, through the prevention of desertification, preservation of biodiversity, sustainable use of natural resources in ACP countries by improving the decision making process with informed adaptation options to climate variability and change. The intra-ACP CS initiative builds on the achievements of a series of EU funded programs in the field of the application of EO to weather and environmental monitoring, being the PUMA (Preparation for the Use of Meteosat in Africa), AMESD (African Monitoring of Environment for Sustainable Development), MESA (Monitoring Environment and Security in Africa) and the ongoing GMES (Global Monitoring for Environment and Security) & Africa, the most relevant ones. AMESD and MESA are considered the forerunners to the ongoing Pan-African GMES & Africa [18], by building and strengthening capacities in Africa to receive, process, analyze and exploit Earth Observation (EO) data for environmental management.

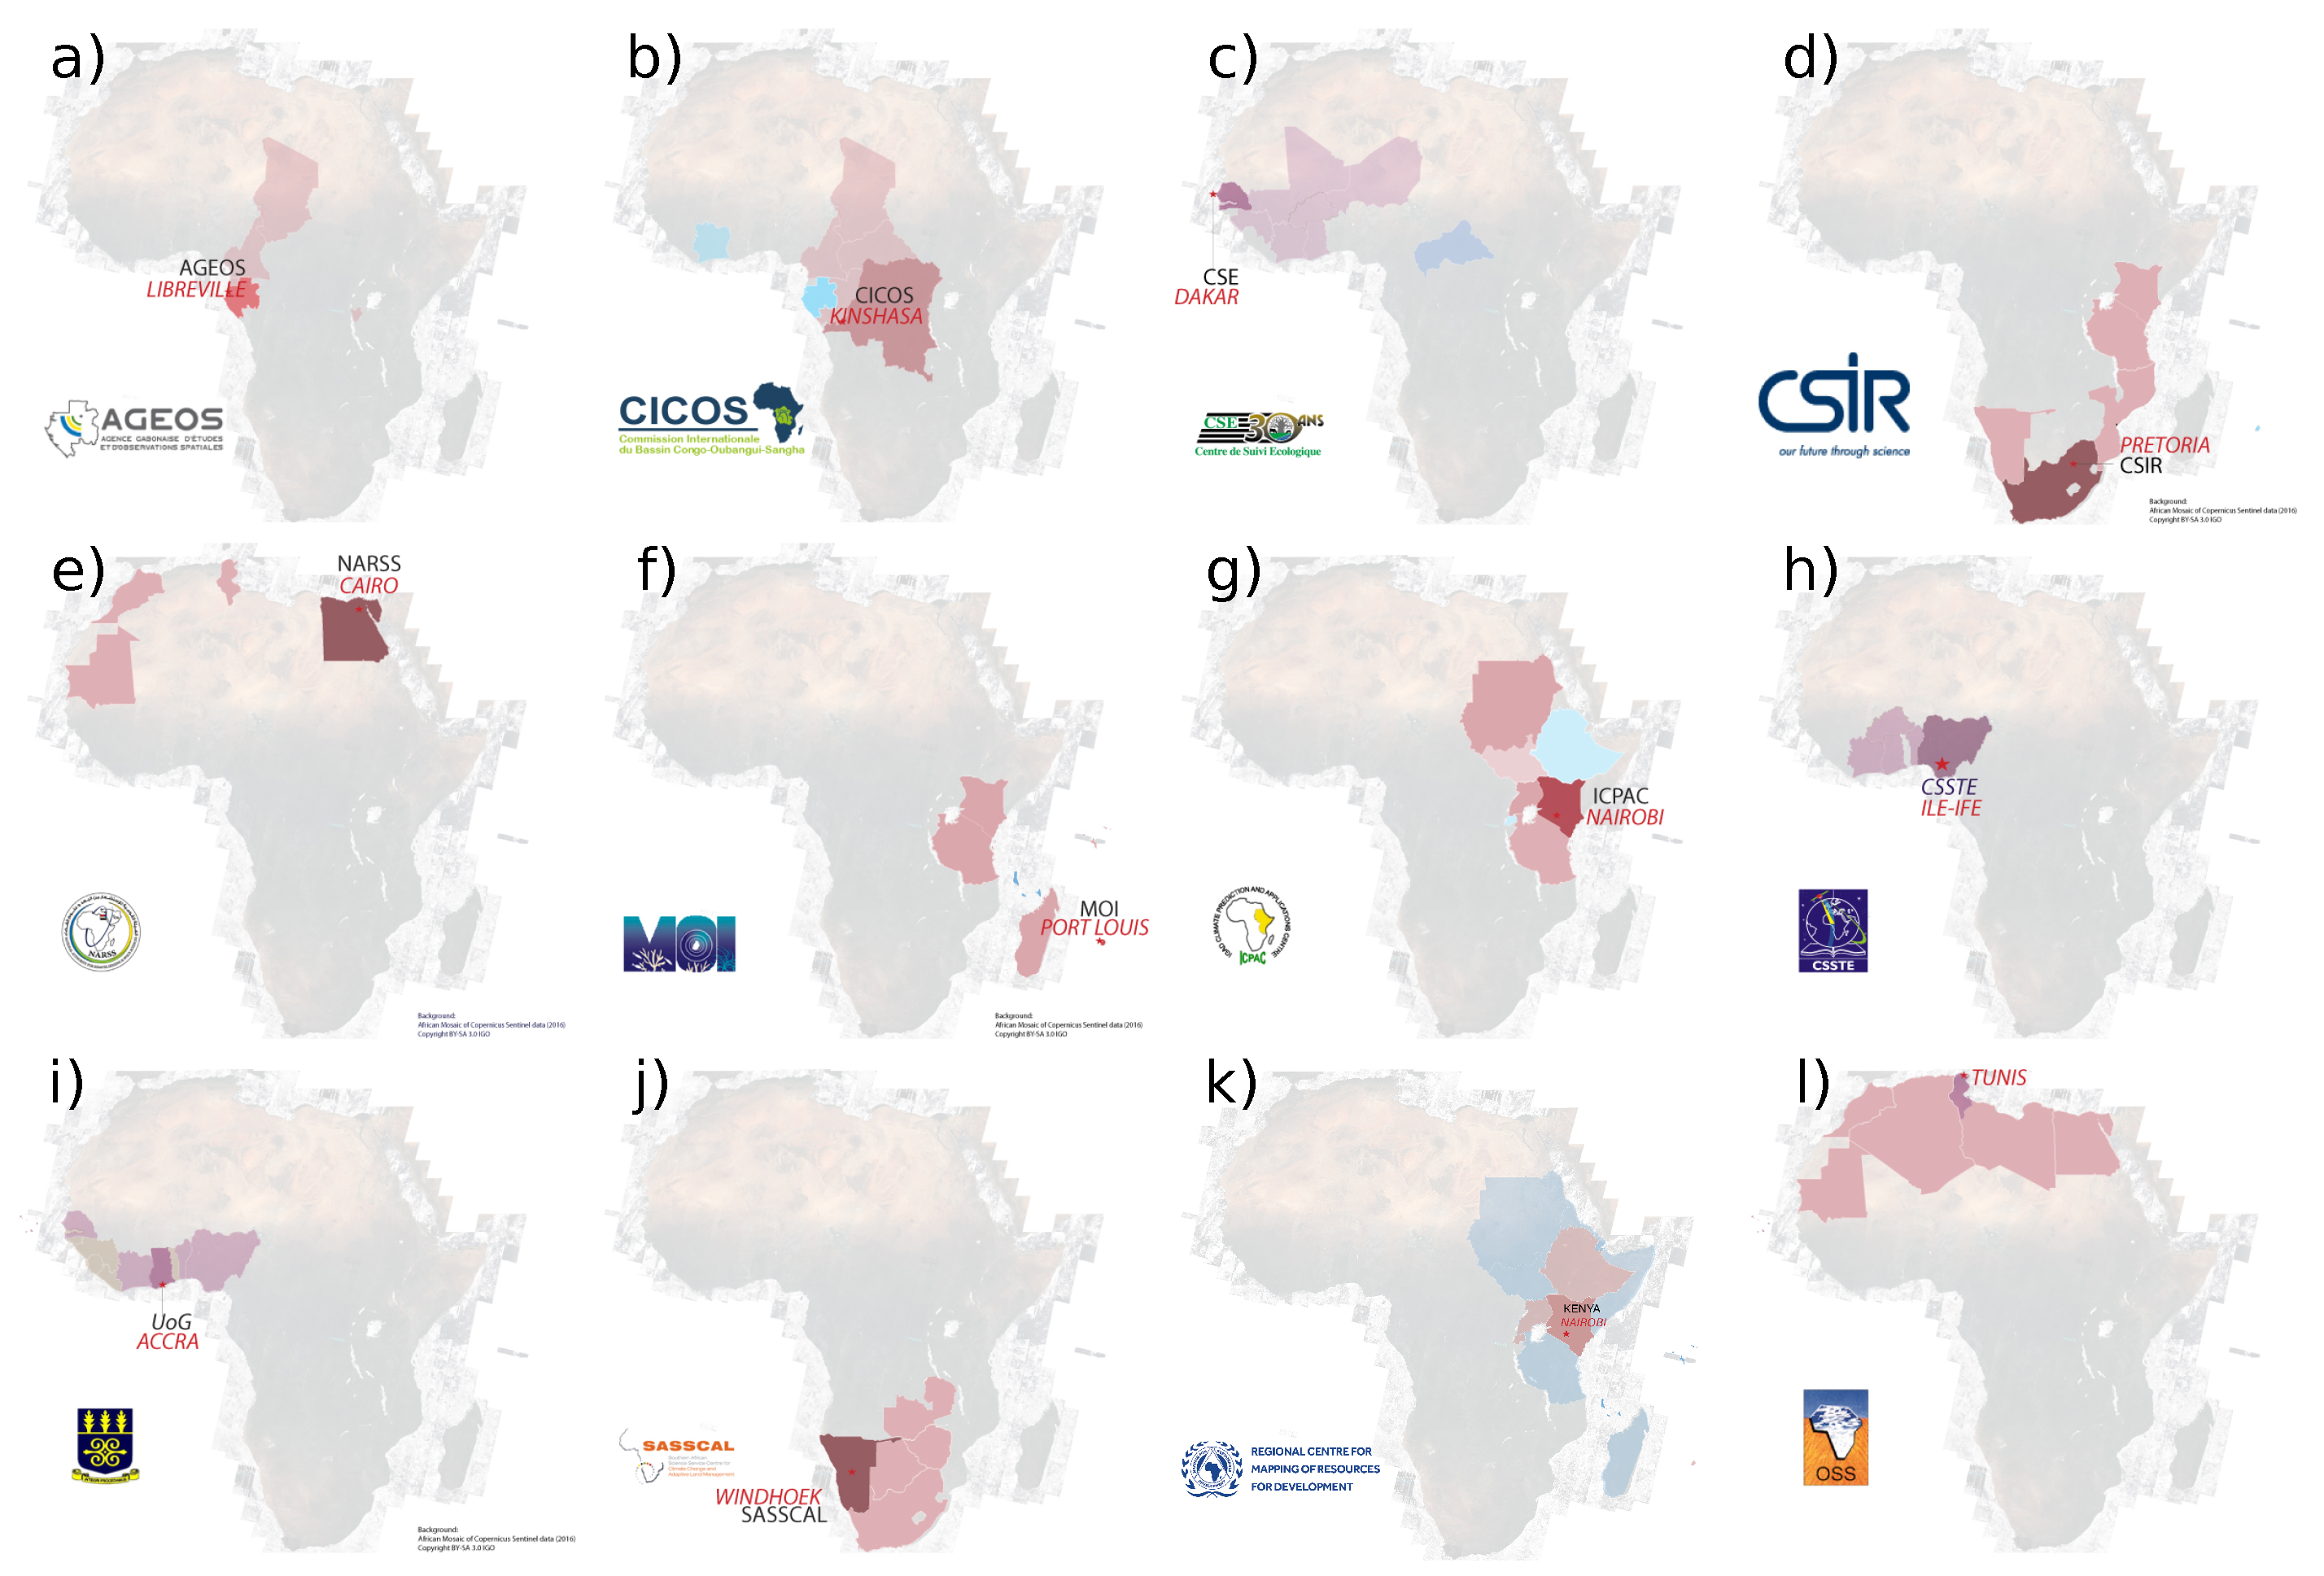
1.2. GMES & Africa and the eStation

The GMES & Africa process was launched during the 2nd EU-Africa Summit (Lisbon, December 2007), as a long-term and strategic cooperation to address the growing needs of African countries to access EO data for implementation of sustainable development policies at continental, regional and national level. This process confirmed the commitment to avail the Copernicus European infrastructure to African countries, and will enable the two continents to jointly face and address global challenges and attain overarching development goals, including the AU Agenda 2063 and the UN Sustainable Development Goals. The GMES & Africa initiative focuses on three specific topics; the Long-Term Management of Natural Resources, Marine and Coastal Areas and Water Resources Management.Its main objective is to maintain and improve a sustainable access to EO data, including from Copernicus Services, as a basis of operational monitoring services in the above mentioned thematic areas. These services will enable providing decision-makers with information and tools needed for the implementation of sustainable environmental policies at the continental, regional and national level. A key component of the program is the development in Africa of local institutional and human capacities for the access and exploitation of EO-based information on an operational basis.The GMES & Africa is implemented by 12 consortia, in all African regions, including 112 Institutions (regional mandated organization, national ministries, research centres and Universities). the map of these consortia and the region covered by each of them is illustrated Figure 1.
The eStation is an EO processing application. It stands for the application for data acquisition, processing a visualization developed by JRC (i.e., the software component) that can be run using a “MESA station” that is the physical infrastructure composed by 3 PCS, two of which hosting the eStation. The eStation automatically retrieves data from different sources; e.g., the EUMETSAT Broadcasting System, the Copernicus services and other data providers. Then the software derives added-value indicators such as climatological anomalies, standardized indices or filtered datasets that are currently used and requested by the partners. The software allows the analysis and generation of information to be included in bulletins and communications for the final users, both decision makers in mandated institutions and the local society [19]. The main goal of the application is to overcome the technical complexity in the EO processing, and streamline their exploitation by the thematic experts. It is a customizable system, tailored to the needs and requirements of the end-users, as identified in the previous programs and through a continuous interaction with the beneficiaries. This climate service provides relevant information for the different identified sectors with tailored and other requested variables from the beneficiaries. When available and necessary, several datasets are used to provide a set of the same variable (SST or rainfall for example). This allows to assess the potential uncertainties in between the datasets and so of the observed variable. The eStation is accessible thanks to different ways:
  • the linux-based MESA stations, delivered to more than 120 Institutions in the framework of MESA program (Figure 2)
  • be installed on a single MS-Windows computer
  • accessed a web-client on Joint Research Centre infrastructure
During all the GMES & Africa project, the collaborations were close with the beneficiaries, which are defined as the institutions that received the eStation in their premises and identified in the formulation of the MESA project, and with the final users, corresponding to the institutions/persons receiving the final tailored products. Nevertheless, there were still open questions regarding the evaluation of several aspects of the use of eStation. For example, despite the constant collaboration between eStation developers and users to resolve technical issues, there was no quantitative assessment of eStation access for our users. In addition, the usability of the software and the quality and adequacy of the data proposed were not assessed at the project level. Before the end of the GMES & Africa phase 1, a large online survey has been sent to all. Such surveys are now common tools to interact with users of a specific device or service, to know their needs and to collect their feedbacks [20]. This study first proposes a framework of dialogue with the users in Africa. It also exposes the lessons learned from the survey and highlights the current use of the eStation, the strength and weakness of the platform and how to improve it in the future. It is presented as follows; after this introduction, the methodology of the survey (Section 2) and the GMES & Africa project (Section 3) are presented. In Section 4, the main results of the survey are exposed. Then the future developments are discussed (Section 5) and the main conclusions are drawn (Section 5).

2. Methodology of the Survey

A large online survey was launched among all partners to better identify the use of the service and the concrete benefits in an operational context and the way forward. To do so, it was sent by email to all known partners that used the eStation in the framework of the MESA project and to GMES & Africa beneficiary Institutions. The beneficiaries were identified in the formulation of the MESA project with the African regional and continental authorities (REA department of the African Union Commision, the Regional Economic Regions (RECs) and some Regional Implementation Centres). The beneficiaries list included ministries of agriculture, fisheries, water and irrigation, regional and national institutions with a mandate for natural resources protection and management and universities. Because we would like a maximum number of feedbacks from current users, no minimum limitation of the usage of the eStation was introduced. Nevertheless, because the users are using a station installed by our services or with our collaboration, we know they have access to the eStation more than a year minimum. The choice of using Google form for developing the survey was motivated by the free access of it, the easy building or sharing and the functionality. Different options are available to define the type of questions (multiple choices, one answer, open answer, short text), the answers mandatory or not. Nevertheless there exists other platforms that fit these requests and can be used. The online survey remained open from November 2019 until March 2020. The format of a questionnaire instead of interviews was chosen for practical reasons, mostly saving time and facilitating respondents’ availability, and to facilitate the interpretation of the results by always following identical and strict rules. The questionnaire was written in English and French as these are the main languages used for communications within the project and in the continent. The survey is divided in 7 categories to cover different topics: (i) general information,(ii) access to the eStation and the MESA station, (iii) operational use, (iv) ergonomics, evaluation, (v) data, (vi) trainings and (vii) future of the eStation. Overall, 42 questions were asked, 5 of them being open-ended questions in order to collect general feedback and points that were not addressed. The remaining 37 questions were therefore close-ended (13 of them gave the possibility to specify an additional field if needed). Some additional rules were set up to avoid misinterpretation of the results. Hence, most of the answers required an answer to go through and it was mandatory to finish the survey before to send it. This avoids partially completed surveys in the analysis. A particular attention has been made to provide clear and accurate questions and answers. Nevertheless, to allow users to indicate a possible misunderstanding, almost all the questions proposed an extra answer accepting a free comment. That option was not used by the users in that survey. These relatively strict rules are motivated to merge all the answers and to get an quantitative overview of the assessment of the eStation. The qualitative aspect is provided by the open question but remains a minor topic for this study. The survey was sent to around 150 contacts, that are contact points in local institutions where a mesa station was installed, responsible for institutional partners of the GMES & Africa project and some registered users. This survey is the first quantitative assessment of the use and usage of the eStation by the users. The architecture of the survey was based on Sultan et al. [15] and adapted for the project. The structure and the questions could be reused in the future to assess the evolution of the user needs and usages.

3. Results

Out of the 150 people contacted, 44 responses were received. The response rate was around 1/3, due to communication problems, invalid emails, people not working anymore on the project, or simply no response despite several reminders. Out of the 12 consortia involved in the GMES & Africa project, 9 provided at least one response (69%). The spatial distribution of the responses (according to the consortia) shows a good coverage of Central and West Africa. On the other hand, South Africa is under-sampled (Figure 3). Note that because some of the institutions cover more than their countries, the distribution is done per consortia and not per country. In the following sections, we give an overview of the most relevant results. Note that the full list of questions are provided in Supplementary Materials.

3.1. Assessment of the Access, Use and Ergonomics of the eStation

3.1.1. Global Evaluation on the Access of the eStation

First, the evaluation of the use of the eStation and its accessibility has been assessed. The availability of the MESA station and technical issues that users may have faced is then crucial. Most of the respondents (91%) have an access to at least one MESA station: this can be their own one (81%) or via a consortium partner (question 5 provided in the Supplementary Materials). The MESA station is the main way of accessing to the eStation for 95% of the respondents; only 10% of them use the online version (question 6). Other ways of accessing the eStation are used mostly when MESA station is down, which is quite often for 42% of respondents (more than 50% of the time in 2019): having several possibilities to access the eStation is therefore very valuable here. The answers show that, despite problems with the MESA station, the respondents use the eStation regularly (61% of them reporting a weekly or daily access) demonstrating the usefulness of the service for the users. The main technical issues (question 7 and 8) are due to electrical resources and computer failures (53%), followed by other technical problems, related to the software (40%) or related to the antenna and reception (38%). Data and product issues are less common, with the absence of the desired product representing 35% of them and lack of understanding of the products 12%. Users were also able to report other issues (about ten) such as the lack of human resources, UPS failure, missing datasets, and delay in data availability.

3.1.2. Usability

The results on the usability (i.e., efficiency in adopting appropriate solutions for the use of a product and assessing the adequacy to the user’s capacities) of the eStation (questions 19 to 31) are based on the feedbacks from our partners and also from their users (82% of our partners have regular or occasional feedback from their users). There is an overall good evaluation of the usability of the software. Indeed, 50% have a good or very good opinion, 36% are neutral and 14% have an unfavourable or very unfavourable opinion. Only 28% of them reported errors or problems in the provided products. Feedback on these points are: malfunctioning, recommendation of other products in the eStation, lack of precision on local data, too many missing data, need for additional features (e.g., adding of SMS alert functionality), concerns about the use of some tools (time series, geometry of shape files, maps with higher precision). The requested points to be solved, are most of the times related to misinformation and could be easily resolved by trainings. Partners also reported specific errors that passed through our checks. On the other hand, there were questions about the use of the graphical options of the eStation. Some options that may have advantages, such as workspaces with several predefined graphics, are only used by a portion of the partners (43%). The partners showed interest in working at scales relevant to decision-makers, such as data extractions by predefined polygons following administrative contours (61%). That could highlight where we could improve or abandon functions.

3.1.3. Global Strength and Weakness of the eStation

The answers related to the strength and weakness of the eStation (question 23 and 24) provide an overall evaluation of the software and allow to prioritize the issues the user’s needs but also highlight the positive points. 47.7% of the partners consider that the eStation supports decision making at the highest level (Figure 4) while only 9% consider it to be low. This is accompanied by a good level of user satisfaction, with 70% of respondents considering themselves highly satisfied or satisfied. These results show the strong demand from partners and the interest in maintaining the eStation. These positive scores are mostly related to the access to data without the need for internet (i.e., through the MESA station, 64%), the extension of the data catalogue (61%), the easy generation of derived products (57%), the quality of information and visualization as well as the technical and scientific support (both at 52%). But, the system could be improved, especially the technical problems encountered by the MESA station (power supply, reception and acquisition problems, for 76% of the responses) that we already underlined in the previous section. It could be seen as a paradox in the fact that technical and scientific support appears as a strength and technical problems as the main weakness. This can be explained by several reasons. Firstly, this question merges both technical and scientific aspects, which may have a different interpretation. In addition, the technical and scientific support corresponds mainly to the training courses offered as well as the distance support that some GMES & Africa members can provide. The main technical concerns are more related to the local implementations of the MESA station (antenna, computers) and the electrical or technical supply for installation and maintenance. As other weaknesses, partners still point out data resolution (45%), problems during access or operations (38%), difficulties of use (22%), missing data (20%) and too complex products (16%). As highlighted above, there are some types of analysis and studies that cannot be addressed by the eStation. Due to the size of the data to be transferred, access to high resolution will not be possible. The data that partners would like to be integrated must meet several criteria such as the legal possibility to integrate them, size and redundancy of the request from several partners.

3.2. User Practice and Datasets

3.2.1. User Practice

Data from the eStation are distributed to a large number of collaborators, wider than our direct partners. Indeed, more than 90% of the GMES & Africa partners work in collaboration with at least one regional or national institute, organisation or company, and 52% have more than three users. The communication set up with the users (structure and formalization of their interactions and the products delivered) really depends on the partners: informal discussions, meetings and publications are used with a similar frequency (about 45% of respondents for each) and the favourite way to interact are meetings, organised when necessary (57% of respondents). Users requests have generally no particular deadlines (43%) and only 7% of them want a feedback within a day (Figure 5).
The eStation products are used for a variety or purposes (question 13). Although the majority is about seasonal agricultural monitoring (82% of respondents), climate trends (54%), forecasts and vulnerability studies (48% each) are also of interest. The estimation of impacts during extreme events (drought, floods, heat waves) is slightly lower (36%, Figure 6). This is mainly due to the origins of the program more focus on agricultural purpose than DRR.

3.2.2. Preferred Datasets

The main data used are in line with the proposals of the eStation project, since they are mainly related to rainfall data (75% of the users), used for agricultural yield, water resources and natural risk (floods) issues, and vegetation data (70.5%), for agricultural yield issues and monitoring of ecosystems and forests (Figure 7, question 32). This is followed by the use of fire (36.4%) and oceanographic products (34.1%), including fisheries data, and physical variables. In order to compare current data to climatological references, to build anomaly indicators and/or to build a complete climatology of past events, 52.3% of users use the complete time series or a long series (10 years). The other type of query is rather about a specific period, especially in the case of extreme events (drought, flooding). Recent and frequently updated data are requested for inland water data (31.8%) mostly to assess the water resources. Within the available products, users generally use more than 3 different datasets (72% of them) and only 4.5% use a single dataset. This can be explained by the complementary nature of the products to better identify derived products and the need to estimate uncertainties in products in regions that may be poorly instrumented. Then, latest monthly (11.4%) or weekly (11.4%) data are requested for monitoring products such as vegetation or fisheries. Daily data are also very much in the minority (4.5%).
It was found that the level of knowledge of the partners on the satellite products available on the eStation (Sentinel, SPOT, MODIS, LANDSAT) is high or very high for 28% of the partners. and low or very low for 23% of them. Results are similar for other derivative products that are integrated into the eStation. In recent years, only 5% of the partners surveyed replied that they had not participated in training courses, while 25% said they had attended at least three. These past training courses mainly provided participants with knowledge on the installation and use of the station (83%) and on optimising the eStation in an operational context (51%). Training on better use/optimization of the software and products and on a better understanding of the products and indices developed represent only 34% each of the training courses perceived. In this context, there appears to be a strong demand and need for additional training, as requested by 95% of the participants. Although the use and optimisation of the tools of the eStation is still in demand (69%) there is also a strong demand linked to the limited knowledge of the products to thematic training (91%).

4. Discussion and Future of the Climate Station

This dialogue with beneficiaries and users supports a better adaptation of the products to concrete needs in an operational context. Although it is complicated to quantify the usefulness of these services in concrete terms, this survey allows us to verify the availability of data, their correct resolution and the derived products according to the needs. They help to ensure that the products offered are understood and correctly used. Since this work is based on a survey of a specific project, the aim is therefore not to propose general conclusions or recommendations for all CS. This would be difficult and hazardous in another context with other objectives. Rather, it is an in-depth analysis within a specific framework. This study provides a framework of survey on the use and needs of users and an example of dialogue between the developers of CS and the users. This can be reproduced in a different region and context. Finally the results of this study will be useful for intercomparison and synthesis studies. In this study, the survey highlights an overall good evaluation of the service with regular and satisfied users. This was done thanks to a constant dialogue between developers and users during past workshops, training and informal discussions. Thanks to this work, the effectiveness of the service has improved. Nevertheless, the quantitative evaluation of this is complicated. Finally, the survey also makes it possible to prioritize future needs or necessary adaptations due to changes in needs, users and available data. One of the main goal of the users’ survey is to plan the future improvements of the eStation, both in the continuation of GMES & Africa, including the second phase, planned for 2022–2025, and the intra-ACP CS program. In the framework of the latter initiative, the eStation application will be named Climate Station, due to the customization and orientation of its features and contents for climate applications. This need of constant evolution of the eStation is confirmed by the nearly 75% of users answering that during the next 4 years they think they will have a strong increase in the use of the eStation (question 44). More specifically, two open questions were asked about the requests for improvement in the short term (year 2020 and 2021) and in the longer term (several years). Since the responses were quite similar for both time horizons, we organize the key findings under the following categories: training, technical issues, improved features and data.

4.1. Training

A major finding on the work to be carried out in the future is strengthening the training (14 comments in the short term section and 8 for the long term). The requests are related to training in the use of the eStation and technical, scientific and thematic support for the partners. The aim is to gain a good understanding of how the eStation manages data and products and the options available to users of the application. Several partners also want to learn more about and better understand some of the graphical properties available. It will be a question of better understanding the complexity of certain derived products made available concerning the monitoring of water use, drought or flood products. The current orientation is to complement the traditional way of sharing information on the eStation (manuals and presentations for classroom training sessions) with video tutorials, with a hierarchical organization, to cover from the general overview to very specific topics. These resources can be easily reused in different contexts, from capacity building to user support and maintenance.

4.2. Technical Issues

A significant number of requests concern the resolution of technical problems related to the MESA Station (36% of the comments on this point). These problems can be grouped into several themes:
  • issues related to the installation and the software update of the station
  • improvement and support for technical equipment
  • power supply problems
  • problems with the functioning of the computers, and namely data reception
  • issues in accessing to the online website
These points should be taken into account in the framework of the current phase of GMES & Africa, and the following one, which includes some maintenance activities to be performed in co-operation with the institutional partners of the project, as well as in the intra-ACP project. JRC believes that a correct planning of the maintenance of the stations is essential for the robust and reliable access to EO data, which is a key element for implementing both environmental monitoring and climate services.

4.3. Improved Features

Users also suggested some specific improvements to the eStation software, in different areas, ranging from the updates in data management to facilitate the reception of additional datasets, the possibility to manage their own shape files and geometries in data analysis, improved data accessibility and the implementation of certain new technologies. All the indicated points have been included by JRC in the planned development of the future version of the eStation. In particular, the Climate Station will implement an API for simple data download from ECMWF Climate Data Store and other data providers, will include additional software components implemented by partner teams for higher resolution data visualization (IMPACT, for forest monitoring and LC-LCC) and product intercomparison and fitness-for-purposes analysis (C3S F4P).

4.4. Data

With regard to data, and in line with previous comments, the issue of resolution has been regularly raised, with the request of providing higher resolution datasets, namely Landsat and Sentinel-2 that are key for some environmental monitoring applications, like forest degradation and wetlands monitoring, but also coastal erosion. Another common request is for access to additional datasets (new satellite products or additional derived products) and more tailored products and indicators to be derived from them. Another common request coming from beneficiary institutions and local partners is for access to additional datasets and more tailored products. For example they request more observational data to ensure higher quality products, to assess uncertainties and to validate models and satellite data. Finally, there are also requests for additions of specific themes (low water levels, floods, other vegetation products, oceanography, precipitation). These types of requests (more variables, finer resolution) are quite common when investigating users’ needs for environmental monitoring services [15]. JRC is indeed taking into account the specific requests emerging from the survey, prioritizing them in order to support the maximum of users.

4.5. Future of the eStation

Since the initiation of the climate stations, there is a constant evolution of the data and their characteristics (resolutions) to fit with the user needs and to adapt to the data available (e.g., change of satellite platform). Thanks to this survey strength and weakness of the technical equipment, tools and datasets have been identified and priorities for the future developments have been highlighted. Some of these recommendations will be integrated in the future. Nevertheless, some aspects, mostly related to technical equipment, are beyond the objective of the climate service and can not be satisfied. This is, for example, the power supply issues that are recurrent in West Africa and that need to be taken into account for the development of climate services in that area.

5. Conclusions

This survey provides a precise overview of the use of the eStation by local partners in an operational context. The added value of the products, the strengths and weaknesses of the station and the uses are discussed and evaluated. Overall, users have a positive opinion of the eStation with adapted functionalities and relevant databases: 70% of the members think the users have a very of fairly level of satisfaction and 80% of them think that the eStation strongly or modarately support decision making at highest level, which is online with the high potential added value of EO data in Africa [21]. As underlined in other studies on weather and climate services in Africa [15], training is essential and, although a large number of partners have already attended one or more training sessions, they are still in great demand for improving the proper functioning of the eStation and a good understanding of the products offered. Nevertheless, there are some weak points, such as the high rate of technical problems that prevent the proper functioning or full-time operation of the MESA stations. It is therefore important that the different actors find solutions to facilitate and respond quickly to users who encounter difficulties. It is important to maintain a two-way dialogue in order to guarantee users, decision-makers and institutions the products and functionalities best suited to respond to local problems that may emerge or evolve in the coming years.
However, based on this survey, 5 areas of improvement are defined that need to be addressed in the future in order to provide more efficient EO-based services:
  • the MESA station should be available at least 80% of the time. It was found that the Mesa station is not always working properly because of technical issues. They need to be solved when possible and the project should develop (i) capacity building activities and (ii) improve technical support which is underlined by 27% of respondents as unsatisfactory or not satisfactory at all.
  • increase the number of users so that 100% of beneficiaries have more than 3 users (right now, 47% of respondents have less than 3 users). Many members have more than three users which shows that this is a reasonable target: this would increase the overall impact of EO data on decision making. To do so, it is fundamental to foster cross communication among GMES Africa members in order to share good practices for reaching new users.
  • increase and standardize communication between beneficiaries and users in order to (i) better assess their needs across the whole program, (ii) monitor impacts of EO data use, detect potential for specific win-win cooperation (need for a very specific tool etc…). Users engagement is now recognized as a crucial step for developing powerful tools [22].
  • within the next 4 years, all members follow at least two workshops on specific products like satellite data, SPI etc. As underlined in other studies on weather and climate services in Africa [15], training is essential and, although a large number of partners have already attended one or more training sessions, they are still in great demand for a better use of the eStation and understanding the products offered.
  • include new types of data: including other sectors, other variables, weather forecasts etc. based on members feedback and taking into account the technical feasibility
On the basis of this experience, it is also possible to make further recommendations to improve the quality of surveys for CS or EO-related services as follows:
  • It is difficult to anticipate a missing question and it is hard or impossible to add later. A strong recommendation might be to take sufficient time and effort before to launch the survey ensuring that all points are covered. A possible recommendation might be to have initial informal discussions with randomly selected users, asking them questions that might highlight potentially missing information.
  • This survey was carried out on a voluntary basis. This choice was made in order to avoid imposing too much constraint on users, but it is a limiting factor if too few responses are received. In order to obtain a good response rate, it is important, before the launch and during the survey period, to show the importance of this evaluation for the developers, by taking the opportunity of meeting, general assembly, workshops to introduce the survey. It is also important to mention that developers will, in turn, improve the software and the data for the users.
  • The results of the survey should be shared with all partners (not just those who responded) during a dedicated workshop. This allows us to verify with the respondents if our understanding of the results is accurate. Moreover, this action shows that the survey is being analysed and that the results are visible with concrete actions proposed. This communication will also highlight the importance of responding to subsequent surveys and will encourage non-respondents to do so next time. The results can also be disseminated (in reports or publications) for different reasons such as a general promotion of this Communication, an intercomparison of usability and efforts made, a globalisation of use and needs.
This survey revealed underestimated information and allowed a better understanding of partners needs and expectations. These results show the importance of maintaining this two-way dialogue and will be renewed for the development of the new climate services set up at the European Commission.

Supplementary Materials

The supplementary materials are available online at https://0-www-mdpi-com.brum.beds.ac.uk/2073-4433/12/2/258/s1.

Author Contributions

Conceptualization, C.L.; methodology, C.L., P.R. and M.C.; software, V.V., J.V.K.; data curation, V.V., J.V.K.; writing—original draft preparation, C.L., M.C.; writing—review and editing, all the authors; visualization, C.L.; supervision, M.C. All authors have read and agreed to the published version of the manuscript.

Funding

This research received no external funding. The JRC contribution to GMES & Africa is financed through an Administrative Arrangement with the European Directorate-General for International Cooperation and Development (DG-DEVCO).

Institutional Review Board Statement

Not applicable.

Informed Consent Statement

Not applicable.

Data Availability Statement

The data presented in that study are available on request from the corresponding author.

Acknowledgments

The authors wish to thank all the European and African partners of the GMES & Africa project for promoting the fruitful partnership between the European Commission and the African Commission in the establishment of the eStation. Special thanks also to the partners who responded to the survey and made themselves available. The authors would also like to thank Brice Montfraix (AUC-TAT) for his support and for producing the partner maps. Finally, the authors would like to thank the two anonymous reviewers for their fruitful comments.

Conflicts of Interest

The authors declare no conflict of interest and declare any personal circumstances or interest that may be perceived as inappropriately influencing the representation or interpretation of reported research results.

References

  1. Roudier, P.; Sultan, B.; Quirion, P.; Berg, A. The impact of future climate change on West African crop yields: What does the recent literature say? Glob. Environ. Chang. 2011, 21, 1073–1083. [Google Scholar] [CrossRef] [Green Version]
  2. Parkes, B.; Sultan, B.; Ciais, P.; Wang, X. Modelling fertiliser significance in three major crops. Eur. J. Agron. 2017, 90, 1–11. [Google Scholar] [CrossRef] [Green Version]
  3. Faye, B.; Webber, H.; Naab, J.B.; MacCarthy, D.S.; Adam, M.; Ewert, F.; Lamers, J.P.; Schleussner, C.F.; Ruane, A.; Gessner, U.; et al. Impacts of 1.5 versus 2.0 C on cereal yields in the West African Sudan Savanna. Environ. Res. Lett. 2018, 13, 034014. [Google Scholar] [CrossRef]
  4. Hummel, M.; Hallahan, B.F.; Brychkova, G.; Ramirez-Villegas, J.; Guwela, V.; Chataika, B.; Curley, E.; McKeown, P.C.; Morrison, L.; Talsma, E.F.; et al. Reduction in nutritional quality and growing area suitability of common bean under climate change induced drought stress in Africa. Sci. Rep. 2018, 8, 1–11. [Google Scholar] [CrossRef] [PubMed]
  5. Ray, D.K.; West, P.C.; Clark, M.; Gerber, J.S.; Prishchepov, A.V.; Chatterjee, S. Climate change has likely already affected global food production. PLoS ONE 2019, 14, e0217148. [Google Scholar]
  6. Kirchhoff, C.J.; Carmen Lemos, M.; Dessai, S. Actionable knowledge for environmental decision making: Broadening the usability of climate science. Annu. Rev. Environ. Resour. 2013, 38, 393–414. [Google Scholar] [CrossRef]
  7. Vogel, C.; O’Brien, K. Who can eat information? Examining the effectiveness of seasonal climate forecasts and regional climate-risk management strategies. Clim. Res. 2006, 33, 111–122. [Google Scholar] [CrossRef] [Green Version]
  8. Tall, A.; Jay, A.; Hansen, J. Scaling Up Climate Services for Farmers in Africa and South Asia: Workshop Report; CCAFS Working Paper no. 40; CGIAR Research Program on Climate Change, Agriculture and Food Security (CCAFS): Copenhagen, Denmark, 2013. [Google Scholar]
  9. Tall, A.; Coulibaly, J.Y.; Diop, M. Do climate services make a difference? A review of evaluation methodologies and practices to assess the value of climate information services for farmers: Implications for Africa. Clim. Serv. 2018, 11, 1–12. [Google Scholar] [CrossRef]
  10. Lourenço, T.C.; Swart, R.; Goosen, H.; Street, R. The rise of demand-driven climate services. Nat. Clim. Chang. 2016, 6, 13–14. [Google Scholar] [CrossRef]
  11. Skelton, M.; Fischer, A.M.; Liniger, M.A.; Bresch, D.N. Who is ‘the user’of climate services? Unpacking the use of national climate scenarios in Switzerland beyond sectors, numeracy and the research–practice binary. Clim. Serv. 2019, 15, 100113. [Google Scholar] [CrossRef]
  12. Lorenz, S.; Dessai, S.; Forster, P.M.; Paavola, J. Adaptation planning and the use of climate change projections in local government in England and Germany. Reg. Environ. Chang. 2017, 17, 425–435. [Google Scholar] [CrossRef] [PubMed] [Green Version]
  13. Hansen, J.W.; Vaughan, C.; Kagabo, D.M.; Dinku, T.; Carr, E.R.; Körner, J.; Zougmoré, R.B. Climate services can support african farmers’ context-specific adaptation needs at scale. Front. Sustain. Food Syst. 2019, 3, 21. [Google Scholar] [CrossRef] [Green Version]
  14. Cerbaro, M.; Morse, S.; Murphy, R.; Lynch, J.; Griffiths, G. Information from earth observation for the management of sustainable land use and land cover in Brazil: An analysis of user needs. Sustainability 2020, 12, 489. [Google Scholar] [CrossRef] [Green Version]
  15. Sultan, B.; Lejeune, Q.; Menke, I.; Maskell, G.; Lee, K.; Noblet, M.; Sy, I.; Roudier, P. Current needs for climate services in West Africa: Results from two stakeholder surveys. Clim. Serv. 2020, 18, 100166. [Google Scholar] [CrossRef]
  16. Vaughan, C.; Hansen, J.; Roudier, P.; Watkiss, P.; Carr, E. Evaluating agricultural weather and climate services in Africa: Evidence, methods, and a learning agenda. Wiley Interdiscip. Rev. Clim. Chang. 2019, 10, e586. [Google Scholar] [CrossRef] [Green Version]
  17. Woldai, T. The status of Earth Observation (EO) & Geo-Information Sciences in Africa–trends and challenges. Geo-Spat. Inf. Sci. 2020, 23, 107–123. [Google Scholar]
  18. Giannopapa, C. The Socio-Economic Benefits of Gmes; ESPI Report 39; ESPI: Vienna, Austria, 2011. [Google Scholar]
  19. Clerici, M.; Combal, B.; Pekel, J.F.; Dubois, G.; van’t Klooster, J.; Skøien, J.O.; Bartholomé, E. The eStation, an Earth Observation processing service in support to ecological monitoring. Ecol. Inform. 2013, 18, 162–170. [Google Scholar] [CrossRef]
  20. Tart, S.; Groth, M.; Seipold, P. Market demand for climate services: An assessment of users’ needs. Clim. Serv. 2020, 17, 100109. [Google Scholar] [CrossRef]
  21. Agbaje, G.I.; John, O.N. Cooperation in earth observation missions in Africa: A role for afrigeoss. GeoJournal 2018, 83, 1361–1372. [Google Scholar] [CrossRef]
  22. Golding, N.; Hewitt, C.; Zhang, P. Effective engagement for climate services: Methods in practice in China. Clim. Serv. 2017, 8, 72–76. [Google Scholar] [CrossRef]
Figure 1. Map of the 12 consortia (al) involved in the GMES & Africa. For each consortia, a shaded region represents the countries associated and the name of the leader is indicated. The color indicates the status of the country representative (red for a partner and blue for a associate). Courtesy Brice Monfray (AUC).
Atmosphere 12 00258 g001
Figure 2. Distribution of MESA stations in the African regions participating in the MESA project. The stations are associated to the 5 Regional Implementation Centers, namely AgrHyMet, CICOS, BDMS, ICPAC and MOI, in Western, Central, Southern, Eastern Africa and in Indian Ocean regions. ACMAD was in charge of climate services at continental level.
Atmosphere 12 00258 g002
Figure 3. Distribution of the responses received depending on the GMES & Africa consortia. See main text for more detailed information
Atmosphere 12 00258 g003
Figure 4. Responses of the question (in % of answers), on ’To what extent do you think eStation information supports decision-making at highest level?’. Only one possible answer.
Atmosphere 12 00258 g004
Figure 5. Responses of the question (in % of answers) on ’How soon did you have to respond or offer products to your users?’. Only one possible answer.
Atmosphere 12 00258 g005
Figure 6. Responses of the question, on ’What do you use the eStation for?’ Multiple answers possible
Atmosphere 12 00258 g006
Figure 7. Responses of the question (in % of the participants), on ’What products do you use?’. Multiple answers possible.
Atmosphere 12 00258 g007
Publisher’s Note: MDPI stays neutral with regard to jurisdictional claims in published maps and institutional affiliations.

