
Optical Characteristics and Radiative Properties of Aerosols in Harbin, Heilongjiang Province during 2017


1
School of Energy Science and Engineering, Harbin Institute of Technology, 92 West Dazhi Street, Harbin 150001, China
2
School of Atmospheric Sciences, Nanjing University, Nanjing 210023, China
3
Key Laboratory of Aerospace Thermophysics, Ministry of Industry and Information Technology, Harbin Institute of Technology, 92 West Dazhi Street, Harbin 150001, China
*
Author to whom correspondence should be addressed.
Atmosphere 2021, 12(4), 463; https://0-doi-org.brum.beds.ac.uk/10.3390/atmos12040463
Submission received: 21 March 2021
/
Revised: 4 April 2021
/
Accepted: 6 April 2021
/
Published: 7 April 2021
(This article belongs to the Special Issue Lidar Remote Sensing Techniques for Atmospheric Aerosols)
Abstract
:This study considers aerosol optical properties and direct radiative forcing over Harbin (126.63° E, 45.75° N), the highest latitude city in Northeast China, during 2017. Observations based on the CE-318 sun-photometer show that the annual mean values of the aerosol optical depth (AOD) at 500 nm and the Angstrom exponent (AE) at 440–870 nm over Harbin are respectively and . Aerosol loading is the highest in the spring followed by winter, and the lowest loading is in autumn. is the highest in summer, second highest in winter, and lowest in autumn. The Santa Barbara DISORT Atmospheric Radiative Transfer (SBDART) model is used to estimate the shortwave aerosol radiative forcing at the top of the atmosphere, on the Earth’s surface and in the atmosphere, and the annual mean values are , and , respectively, which indicate that aerosols cause climate effects of cooling the earth-atmosphere system, cooling the earth’s surface and heating the atmosphere. Four main aerosol types in Harbin are classified via AOD and AE. Specifically, clean continental, mixed type, biomass burning and urban industry, and desert dust aerosols accounted for 51%, 38%, 9%, and 2% of the total, respectively. Aerosol radiative forcing varies greatly in different seasons, and the aerosol load and type from different emission sources have an important influence on the seasonal variation of radiative forcing.
1. Introduction
The Earth’s radiation budget determines the long-term global climate [1]. Aerosol radiative forcing (ARF) is utilized to quantify the aerosol perturbation to the Earth’s radiation balance, defined as the difference between net radiation fluxes in aerosol-free and aerosol-laden atmospheric conditions [2]. ARF is an important factor in Earth’s climate change, which can affect the structure of the atmospheric temperature, cloud formation, and dynamic processes such as atmospheric motion and the hydrological cycle [3,4]. Because ARF is not involved in a variety of complex feedback processes in the Earth–atmosphere system, it has high accuracy and is usually utilized to predict climate change and improve climate models and remote sensing algorithms [5]. In order to analyze the impact of aerosols on climate in detail, it is crucial to analyze aerosol optical properties and their radiative effects.
In recent years, China’s continuous economic growth and rapid urbanization and industrialization have led to high aerosol loading and changes in ARF. Relevant studies mainly focus on regions such as Beijing-Tianjin-Hebei, the Yangtze River Delta, and the Pearl River Delta [6,7,8], which are characterized by developed economies, dense populations, and high aerosol loading. In response to the severe smog pollution in Beijing, Li et al. [9] analyzed the absorption characteristics of brown carbon (BrC) in autumn and winter and estimated the light absorption contribution of Nitro-aromatic (NAC) compound to methanol-soluble BrC. The surprising finding is that NAC is a strong BrC chromophore, and a very small amount of the compound will cause a high proportion of extinction. In order to better understand the interaction between the temporal and spatial distribution of particulate matter and the atmospheric boundary layer structure during the winter haze outbreak in the North China Plain, Li et al. [10] conducted field experiments during the intensive observation period (IOP) from December 2018 to January 2019. Elevated inversion layer at low altitude coupled with low wind speed contributed to the accumulation of PM2.5 at low levels, causing continuous haze pollution. In addition, the higher height of the boundary layer at night may be attributed to the weak stability of the boundary layer. Compared with the regions mentioned above, the Northeast has a larger geographic area and major industrial areas in China, and extensive industries and heating often cause serious pollution [11,12]. However, studies on aerosol optical properties and radiative effects in Northeast China are very limited [13,14]. Mao et al. [15] analyzed the spatial distribution of ARF with altitude under different weather conditions in Harbin, Heilongjiang Province. Wu et al. [16] studied the seasonal distribution of aerosol optical parameters and ARF in a semi-arid area of Tongyu in Jilin Province, where the aerosols led to a cooling effect of the surface and a warming effect of the atmosphere. Che et al. [17] compared the aerosol optical properties and ARF in four industrial regions in Liaoning Province and found that pollution in Benxi was more serious and that the cooling effects of the surface (SFC) and the top of the atmosphere (TOA) were also stronger. However, these studies focused only on the overall level of aerosol optical parameters and ARF in different regions and their temporal or spatial distributions. The impact of aerosol loading and types on the variations in ARF based on continuous observations in the same region have not yet been analyzed, which is very important to the study of regional aerosol climatic effects.
In this paper, data from twelve months of continuous observations in 2017 in Harbin, Heilongjiang Province are used to analyze the variations in aerosol optical properties and types, as well as ARF and aerosol climatic effects. In Section 2, a brief description of the regional characteristics and the research framework are given. The acquisition of aerosol data and the ARF calculation method are introduced. In Section 3, the overall level of and temporal variations in aerosol optical parameters and ARF are evaluated. Additionally, the impact of aerosol loading and types on the seasonal variations in ARF are analyzed in detail.
2. Methods
2.1. Study Site and Research Framework
The aerosol optical properties and radiative effects in Harbin (126.63° E, 45.75° N) during 2017 were analyzed. Harbin, located in the northeastern area of the Northeast Plain of China, is the capital city with the highest latitude and the lowest temperature in China. Harbin belongs to the temperate continental monsoon climate. The annual average temperature is 5.2 °C. The lowest temperature in January is −37.7 °C. The highest temperature in July is 36.5 °C. The frost-free period is 110 days. The average annual precipitation is about 569.1 mm. The area’s winter heating is mainly from coal burning, and the winter heating period is from October to March of the following year [18]. In spring (April–June), there is less rainfall. The monthly temperature change is usually about 8–10 °C. Coal emissions in April are the main source of air pollution; in early May, aerosol particles mainly come from soil dust, coal and industry, and in late May and June are mainly affected by traffic and industry [19]. The summer (July–August) is hot and rainy, and precipitation mainly occurs in the summer, which accounts for about 60% of the annual precipitation [20]. In the autumn (September–October), the weather is fair. As straw open burning is one of the most common agricultural activities in this area, most of the pollutants (i.e., CO, PM, BC, OC) generated by this activity showed the largest emissions in April and October [21]. Winter (November–March) is cold and dry with snow covering the ground for a long time and heavy reliance on coal-fired boiler heating. A study on the seasonal distribution of particulate matter in Harbin found that the seasonal distribution of the concentrations of PM, SO2, NO2 and CO showed the following rules: winter > autumn > spring > summer [22].
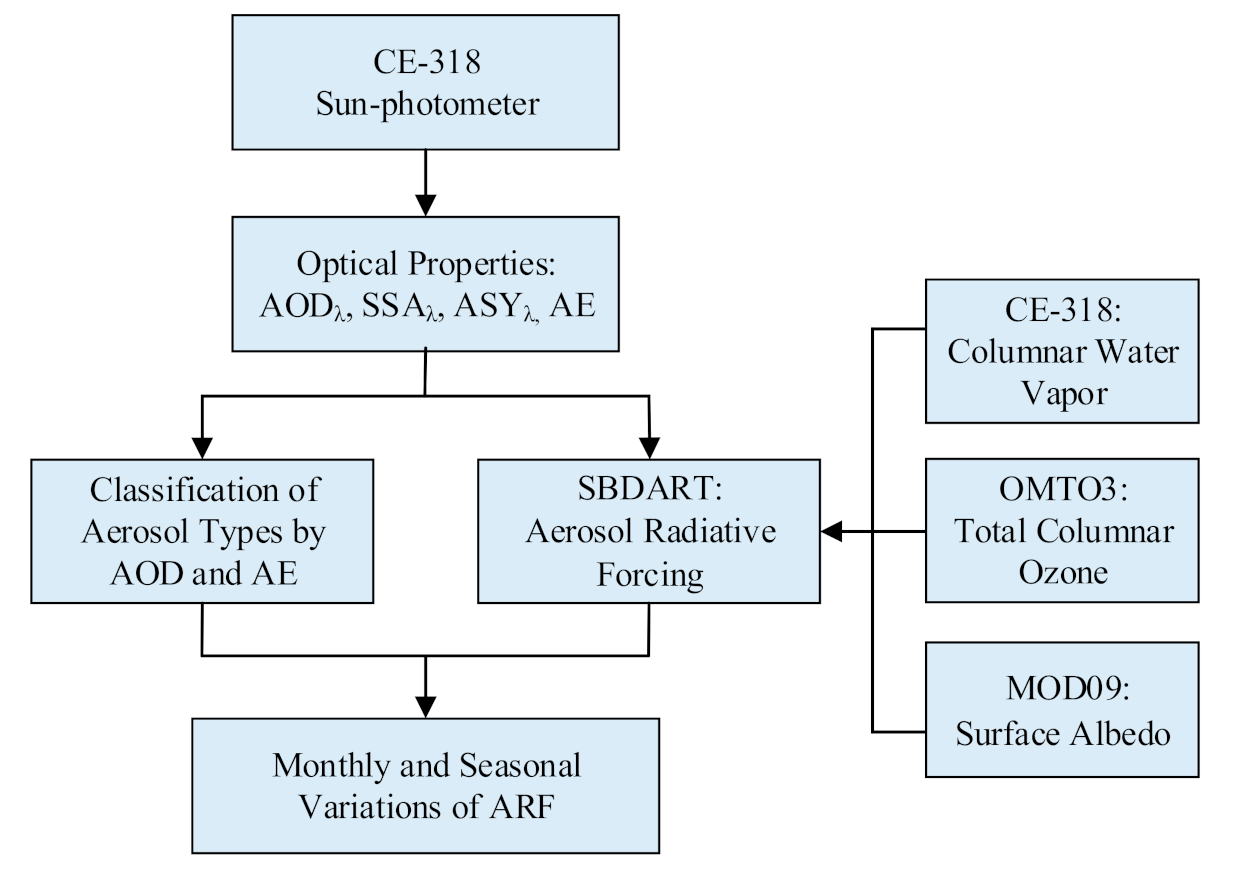
To investigate the optical properties and radiation characteristics of aerosols in Harbin, Heilongjiang Province in 2017, the team collected aerosol optical parameters such as aerosol optical depth (AODλ), single scattering albedo (SSAλ) and asymmetry factor (ASYλ) at five wavelengths (ie 440, 500, 675, 870 and 1020 nm) and Angstrom exponent (AE). For the calculation of ARF, parameters such as columnar water vapor, daily average visibility, total columnar ozone, and surface albedo are needed in addition to the aerosol optical parameters. Both the columnar water vapor and aerosol optical parameters were obtained via a CE-318 sun-photometer, while the total columnar ozone and surface albedo were both obtained from satellite remote sensing. The research framework is outlined in Figure 1.
2.2. Instrument
The CE-318 sun-photometer (CIMEL) mainly measures direct sunlight and diffuse sky radiance. Specifically, the direct sun irradiance is measured every 15 min on eight spectral bands centered at 340, 380, 440, 500, 675, 870, 940, and 1020 nm. The diffuse sky irradiance is measured every 30 min on four spectral bands centered at 440, 675, 870, and 1020 nm. Based on the measurement data, the improved Skyad.pack (Version 4.2, Nakajima, Tokyo, Japan) algorithm is utilized to retrieve the aerosol optical parameters, such as SSA, ASY, and complex refractive exponent (RI). The inversion scheme, uncertainty, and error of the Skyad.pack algorithm are described in more detail by Estellés et al. [23] and Chen et al. [24]. More information about this instrument can also be found in several previous studies [25]. The observation site is located at the top of the Power Building of the Harbin Institute of Technology, 20 m above the ground.
2.3. SBDART Model
The Santa Barbara DISORT Atmospheric Radiative Transfer (SBDART) model [26] is utilized to estimate plane-parallel radiation transfer in clear-sky or cloudy conditions. Some key input parameters were used to calculate net radiation fluxes under clear-sky conditions. The time and geographic parameters, such as longitude, latitude, date, and UTC time, were used to calculate the position of the sun. Aerosol optical parameters are derived from the data observed by the sun-photometer, including , , and at five wavelengths (440, 500, 675, 870, and 1020 nm) to further calculate parameters at other wavelengths. To obtain the temperature and pressure distribution, the mid-latitude winter atmospheric profile was selected in winter (November to March), and the mid-latitude summer atmospheric profile was selected in other months. Columnar water vapor was observed by the sun-photometer. The visibility (time resolution is 3 h) is the real-time observation data of the Harbin weather station, which can be obtained from https://www.ncdc.noaa.gov/. (Access time is 2019). The total columnar ozone was obtained using the Ozone Monitor (OMI, Netherlands Institute for Air and Space Development and Finnish Meteorological Institute) onboard the Aura, and the OMTO3 (Level-2, Version 003) product was used herein. The time resolution of this product is 98min, and the spatial resolution is 13 km × 24 km. The OMI total columnar ozone product is also described by Viswanatha Vachaspati et al. [27] and Bibi et al. [28] and is available at https://disc.gsfc.nasa.gov. (Access time is 2019). Surface albedo is obtained by the Moderate Resolution Imaging Spectrometer (MODIS) instrument on the Terra and Aqua satellites. The MOD09 (Level-2, time resolution is 5 min) surface albedo used in the present study is the true surface albedo corrected for atmospheric gases and aerosols. The relevant content has been introduced by Shi et al. [29] and Fang et al. [30], which is available at https://ladsweb.modaps.eosdis.nasa.gov. (Access time is 2019).
The main output parameters of the SBDART model are net fluxes at the TOA and SFC. ARF is the difference between the net radiation fluxes in aerosol-free () and aerosol-laden (F) atmospheric conditions and can be expressed as:
where the direction of the arrow indicates the direction of the radiation fluxes. () is the ARF at the TOA or SFC, and the difference between the two is the ARF within the atmosphere (ATM). It can be expressed as:
where represents the radiative energy () that the aerosols absorb and convert into heat within the atmosphere. If the sign of is negative, the aerosols cause a cooling effect of the atmosphere; if it is positive, the aerosols lead to a warming effect.
In this study, because the solar flux is very sensitive to the water vapor content, the collection frequency of columnar water vapor is 15 min/time. The response of ozone concentration to shortwave and longwave radiation flux is not very strong, and its time resolution is daily. The daily average radiative forcing data is obtained by averaging the data [31]. To verify the accuracy of data processing, we also compared the results with other research results.
3. Results and Discussion
3.1. Seasonal Characteristics of Aerosol Optical Properties
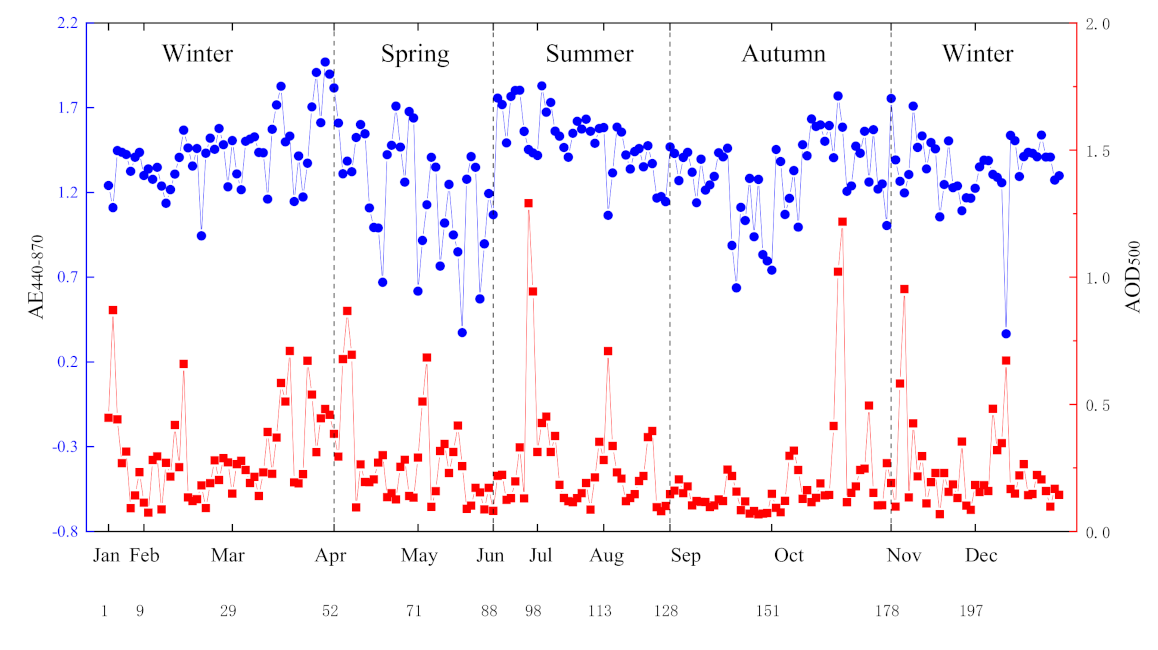
, the optical depth at 500 nm, is representative of the column aerosol loading. is the Angstrom exponent at 440–870 nm, corresponding to the aerosol size. and are important parameters for evaluating aerosol optical and radiative properties [32]; the daily mean and are presented in Figure 2. During the study period, ranges from 0.07 to 1.29 with an annual mean value of . For more than half of the days (52%), is less than 0.2, indicating that the aerosol loading in Harbin was relatively light overall. However, high aerosol loading events with values above 0.5 can be found in almost all months (except September), which requires further study. ranges from 0.37 to 1.97 with an annual mean value of . For nearly four-fifths of the days (79%), is higher than 1.2 and implies the dominance of fine mode particles over Harbin. And particle size distribution requires further evaluation in detail. The large daily variations in and indicate that the aerosol loading and types caused by different emission sources vary in different months.
The seasonal mean and are calculated and presented in Table 1 to further investigate their seasonal variations. and are respectively and during spring, and during summer, and during autumn, and and during winter. On the seasonal scale, is the highest in spring, indicating high aerosol loading. The medium level of AE in spring implies that the aerosol size in spring is larger than that in autumn, which may be related to the dust aerosol transport from Western China due to the frequent strong wind in the spring [14]. In the summer, is low, but is the highest of the year. This suggests that mainly fine particles exist during this season, which is probably due to industrial emissions, exhaust emissions, or transported aerosols from the south [33,34]. in the summer is much lower than that in the spring because the frequent precipitation reduces the aerosol loading in the atmosphere. Compared with summer, decreases a lot in autumn, indicating that the average size of aerosols in autumn is larger than that in summer. The lowest in autumn and the reduction in aerosol loading imply that aerosol emissions are low overall. Besides, the air mass over Harbin is dominated by the anticyclone system in autumn [35], so the atmosphere is relatively clean. The high and in winter indicate the increase in aerosol loading and the high emission of fine particles, which is supported by the straw burning in nearby fields and the continuous operation of heating boilers. Moreover, the cold and dry weather in winter is not conducive to aerosol hygroscopic growth. In addition, we collected data on AOD500 and AE440–870 at nearby AERONET sites from the NASA website (https://aeronet.gsfc.nasa.gov/cgi-bin/webtool_inv_v3?stage=3®ion=Asia&state=Mongolia&site=Dalanzadgad&place_ code=10&if_polarized=0). (Access time is 2019), and the contents are summarized in Table 2. A comparative analysis with the research results of this article found that there are certain differences in the data due to different regional distributions, but the data range shows a certain degree of coincidence.
3.2. Monthly Variations in ARF
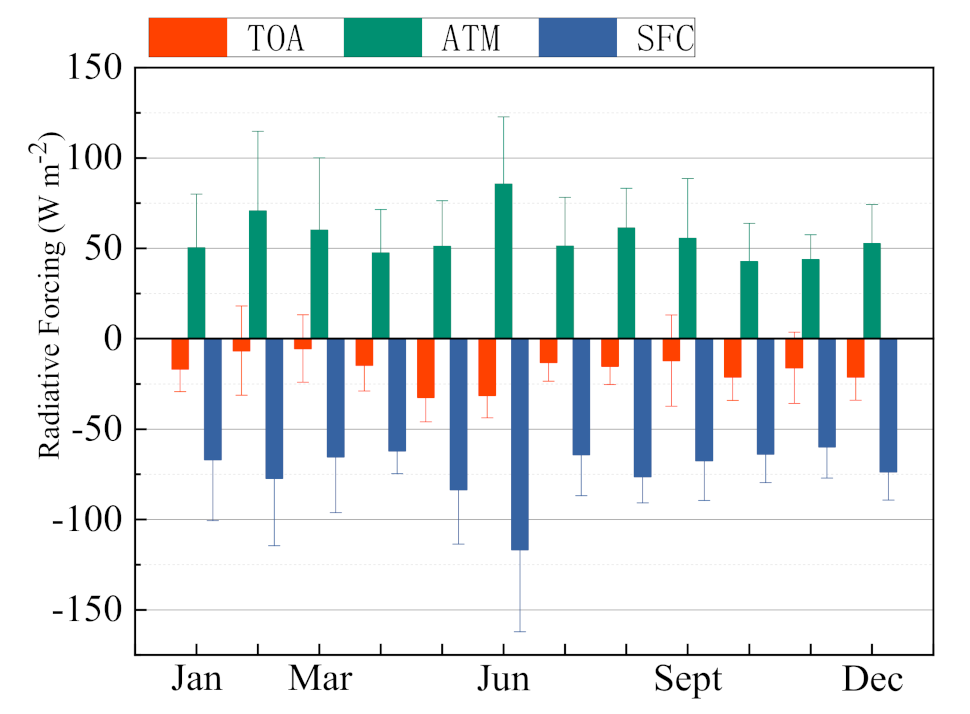
ARF at TOA, SFC, and within the ATM are calculated using the SBDART model to analyze the overall level of and monthly variations in ARF, as shown in Figure 3. In addition, we compared ARF in the present study with that in some previous studies in different regions of China, as shown in Table 3. Figure 3 shows that the ARF at the TOA ranges from (March) to (May) with an annual mean value of . ARF at the SFC varies between (November) to (June) with an average annual value of . The calculated values of ARF within the ATM are between (October) and (June), with an annual mean value of .
During the study period, ARF at the TOA is negative for most of the days (about 86%), while it is positive for a few days (about 14%) during autumn and winter. Similar to many previous studies, ARF at TOA is usually found to be negative [36,37]. Zhao et al. [38] found that the snow in Northeast China can cause a positive ARF value at the TOA by increasing the surface albedo. The negative annual mean ARF at TOA implies that scattering type of aerosols reflected the solar radiation back into space and reduced the shortwave radiation fluxes reaching the TOA. Thus, the aerosols in Harbin caused a cooling effect of the Earth–atmosphere system. In the present study, ARF at the SFC is negative every day. Kim and Ramanathan [36] and Yu et al. [39] also found that ARF at the SFC was entirely negative in their studies. The negative ARF at the SFC is corresponding to the decrease in the incoming solar radiation leading to a cooling effect of SFC. It is worth noting that the ARF at the SFC is larger than that at the TOA, indicating the existence of absorbing aerosols. The large differences between the solar radiation reflected back into space at the TOA and the reduced solar radiation at the SFC indicate the net absorption of solar radiation by aerosols in the ATM. It can be seen that the ARF within the ATM is positive every day and implies that the aerosols kept a large amount of solar shortwave radiation within the ATM resulting in a warming effect of the atmosphere. As shown in Table 2, the overall level of ARF calculated in the present study is similar to that in Harbin calculated by Mao et al. [15] and that in Fushun calculated by Che et al. [17]. The ARF in some regions is much lower than that in Harbin, such as Taihu [40], Lanzhou [41] and Tongyu [16]. However, the ARF in many regions is higher than that in Harbin, such as in Anshan [17], Nanjing [42], and Beijing [43], where the industry or population density is usually higher than that in Harbin. Gong et al. [41] found that there are significant differences in ARF among regions with different economic or industrial conditions in China, which requires further detailed study.
3.3. Variations in Aerosol Types
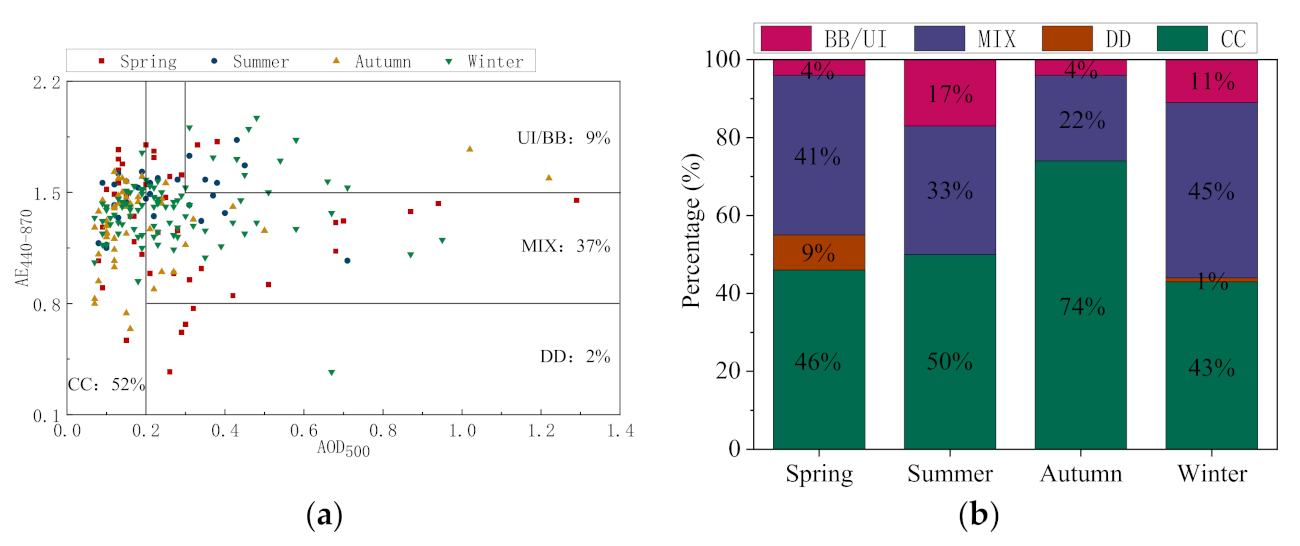
There are differences in aerosol properties between different months in Harbin. In order to study the change in aerosol types caused by different emission sources, it is necessary to analyze the variations in aerosol types. The aerosol types can be classified according to their physical and optical properties. AOD contains information on aerosol loading, and the AE is related to particle size. The aerosol classification method based on AOD and AE is now the most commonly used method [44,45,46]. The aerosols in Harbin can be classified into four typical types. Specifically, clean continental (CC) aerosols representing the background atmospheric conditions in Harbin are considered as , while desert dust (DD) aerosols are considered as 0.2 and . Biomass burning or urban and industry (BB/UI) aerosols are considered as and , while cases that do not belong to any of the above types are mixed type (MIX) aerosols.
The scatter plot of the daily mean and as well as the total percentage of various aerosol types during the year are shown in Figure 4a; the percentage of various aerosol types during different seasons is calculated in Figure 4b. As shown in Figure 4a, the total percentage of various aerosol types during the year is 52% for CC aerosols, 37% for MIX aerosols, 9% for BB/UI aerosols, and 2% for DD aerosols. Figure 4b shows that CC, MIX, BB/UI, and DD aerosols are respectively 46%, 41%, 4%, and 9% in spring, 50%, 33%, 17%, and 0% in summer, 74%, 22%, 4%, and 0% in autumn, and 43%, 45%, 11%, and 1% in winter. It can be seen that there are obvious differences in the aerosol types between different seasons. During the study period, the dominant aerosol type in Harbin is CC, indicating that aerosol loading is light overall. CC aerosols account for the highest proportion in autumn, corresponding to the lowest aerosol loading, which is due to the active atmosphere in Harbin [12]. MIX aerosols have a wide range of sources and are found to be the second-largest contributor during the study period. What is more, MIX aerosols account for more than 20% of the aerosol types in all seasons, which shows the important influence of MIX aerosols in Harbin throughout the year. There is a higher proportion of MIX aerosols in both spring and winter. In spring, this is due to the rise in temperature and the large increase in dust particles, while, in winter, it is related to the increase in soot and dust particles caused by activities such as heating and biomass burning [47]. The proportion of BB/UI aerosols is lower during the study period, but it varies greatly in different seasons. The contribution of DD aerosols is the lowest (2%) during the year, and it occurs mainly in spring, which suggests that sand pollution is most likely to occur in the spring in the study area.
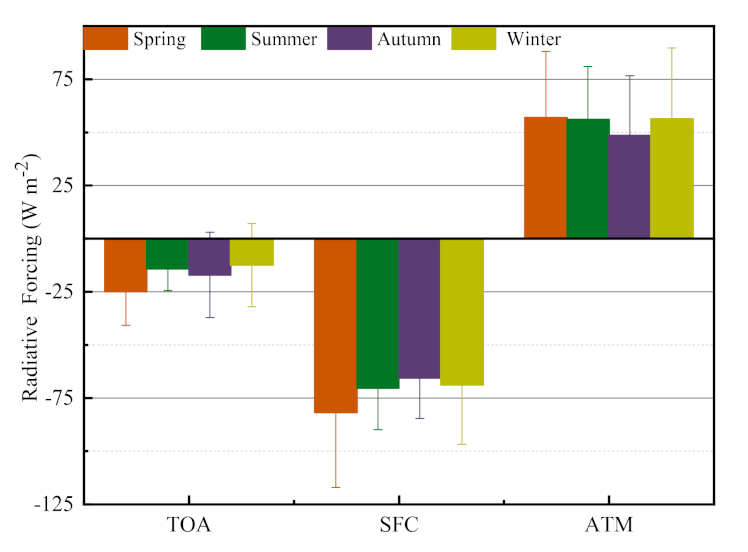
3.4. Seasonal Variations in ARF
In Section 3.2, we analyzed the monthly variations in ARF and found visible differences in ARF between different months during the year. Therefore, it is necessary to further study the seasonal variations in ARF. The mean values of ARF at the TOA, SFC, and within the ATM in different seasons are shown in Figure 5. As shown in Figure 5, the ARF at the TOA, SFC, and within the ATM are respectively , , and , during the spring, , , and during the summer, , , and during the autumn, and , , and during the winter.
The highest ARF at the TOA in the spring implies that aerosols have the strongest reflection of the solar radiation, which is likely related to the higher emission of coarse particles such as DD aerosols. A large quantity of coarse particles greatly increases the reflection of solar radiation back into space. Tian et al. [48] found that DD aerosols have strong scattering ability with large particle sizes and have especially high forward scattering, which could cause strong ARF at the TOA. In the spring, the ARFs at the SFC and within the ATM are the highest of the year mainly due to the highest aerosol loading, which absorbs a large amount of solar radiation. Gong et al. [41] showed that the local pollutant loading strongly affected the ARF at the SFC and within the ATM because of the absorption of aerosols. Gharibzadeh et al. [49] found that the higher ARF within the ATM in the spring and summer was due to the increase in aerosol loading and the different aerosol characteristics. The ARF at the TOA in summer is much lower than that in spring because of the significant increase in fine aerosols such as BB/UI aerosols and the decrease in coarse particles such as DD and MIX aerosols. The ARFs at the SFC and within the ATM have also decreased compared with spring, especially at the SFC, which may be related to the high reduction in aerosol loading caused by the frequent precipitation. In autumn, the ARF at the TOA is slightly higher than that in the summer, suggesting higher scattering of aerosols. As shown in Section 3.1, the average particle size in autumn is larger than that in the summer. The ARFs at the SFC and within the ATM both decrease a lot, indicating that the aerosol absorption is weakened significantly due to the slight aerosol loading. In winter, the ARF at the TOA is lower, and the average particle size is smaller than in autumn, while the ARFs at the SFC and within the ATM both increase a lot because of the high MIX aerosol loading. The dust plumes mixed with soot aerosols caused by biomass burning and heating enhanced the absorption of solar radiation leading to large positive ARF at the ATM. It can be seen that the seasonal differences in ARF are significant, especially at the TOA and SFC. There are significant differences in the ARF between different seasons. The seasonal variations in ARF mainly depend on the variability in aerosol loading and types from different emission sources.
4. Conclusions
Global climate change caused by aerosols has become an issue with significant scientific focus. In this study, we analyzed aerosol optical properties and radiative effects in Harbin, Northeastern China, during January to December 2017, including , , and the variation in aerosol types. The monthly and seasonal variations in ARF were analyzed in detail.
For more than half of the days (52%), AOD500 is less than 0.2, indicating that the aerosol loading in Harbin was relatively light overall. However, high aerosol loading events with AOD500 values above 0.5 can be found in almost all months (except September). For nearly four-fifths of the days (79%), AE 400–870 is higher than 1.2 and implies the dominance of fine mode particles over Harbin. During the study period, ARF at the TOA is negative for most of the days (about 86%), which means that the aerosols in Harbin caused a cooling effect of the Earth–atmosphere system. ARF at the SFC and ATM presents negative and positive values respectively throughout the year, indicating the cooling and heating effects on the earth’s surface and the atmosphere, respectively. ARF at the TOA is highest in spring, −24.83 ± 15.94 , followed by autumn, and lowest in winter. ARF at the SFC and ATM are the highest in spring, which are −81.83 ± 35.18 and 57.00 ± 31.18 , respectively. And the lowest in autumn. CC aerosol is a typical aerosol type in Harbin, and the proportion is the highest in autumn, reaching 74%; MIX aerosol contributes more than 20% in each season.
In this study, since the data quality may be affected by weather conditions or other reasons, we will combine satellite data and observational data from nearby sites for further analysis and verification in the future. Furthermore, in order to provide opportunities to improve the accuracy of aerosol products and expand their temporal and spatial coverage, we will conduct in-depth exploration in the direction of ground-based remote sensing networks.
Author Contributions
Conceptualization, J.L. and W.S.; software, J.L.; validation, J.L. and W.S.; formal analysis, J.L.; writing—original draft preparation, J.L.; writing—review and editing, J.L.; supervision, Y.Y. and S.D. All authors have read and agreed to the published version of the manuscript.
Funding
This research was funded by the National Natural Science Foundation of China, grant numbers 52041601.
Acknowledgments
This research was funded by the National Natural Science Foundation of China, grant numbers 52041601. A very special acknowledgement is made to the editors and referees who made important comments to improve this paper. The authors also would like to thank MODIS data teams and Giovanni online data system for the data base, as well as the author/maintainer of the SBDART model.
Conflicts of Interest
The authors declare no conflict of interest. The funders had no role in the design of the study; in the collection, analyses, or interpretation of data; in the writing of the manuscript, or in the decision to publish the results.
References
- Loeb, N. Towards a Seamless Global Long-Term Earth Radiation Budget Climate Data Record. In AGU Fall Meeting Abstracts. In Proceedings of the Agu Fall Meeting, San Francisco, CA, USA, 14–18 December 2015. [Google Scholar]
- Jacob, D.J. Introduction to Atmospheric Chemistry; Princeton University Press: Princeton, NJ, USA, 1999. [Google Scholar]
- Ramachandran, S.; Kedia, S. Radiative effects of aerosols over Indo-Gangetic plain: Environmental (urban vs. rural) and seasonal variations. Environ. Sci. Pollut. Res. 2012, 19, 2159–2171. [Google Scholar] [CrossRef]
- Ramanathan, V.C.P.J.; Crutzen, P.J.; Kiehl, J.T.; Rosenfeld, D. Aerosols, climate, and the hydrological cycle. Science 2001, 294, 2119–2124. [Google Scholar] [CrossRef] [Green Version]
- Stocker, T. (Ed.) Climate Change 2013: The Physical Science Basis: Working Group I Contribution to the Fifth Assessment Report of the Intergovernmental Panel on Climate Change; Cambridge University Press: Cambridge, UK, 2014. [Google Scholar]
- Zheng, Y.; Che, H.; Yang, L.; Chen, J.; Wang, Y.; Xia, X.; An, L. Optical and radiative properties of aerosols during a severe haze episode over the North China Plain in December 2016. J. Meteorol. Res. 2017, 31, 1045–1061. [Google Scholar] [CrossRef]
- Che, H.; Qi, B.; Zhao, H.; Xia, X.; Eck, T.F.; Goloub, P.; Wu, Y. Aerosol optical properties and direct radiative forcing based on measurements from the China Aerosol Remote Sensing Network (CARSNET) in eastern China. Atmos. Chem. Phys. 2018, 18, 405–425. [Google Scholar] [CrossRef] [Green Version]
- Mai, B.; Deng, X.; Li, Z.; Liu, J.; Xia, X.A.; Che, H.; Cribb, M. Aerosol optical properties and radiative impacts in the Pearl River Delta region of China during the dry season. Adv. Atmos. Sci. 2018, 35, 195–208. [Google Scholar] [CrossRef]
- Li, X.; Yang, Y.; Liu, S.; Zhao, Q.; Wang, G.; Wang, Y. Light absorption properties of brown carbon (BrC) in autumn and winter in Beijing: Composition, formation and contribution of nitrated aromatic compounds. Atmos. Environ. 2020, 223, 117289. [Google Scholar] [CrossRef]
- Li, Q.; Wu, B.; Liu, J.; Zhang, H.; Cai, X.; Song, Y. Characteristics of the atmospheric boundary layer and its relation with PM2. 5 during haze episodes in winter in the North China Plain. Atmos. Environ. 2020, 223, 117265. [Google Scholar] [CrossRef]
- Chen, Q.X.; Yuan, Y.; Huang, X.; Jiang, Y.Q.; Tan, H.P. Estimation of surface-level PM2. 5 concentration using aerosol optical thickness through aerosol type analysis method. Atmos. Environ. 2017, 159, 26–33. [Google Scholar] [CrossRef]
- Chen, W.; Zhang, S.; Tong, Q.; Zhang, X.; Zhao, H.; Ma, S.; He, Y. Regional characteristics and causes of haze events in Northeast China. Chin. Geogr. Sci. 2018, 28, 836–850. [Google Scholar] [CrossRef] [Green Version]
- Wu, Y.; Zhang, R.; Pu, Y.; Zhang, L.; Ho, K.F.; Fu, C. Aerosol optical properties observed at a semi-arid rural site in northeastern China. Aerosol Air Qual. Res. 2012, 12, 503–514. [Google Scholar] [CrossRef]
- Peng, W.; Huizheng, C.; Xiaochun, Z.; Qingli, S.; Yaqiang, W.; Zhonghua, Z.; Xin, D.; Dajiang, Y. Aerosol optical properties of regional background atmosphere in Northeast China. Atmos. Environ. 2010, 44, 4404–4412. [Google Scholar]
- Qianjun, M.; Chunlin, H.; Hengxing, Z.; Qixiang, C.; Yuan, Y. Aerosol optical properties and radiative effect under different weather conditions in Harbin, China. Infrared Phys. Technol. 2018, 89, 304–314. [Google Scholar]
- Wu, Y.; Zhu, J.; Che, H.; Xia, X.; Zhang, R. Column-integrated aerosol optical properties and direct radiative forcing based on sun photometer measurements at a semi-arid rural site in Northeast China. Atmos. Res. 2015, 157, 56–65. [Google Scholar] [CrossRef]
- Che, H.; Zhao, H.; Wu, Y.; Xia, X.; Zhu, J.; Wang, H.; Wang, Y.; Sun, J.; Yu, J.; Zhang, X.; et al. Analyses of aerosol optical properties and direct radiative forcing over urban and industrial regions in Northeast China. Meteorol. Atmos. Phys. 2015, 127, 345–354. [Google Scholar] [CrossRef]
- Xu, H.; Wang, W.; Wang, H.; Sun, Y.; Zhong, Z.; Wang, S. Differences in quantity and composition of leaf particulate matter and morphological structures in three evergreen trees and their association in Harbin, China. Environ. Pollut. 2019, 252, 1772–1790. [Google Scholar] [CrossRef] [PubMed]
- Chen, Q.X.; Huang, C.L.; Xiao, T.; Yuan, Y.; Mao, Q.J.; Tan, H.P. Characterization of atmospheric aerosols and source apportionment analyses in urban Harbin, northeast China. Infrared Phys. Technol. 2019, 103, 103109. [Google Scholar] [CrossRef]
- Xie, Y.; Chi, Y. Geochemical investigation of dry-and wet-deposited dust during the same dust-storm event in Harbin, China: Constraint on provenance and implications for formation of aeolian loess. J. Asian Earth Sci. 2016, 120, 43–61. [Google Scholar] [CrossRef]
- Zhang, M.; Chen, W.; Shen, X.; Zhao, H.; Gao, C.; Zhang, X.; Liu, W.; Yang, C.; Qin, Y.; Zhang, S.; et al. Comprehensive and high-resolution emission inventory of atmospheric pollutants for the northernmost cities agglomeration of Harbin-Changchun, China: Implications for local atmospheric environment management. J. Environ. Sci. 2021, 104, 150–168. [Google Scholar]
- Li, B.; Shi, X.F.; Liu, Y.P.; Lu, L.; Wang, G.L.; Thapa, S.; Qi, H. Long-term characteristics of criteria air pollutants in megacities of Harbin-Changchun megalopolis, Northeast China: Spatiotemporal variations, source analysis, and meteorological effects. Environ. Pollut. 2020, 267, 115441. [Google Scholar] [CrossRef]
- Estellés, V.; Campanelli, M.; Utrillas, M.P.; Expósito, F.; Martínez-Lozano, J.A. Comparison of AERONET and SKYRAD4. 2 inversion products retrieved from a Cimel CE318 sunphotometer. Atmos. Meas. Tech. 2012, 5, 569. [Google Scholar] [CrossRef] [Green Version]
- Qixiang, C.; Yuan, Y.; Xing, H.; Zhihong, H.; Heping, T. Assessment of column aerosol optical properties using ground-based sun-photometer at urban Harbin, Northeast China. J. Environ. Sci. 2018, 74, 50–57. [Google Scholar]
- Dubovik, O.; Holben, B.; Eck, T.F.; Smirnov, A.; Kaufman, Y.J.; King, M.D.; Tanré, D.; Slutsker, I. Variability of absorption and optical properties of key aerosol types observed in worldwide locations. J. Atmos. Sci. 2002, 59, 590–608. [Google Scholar] [CrossRef]
- Ricchiazzi, P.; Yang, S.; Gautier, C.; Sowle, D. SBDART: A research and teaching software tool for plane-parallel radiative transfer in the Earth’s atmosphere. Bull. Am. Meteorol. Soc. 1998, 79, 2101–2114. [Google Scholar] [CrossRef] [Green Version]
- Vachaspati, C.V.; Begam, G.R.; Ahammed, Y.N.; Kumar, K.R.; Reddy, R.R. Characterization of aerosol optical properties and model computed radiative forcing over a semi-arid region, Kadapa in India. Atmos. Res. 2018, 209, 36–49. [Google Scholar] [CrossRef]
- Bibi, H.; Alam, K.; Bibi, S. Estimation of shortwave direct aerosol radiative forcing at four locations on the Indo-Gangetic Plains: Model results and ground measurement. Atmos. Environ. 2017, 163, 166–181. [Google Scholar] [CrossRef]
- Shi, H.; Xiao, Z.; Liang, S.; Ma, H. A method for consistent estimation of multiple land surface parameters from MODIS top-of-atmosphere time series data. IEEE Trans. Geosci. Remote Sens. 2017, 55, 5158–5173. [Google Scholar] [CrossRef]
- Fang, H.; Liang, S.; Chen, M.; Walthall, C.; Daughtry, C. Statistical comparison of MISR, ETM+ and MODIS land surface reflectance and albedo products of the BARC land validation core site, USA. Int. J. Remote Sens. 2004, 25, 409–422. [Google Scholar] [CrossRef]
- Markowicz, K.M.; Lisok, J.; Xian, P. Simulation of long-term direct aerosol radiative forcing over the arctic within the framework of the iAREA project. Atmos. Environ. 2021, 244, 117882. [Google Scholar] [CrossRef]
- Kumar, K.R.; Kang, N.; Sivakumar, V.; Griffith, D. Temporal characteristics of columnar aerosol optical properties and radiative forcing (2011–2015) measured at AERONET’s Pretoria_CSIR_DPSS site in South Africa. Atmos. Environ. 2017, 165, 274–289. [Google Scholar] [CrossRef] [Green Version]
- Yu, X.; Zhu, B.; Zhang, M. Seasonal variability of aerosol optical properties over Beijing. Atmos. Environ. 2009, 43, 4095–4101. [Google Scholar] [CrossRef]
- Chen, H.; Gu, X.F.; Cheng, T.H.; Yu, T.; Li, Z.Q. Characteristics of aerosol types over China. J. Remote Sens. 2013, 17, 1559–1571. [Google Scholar]
- Zhao, H.; Che, H.; Zhang, X.; Ma, Y.; Wang, Y.; Wang, H.; Wang, Y. Characteristics of visibility and particulate matter (PM) in an urban area of Northeast China. Atmos. Pollut. Res. 2013, 4, 427–434. [Google Scholar] [CrossRef] [Green Version]
- Kim, D.; Ramanathan, V. Solar radiation budget and radiative forcing due to aerosols and clouds. J. Geophys. Res. Atmos. 2008, 113, D2. [Google Scholar] [CrossRef] [Green Version]
- Yu, H.; Kaufman, Y.J.; Chin, M.; Feingold, G.; Remer, L.A.; Anderson, T.L.; DeCola, P. A review of measurement-based assessments of the aerosol direct radiative effect and forcing. Atmos. Chem. Phys. 2006, 6, 613–666. [Google Scholar] [CrossRef] [Green Version]
- Zhao, H.; Che, H.; Ma, Y.; Xia, X.; Wang, Y.; Wang, P.; Wu, X. Temporal variability of the visibility, particulate matter mass concentration and aerosol optical properties over an urban site in Northeast China. Atmos. Res. 2015, 166, 204–212. [Google Scholar] [CrossRef]
- Yu, X.; Cheng, T.; Chen, J.; Liu, Y. A comparison of dust properties between China continent and Korea, Japan in East Asia. Atmos. Environ. 2006, 40, 5787–5797. [Google Scholar] [CrossRef]
- Liu, J.; Zheng, Y.; Li, Z.; Flynn, C.; Cribb, M. Seasonal variations of aerosol optical properties, vertical distribution and associated radiative effects in the Yangtze Delta region of China. J. Geophys. Res. Atmos. 2012, 117, D16. [Google Scholar] [CrossRef]
- Gong, C.; Xin, J.; Wang, S.; Wang, Y.; Zhang, T. Anthropogenic aerosol optical and radiative properties in the typical urban/suburban regions in China. Atmos. Res. 2017, 197, 177–187. [Google Scholar] [CrossRef]
- Kang, N.; Kumar, K.R.; Yu, X.; Yin, Y. Column-integrated aerosol optical properties and direct radiative forcing over the urban-industrial megacity Nanjing in the Yangtze River Delta, China. Environ. Sci. Pollut. Res. 2016, 23, 17532–17552. [Google Scholar] [CrossRef] [PubMed]
- Qin, K.; Wang, L.; Xu, J.; Letu, H.; Zhang, K.; Li, D.; Zhou, J.; Fan, W. Haze optical properties from long-term ground-based remote sensing over Beijing and Xuzhou, China. Remote Sens. 2018, 10, 518. [Google Scholar] [CrossRef] [Green Version]
- Pace, G.; Sarra, A.D.; Meloni, D.; Piacentino, S.; Chamard, P. Aerosol optical properties at Lampedusa (Central Mediterranean). 1. Influence of transport and identification of different aerosol types. Atmos. Chem. Phys. 2006, 6, 697–713. [Google Scholar] [CrossRef] [Green Version]
- Kaskaoutis, D.G.; Badarinath, K.V.S.; Kumar Kharol, S.; Rani Sharma, A.; Kambezidis, H.D. Variations in the aerosol optical properties and types over the tropical urban site of Hyderabad, India. J. Geophys. Res. Atmos. 2009, 114, D22. [Google Scholar] [CrossRef]
- Kumar, K.R.; Sivakumar, V.; Reddy, R.R.; Gopal, K.R.; Adesina, A.J. Identification and classification of different aerosol types over a subtropical rural site in Mpumalanga, South Africa: Seasonal variations as retrieved from the AERONET Sunphotometer. Aerosol. Air Qual. Res. 2014, 14, 108–123. [Google Scholar] [CrossRef] [Green Version]
- Yuan, Y.; Shuai, Y.; Li, X.W.; Liu, B.; Tan, H.P. Using a new aerosol relative optical thickness concept to identify aerosol particle species. Atmos. Res. 2014, 150, 1–11. [Google Scholar] [CrossRef]
- Tian, P.; Zhang, L.; Cao, X.; Sun, N.; Mo, X.; Liang, J.; Wang, H. Enhanced bottom-of-the-atmosphere cooling and atmosphere heating efficiency by mixed-type aerosols: A classification based on aerosol nonsphericity. J. Atmos. Sci. 2018, 75, 113–124. [Google Scholar] [CrossRef]
- Gharibzadeh, M.; Alam, K.; Abedini, Y.; Bidokhti, A.A.; Masoumi, A. Monthly and seasonal variations of aerosol optical properties and direct radiative forcing over Zanjan, Iran. J. Atmos. Solar Terr. Phys. 2017, 164, 268–275. [Google Scholar] [CrossRef]
Figure 1.
The research framework of aerosol optical properties and radiative effects over Harbin.

Figure 2.
Daily variations in the aerosol optical depth at 500 nm and Angstrom exponent at 440–870 nm during the study period.
Figure 2.
Daily variations in the aerosol optical depth at 500 nm and Angstrom exponent at 440–870 nm during the study period.

Figure 3.
Monthly variations in ARF at the top-of-atmosphere (TOA), surface (SFC), and within the atmosphere (ATM) in Harbin.
Figure 3.
Monthly variations in ARF at the top-of-atmosphere (TOA), surface (SFC), and within the atmosphere (ATM) in Harbin.

Figure 4.
(a) The scatter plot of the daily mean and as well as the total percentage of aerosol types during the year, (b) the percentage of various aerosol types during different seasons.
Figure 4.
(a) The scatter plot of the daily mean and as well as the total percentage of aerosol types during the year, (b) the percentage of various aerosol types during different seasons.

Figure 5.
The mean values of ARF at the TOA, the SFC, and within the ATM in different seasons.


Table 1.
Seasonal variations in aerosol optical depth at 500 nm and Angstrom exponents at 440–870 nm during the study period.
Table 1.
Seasonal variations in aerosol optical depth at 500 nm and Angstrom exponents at 440–870 nm during the study period.
| Spring | Summer | Autumn | Winter | Total | |
|---|---|---|---|---|---|
Table 2.
Comparison of AOD500 and AE440–870 measurement results at Harbin and nearby AERONET sites.
| Sites | Dalanzadgad (43.58° N, 104.412° E) | Ussuriysk (43.70° N, 132.16° E) | Present Study (126.63° E, 45.75° N) |
|---|---|---|---|
| Daily average value of AOD500 | 0.03–0.60 | 0.05–3.14 | 0.07–1.29 |
| Daily average value of AE440–870 | 0.10–1.71 | 0.20–2.04 | 0.37–1.97 |
| AOD500 for more than half of the days | <0.08 | <0.17 | <0.2 |
| AE440–870 more than one-third of days | >1.10 | >1.60 | >1.5 |
| AOD500 in spring | 0.03–0.60 | 0.05–3.14 | 0.3 ± 0.25 |
| AOD500 in Summer | 0.04–0.39 | 0.05–1.37 | 0.24 ± 0.14 |
| AOD500 in autumn | 0.03–0.24 | 0.06–0.61 | 0.20 ± 0.21 |
| AOD500 in winter | 0.04–0.38 | 0.46 | 0.27 ± 0.18 |
| AE440–870 in spring | 0.39–1.41 | 0.55–1.96 | 1.30 ± 0.36 |
| AE440–870 in Summer | 0.36–1.69 | 0.20–2.04 | 1.47 ± 0.18 |
| AE440–870 in autumn | 0.10–1.71 | 0.98–1.96 | 1.29 ± 0.25 |
| AE440–870 in winter | 0.27–1.56 | 0.93 | 1.39 ± 0.22 |
Table 3.
The ARF in this paper and other previous studies in different regions of China.
| Station | Study Period | TOA | SFC | ATM | Reference |
|---|---|---|---|---|---|
| Harbin | 01/2017–12/2017 | Present study | |||
| Harbin | 09/2016–04/2017 | Mao et al., 2018 | |||
| Anshan | 2009–2013 | — | Che et al., 2015 | ||
| Fushun | 2009–2013 | — | Che et al., 2015 | ||
| Tongyu | 03/2010–04/2014 | — | Wu et al., 2015 | ||
| Taihu | 06/2008–05/2009 | Liu et al., 2012 | |||
| Lanzhou | 2004–2007 | Gong et al., 2017 | |||
| Nanjing | 09/2007–08/2008 | Kang et al., 2016 | |||
| Beijing | 01/2013–12/2016 | Qin et al., 2018 |
Publisher’s Note: MDPI stays neutral with regard to jurisdictional claims in published maps and institutional affiliations. |
© 2021 by the authors. Licensee MDPI, Basel, Switzerland. This article is an open access article distributed under the terms and conditions of the Creative Commons Attribution (CC BY) license (https://creativecommons.org/licenses/by/4.0/).
Share and Cite
MDPI and ACS Style
Liu, J.; Shen, W.; Yuan, Y.; Dong, S. Optical Characteristics and Radiative Properties of Aerosols in Harbin, Heilongjiang Province during 2017. Atmosphere 2021, 12, 463. https://0-doi-org.brum.beds.ac.uk/10.3390/atmos12040463
AMA Style
Liu J, Shen W, Yuan Y, Dong S. Optical Characteristics and Radiative Properties of Aerosols in Harbin, Heilongjiang Province during 2017. Atmosphere. 2021; 12(4):463. https://0-doi-org.brum.beds.ac.uk/10.3390/atmos12040463
Chicago/Turabian StyleLiu, Jiemei, Wenxiang Shen, Yuan Yuan, and Shikui Dong. 2021. "Optical Characteristics and Radiative Properties of Aerosols in Harbin, Heilongjiang Province during 2017" Atmosphere 12, no. 4: 463. https://0-doi-org.brum.beds.ac.uk/10.3390/atmos12040463
Note that from the first issue of 2016, this journal uses article numbers instead of page numbers. See further details here.