
Relationship between Near-Surface Winds Due to Tropical Cyclones and Infrared Brightness Temperature Obtained from Geostationary Satellite


Abstract
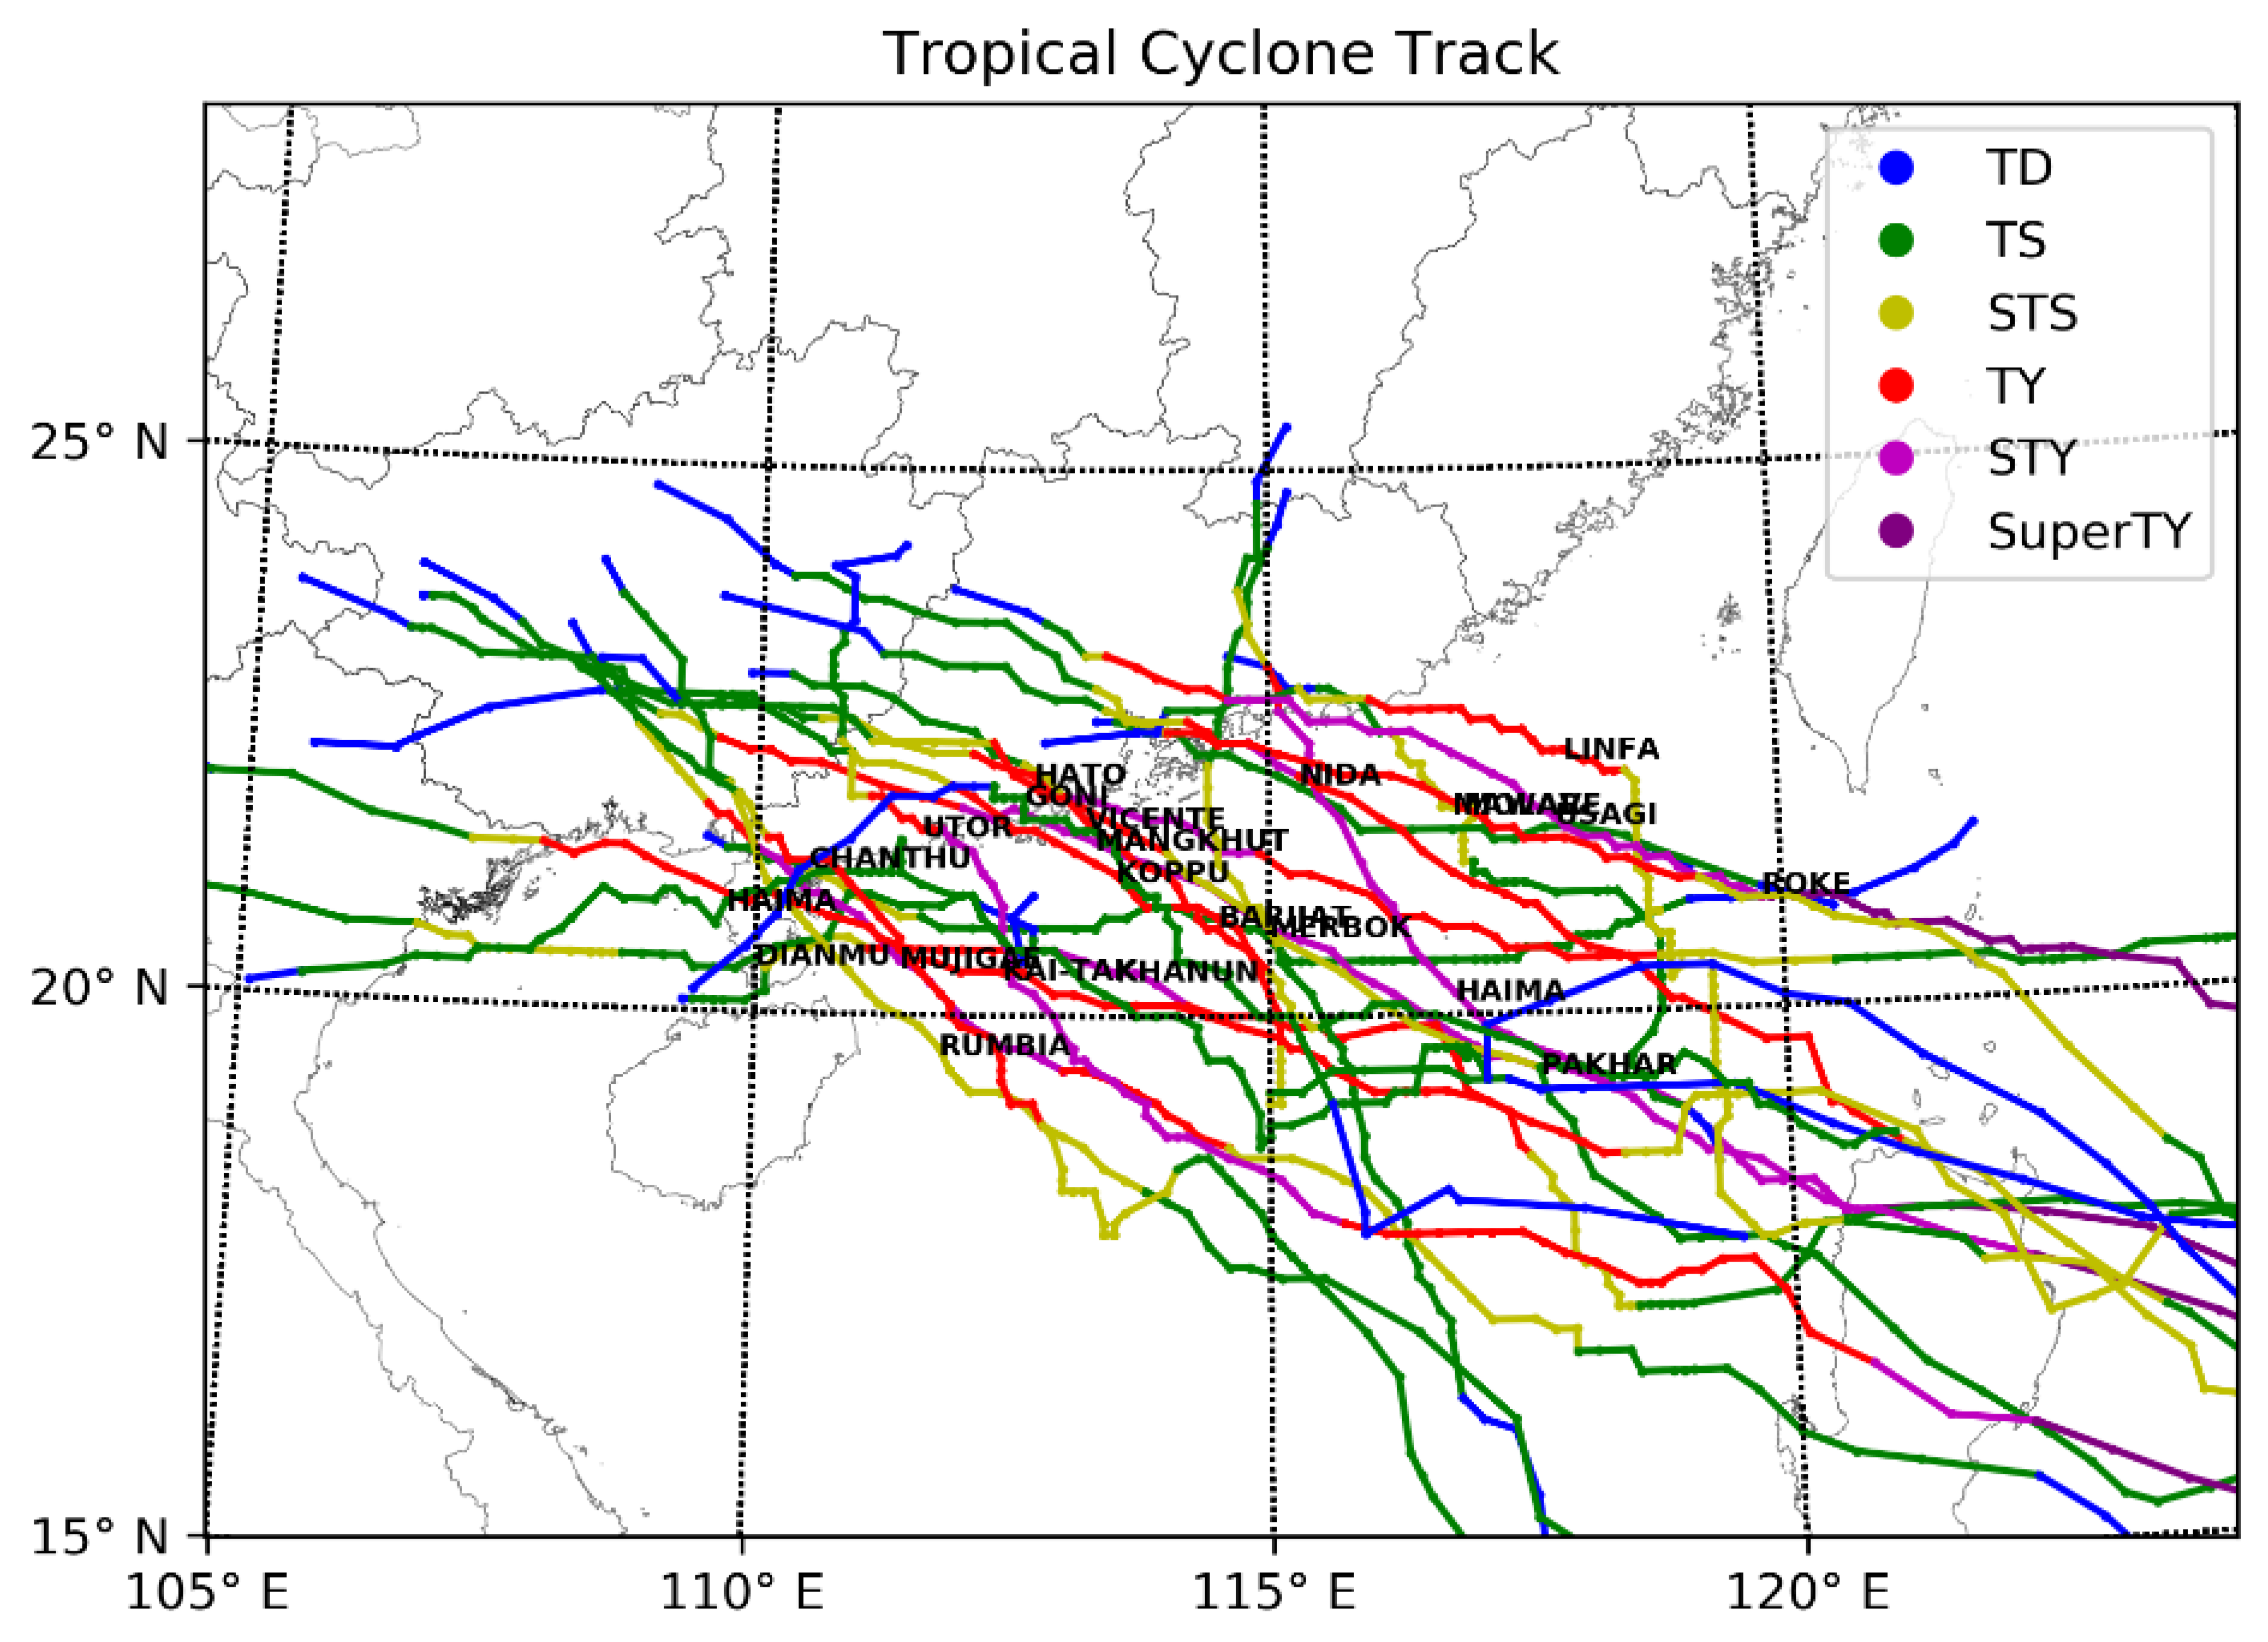
:1. Introduction
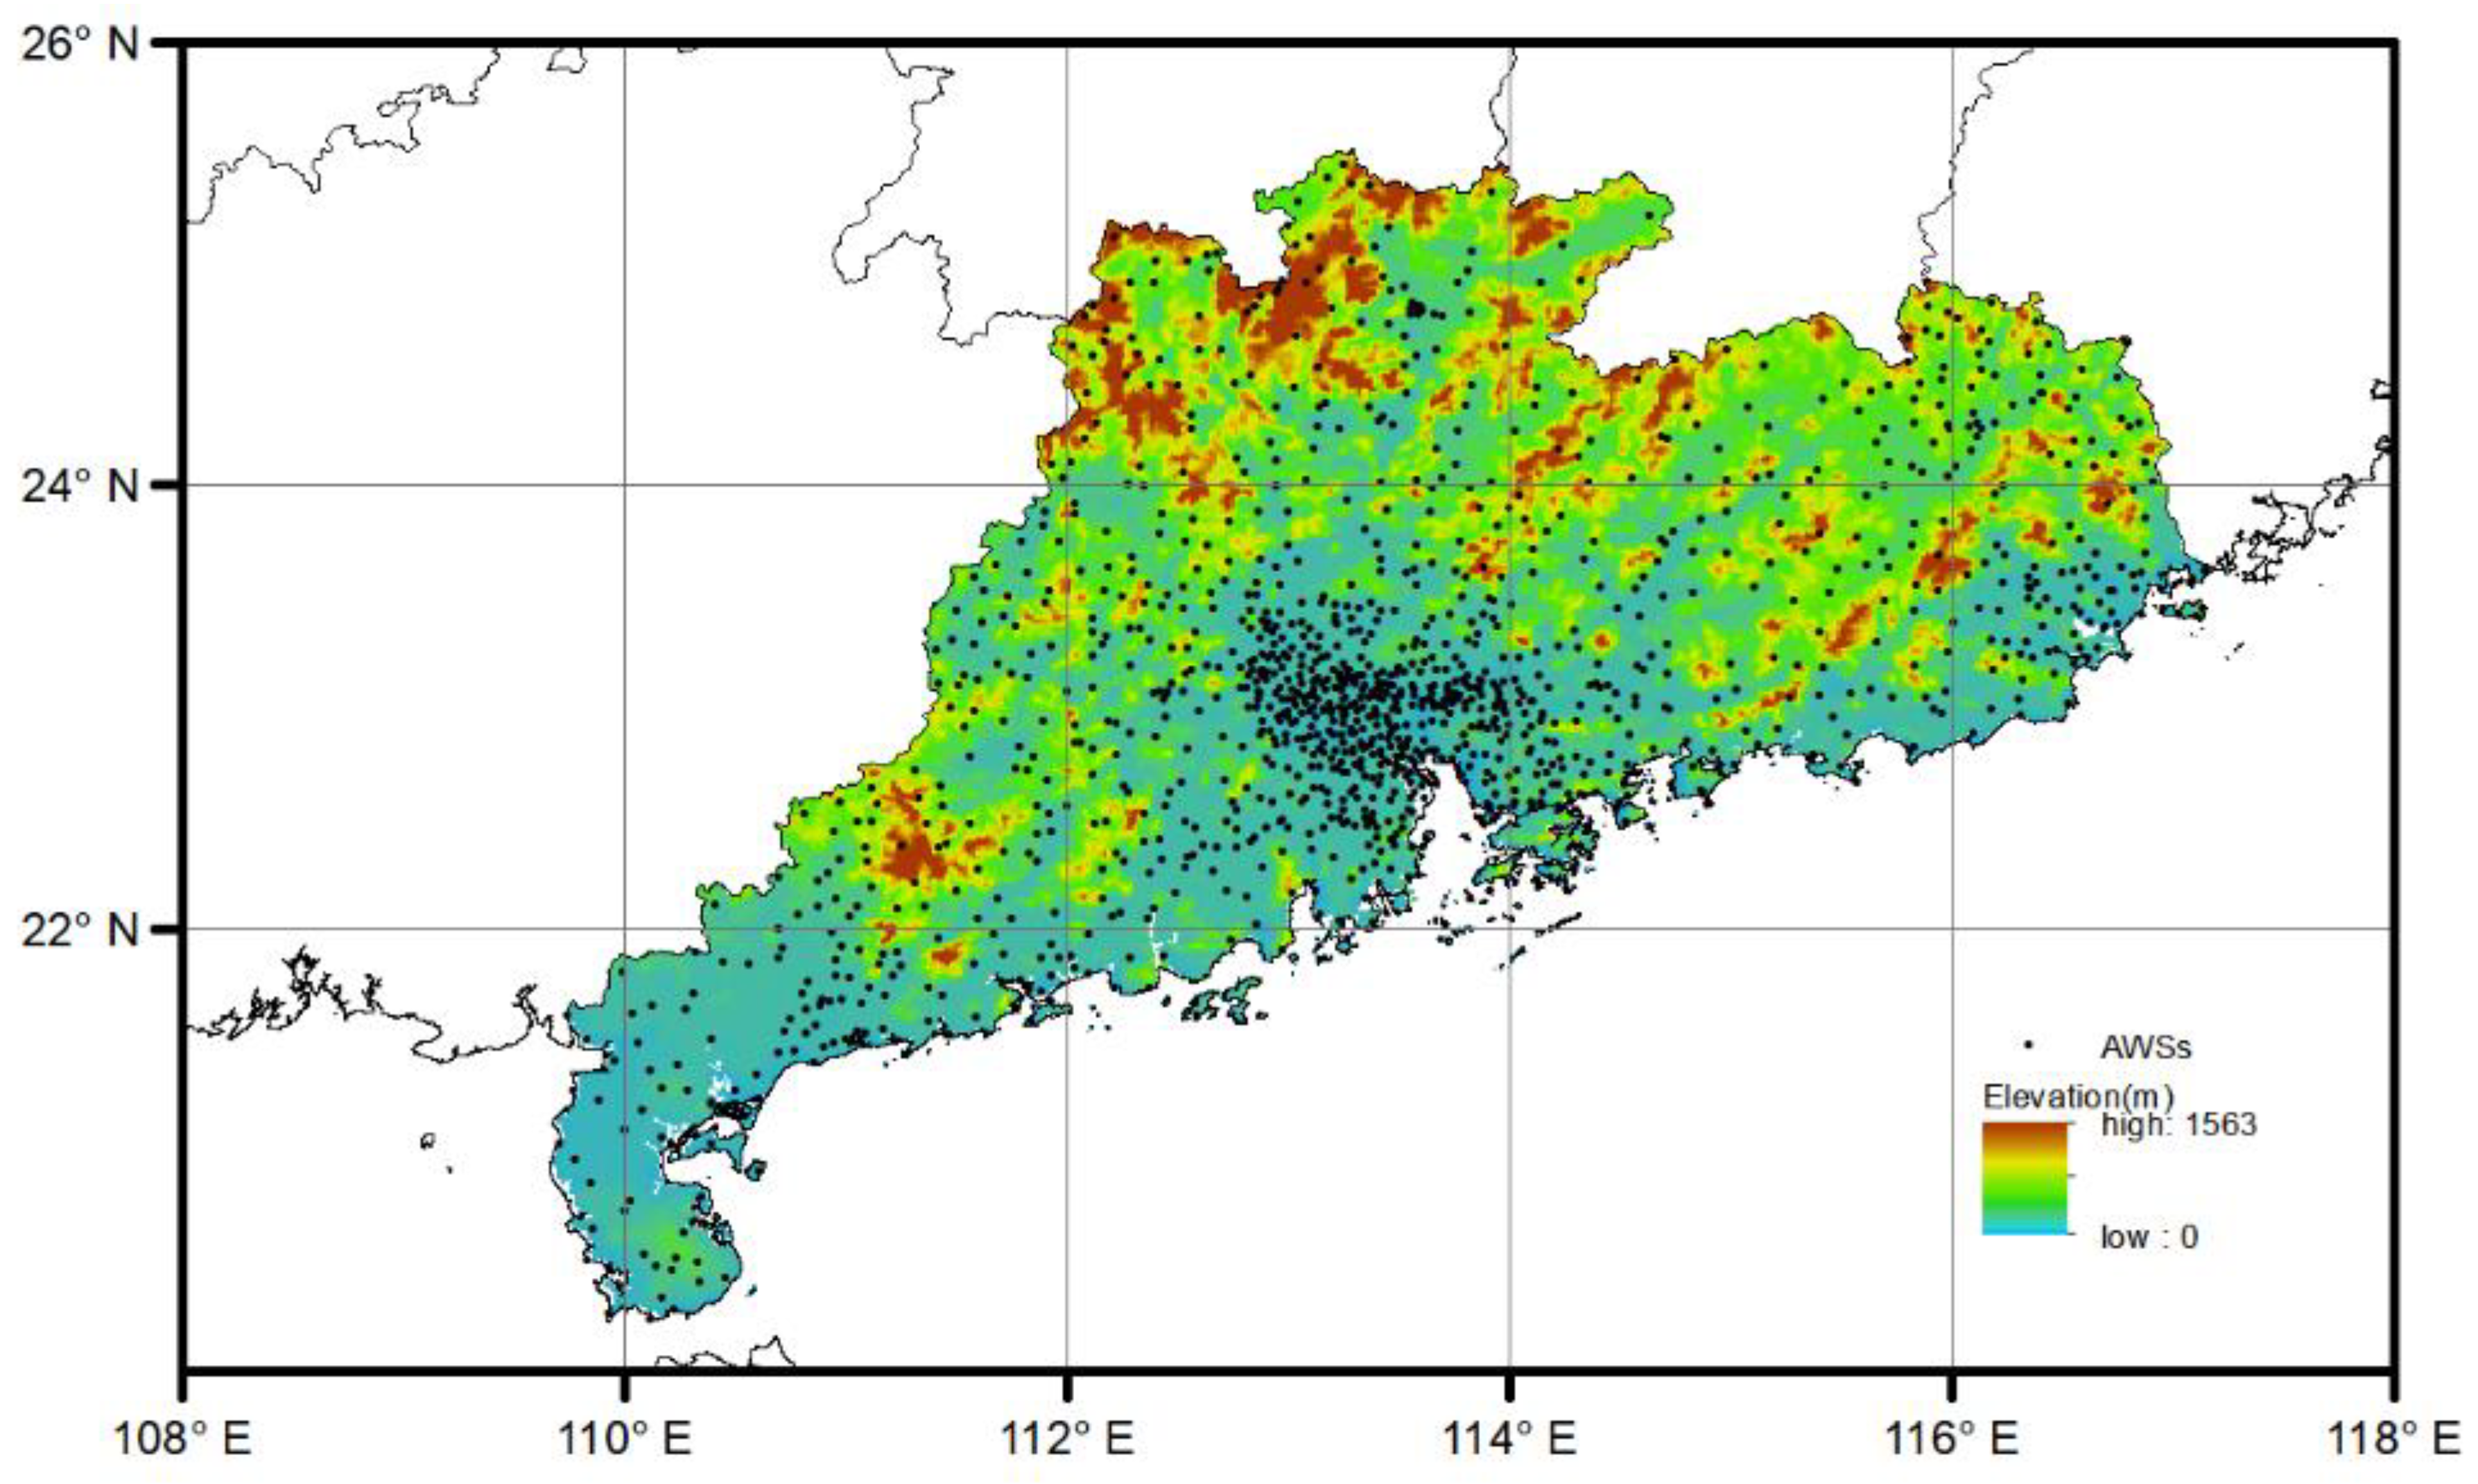
2. Data
3. Methods
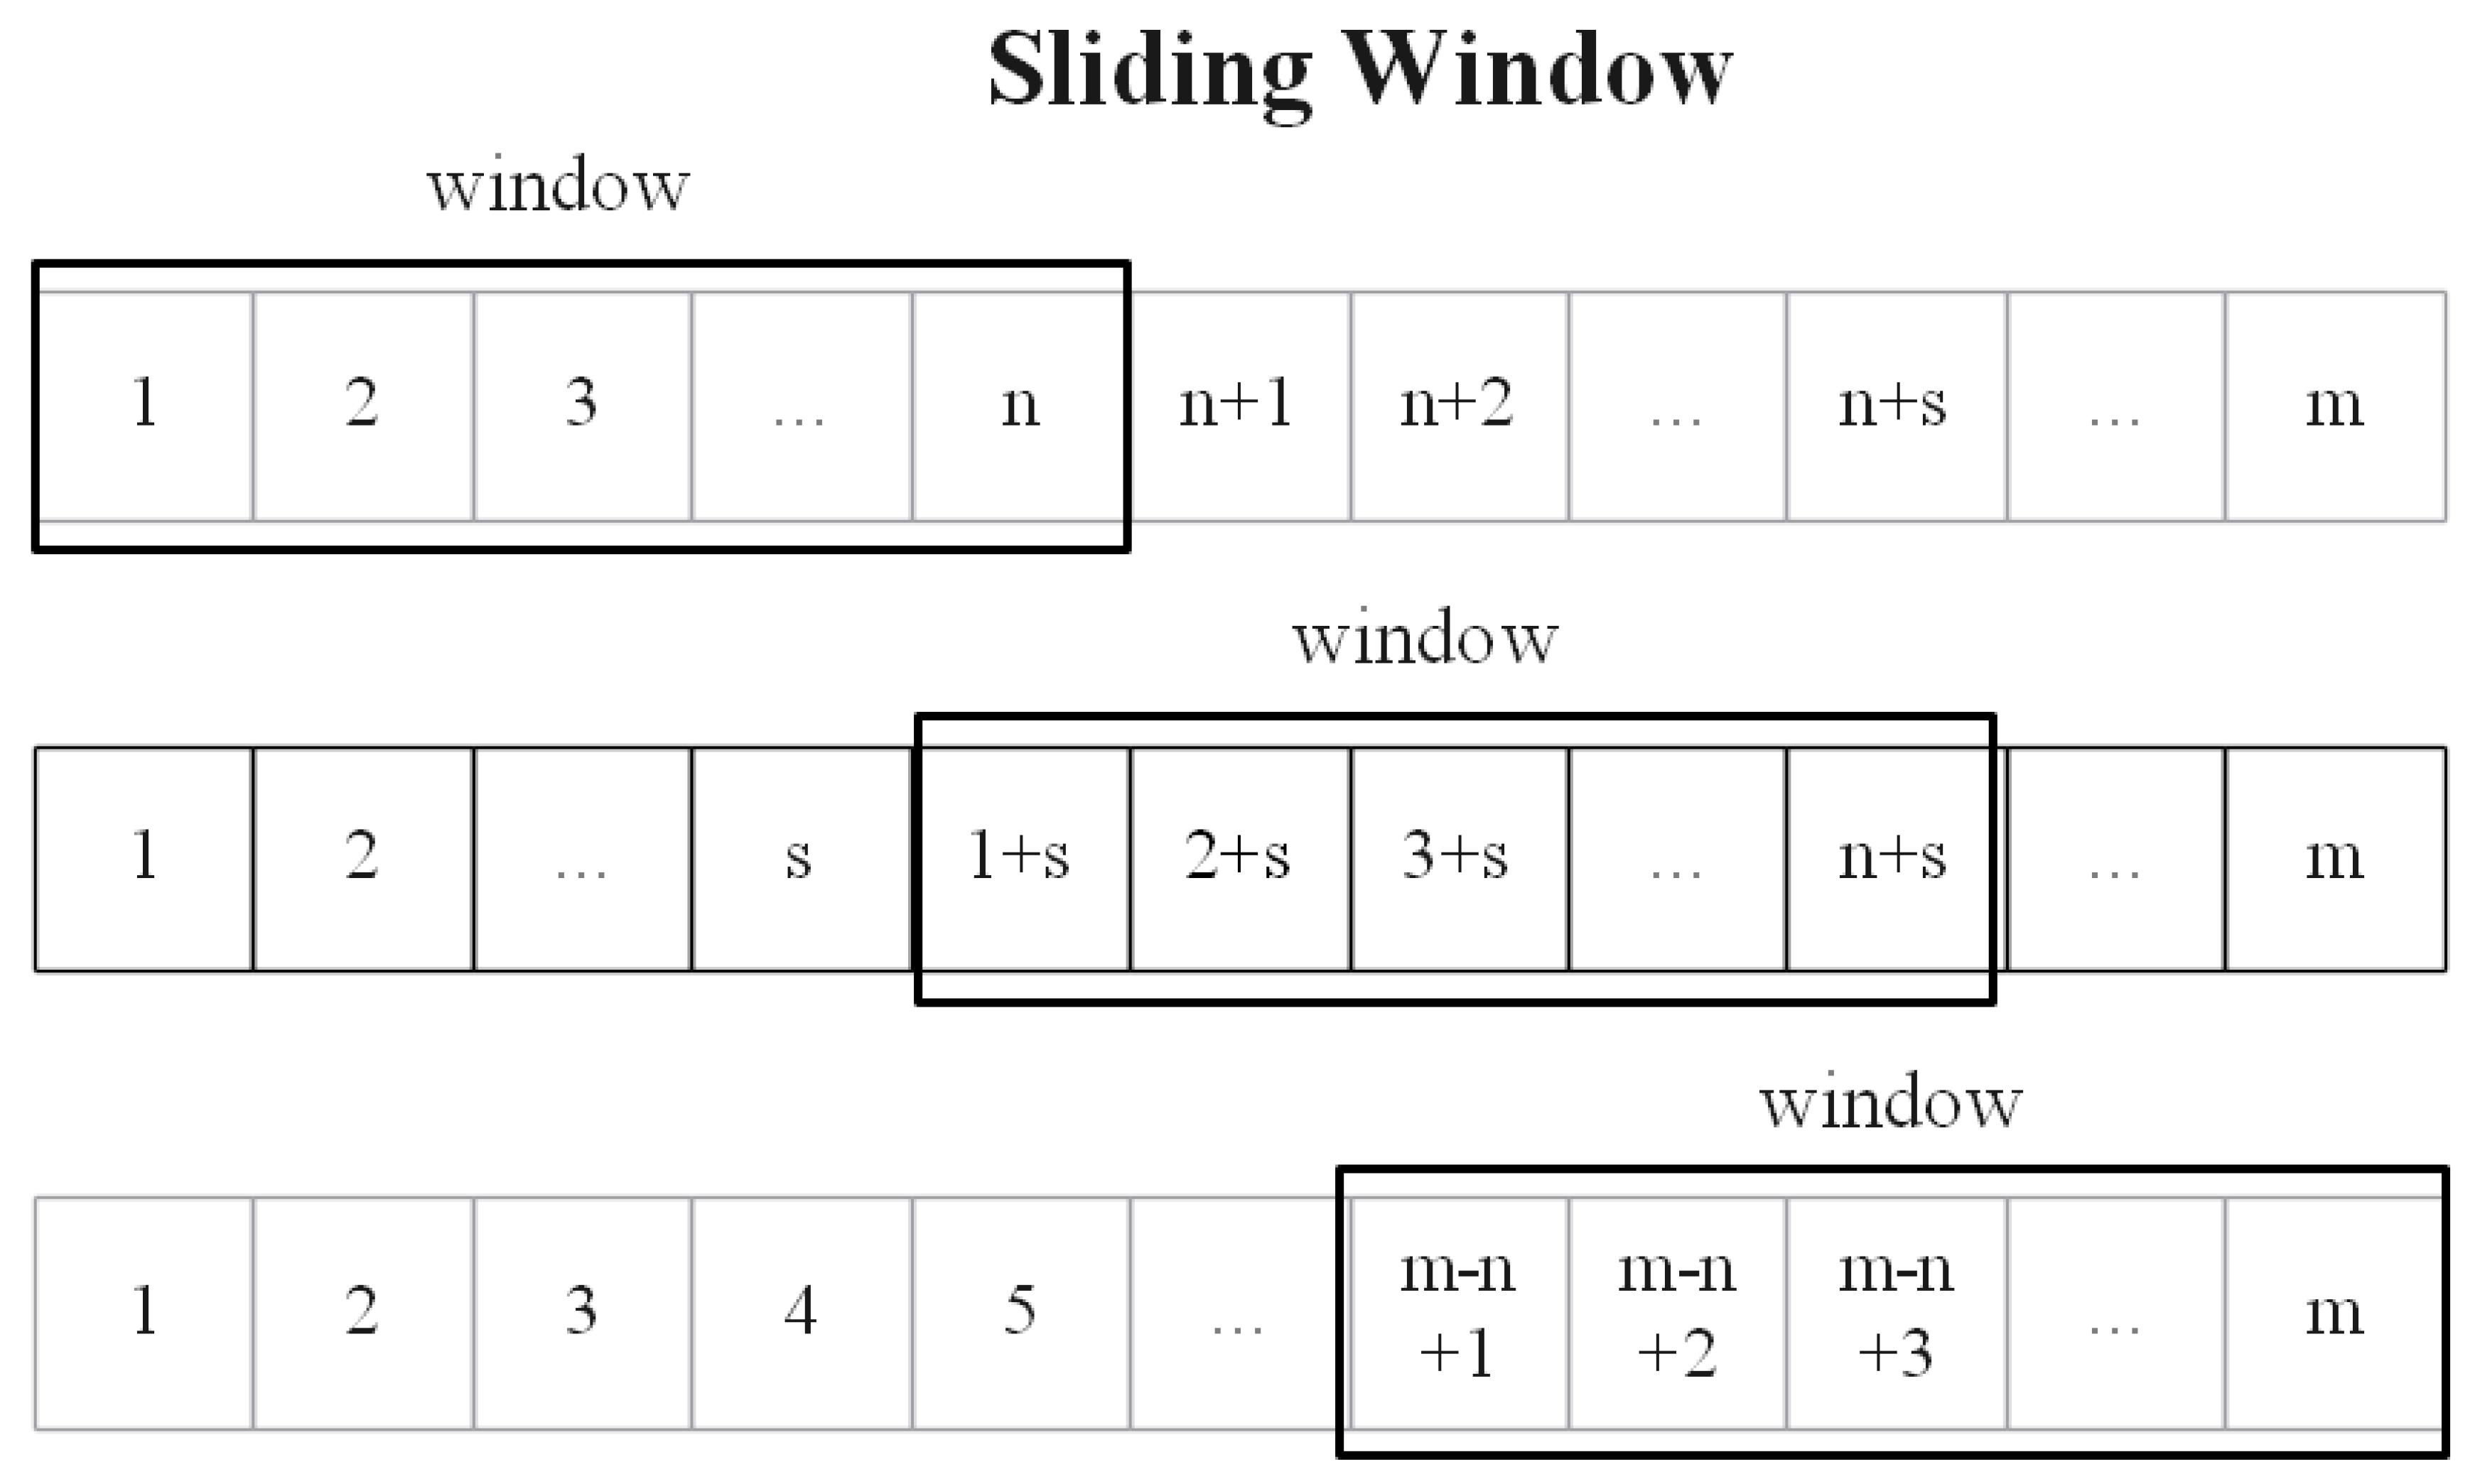
3.1. Sliding Window
3.2. Correlation Analysis
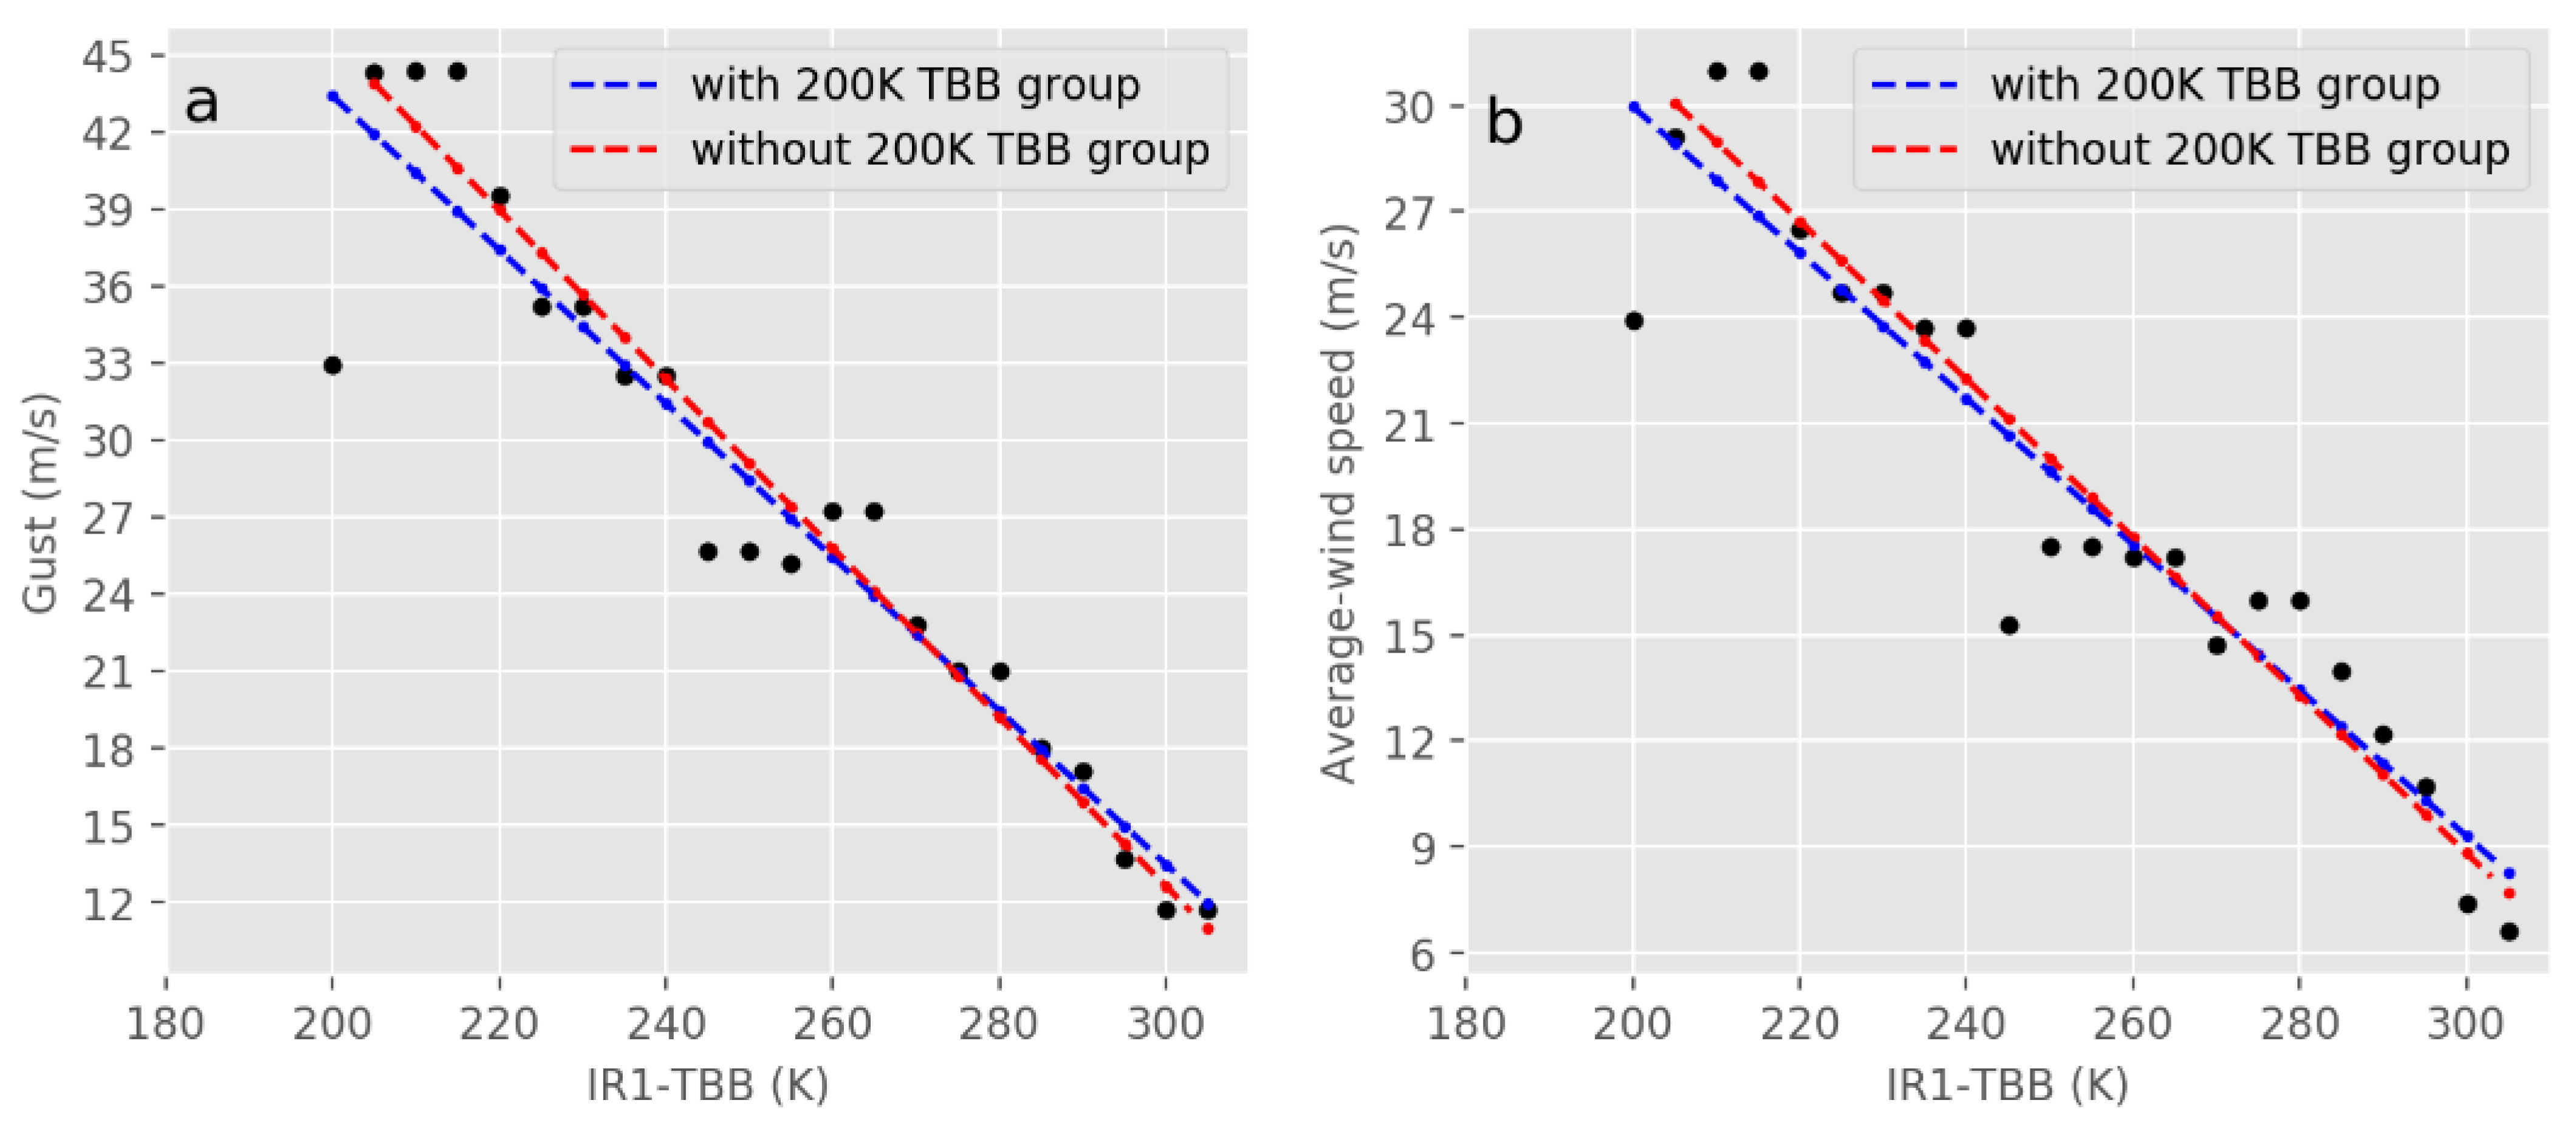
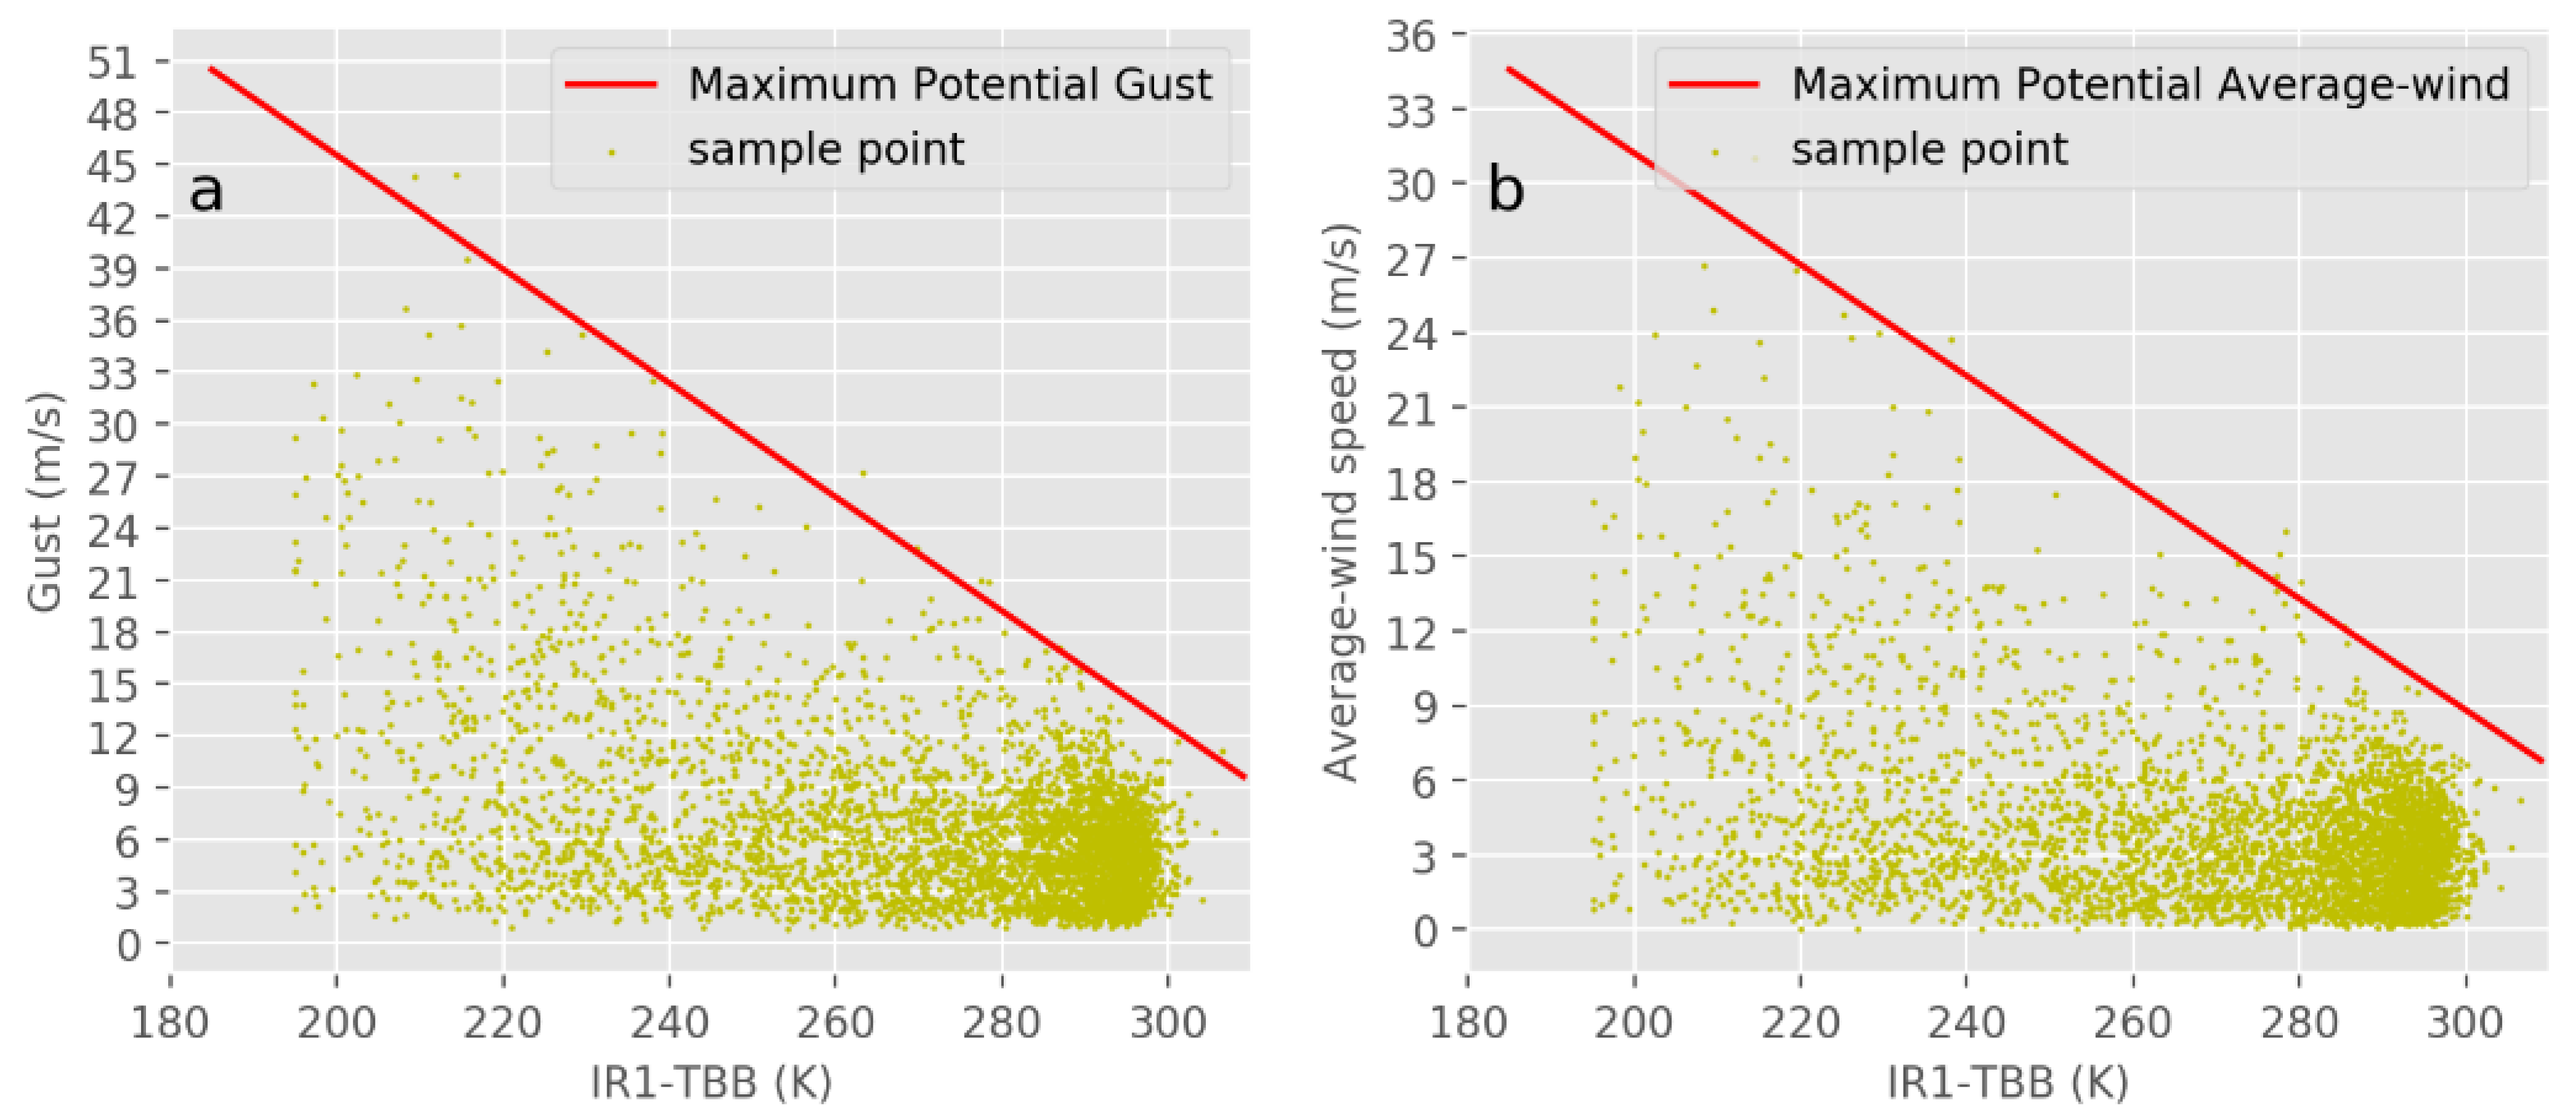
3.3. Least Square Fitting
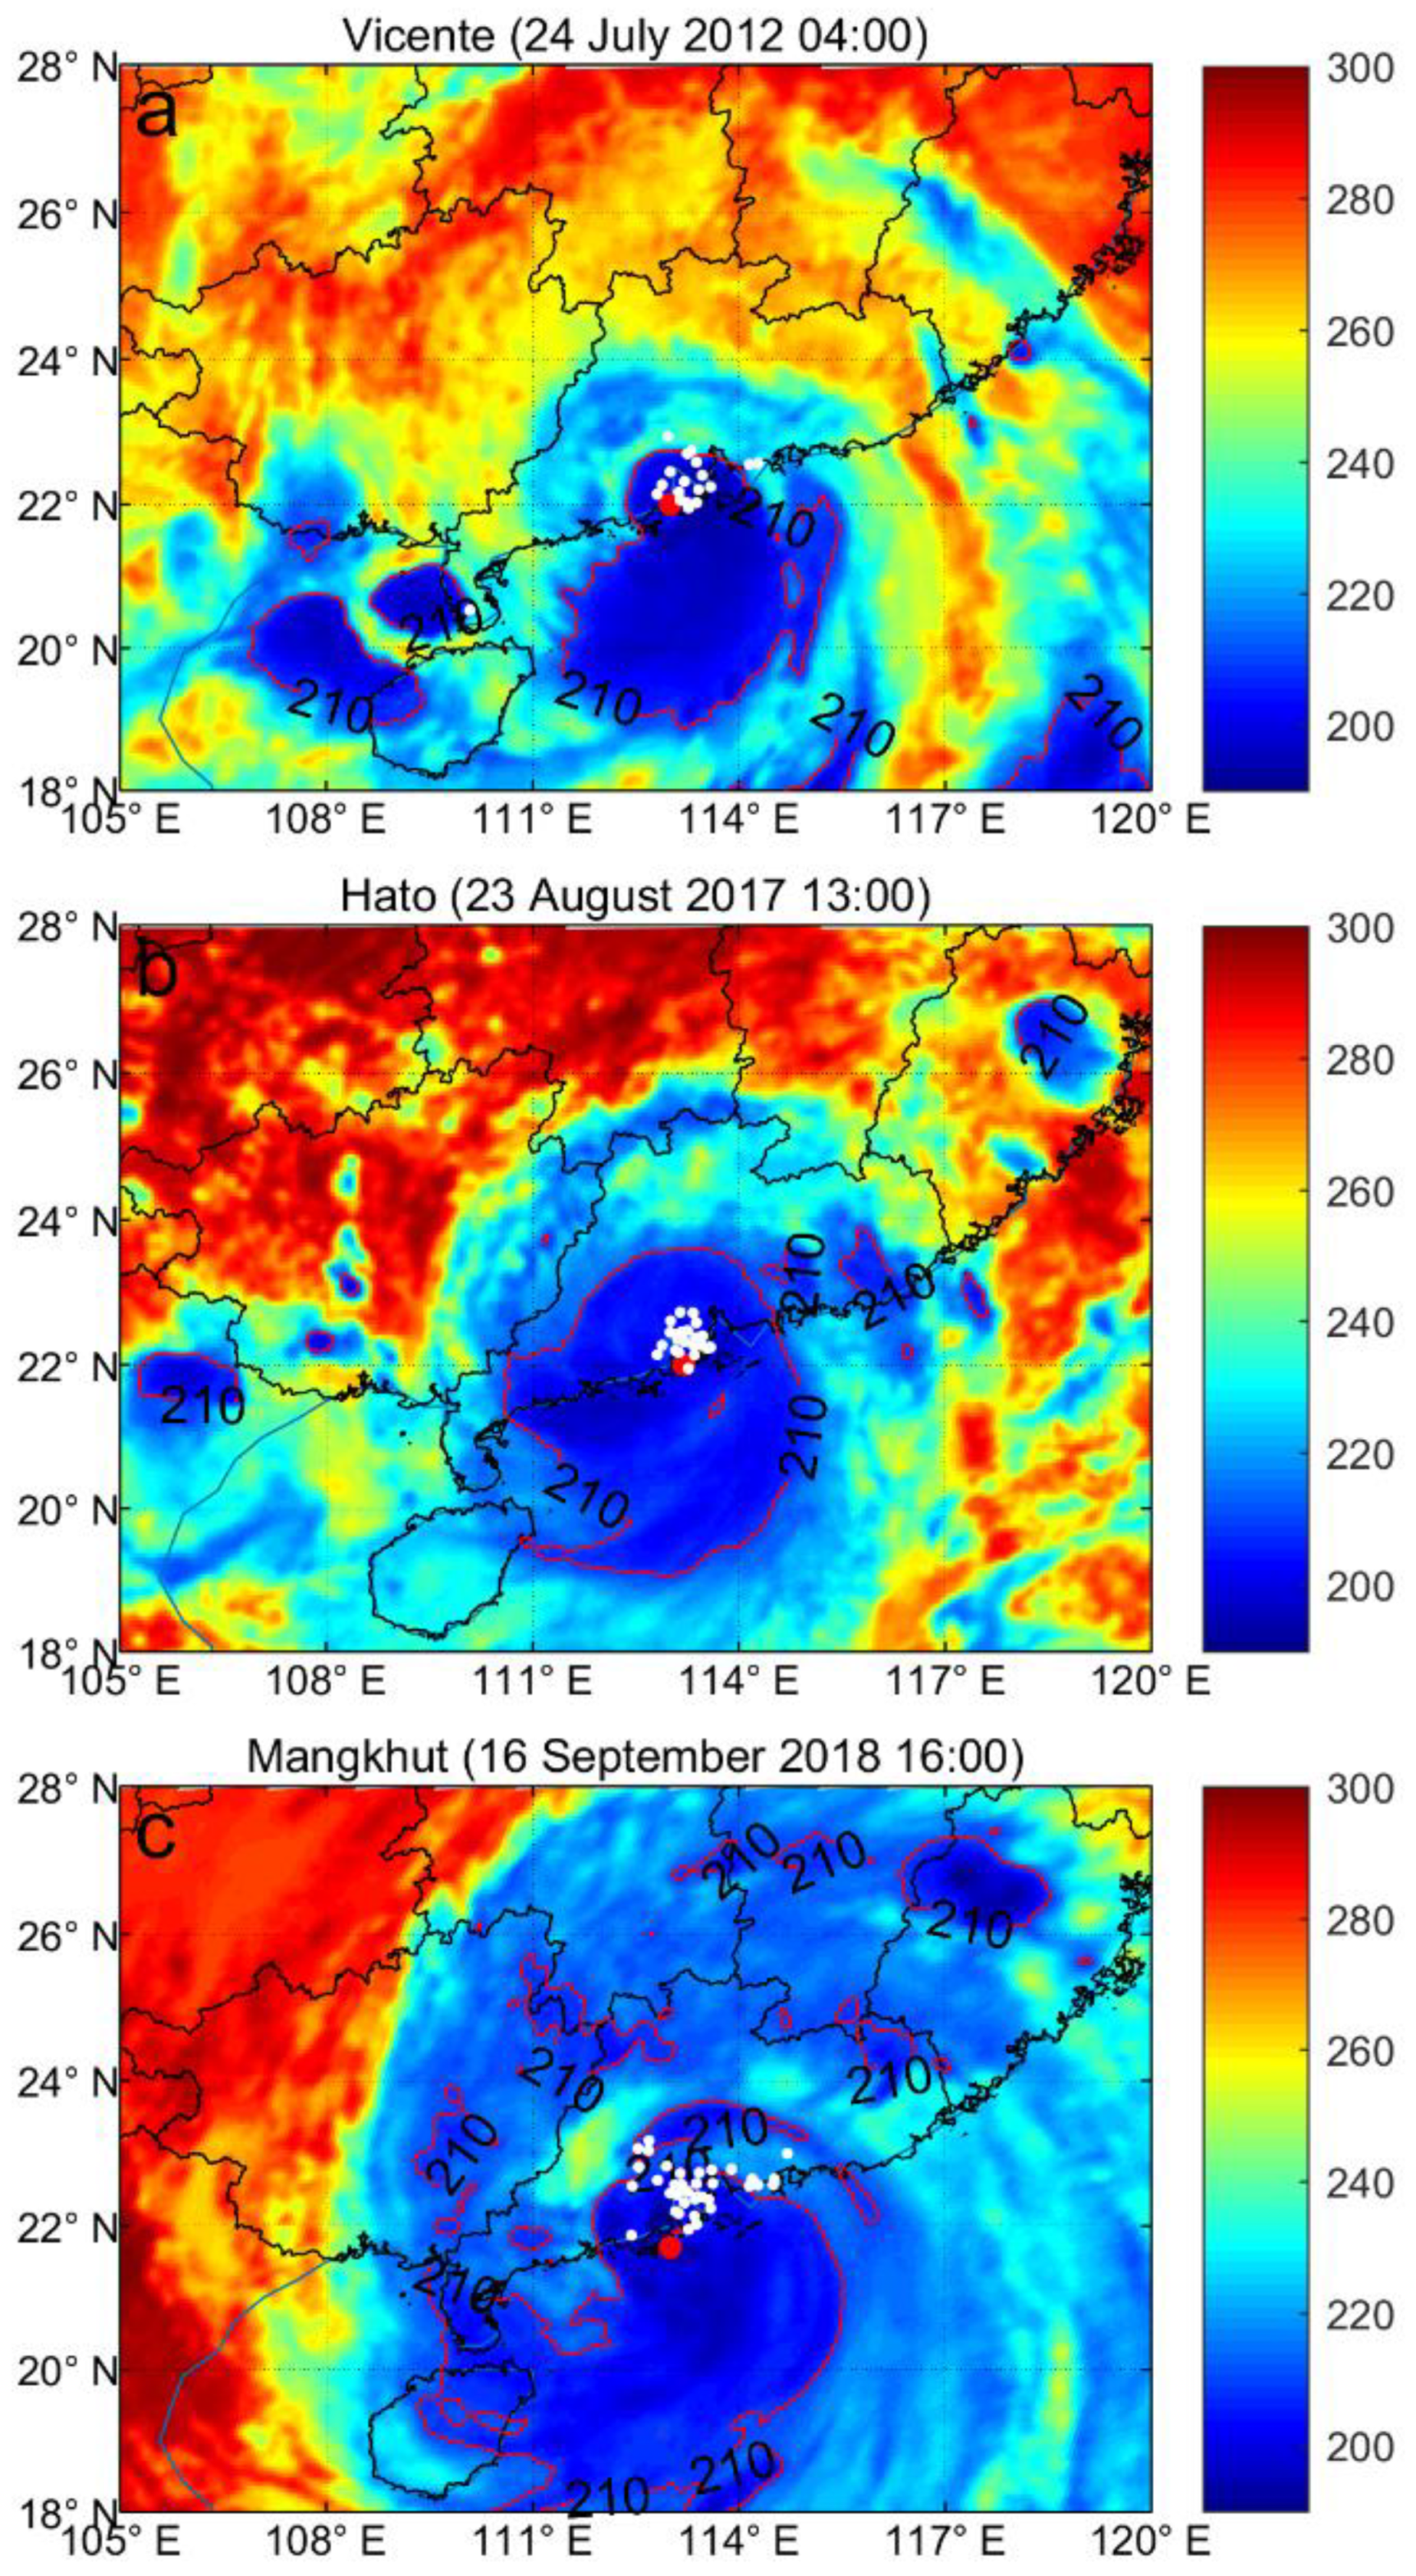
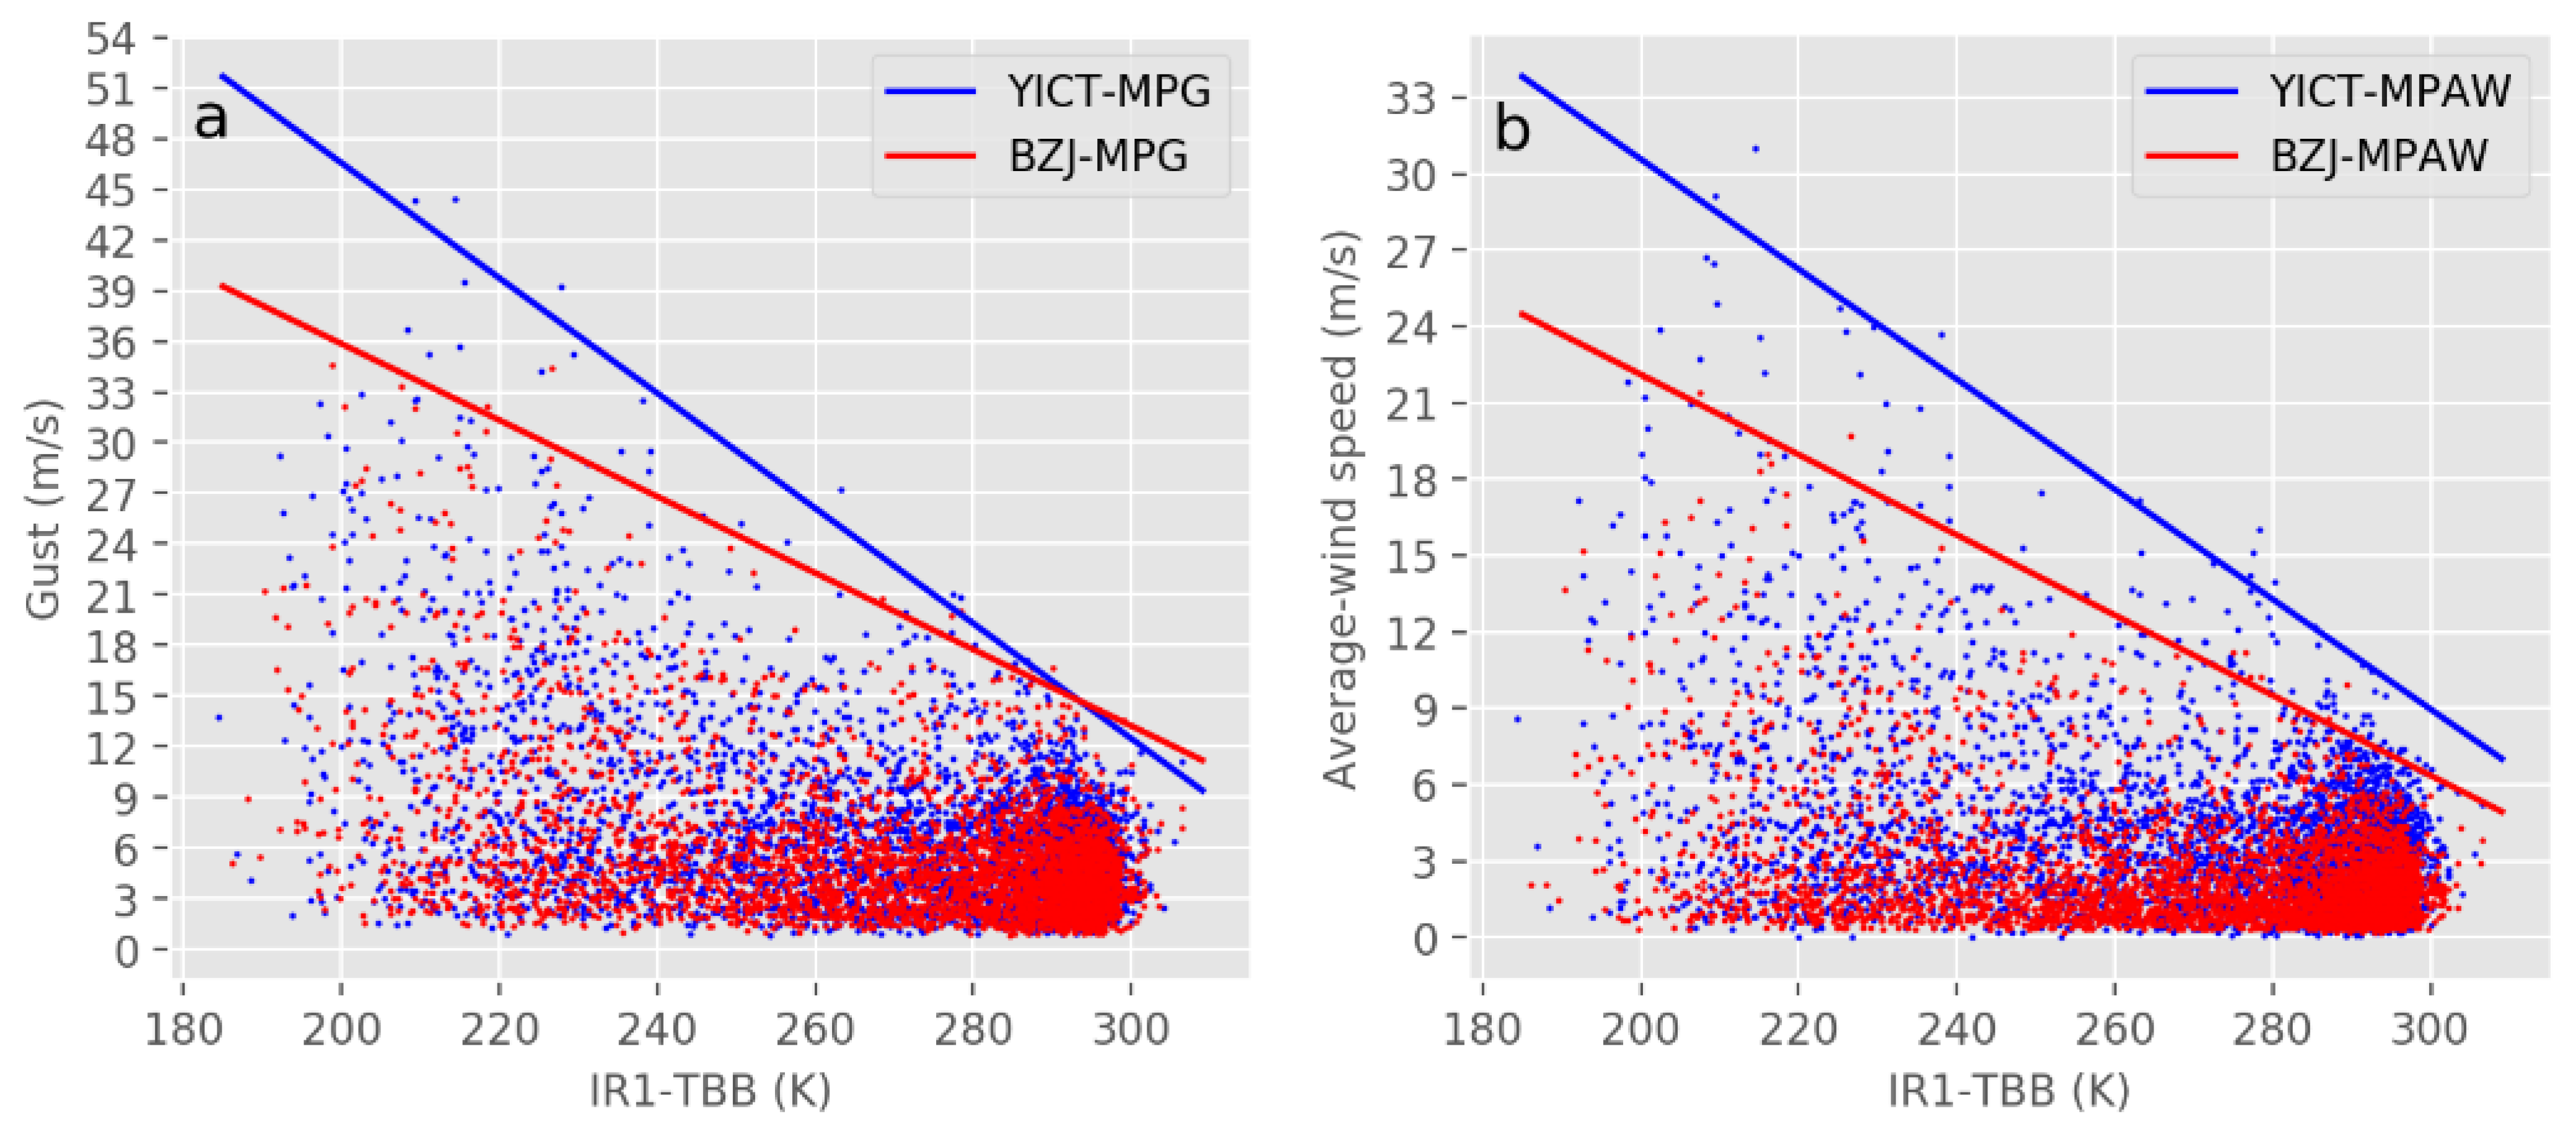
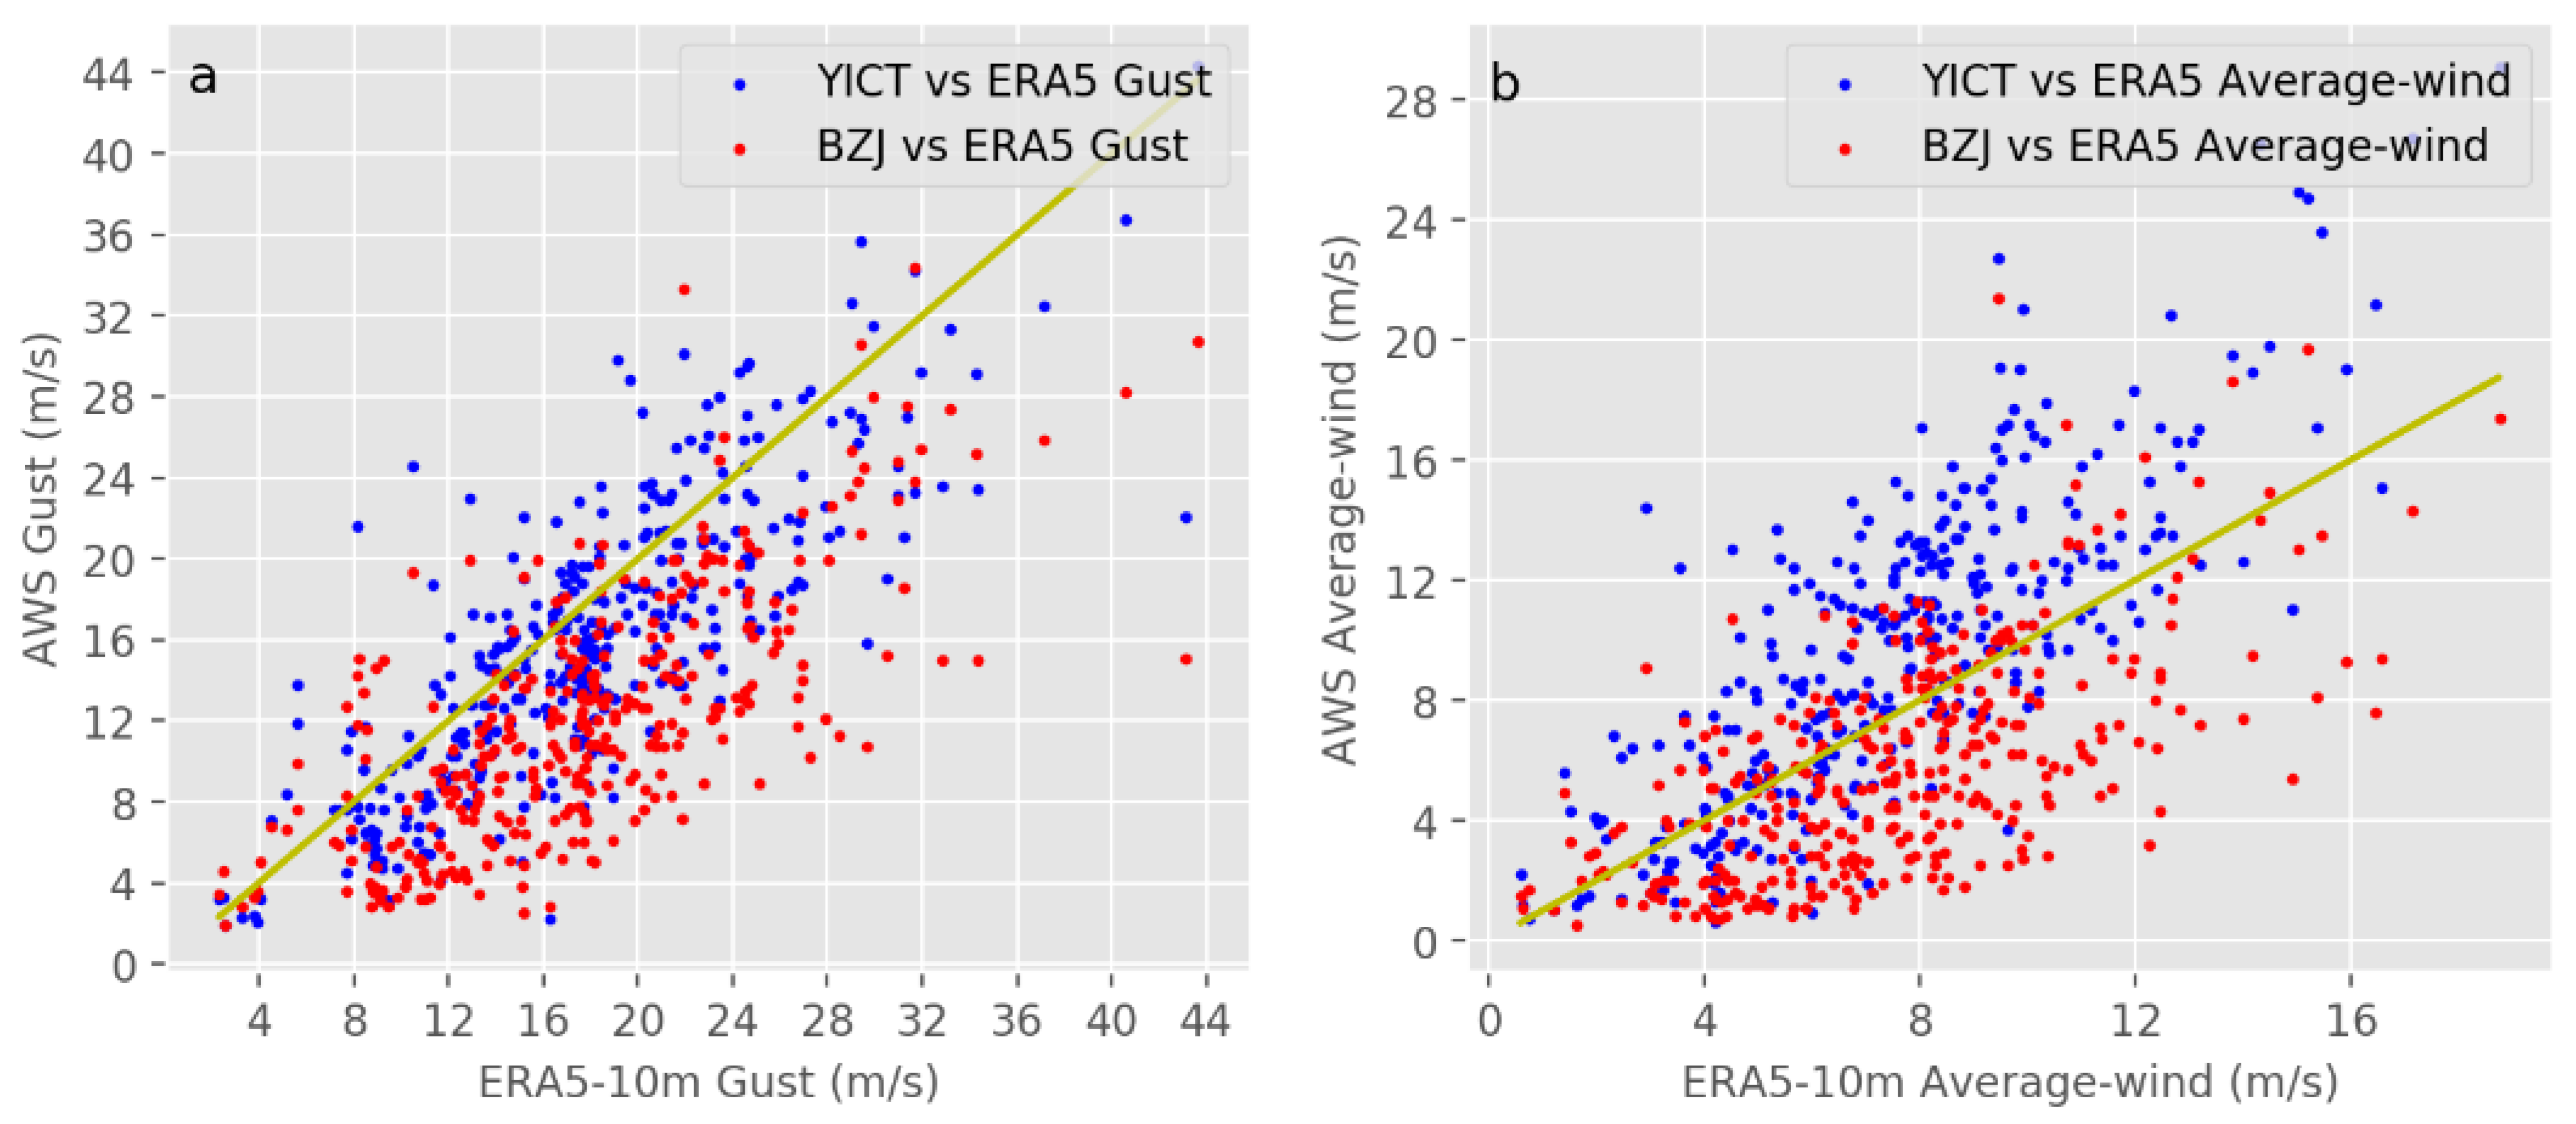
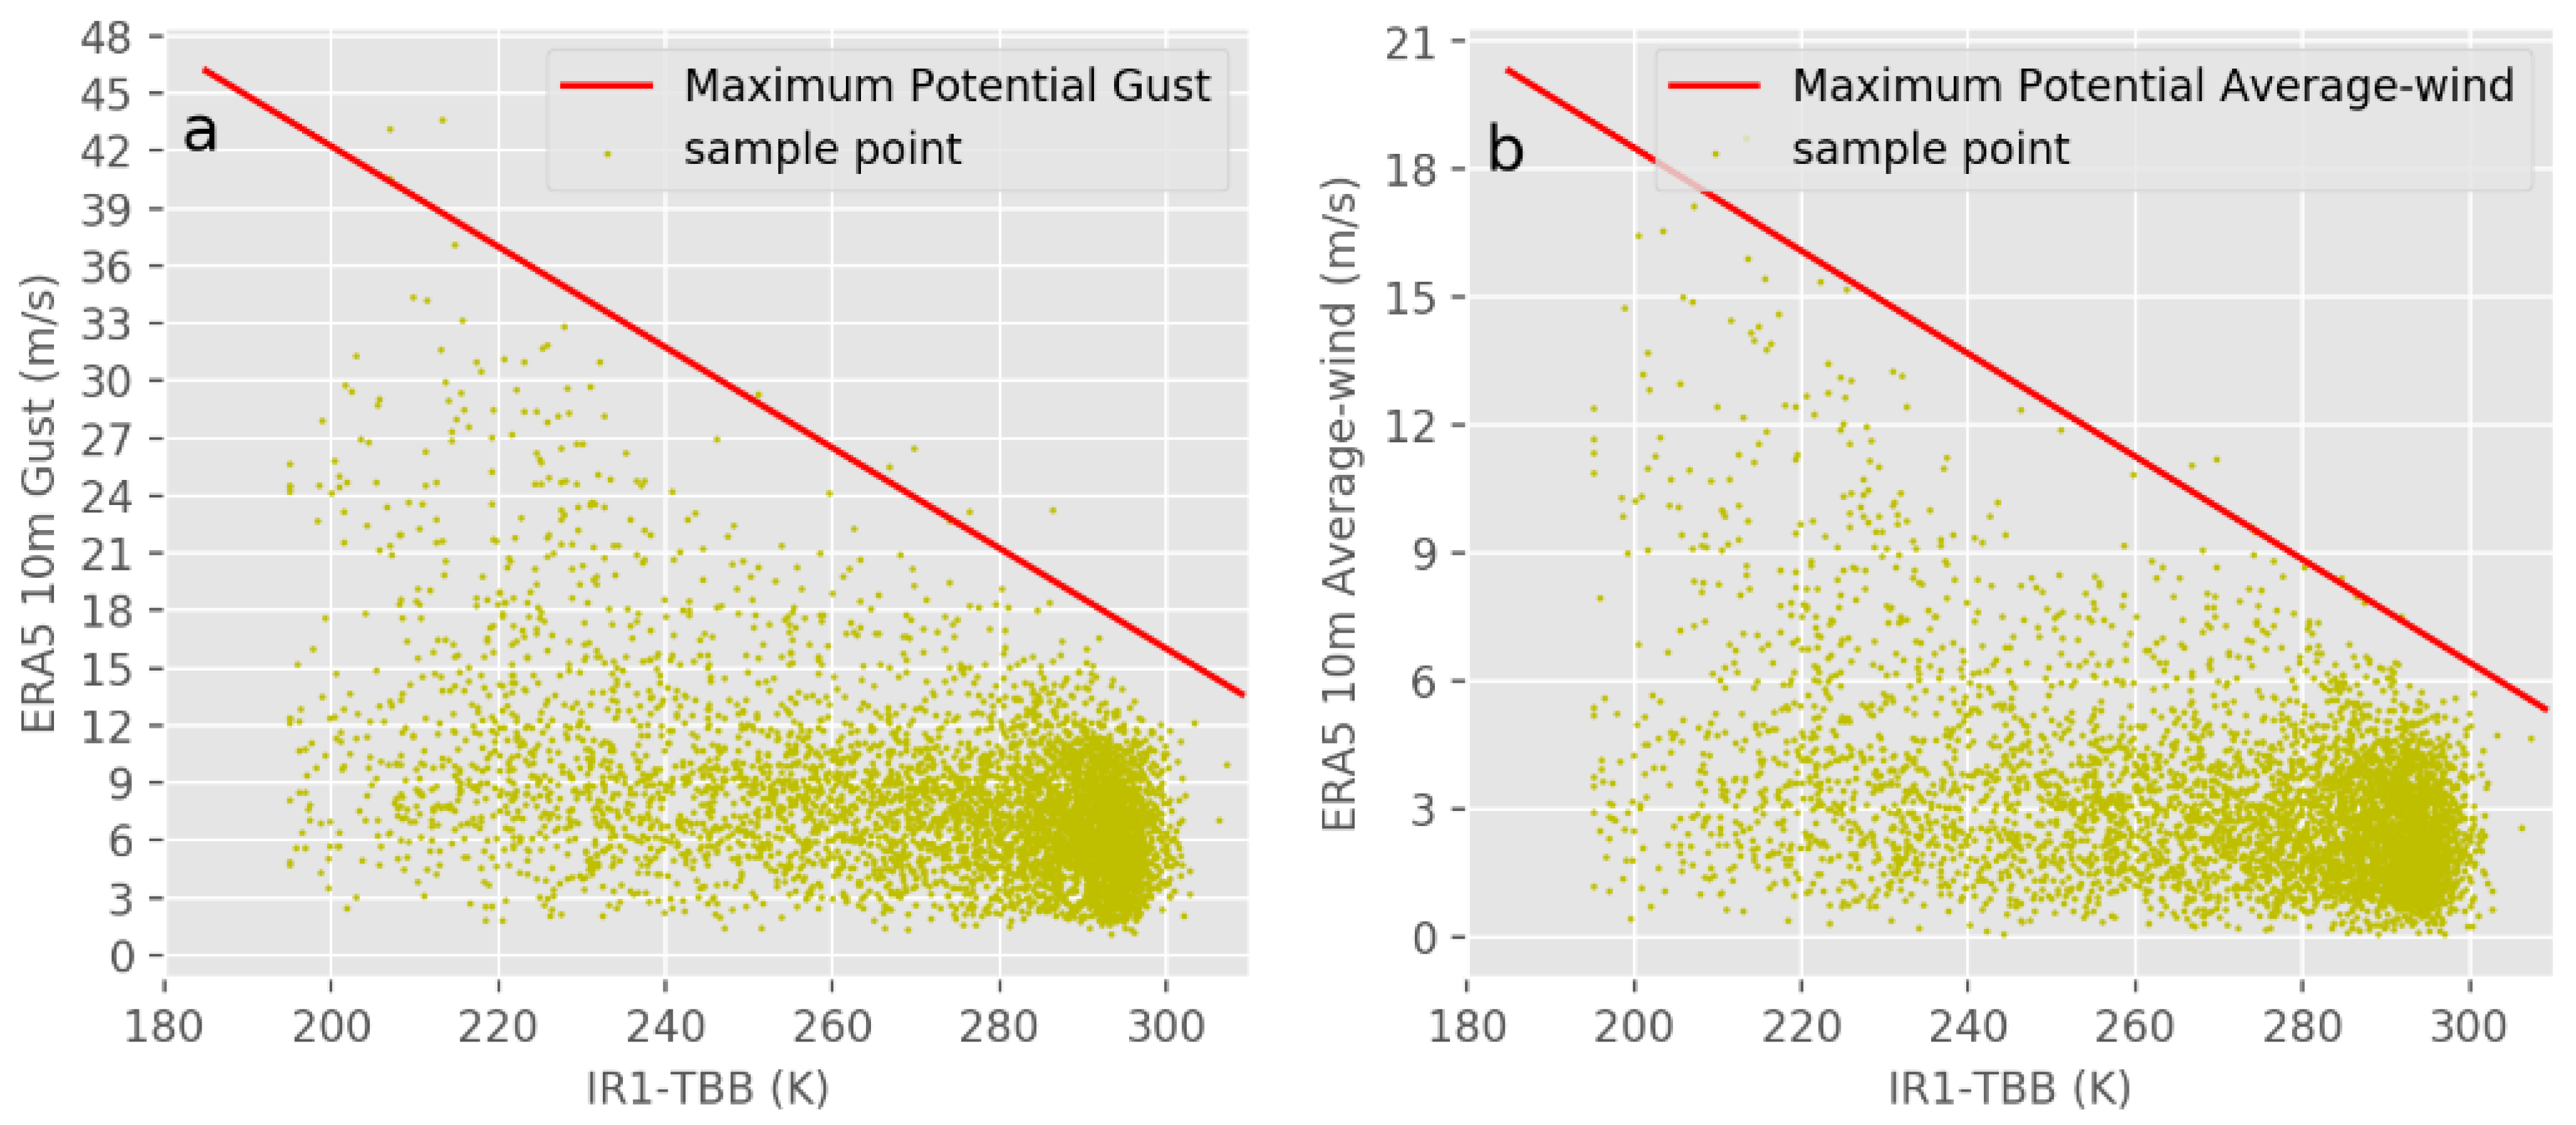
4. Results and Discussion
5. Conclusions
Author Contributions
Funding
Institutional Review Board Statement
Informed Consent Statement
Data Availability Statement
Conflicts of Interest
References
- Lei, X. Overview of the development history of China’s typhoon research and operational work in the past century. Sci. China Earth Sci. 2020, 63, 362–383. [Google Scholar] [CrossRef]
- Li, H.; Li, Q.; Huang, D.; Zhang, L.; Li, G.; Zhang, L.; Zhang, L.; Yang, Y. Wind Gust Forecast and Evaluation for Specific Locations Based on Historical Tropical Cyclone Data. J. Trop. Meteorol. 2019, 35, 652–663. (In Chinese) [Google Scholar]
- Tan, C.; Fang, W. Mapping the wind hazard of global tropical cyclones with parametric wind field models by considering the effects of local factors. Int. J. Disaster Risk Sci. 2018, 9, 86–99. [Google Scholar] [CrossRef] [Green Version]
- Yang, Y.; Lei, X. Statistics of strong wind distribution caused by landfall typhoon in China. J. Trop. Meteorol. 2004, 6, 633–642. (In Chinese) [Google Scholar]
- Kaplan, J.; DeMaria, M. A simple empirical model for predicting the decay of tropical cyclone winds after landfall. J. Appl. Meteorol. 1995, 34, 2499–2512. [Google Scholar] [CrossRef] [Green Version]
- Yan, D. Research on Distribution Characteristics and Forecast for Tropical Cyclone Gale in Guangxi; Nanning Normal University: Nanning, China, 2014. (In Chinese) [Google Scholar]
- Zhang, Q.; Wu, L.; Liu, Q. Tropical cyclone damages in China 1983–2006. Bull. Am. Meteorol. Soc. 2009, 90, 489–496. [Google Scholar] [CrossRef] [Green Version]
- Chou, J.; Dong, W.; Tu, G.; Xu, Y. Spatiotemporal distribution of landing tropical cyclones and disaster impact analysis in coastal China during 1990–2016. Phys. Chem. EarthParts A/B/C 2020, 115, 102830. [Google Scholar] [CrossRef]
- Wang, H.; Xu, M.; Onyejuruwa, A.; Wang, Y.; Wen, S.; Gao, A.E.; Li, Y. Tropical cyclone damages in Mainland China over 2005–2016: Losses analysis and implications. Environ. Dev. Sustain. 2019, 21, 3077–3092. [Google Scholar] [CrossRef]
- Jiang, Y.; Luo, Y.; Zhao, Z.; Tao, S. Changes in wind speed over China during 1956–2004. Theor. Appl. Climatol. 2014, 99, 421–430. [Google Scholar] [CrossRef]
- Powell, M.D.; Uhlhorn, E.W.; Kepert, J.D. Estimating maximum surface winds from hurricane reconnaissance measurements. Weather Forecast. 2009, 24, 868–883. [Google Scholar] [CrossRef] [Green Version]
- Piñeros, M.F.; Ritchie, E.A.; Tyo, J.S. Objective measures of tropical cyclone structure and intensity change from remotely sensed infrared image data. IEEE Trans. Geosci. Remote Sens. 2008, 46, 3574–3580. [Google Scholar] [CrossRef]
- Wang, G.; Wang, K.; Han, W.; Wang, D.; Qiu, X. Typhoon Maria Precipitation Retrieval and Evolution Based on the Infrared Brightness Temperature of the Feng-Yun 4A/Advanced Geosynchronous Radiation Imager. Adv. Meteorol. 2020, 2020, 1–12. [Google Scholar] [CrossRef] [Green Version]
- Lan, H.; Zhang, R.; Jiang, Y. Infrared rainfall estimation technique for small area and its use in very short-term weather forecasting. J. Trop. Meteorol. 2000, 16, 366–373. [Google Scholar]
- Yu, H.; Zhang, X. Application of bright temperature (TBB) in tropical cyclone research. China Sci. Technol. Inf. 2009, 23, 26–27. (In Chinese) [Google Scholar]
- Dvorak, V.F. Tropical cyclone intensity analysis and forecasting from satellite imagery. Mon. Weather Rev. 1975, 103, 420–430. [Google Scholar] [CrossRef]
- Dvorak, V.F. Tropical Cyclone Intensity Analysis Using Satellite Data; US Department of Commerce, National Oceanic and Atmospheric Administration, National Environmental Satellite, Data, and Information Service: Silver Spring, MD, USA, 1984.
- Velden, C.; Harper, B.; Wells, F.; Beven, J.L., II; Zehr, R.; Olander, T.; Mayfield, M.; Guard, C.; Lander, M.; Edson, R.; et al. The Dvorak tropical cyclone intensity estimation technique: A satellite-based method that has endured for over 30 years. Bull. Am. Meteorol. Soc. 2006, 87, 1195–1210. [Google Scholar] [CrossRef]
- DeMaria, M.; Kaplan, J. A statistical hurricane intensity prediction scheme (SHIPS) for the Atlantic basin. Weather Forecast. 1994, 9, 209–220. [Google Scholar] [CrossRef]
- DeMaria, M.; Zehr, R.M.; Kossin, J.P.; Knaff, J.A. The use of GOES imagery in statistical hurricane intensity prediction. In Proceedings of the 25th Conference on Hurricanes and Tropical Meteorology, San Diego, CA, USA, 28 April 2002; pp. 120–121. [Google Scholar]
- Mueller, K.J.; DeMaria, M.; Knaff, J.; Kossin, J.P.; Vonder Haar, T.H. Objective Estimation of Tropical Cyclone Wind Structure from Infrared Satellite Data. Weather Forecast. 2006, 21, 990–1005. [Google Scholar] [CrossRef] [Green Version]
- Knaff, J.A.; Slocum, C.J.; Musgrave, K.D.; Sampson, C.R.; Strahl, B.R. Using routinely available information to estimate tropical cyclone wind structure. Mon. Weather Rev. 2016, 144, 1233–1247. [Google Scholar] [CrossRef]
- Kossin, J.P.; Knaff, J.A.; Berger, H.I.; Herndon, D.C.; Cram, T.A.; Velden, C.S.; Murnane, R.J.; Hawkins, J.D. Estimating hurricane wind structure in the absence of aircraft reconnaissance. Weather Forecast. 2007, 22, 89–101. [Google Scholar] [CrossRef]
- Long, Z.; Yi, X. Study on inversing cloud motion wind from visible and infrared satellite image. In Proceedings of the 2010 Second IITA International Conference on Geoscience and Remote Sensing, Qingdao, China, 28–31 August 2010; Volume 1, pp. 506–509. [Google Scholar]
- Le Marshall, J.F.; Leslie, L.M.; Spinoso, C. The Generation and Assimilation of Cloud-Drift Winds in Numerical Weather Prediction (gtSpecial IssueltData Assimilation in Meteology and Oceanography: Theory and Practice). J. Meteorol. Soc. Jpn. Ser. II 1997, 75, 383–393. [Google Scholar] [CrossRef] [Green Version]
- Leese, J.A.; Novak, C.S.; Clark, B.B. An automated technique for obtaining cloud motion from geosynchronous satellite data using cross correlation. J. Appl. Meteorol. 1971, 10, 118–132. [Google Scholar] [CrossRef]
- Xu, J.; Zhang, Q. Status review on atmospheric motion vectors-derivation and application. J. Appl. Meteorol. Sci. 2006, 17, 574–582. (In Chinese) [Google Scholar]
- Liu, C.; Li, Q.; Zhao, W.; Wang, Y.; Ali, R.; Huang, D.; Lu, X.; Zheng, H.; Wei, X. Spatiotemporal Characteristics of Near-Surface Wind in Shenzhen. Sustainability. 2020, 12, 739. [Google Scholar] [CrossRef] [Green Version]
- Li, Q.; Xu, P.; Wang, X.; Lan, H.; Cao, C.; Li, G.; Zhang, L.; Sun, L. An operational statistical scheme for tropical cyclone induced wind gust forecasts. Weather Forecast. 2016, 31, 1817–1832. [Google Scholar] [CrossRef]
- Chen, L.; Luo, H.; Duan, Y.; Yu, H. An Overview of Tropical Cyclone and Tropical Meteorology Research Progress. Adv. Atmos. Sci. 2004, 21, 505–514. [Google Scholar] [CrossRef]
- Duan, Y.; Chen, L.; Liang, J.; Wang, Y.; Wu, L.; Cui, X.; Ma, L.; Li, Q. Research progress in the unusual variations of typhoons before and after landfalling. Acta Meteorol. Sin. 2014, 72, 969–986. [Google Scholar]
- Hu, T.; Wang, X.; Zhang, D.; Zheng, G.; Zhang, Y.; Wu, Y.; Xie, B. Study on typhoon center monitoring based on HY-2 and FY-2 data. IEEE Geosci. Remote Sens. Lett. 2017, 14, 2350–2354. [Google Scholar] [CrossRef]
- Hersbach, H.; Bell, B.; Berrisford, P.; Hirahara, S.; Horányi, A.; Muñoz-Sabater, J.; Nicolas, J.; Peubey, C.; Radu, R.; Schepers, D.; et al. The ERA5 global reanalysis. Q. J. R. Meteorol. Soc. 2020, 146, 1999–2049. [Google Scholar] [CrossRef]
- Ishak, W.H.W.; Ku-Mahamud, K.R.; Norwawi, N.M. Mining temporal reservoir data using sliding window technique. Ciit Int. J. Data Min. Knowl. Eng. 2011, 3, 473–478. [Google Scholar]
- Yahmed, Y.B.; Bakar, A.A.; Hamdan, A.R.; Ahmed, A.; Abdullah, S.M.S. Adaptive sliding window algorithm for weather data segmentation. J. Theor. Appl. Inf. Technol. 2015, 80, 322. [Google Scholar]
- Ruutu, J.P.O.; Kilkki, M.K. System and Method Employing Last Occurrence and Sliding Window Technique for Determining Minimum and Maximum Values. U.S. Patent 6,023,453, 8 February 2000. [Google Scholar]
- Keogh, E.; Lin, J.; Lee, S.-H.; Van Herle, H. Finding the most unusual time series subsequence: Algorithms and applications. Knowl. Inf. Syst. 2007, 11, 1–27. [Google Scholar] [CrossRef]
- Shi, Y.; Zhai, P.; Jiang, Z. Multi-sliding time windows based changing trend of mean temperature and its association with the global-warming hiatus. J. Meteorol. Res. 2016, 30, 232–241. [Google Scholar] [CrossRef]
- Benesty, J.; Chen, J.; Huang, Y.; Cohen, I. Pearson Correlation Coefficient [M]//Noise Reduction in Speech Processing; Springer: Berlin/Heidelberg, Germany, 2009; pp. 1–4. [Google Scholar]
- Li, Q.; Chen, J. Teleconnection between ENSO and climate in South China. Stoch. Environ. Res. Risk Assess. 2014, 28, 927–941. [Google Scholar] [CrossRef]
- Chen, J.; Kumar, P. Role of terrestrial hydrologic memory in modulating ENSO impacts in North America. J. Clim. 2002, 15, 3569–3585. [Google Scholar] [CrossRef]
- Arnau, J.; Bono, R. Autocorrelation and bias in short time series: An alternative estimator. Qual. Quant. 2001, 35, 365–387. [Google Scholar] [CrossRef]
- Solanas, A.; Manolov, R.; Sierra, V. Lag-one autocorrelation in short series: Estimation and hypotheses testing. Psicológica 2010, 31, 357–381. [Google Scholar]
- McCarthy, G.D.; Haigh, I.D.; Hirschi, J.J.M.; Grist, J.P.; Smeed, D.A. Ocean impact on decadal Atlantic climate variability revealed by sea-level observations. Nature 2015, 521, 508–510. [Google Scholar] [CrossRef] [Green Version]
- Bretherton, C.S.; Widmann, M.; Dymnikov, V.P.; Wallace, J.M.; Bladé, I. The effective number of spatial degrees of freedom of a time-varying field. J. Clim. 1999, 12, 1990–2009. [Google Scholar] [CrossRef]
- Liangbo, C.; Yaqing, Z. Study on curve fitting based on least square method. J. Wuxi Inst. Technol. 2012, 11, 52–55. [Google Scholar]
- Yang, J.; Li, L.; Zhao, K.; Wang, P.; Wang, D.; Sou, I.M.; Yang, Z.; Hu, J.; Tang, X.; Mok, K.M.; et al. A Comparative Study of Typhoon Hato (2017) and Typhoon Mangkhut (2018)—Their Impacts on Coastal Inundation in Macau. J. Geophys. Res. Ocean. 2019, 124, 9590–9619. [Google Scholar] [CrossRef]
- Fang, L.; Xia, G.; Lin, Z.; Mai, J. Cause Analysis of Territorial Rain Affection in South. J. Meteorol. Res. Appl. 2013, 34, 1–8+109. (In Chinese) [Google Scholar]
- Liu, Q.; Fu, C.; Li, M.; Li, T. Storm surge forecast and numerical study of “Hato” Typhoon. Mar. Forecast. 2018, 35, 29–36. (In Chinese) [Google Scholar]
- Song, X.; Zhang, W.; Zhou, J.; Li, Y. A Comparative Analysis of the Effect of Typhoons Hato and Mangkhut on the Wind and Rain in Zhaoqing. Guangdong Meteorol. 2020, 42, 23–26, 31. (In Chinese) [Google Scholar]
- Zou, W.; Liu, F.; Guo, Z.; Pan, X. Analysis of Extreme Winds Caused by Mangkhut Diagnostic in Baiyun Airport. Air. Traffic. Manag. 2019, 8, 68–71. (In Chinese) [Google Scholar]
- Li, S.; Lai, S.; Xiong, Z.; Wang, T. Structural Changes and Precipitation Cloud Characteristics of Typhoon No.1822 Based on Satellite Cloud Images. J. Shaoguan Univ. Nat. Sci. 2019, 40, 49–53. (In Chinese) [Google Scholar]
- Wang, Y.; Li, Q.; Lan, H.; Sun, L.; Cao, Y.; Li, G. Forecast of Maximum Wind Gust in Tropical Cyclones for Port Terminals in Shenzhen. Adv. Meteorol. Sci. Technol. 2017, 7, 128–133+148. (In Chinese) [Google Scholar]
- Merrill, R.T. An Experiment in Statistical Prediction of Tropical Cyclone Intensity Change; US Department of Commerce, National Oceanic and Atmospheric Administration, National Weather Service, National Hurricane Center: Miami, FL, USA, 1987.
- DeMaria, M.; Kaplan, J. Sea Surface Temperature and the Maximum Intensity of Atlantic Tropical Cyclones. J. Clim. 1994, 7, 1324–1334. [Google Scholar] [CrossRef] [Green Version]
- Whitney, L.D.; Hobgood, J.S. The Relationship between Sea Surface Temperatures and Maximum Intensities of Tropical Cyclones in the Eastern North Pacific Ocean. J. Clim. 1997, 10, 2921–2930. [Google Scholar] [CrossRef]
- Fitzpatrick, P.J. Understanding and forecasting tropical cyclone intensity change with the Typhoon Intensity Prediction Scheme (TIPS). Weather Forecast. 1997, 12, 826–846. [Google Scholar] [CrossRef]
- Knaff, J.A.; Sampson, C.R.; DeMaria, M. An operational statistical typhoon intensity prediction scheme for the western North Pacific. Weather Forecast. 2005, 20, 688–699. [Google Scholar] [CrossRef] [Green Version]
- Minola, L.; Zhang, F.; Azorín-Molina, C.; Safaei Pirooz, A.A.; Flay, R.G.J.; Hersbach, H.; Chen, D. Near-surface mean and gust wind speeds in ERA5 across Sweden: Towards an improved gust parametrization. Clim. Dyn. 2020, 55, 887–907. [Google Scholar] [CrossRef]


| OBTID | Station Name | Abbreviation | Longitude | Latitude |
|---|---|---|---|---|
| G3536 | Bei Zai Jiao | BZJ | 114.3 | 22.6 |
| G2185 | Beidouzhen Naqinxu | NQX | 112.4 | 21.7 |
| G2425 | Deyu Jidi | DYJD | 110.3 | 21.3 |
| G2012 | Dongfengzhen | DFZ | 113.3 | 22.7 |
| 59682 | Gao Lan Dao | GLD | 113.3 | 22.0 |
| G1820 | Gongping Shuiku | GPSK | 115.4 | 23.1 |
| G1201 | Gui Shan Dao | GSD | 113.8 | 22.1 |
| G2310 | Hailing Dadi | HLDD | 111.9 | 21.7 |
| G1251 | Hengshan | HS | 113.2 | 22.3 |
| G1805 | Honghaiwan | HHW | 115.6 | 22.7 |
| G2451 | Huangpozhen Caizhengsuo | HPZCZS | 110.6 | 21.3 |
| G1833 | Jiadongzhen | JDZ | 116.1 | 22.9 |
| G2950 | Jinghaizhen | JHZ | 116.5 | 23.0 |
| G1209 | Jiuzhougang | JZG | 113.6 | 22.2 |
| G3525 | Longqi | LQ | 114.5 | 22.6 |
| G3524 | Luohu Dangxiao | LHDX | 114.2 | 22.6 |
| G1206 | Nanping Guangchang | NPGC | 113.4 | 22.2 |
| G1838 | Piyangzhen | PYZ | 115.9 | 23.0 |
| G2046 | Quanlucun | QLC | 113.3 | 22.5 |
| G2017 | Shenwan Dapaicun | SW | 113.4 | 22.6 |
| G1811 | Shunzhou Baoyuchang | SZBYC | 115.6 | 22.7 |
| G6868 | Xiqiao Shanding | XQ | 113.0 | 22.9 |
| G2111 | Ya Nan Shuilihui | YNSLH | 113.1 | 22.2 |
| G3567 | Yantian International Container Terminal | YICT | 114.3 | 22.6 |
| G1205 | Zhuhai Jichang | ZHJC | 113.4 | 22.0 |
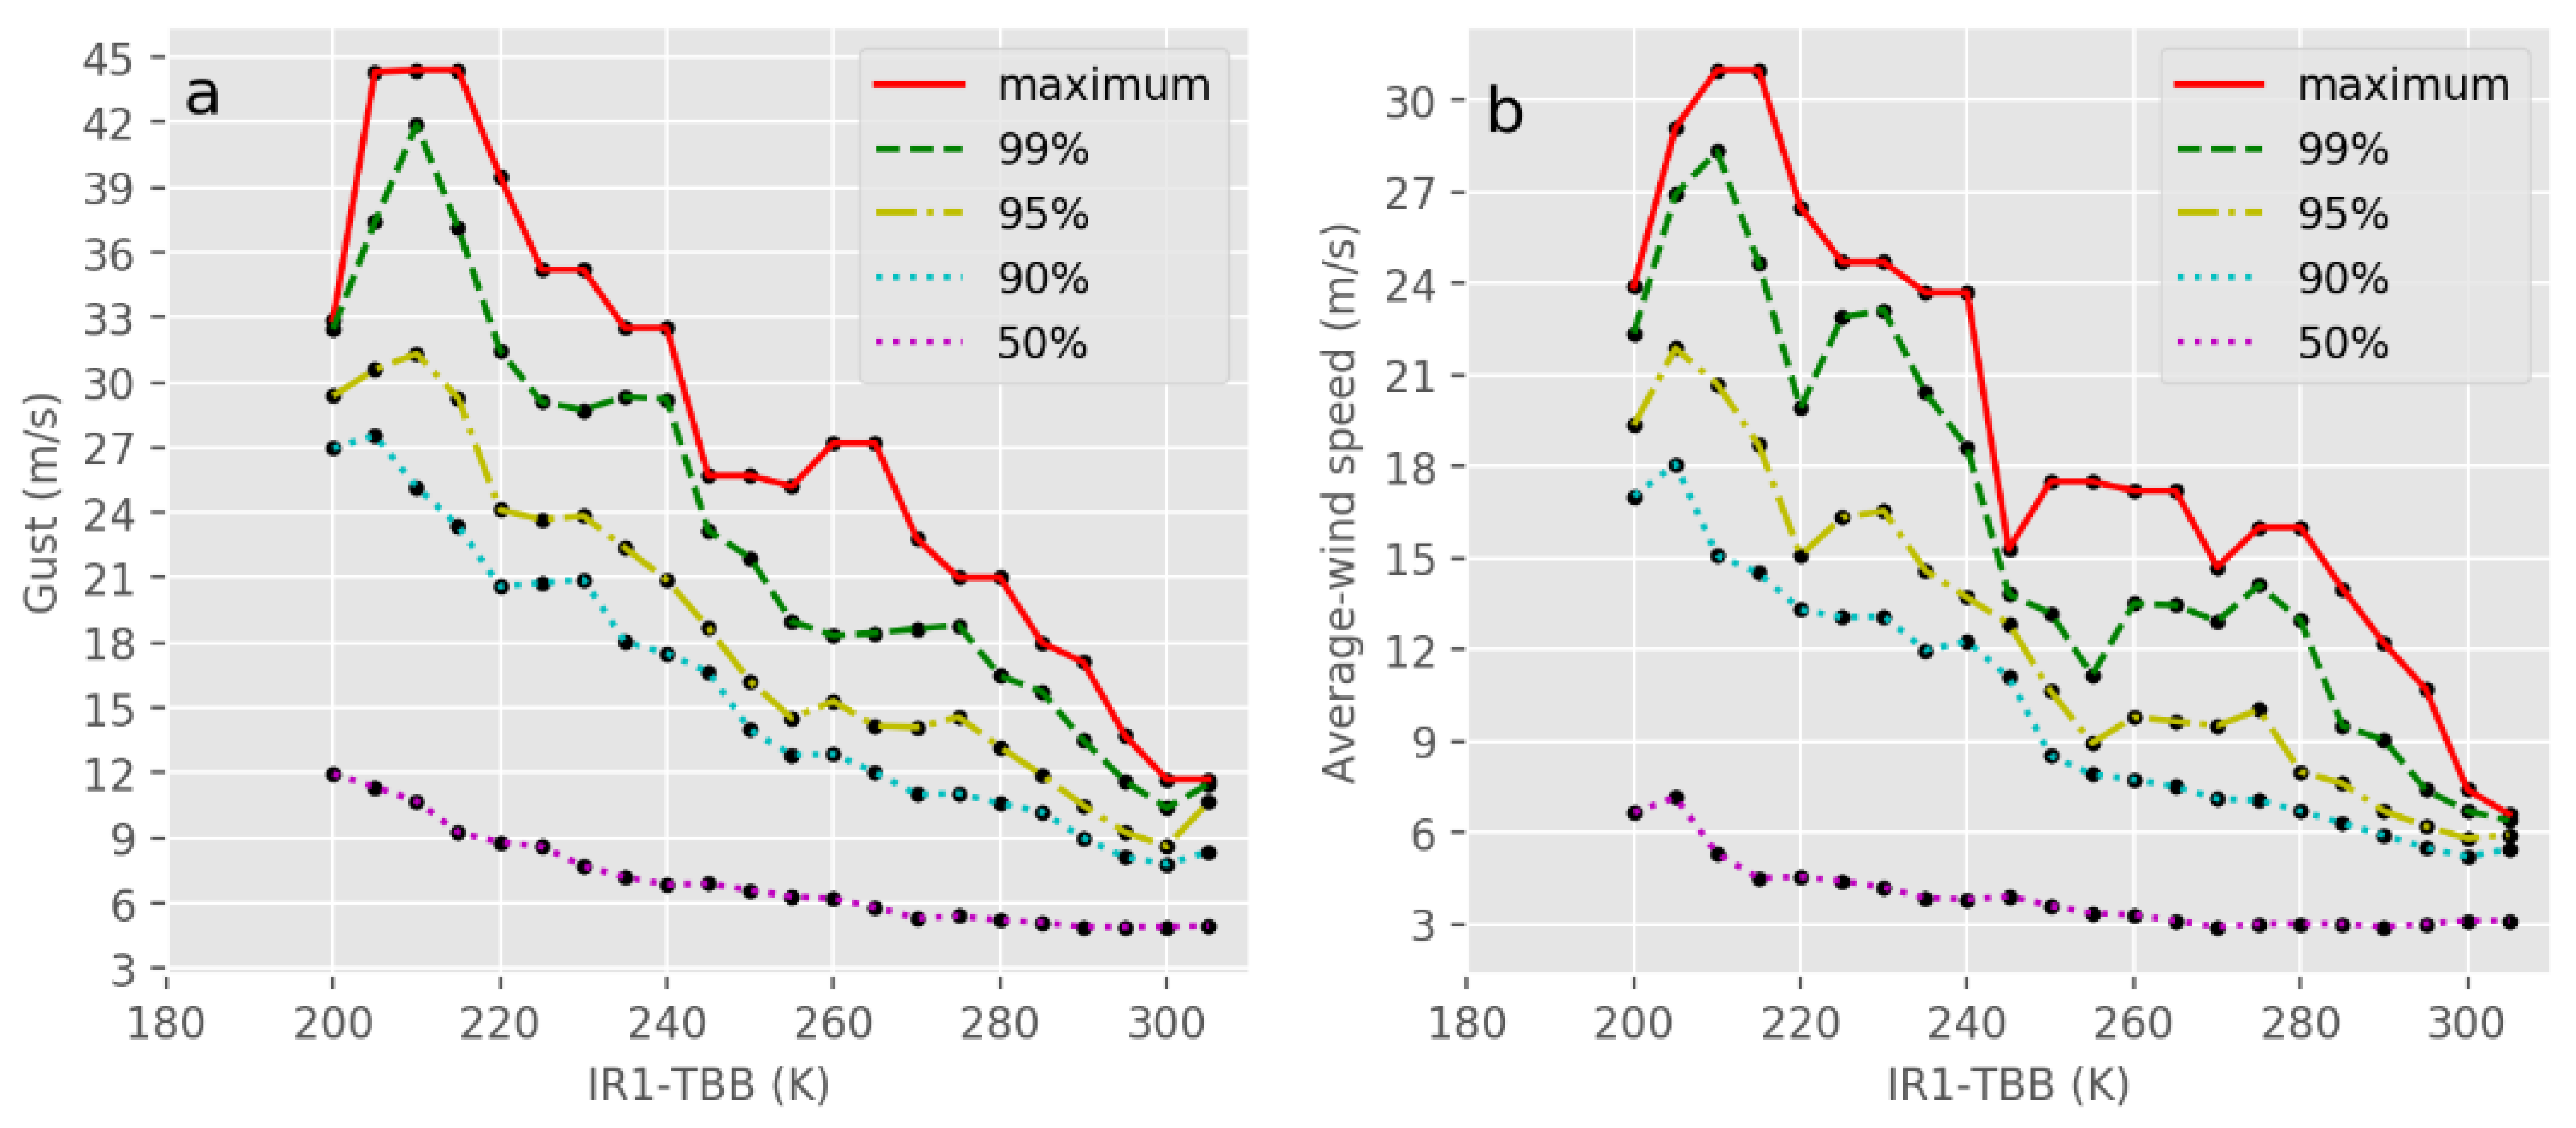
| TBB Midpoint (K) | Number of Observations | Average TBB (K) | Maximum Gust (m/s) | Maximum Average-Wind Speed (m/s) |
|---|---|---|---|---|
| 200 | 69 | 200.49 | 32.9 | 23.9 |
| 205 | 101 | 205.47 | 44.3 | 29.1 |
| 210 | 146 | 210.61 | 44.4 | 31.0 |
| 215 | 189 | 215.32 | 44.4 | 31.0 |
| 220 | 223 | 220.3 | 32.5 | 26.5 |
| 225 | 252 | 225.22 | 35.2 | 24.7 |
| 230 | 261 | 229.97 | 35.2 | 24.7 |
| 235 | 258 | 234.91 | 32.5 | 23.7 |
| 240 | 256 | 240.13 | 32.5 | 23.7 |
| 245 | 257 | 245.12 | 25.7 | 15.3 |
| 250 | 301 | 250.36 | 25.7 | 17.5 |
| 255 | 353 | 255.11 | 25.2 | 17.5 |
| 260 | 372 | 260.11 | 27.2 | 17.2 |
| 265 | 402 | 265.18 | 27.2 | 17.2 |
| 270 | 457 | 270.36 | 22.8 | 14.7 |
| 275 | 519 | 275.24 | 21.0 | 16.0 |
| 280 | 674 | 280.64 | 21.0 | 16.0 |
| 285 | 1038 | 285.74 | 18.0 | 14.0 |
| 290 | 1738 | 290.85 | 17.1 | 12.2 |
| 295 | 1711 | 294.09 | 13.7 | 10.7 |
| 300 | 656 | 296.95 | 11.8 | 7.4 |
| 305 | 49 | 301.31 | 11.7 | 6.6 |
| Gust (m/s) | Average-Wind Speed (m/s) | |||||
|---|---|---|---|---|---|---|
| Station | r | n* | rcrit | r | n* | rcrit |
| BZJ | −0.95 | 11.97 | 0.57 | −0.97 | 11.58 | 0.58 |
| NQX | −0.94 | 12.32 | 0.56 | −0.85 | 13.40 | 0.54 |
| DYJD | −0.90 | 12.44 | 0.56 | −0.87 | 12.95 | 0.55 |
| DFZ | −0.93 | 12.29 | 0.56 | −0.89 | 13.63 | 0.53 |
| GLD | −0.92 | 12.91 | 0.55 | −0.89 | 13.51 | 0.54 |
| GPSK | −0.93 | 12.76 | 0.55 | −0.86 | 14.49 | 0.52 |
| GSD | −0.95 | 11.72 | 0.57 | −0.97 | 11.58 | 0.58 |
| HLDD | −0.96 | 12.06 | 0.57 | −0.94 | 12.12 | 0.57 |
| HS | −0.94 | 12.26 | 0.56 | −0.90 | 12.49 | 0.56 |
| HHW | −0.94 | 12.80 | 0.55 | −0.95 | 12.01 | 0.57 |
| HPZCZS | −0.95 | 12.11 | 0.57 | −0.93 | 12.60 | 0.55 |
| JDZ | −0.93 | 12.21 | 0.56 | −0.9 | 12.86 | 0.55 |
| JHZ | −0.88 | 12.99 | 0.55 | −0.88 | 13.01 | 0.55 |
| JZG | −0.89 | 12.78 | 0.55 | −0.95 | 12.09 | 0.57 |
| LQ | −0.94 | 12.30 | 0.56 | −0.96 | 11.82 | 0.57 |
| LHDX | −0.95 | 12.09 | 0.57 | −0.93 | 12.38 | 0.56 |
| NPGC | −0.91 | 12.66 | 0.55 | −0.81 | 14.99 | 0.51 |
| PYZ | −0.94 | 12.84 | 0.55 | −0.9 | 13.63 | 0.53 |
| QLC | −0.93 | 12.19 | 0.56 | −0.88 | 13.12 | 0.54 |
| SW | −0.91 | 12.62 | 0.55 | −0.9 | 12.94 | 0.55 |
| SZBYC | −0.97 | 11.96 | 0.57 | −0.95 | 12.52 | 0.56 |
| XQ | −0.91 | 12.42 | 0.56 | −0.79 | 14.63 | 0.52 |
| YNSLH | −0.90 | 13.04 | 0.55 | −0.86 | 13.65 | 0.53 |
| YICT | −0.95 | 11.82 | 0.57 | −0.94 | 12.07 | 0.57 |
| ZHJC | −0.87 | 13.23 | 0.54 | −0.89 | 14.19 | 0.52 |
| Gust (m/s) | Average-Wind Speed (m/s) | |||||
|---|---|---|---|---|---|---|
| Station | A | B | R2 | A | B | R2 |
| BZJ | −0.23 | 40.37 | 0.90 | −0.16 | 25.26 | 0.93 |
| NQX | −0.31 | 48.97 | 0.89 | −0.20 | 30.63 | 0.72 |
| DYJD | −0.32 | 47.67 | 0.82 | −0.20 | 28.84 | 0.76 |
| DFZ | −0.29 | 56.93 | 0.87 | −0.17 | 30.43 | 0.79 |
| GLD | −0.36 | 59.17 | 0.84 | −0.22 | 38.01 | 0.78 |
| GPSK | −0.35 | 53.09 | 0.86 | −0.22 | 33.20 | 0.74 |
| GSD | −0.28 | 46.65 | 0.78 | −0.18 | 29.04 | 0.82 |
| HLDD | −0.25 | 44.66 | 0.91 | −0.17 | 32.03 | 0.89 |
| HS | −0.30 | 47.81 | 0.88 | −0.18 | 28.45 | 0.82 |
| HHW | −0.42 | 64.13 | 0.88 | −0.24 | 37.63 | 0.91 |
| HPZCZS | −0.24 | 43.67 | 0.90 | −0.16 | 26.31 | 0.86 |
| JDZ | −0.26 | 46.85 | 0.86 | −0.18 | 31.33 | 0.81 |
| JHZ | −0.33 | 52.50 | 0.78 | −0.22 | 33.75 | 0.77 |
| JZG | −0.32 | 50.21 | 0.79 | −0.19 | 32.87 | 0.90 |
| LQ | −0.28 | 49.44 | 0.88 | −0.16 | 26.38 | 0.92 |
| LHDX | −0.27 | 47.15 | 0.91 | −0.13 | 24.26 | 0.86 |
| NPGC | −0.23 | 44.43 | 0.84 | −0.16 | 29.23 | 0.66 |
| PYZ | −0.34 | 54.72 | 0.88 | −0.21 | 33.17 | 0.81 |
| QLC | −0.34 | 47.18 | 0.86 | −0.21 | 28.64 | 0.78 |
| SW | −0.28 | 46.87 | 0.84 | −0.15 | 25.45 | 0.81 |
| SZBYC | −0.36 | 56.19 | 0.93 | −0.24 | 37.57 | 0.90 |
| XQ | −0.27 | 47.86 | 0.83 | −0.11 | 19.43 | 0.63 |
| YNSLH | −0.35 | 48.94 | 0.81 | −0.25 | 33.53 | 0.75 |
| YICT | −0.33 | 52.12 | 0.96 | −0.22 | 35.68 | 0.92 |
| ZHJC | −0.29 | 47.13 | 0.76 | −0.14 | 25.98 | 0.79 |
| Station | Longitude | Latitude | Gust (m/s) | Average-Wind (m/s) | ||||
|---|---|---|---|---|---|---|---|---|
| A | B | R2 | A | B | R2 | |||
| BZJ (YICT, LHDX) | 114.25 | 22.5 | −0.26 | 47.5 | 0.88 | −0.12 | 20.92 | 0.94 |
| NQX | 112.5 | 21.75 | −0.22 | 41.51 | 0.9 | −0.12 | 24.09 | 0.83 |
| DYJD | 110.25 | 21.25 | −0.2 | 38.73 | 0.84 | −0.09 | 18.51 | 0.85 |
| DFZ | 113.25 | 22.75 | −0.27 | 43.63 | 0.9 | −0.12 | 20.23 | 0.91 |
| GLD | 113.25 | 22 | −0.22 | 41.57 | 0.92 | −0.14 | 26.28 | 0.89 |
| GPSK | 115.5 | 23 | −0.23 | 43.19 | 0.78 | −0.1 | 18.52 | 0.87 |
| GSD | 113.75 | 22.25 | −0.27 | 46.34 | 0.78 | −0.16 | 27.51 | 0.82 |
| HLDD | 112 | 21.75 | −0.2 | 37.88 | 0.89 | −0.12 | 21.55 | 0.9 |
| HS | 113.25 | 22.25 | −0.26 | 43.3 | 0.95 | −0.13 | 22.32 | 0.97 |
| HHW (SZBYC) | 115.5 | 22.75 | −0.28 | 46.78 | 0.95 | −0.17 | 27.66 | 0.97 |
| HPZCZS | 110.5 | 21.25 | −0.22 | 42.38 | 0.85 | −0.11 | 21.16 | 0.86 |
| JDZ (PYZ) | 116 | 23 | −0.29 | 49.68 | 0.86 | −0.14 | 23.8 | 0.91 |
| JHZ | 116.5 | 23 | −0.27 | 47.78 | 0.89 | −0.18 | 29.37 | 0.9 |
| JZG (NPGC) | 113.5 | 22.25 | −0.27 | 45.35 | 0.95 | −0.13 | 22.89 | 0.94 |
| LQ | 114.5 | 22.5 | −0.31 | 52.57 | 0.86 | −0.17 | 28.58 | 0.87 |
| QLC | 113.25 | 22.5 | −0.26 | 43.48 | 0.91 | −0.11 | 18.81 | 0.87 |
| SW | 113.5 | 22.5 | −0.31 | 48.66 | 0.89 | −0.14 | 22.48 | 0.92 |
| XQ | 113 | 23 | −0.27 | 45.06 | 0.89 | −0.14 | 22.95 | 0.85 |
| YNSLH | 113 | 22.25 | −0.21 | 39.04 | 0.84 | −0.09 | 18.32 | 0.82 |
| ZHJC | 113.5 | 22 | −0.24 | 46.39 | 0.67 | −0.13 | 28.17 | 0.73 |
Publisher’s Note: MDPI stays neutral with regard to jurisdictional claims in published maps and institutional affiliations. |
© 2021 by the authors. Licensee MDPI, Basel, Switzerland. This article is an open access article distributed under the terms and conditions of the Creative Commons Attribution (CC BY) license (https://creativecommons.org/licenses/by/4.0/).
Share and Cite
Zhang, J.; Li, Q.; Zhao, W.; Lee, J.H.W.; Liu, J.; Wang, S. Relationship between Near-Surface Winds Due to Tropical Cyclones and Infrared Brightness Temperature Obtained from Geostationary Satellite. Atmosphere 2021, 12, 493. https://0-doi-org.brum.beds.ac.uk/10.3390/atmos12040493
Zhang J, Li Q, Zhao W, Lee JHW, Liu J, Wang S. Relationship between Near-Surface Winds Due to Tropical Cyclones and Infrared Brightness Temperature Obtained from Geostationary Satellite. Atmosphere. 2021; 12(4):493. https://0-doi-org.brum.beds.ac.uk/10.3390/atmos12040493
Chicago/Turabian StyleZhang, Jiali, Qinglan Li, Wei Zhao, Joseph H. W. Lee, Jia Liu, and Shuxin Wang. 2021. "Relationship between Near-Surface Winds Due to Tropical Cyclones and Infrared Brightness Temperature Obtained from Geostationary Satellite" Atmosphere 12, no. 4: 493. https://0-doi-org.brum.beds.ac.uk/10.3390/atmos12040493