
Operational Forecasting of Tropical Cyclone Rapid Intensification at the National Hurricane Center


1
Cooperative Institute for Research in the Atmosphere, Colorado State University, Fort Collins, CO 80523, USA
2
Systems Research Group, NOAA/NWS/National Hurricane Center, Miami, FL 33165, USA
3
NOAA/NWS/National Hurricane Center, Miami, FL 33165, USA
4
NOAA/AOML/Hurricane Research Division, Miami, FL 33149, USA
*
Author to whom correspondence should be addressed.
Atmosphere 2021, 12(6), 683; https://0-doi-org.brum.beds.ac.uk/10.3390/atmos12060683
Submission received: 4 May 2021
/
Revised: 20 May 2021
/
Accepted: 22 May 2021
/
Published: 26 May 2021
(This article belongs to the Special Issue Rapid Intensity Changes of Tropical Cyclones)
Abstract
:Although some recent progress has been made in operational tropical cyclone (TC) intensity forecasting, the prediction of rapid intensification (RI) remains a challenging problem. To document RI forecast progress, deterministic and probabilistic operational intensity models used by the National Hurricane Center (NHC) are briefly reviewed. Results show that none of the deterministic models had RI utility from 1991 to about 2015 due to very low probability of detection, very high false alarm ratio, or both. Some ability to forecast RI has emerged since 2015, with dynamical models being the best guidance for the Atlantic and statistical models the best RI guidance for the eastern North Pacific. The first probabilistic RI guidance became available in 2001, with several upgrades since then leading to modest skill in recent years. A tool introduced in 2018 (DTOPS) is currently the most skillful among NHC’s probabilistic RI guidance. To measure programmatic progress in forecasting RI, the Hurricane Forecast Improvement Program has introduced a new RI metric that uses the traditional mean absolute error but restricts the sample to only those cases where RI occurred in the verifying best track or was forecast. By this metric, RI forecasts have improved by ~20–25% since the 2015–2017 baseline period.
1. Introduction
The National Hurricane Center (NHC) issues public forecasts every 6 h for all tropical and subtropical cyclones (TCs) in the Atlantic and eastern North Pacific basins. These forecasts include the track and intensity (maximum 1-min mean 10-m winds) through 5 days. Wind structure forecasts are provided as the maximum extent of 34- and 50-kt winds within each of four quadrants surrounding the TC center through 72 h and the maximum extent of 64-kt winds through 48 h. Cangialosi et al. (hereafter C20) [1] showed that, although NHC’s track forecast errors have decreased dramatically since the 1970s, intensity forecast errors remained relatively constant into the early 2000s. Since that time, however, NHC’s intensity errors have notably decreased, primarily due to the emergence of skillful intensity guidance. Statistical–dynamical intensity guidance, including the statistical hurricane intensity prediction scheme (SHIPS) [2] and the logistic growth equation model (LGEM) [3], were the most skillful in the first decade of the 2000s. Dynamical models, which include the hurricane weather research and forecasting model (HWRF) [4], the hurricanes in a multi-scale ocean-coupled non-hydrostatic model (HMON) [1], and the coupled ocean/atmosphere mesoscale prediction system for tropical cyclones (COAMPS-TC) [5], have been leading the way since about 2015. Consensus models, which combine forecasts from various other models, have also contributed to the increased intensity forecast skill [6,7].
The intensity forecast improvements noted above were assessed using the full sample of available TC forecasts. An important subset of that sample, however, represents storms that undergo rapid intensification (RI), particularly when RI occurs near landfall. Because preparedness activities (including evacuations) are closely tied to the expected landfall intensity, accurate forecasts of RI would have strong societal benefits. RI forecasts are also very important for marine interests. Unfortunately, RI has been notoriously difficult to forecast (e.g., [8,9]), and hurricane seasons with more frequent RI cases tend to have large annual average forecast errors. Understanding the state of RI forecasting is therefore of keen interest and is the subject of this paper; here, we will summarize NHC’s operational RI forecast guidance, evaluate this guidance, and document forecast error trends. A new metric for assessing RI forecast improvements will also be described.
Kaplan and DeMaria [10] defined RI as a 30-kt intensity increase in 24 h, a threshold roughly based on the 95th percentile of the Atlantic intensity change cumulative distribution function and feedback from NHC forecasters on a useful cutoff for development of a probabilistic forecast tool. Although originally developed from forecast considerations, the RI definition of 30 kt/24 h has been used in many other studies (e.g., [11,12]). Rapid weakening also contributes significantly to annual average intensity forecast errors, especially when the weakening occurs over water [8], but those cases are not considered in this study.
2. Materials and Methods
NHC’s intensity forecast guidance includes deterministic and probabilistic models. The deterministic model forecasts and storm history files (NHC’s post-storm “best tracks”) were obtained from the Automated Tropical Cyclone Forecast (ATCF) system [13], available at ftp.nhc.noaa.gov/atcf, accessed 5 Feb. 2021. Cases were chosen for verification following NHC’s standard procedures (C20), in which a case is included only if the system was a tropical or subtropical cyclone in the best track at both the initial time of the forecast and at the verification time. Wherever possible, we used forecasts from the so-called “early” versions of dynamical models [14]. Dynamical models such as HWRF are usually not available until after NHC’s deadline to release a forecast and, thus, are referred to as “late” models. To account for that delay, a method was developed to adjust the forecasts from the previous model cycle to create “early” versions of the models available for forecaster use. For the results shown in Section 3.2 and Section 3.3, there were a few years when only the late versions of the dynamical models were available.
The SHIPS model was the first routinely available operational intensity guidance that made use of input beyond climatology and persistence. SHIPS forecasts have been available in the ATCF database since 1991. SHIPS was followed by an experimental version of the geophysical fluid dynamics laboratory (GFDL) dynamical hurricane model in 1992, a model that became fully operational in 1995 [15]. It soon became clear that these models did not perform well for RI, however, and that motivated the development of new statistical models that treated RI as a classification problem, rather than attempting to explicitly forecast rapid intensity change. The first of these was the SHIPS rapid intensification index (SHIPS-RII), which became available to forecasters in 2001 [10]. The initial version of SHIPS-RII estimated the probability that the intensity of a TC would increase by 30 kt or more in the next 24 h. Several variations on SHIPS-RII were developed after 2001 and will be described in Section 3.1. Over time, it also became clear that useful RI guidance could be generated for different thresholds and forecast periods, and the SHIPS-RII was expanded; it currently provides guidance for the following intensification rates: 20 kt/12 h, 25 kt/24 h, 30 kt/24 h, 35 kt/24 h, 40 kt/24 h, 45 kt/36 h, 55 kt/48 h, and 65 kt/72 h. The time periods of all the SHIPS-RII intensification rates start at the beginning of the forecast and are verified against values from the best track calculated over the same intervals.
The ATCF archive of probabilistic RI forecasts begins in 2020, but external datasets in ATCF format exist for 2018–2019, and those external datasets were used for this study. RI forecasts for 2001–2017 were extracted from diagnostic text output files that are generated for forecasters as part of the operational SHIPS model processing.
The verifications in this study do not include cases where an eastern Pacific TC has passed 140° W and moved into the Central Pacific Hurricane Center’s (CPHC) area of responsibility (AOR). For TCs initially east of 140° W, any portion of the forecast or verifying track west of 140° W is included in the verification sample. The CPHC forecasts were excluded because some of the guidance models did not become available for their AOR until a few years after they were implemented for NHC’s AOR. Furthermore, some of the statistical techniques did not include CPHC cases in the training samples for all years. In addition, verification samples for the deterministic models were restricted to cases that also included an NHC official forecast.
Because NHC had not yet completed the post-storm analyses for 2020 when the verifications were performed, the history files used for 2020 storms contain a mix of operational, intermediate, and final best track data. Any verifications presented here that include 2020 TCs should be considered preliminary.
For models that provide an explicit intensity forecast, such as HWRF or SHIPS, the predicted intensity change over a specified period can be compared with the best track intensity change over that same period for each forecast case. Then, for any given RI threshold (e.g., 30 kt/24 h), the standard 2 × 2 contingency table can be created for the total sample for that model. Several metrics can then be calculated based on the contingency table [16]. Table 1 summarizes the contingency table values and metrics that were used here.
The probability of detection (POD) is the fraction of the observed number of RI cases that were correctly forecast, and the false alarm ratio (FAR) is the fraction of the cases that were forecast but did not verify. Generally, if a model has a non-zero POD and a FAR of 50% or less it is considered useful, because it detects some RI cases and is correct at least half of the time. The bias (Bd) measures the fraction of RI forecasts that a model made, relative to the observed number of RI cases, independent of whether or not those forecasts were verified. (Here, we have added the subscript d to distinguish the deterministic model bias from a probabilistic forecast’s bias, defined differently as noted below.)
Because RI is, by definition, a rare event, an individual hurricane season sometimes will have only a few RI cases. For example, for the standard RI threshold of 30 kt/24 h there were only eight RI events during the 2014 Atlantic hurricane season. Thus, the verification statistics based on annual contingency tables might have large year-to-year variability just due to sample size differences. For the 2014 Atlantic example, the POD values could only be a multiple of 12.5%. As will be described below, most of the deterministic models under-forecast RI, with 25% of the time being a typical value for the 30 kt/24 h threshold. In 2014, that would correspond to two cases, so the FAR value could only be 0, 50 or 100%. To obtain more stable statistics, verifications were performed using 5-yr samples. The first 5-yr period considered for the Atlantic was 1986–1990, a period that provided a baseline because no objective intensity guidance was then available. NHC did not make eastern North Pacific forecasts until 1988, so the first sample for that basin only covered the 3 years from 1988–1990. The last 5-yr period included in both basins was 2016–2020.
For brevity, only three of the RI thresholds (30 kt/24 h, 55 kt/48 h, and 65 kt/72 h) will be included in the deterministic model verification. Each model will be verified as a homogeneous sample with the NHC official forecasts but independently of one another, mainly because some of the models were not available for all years within the 5-yr periods. Thus, the model samples are heterogenous. However, in most cases, the model samples were fairly similar to the total sample.
A number of metrics can be used to evaluate probabilistic forecasts [16]. For this study, we considered the bias (Bp), Brier score (BS) and Brier skill score (BSS). The probabilistic RI guidance provides an estimate of the probability of an RI event. Letting Fi be the forecast probability of an event, Oi be the observed probability (1 if the event was observed, 0 if it was not), then Bp, BS, and BSS are given by:
BSS = [BSref − BSmod]/BSref
3. Results
3.1. RI Forecast Tools
3.1.1. Deterministic Guidance
C20 [1] and the references therein describe the primary deterministic intensity models currently used by NHC. Table 2 summarizes the models that were included in this study and the years they provided operational guidance. All of the models in Table 2 are early models, as discussed in Section 2. SHIPS and LGEM are statistical intensity forecast models that use predictors from the ATCF, Global Forecasting System (GFS) forecast fields, ocean analyses, and infrared satellite imagery. The predictors used in SHIPS have changed considerably since 1991, and the version before 2001 did not account for movement over land. The lack of land effects could potentially result in a high intensity bias, but as will be shown below, SHIPS never forecasted RI during that early period, so it had no effect on the RI verification. SHIPS was not available for the eastern Pacific until 1996. GFDI is the early version of the GFDL hurricane model that transitioned to National Weather Service (NWS) operations in 1995 after running experimentally from 1992 to 1994. The late version (GFDL) was available to forecasters starting in 1992 for the Atlantic and 1993 for the eastern Pacific, and the early version became available in 1996. HWFI and HMNI are NWS nested-grid hurricane models and have been updated nearly every year since they first became operational. GFSI is the early intensity forecast from the NWS GFS model, which became available to forecasters in 1994. The late version (GFS) was available to forecasters two years prior to that (note that in the ATCF database the GFS forecasts are denoted with the identifier AVN). ICON, IVCN, and HCCA are “consensus” models—models that blend intensity forecasts from two or more other models. ICON and IVCN equally weight the input models, while HCCA uses unequal weights chosen to optimize forecast skill based on previous years of forecasts. ICON requires all members of the consensus to be available, while IVCN allows for some component models to be missing as long as at least two are available.
NHC had other deterministic intensity models available since 1991, including statistical models based solely on climatology and persistence (SHIFOR), the Navy’s version of the GFDL hurricane model (GFNI), the Navy’s nested COAMPS-TC regional model initialized from the GFS (CTCI), other global models, and the Florida State SuperEnsemble (FSSE). Those were not evaluated here because of limited sample size, similarity to other models already included, or because they almost never forecast RI (e.g., SHIFOR). However, CTCI and global model forecasts, in addition to the GFS, are components of some of the consensus models in Table 2.
3.1.2. Probabilistic Guidance
Table 3 summarizes the probabilistic RI guidance run operationally by NHC. The evolution of the various SHIPS-RII versions in Table 3 is described in [10,17,18]. All of these models use a subset of the predictors associated with the deterministic SHIPS intensity model. The earliest version of the SHIPS-RII became available for the Atlantic in 2001 and for the eastern North Pacific in 2005. The original version was based on a simple threshold method that identified which predictors (e.g., vertical wind shear) had sample means for the RI and non-RI cases that were statistically different. These predictors were then scaled, and probabilities corresponding to the number of inputs within a specified range of values conducive to RI were determined from the developmental sample. For example, the 850–200-hPa vertical shear for RI cases ranges from about 2 to 30 kt, so the scaled shear predictor ranges from 0 for a shear value of 30 kt and 1 for a value of 2 kt and varies linearly between 0 and 1 for shear values between 30 and 2 kt. The SHIPS-RII only included the 30 kt/24 h RI threshold through 2004. For 2005–2007, the threshold was reduced to 25 kt/24 h.
The threshold method was replaced with a linear discriminant analysis (LDA) technique beginning in 2006. Three RI thresholds (25 kt/24 h, 30 kt/24 h, and 35 kt/24 h) became available beginning in 2008, and a 40 kt/24 h threshold was added in 2010. Several new predictors, including those from infrared satellite imagery and oceanic heat content analyses, were also added during the period from 2003–2010.
Beginning in 2016, two new statistical approaches, logistic regression (SHIPS-RII-L) and Bayesian (SHIPS-RII-B) were added to the ensemble. The new versions used input variables different from those used by SHIPS-RII-LDA, but all were obtained from the SHIPS deterministic model processing. With three versions of the SHIPS-RII, it became possible to take an equally weighted average of the three outputs to form a consensus (SHIPS-RII-C). Since 2016, all of the SHIPS-RII models estimate the probabilities of eight RI thresholds listed in Section 2.
As the dynamical intensity model skill began to outpace the skill of statistical intensity models, starting in the mid-2010s, a new approach was developed to take advantage of the dynamical models’ progress. In this approach, the explicit intensity forecasts from several deterministic models were used as input to estimate the likelihood of RI using logistic regression. The deterministic to probabilistic statistical model (DTOPS) has not been previously documented in referenced literature, and so more details are provided here.
DTOPS applies binomial logistic regression [16] to deterministic model forecasts, along with basic vortex and geographic parameters, to produce a probabilistic forecast of RI:
where b0 represents the intercept term, bn represents the coefficients for each predictor, and xn represents the standardized value for each predictor. DTOPS applies this technique using EMXI (the early European Center for Medium-Range Weather Forecasts (ECMWF )global model intensity forecast), GFSI, HWFI, LGEM, and SHIPS forecasts of wind or pressure intensity changes, along with the initial intensity of the TC, TC latitude, and several other statistically combined parameters. The various predictors are defined in Table 4.
To obtain the coefficients listed in Table 4, each predictor is standardized by subtracting its mean and dividing by its standard deviation. This allows for meaningful comparisons among the relative weights of each predictor. DTOPS uses best-track data for the TC initial intensity and latitude and model forecasts from the past six hurricane seasons to derive the coefficients in (4). Longer and shorter developmental datasets were tested; however, six seasons proved to be the best compromise between limiting model changes (physics or resolution changes, for example) and maintaining a sufficient sample size. Model reforecasts were used whenever possible to ensure the forecasts best represented the current state of each modeling system. DTOPS first became available to forecasters in 2018. For that year, 90% of the dynamical HWFI and GFSI training sample was from reforecast data. That fraction was reduced to 75% for the 2019 model and 50% for the 2020 model, as fewer reforecasts were performed for recent years. No reforecasts were available for EMXI. A large sample of reforecasts for SHIPS and LGEM are done each year, so all the input from those two models was from reforecasts.
Beyond the SHIPS-RII and DTOPS, additional probabilistic RI guidance has been available to forecasters, either through the web (e.g., the RIPA model of Knaff et al. [19] or experimental machine learning models run as part of the Joint Hurricane Testbed), but these were not validated as part of this study because they were not consistently available to NHC forecasters.
3.2. Verification Results
3.2.1. Deterministic Models
Table 5 shows the annual average counts of NHC official forecasts over sequential 5-yr periods for the Atlantic and eastern North Pacific basins, including the number of cases involving RI at three different thresholds. Note that, even with 5-yr periods, the samples were small, and not surprisingly, there was considerable variability in the number of RI cases. For example, the annual average number of Atlantic RI cases for the 24-h threshold was about 9 for 1986–1990 and 2011–2015 but nearly 25 for 2016–2020. From Table 5, it can also be seen that RI is more common in the eastern Pacific than it is in the Atlantic. Over the entire period, RI occurred in 8.9, 6.9, and 6.4% of the Pacific cases for the three thresholds shown but in only 6.3, 4.3, and 5.2% of the Atlantic cases.
The SHIPS model was available for the longest continuous period (1991–2020), although it changed considerably over that period. Figure 1 shows the evolution of the POD for SHIPS. For the Atlantic, the POD was very low for all three RI thresholds for the entire 30 years. SHIPS never correctly forecast RI in the Atlantic for the 55 kt/48 h and 65 kt/72 h thresholds but did begin to show some very limited capability to forecast RI during the most recent 5-yr period, with a POD of about 3%. The corresponding FAR for 2016–2020 was 33% (not shown). In contrast, SHIPS began to show the ability to forecast RI for the eastern Pacific as early as the late 1990s, with the POD increasing to near 20% by 2016–2020. For the eastern Pacific thresholds with a non-zero POD in Figure 1, the corresponding FAR values for SHIPS were between 18 and 50%, with the exception of the 2011–2015 sample for the 65 kt/72 h threshold, where it was 63%. The LGEM model results (not shown) were qualitatively similar to those for SHIPS, indicating that the statistical–dynamical models are starting to show some limited ability to explicitly predict RI, at least in the eastern North Pacific where RI is more common.
To illustrate the time evolution of regional hurricane model RI forecast errors, a representative model was chosen for each 5-yr period based on the availability shown in Table 2. GFDI became available in 1996, but the late version GFDL was run beginning in 1992 for the Atlantic and in 1993 for the eastern Pacific. Thus, the GFDL model was selected to represent the period 1991–1995 and the GFDI for the next two 5-yr periods. Beginning in 2007, HWFI became available and generally had better RI verification statistics than GFDI, so it was selected for the rest of the 5-yr intervals through 2020. HMNI became available in 2017 but did not perform as well as HWFI and had a smaller sample, so it was not used as a representative regional hurricane model in the results below.
Figure 2 shows the Atlantic basin POD and FAR for the regional hurricane models. For the 30 kt/24 h threshold, the GFDL model had a POD of about 20%, which was a big improvement over SHIPS, which did not forecast RI at all during that period. However, the FAR was about 90%, meaning that when the GFDL forecast RI, there was only about a 10% chance that it would occur. The GFDL also sometimes forecast RI at the other two thresholds but never correctly (since the POD was 0% and the FAR was 100%). Thus, although the GFDL could sometimes forecast RI during that early period, those predictions were not useful. The original GFDL did not include ocean coupling, had fairly coarse resolution and parameterized convection (Bender et al. 2019), which probably contributed to the high FAR. As the model was upgraded, the POD and FAR values somewhat improved. By 2005, the POD values had increased to between 10% and 20%, but the FAR was still generally too high for the forecasts to be useful.
When HWFI was introduced in 2007, the POD values in Figure 2 were less than those of GFDI/GFDL, but the FAR values were also lower for the first two RI thresholds. For the most recent period (2016–2020), the POD for the first two thresholds were about 10%, with FAR values of 40% to 50%, suggesting that the HWFI now has some limited utility for RI forecasting in the Atlantic.
Figure 3 shows the evolution of regional hurricane model POD and FAR for the eastern North Pacific, results that are qualitatively similar to those for the Atlantic. When the GFDL model was introduced in the early 1990s, it had very high FAR values. By 2005, GFDI had a POD of about 20% and a FAR less than 50% for the middle RI threshold, suggesting some forecast utility. For the initial HWFI period (2006–2010), the POD and FAR were somewhat similar to the GFDI results from the previous period but then decreased to near zero in the subsequent five years. At the present time, HWFI has POD values of about 10% and FAR values of 40–50%, indicating some utility. It is interesting to note that the regional hurricane model performance for RI is fairly similar across the two basins, unlike the statistical models, which performed much better in the eastern Pacific.
POD and FAR were also calculated for the global GFSI model, with the late version used for 1991–1995 due to availability. For the Atlantic, the POD was zero for all thresholds and time periods except 2016–2020, when it was 1% for the 30 kt/24 h threshold (not shown). The corresponding FAR values were zero for all time periods except 1996–2000, when it was 100% for one RI threshold. The results were a little better for the eastern Pacific (not shown) with POD values ranging from 2 to 7% for the most recent 5-yr period (not shown), with FAR values less than 50%. Thus, the GFSI had no ability to forecast RI until recently, when it had some marginal utility. This result is not surprising since the resolution of the GFS did not approach what was needed to represent the inner core of tropical cyclones until very recently.
The equally weighted consensus models (ICON/IVCN) in the Atlantic had behavior similar to the GFSI, with zero POD for all time periods and thresholds, except 2016–2020 for 30 kt/24 h where it was 3% (not shown). As will be described in Section 3.3, the consensus includes the statistical DSHP and LGEM models that generally have very low POD values for the Atlantic, so it is not surprising that the consensus also has a low POD. Also, the equal weighting of multiple models will reduce the maximum intensity change predicted by any individual member. IVCN had somewhat better performance for the east Pacific in the most recent 5-yr period, with POD values up to about 10% and FAR values 30% or less. The corrected consensus HCCA performed much better than IVCN, with POD values up to 10% for the Atlantic and up to 30% for the eastern Pacific with FAR values of about 40% or less.
To provide a summary of the current RI forecast accuracy, Table 6 shows the POD and FAR from the deterministic models that were available in the most recent 5-yr period, 2016–2020. ICON was excluded because of its similarity to IVCN. In the Atlantic basin, all the models had non-zero POD and FAR values of 50% or less for the 30 kt/24 h threshold. However, the PODs for all but the HWFI and HMNI were less than 10%. For the 55 kt/48 h threshold, only HWFI and HCCA had non-zero PODs and FARs of 50% or less, and no model satisfied those two conditions for the 65 kt/72 h threshold. These results indicate that the deterministic regional hurricane models HWFI and HMNI are best for RI forecasting in the Atlantic, but the PODs are still low.
The eastern Pacific data in Table 6 show that nearly all the models have non-zero PODs and FARs less than 50% for all three RI thresholds, and the PODs are nearly all higher than for the Atlantic. The HCCA and SHIPS models are the best performers, although the maximum POD is still only 31%. One important result is that the POD values for HCCA are two to four times higher than those of IVCN, highlighting the usefulness of the corrected consensus approach.
Table 6 also shows POD and FAR for the NHC official forecasts, which will be discussed in more detail in Section 3.2.3.
3.2.2. Probabilistic Models
The skill of the operational SHIPS-RII forecasts was evaluated using the BSS defined in Section 2. To compute BSS, the BS of both the specified SHIPS-RII model (BSmod) and climatology (BSref) must first be computed. For this study, the value of Fi in Equation (2) was the RI probability forecast by the specified SHIPS-RII model, while the Fi value used to evaluate BSref was the climatological frequency of RI for the corresponding RI threshold and basin (Table 7). Following the methodology described in Kaplan et al. 2010, all 6-hourly SHIPS-RII model forecasts for systems where the center remained over water and were a tropical or subtropical cyclone for the entire RI threshold interval based in the final best track were verified.
To assess trends in SHIPS-RII forecast skill (Figure 4), we focused on the two RI thresholds with the longest records: 30 kt/24 h and 25 kt/24 h. As with the deterministic verifications presented earlier, 5-yr samples were constructed due to the relatively small number of RI cases annually, although here, we allowed the samples to overlap such that a new 5-yr sample was constructed for each year. As before, results are presented for the ending year of each multi-year sample. The gap in the evaluation for the 30 kt/24 h threshold is due to the absence of forecasts for this threshold from 2005–2007 (the SHIPS-RII did include the 30 kt/24 h threshold for those three years). We did, however, include in Figure 4 an evaluation for 2004 that represents a 4-yr sample (2001–2004). Finally, when both the SHIPS-RII-T and SHIPS-RII-LDA were available to forecasters for 2006–2007, the SHIPS-RII-LDA forecasts from those years were used here (the skill of the two models was comparable in each basin for those years).
Figure 4 suggests that the SHIPS-RII was more skillful for the 25-kt RI threshold than for the 30-kt threshold for the first few years when both were available, although at the present time, the two thresholds have roughly equal skill. The large drop of skill in the middle part of the last decade was driven largely by the individual seasons of 2011 and 2013 (which had only one case of 30-kt RI between them) that had particularly low BSSs. When RI rates are unusually low, BSref in Equation (3) can become very small, potentially producing large negative values of BSS. After the introduction of the enhanced version of the SHIPS-RII in 2016 [18], skill rapidly increased for both thresholds. Nevertheless, the skill of the SHIPS-RII in the Atlantic is still limited, underscoring the difficulty of predicting RI in that basin.
Current Atlantic basin skill levels for each of the operational SHIPS-RII versions are shown in Figure 5 for the most recent 5-yr period, 2016–2020. It can be seen that, on average, each model exhibited some skill for each RI threshold. The consensus version of the model has the most skill, a result consistent with the work of Rozoff and Kossin [20].
A reliability diagram is another useful way to assess probabilistic model guidance [16]. For the same sample, Figure 6 shows the Atlantic basin reliability and refinement distributions of the four current SHIPS-RII versions for the 30 kt/24 h threshold. In general, the reliability of the various models was fair, with perhaps the most notable result being that RI probabilities >50% were rarely forecast. Among the individual model versions, the SHIPS-RII-LDA had the characteristic shape of a somewhat underconfident forecast, with a slightly steeper slope than the perfect reliability line (in an underconfident forecast, the model rarely predicts extremes, and verifying probabilities vary more strongly than forecast probabilities). In contrast, the SHIPS-RII-LR appears to be overconfident, at least for forecasts below 60% (in an overconfident forecast, the model predicts variability that does not tend to verify, resulting in a relatively flat slope in the reliability diagram). Overall, the models tended to have an under-forecast bias (RI occurs more often than forecast), with this being particularly pronounced for the consensus version at moderate to high forecast probabilities.
The overall biases Bp computed from Equation (1) of the SHIPS-RII-LDA, SHIPS-RII-LR, SHIPS-RII-B, and SHIPS-RII-C forecasts were 1.28, 0.93, 0.40, and 0.87, respectively. A Bp of 1 indicates no bias, while Bp > 1 indicates that the model probabilities were higher than what was observed. The better performers by this measure were the SHIPS-RII-LR and SHIPS-RII-C. That the consensus version had relatively little overall bias despite a pronounced under-forecast bias above 40% can be attributed to the small number of forecasts at those probabilities. The high bias for the SHIPS-RII-LDA stems from its large number of over-forecasts at probabilities less than 20%. Conversely, the SHIPS-RII-B strongly under-forecasts RI in this part of the reliability diagram, resulting in the worst overall bias of the group. It is worth noting that the high bias of the SHIPS-RII-LDA has decreased in recent years (not shown).
Trends in skill for the eastern North Pacific are shown in Figure 7. Comparison with Figure 4 shows that the BSSs in this basin have been appreciably higher than in the Atlantic for both thresholds. Differences in skill between the two RI thresholds have diminished over the past decade, which was also observed for the Atlantic. Skill increases in the eastern North Pacific basin have been steady.
Current eastern Pacific basin skill levels for each of the operational SHIPS-RII versions are shown in Figure 8 for the most recent 5-yr period 2016–2020. The various versions of the model were generally skillful (except for SHIPS-RII-B for the 72-h threshold). In contrast to the Atlantic basin results (Figure 5), the skill of the consensus outperformed the best individual model only for the lower RI thresholds because of the poor performance of SHIPS-RII-B for the higher RI thresholds. Comparison with Figure 5 also shows that eastern Pacific BSSs were consistently higher than the corresponding Atlantic basin scores. Figure 8 also shows that the 40 kt/24 h threshold had the least skill. That was also true to a lesser extent for the Atlantic in Figure 5. Table 7 shows that the 40 kt/24 h RI is the least common of the RI definitions in both basins, so it is further out on the tail of the distribution and more difficult to predict.
Figure 9 shows the 2016–2020 eastern North Pacific basin reliability and refinement distributions of the four current SHIPS-RII versions for the 30 kt/24 h threshold. In general, the overall reliability of the model forecasts was fair. Comparison with the refinement distributions in Figure 6 shows that the models (particularly SHIPS-RII-LDA) were more aggressive forecasters of RI in the eastern Pacific, and it is this capability that likely explains the higher overall BSSs for this basin. The eastern Pacific biases of the individual models were quite similar to what was observed for the Atlantic: Bp for SHIPS-RII-LDA, SHIPS-RII-LR, SHIPS-RII-B, and SHIPS-RII-C were 1.33, 0.88, 0.45, and 0.89, respectively.
A verification of DTOPS is shown in Figure 10, using the same climatology that was used to verify the SHIPS-RII models. DTOPS became operational in 2018, so only the 3-yr sample 2018–2020 is available for verification. SHIPS-RII forecasts for the same sample are included for comparison. DTOPS performed well relative to SHIPS-RII at most thresholds and was the highest scoring model for four of the eight thresholds in the Atlantic basin and for six of the eight thresholds in the eastern Pacific basin. It was also the worst performing model at two thresholds in the Atlantic. It is not entirely clear why DTOPS performed poorly at the 40 kt/24 h and 65 kt/72 h thresholds, although these were the two thresholds with the fewest number of RI occurrences since 2018. It may take a few more years of real-time evaluation to determine if this is an artifact of the small number of verification points. The generally good DTOPS performance shows that the deterministic models contain useful RI information even though their POD values are generally fairly low when used directly to forecast RI, as was shown in Section 3.2.1.
3.2.3. NHC Official Forecasts
Section 3.2.1 and Section 3.2.2 summarized the ability of NHC’s intensity models to provide RI guidance since the first intensity models were introduced in 1991. NHC forecasters used that guidance as input to their subjective intensity forecasts. In this section, the NHC official forecasts (OFCL) are examined to determine how those forecasts changed over time with regard to RI prediction. Figure 11 shows the bias (Bd) for 5-yr periods starting in 1986 (1988 for the eastern Pacific) to illustrate how often the OFCL forecasts include RI. At the end of the 1980s, there was no objective guidance available other than the simple climatology and persistence SHIFOR model. For the 5-yr period ending in 1990, the OFCL forecast included 30 kt/24 h or larger increases in the Atlantic only about 20% as often as it actually occurred. The FAR during that period was 67% (not shown), indicating that when OFCL included RI, it was usually wrong. When the SHIPS and GFDL intensity guidance became available for the 1991–1995 period, the forecasters were less likely to predict RI for the 30 kt/24 h threshold, as indicated by a bias of less than 10% through 2000. This is perhaps not surprising since as shown above, SHIPS almost never forecast RI and the GFDL had a very high FAR. However, other factors, such as the introduction of the ATCF in 1989, which allowed forecasts to be issued an hour earlier, and differing samples, may have contributed to the lack of RI forecasts in the early 1990s. The SHIPS-RII first became available in 2001, and the bias increased to about 20% for all 5-yr periods except 2011–2015, when the number of RI cases per year was the lowest of any of the 5-yr periods (Table 5). The Atlantic OFCL 30 kt/24 h RI forecasts during 2001–2005 had FAR values of 60% or greater (not shown), too high to consider the forecasts useful. Starting in 2006–2010, however, the FAR values became 50% or less. That improvement corresponded with the improved SHIPS-RII and the introduction of HWFI. For the other RI thresholds, the biases were zero or very small until 2016–2020, and the POD (not shown) was zero for all time periods for all but the most recent 5-yr period.
The bias trend of the OFCL forecasts for the eastern Pacific is qualitatively similar to that for the Atlantic, with significant improvements starting with the 2006–2010 sample. However, the east Pacific bias values were much larger (noting that when the bias value is less than 100%, an increase is an improvement) than those for the Atlantic for all three RI thresholds, consistent with the better performance of the deterministic and probabilistic guidance. The FAR values for the 30 kt/24 h RI threshold were above 50% for the first two time periods (not shown) but became less than 50% starting with the last half of the 1990s, which was a decade earlier than for the Atlantic.
Table 6 shows the POD and FAR of the OFCL forecasts for the most recent 5-yr period, 2016–2020. The POD and FAR values are comparable with the best of the guidance models for each of the RI thresholds, indicating that the forecasters are taking advantage of the guidance. The POD values for the 30 kt/24 h period are much larger than those reported by Trabing and Bell (2020) for 1989–2018, indicating forecast improvement. Also consistent with the guidance, only the first two RI thresholds for the Atlantic OFCL forecasts had a non-zero POD and a FAR of 50% or less, and the POD for the 55 kt/48 h threshold was very small (3%). Table 6 also shows that the NHC intensity forecasts for and during RI still have considerable room for improvement, with a maximum POD of only 14% and 35% for the Atlantic and eastern Pacific, respectively.
3.3. A new HFIP Performance Measure for RI
The most recent strategic plan issued by the Hurricane Forecast Improvement Project (HFIP) [21] identified an updated set of comprehensive goals relating to forecast improvements, hazard guidance, and risk communication. Included in this set of goals was the desire to improve forecast guidance errors during RI events by 50% relative to (then) present values. How progress was to be specifically measured, however, was left unanswered by the strategic plan. A special session was held at the HFIP annual review meeting in November of 2019 (see hfip.org for the agenda) to decide on the form of the metric, and this section documents the results of that meeting.
Ideally, a new performance metric would both have a strong link to forecast operations and be easy to communicate to the non-scientists responsible for program funding. This latter consideration led the program away from probabilistic-based measures, such as POD, FAR, Brier score, and the like used in Section 3.2 above, in favor of the more traditional verification measures regularly produced by NHC and communicated to policy makers. In addition, the probabilistic- and deterministic-based measures required multi-year samples to obtain stable statistics, making it more difficult to track annual progress. Recognizing the high correlation that exists between the NHC official forecast and the model consensus, the program decided that the HFIP performance measure should be based on the operational intensity consensus IVCN, the most recent version of which comprises DSHP, LGEM, HWFI, and CTCI.
There are a number of reasonable ways to define the sample of RI events for which IVCN would be evaluated. One obvious option is the set of forecast lead times (i.e., 12, 24, 36, 48 h, etc.) for which an intensity increase of 30 kt or more occurred over the previous 24 h in the cyclone’s best track. Such a sample, however, suffers from an important drawback in that it discards all the false alarms and would artificially favor the most aggressive approaches that forecast RI frequently but incorrectly. An alternative, and the one chosen by HFIP, is to supplement the sample of actual RI occurrences with those forecast lead times when RI was forecast to occur. By considering cases in which RI was either occurring or forecast, a model would be penalized for being either too conservative or too aggressive. From an operational perspective, a performance measure that considers both types of errors will be of greater value to forecasters who must gauge the credibility of a forecast of RI when one is presented to them and before the forecaster can know whether or not RI is actually going to occur. Adding cases where RI was forecast also would potentially help alleviate issues with small sample sizes, as discussed in Section 3.1.
With these considerations in mind, HFIP defined its performance measure for RI as the mean absolute error of the IVCN consensus for the Atlantic and eastern Pacific basins combined, evaluated for those verification times that satisfied one or both of the following criteria:
- A 30-kt or larger increase in the best-track intensity, relative to the best-track intensity 24 h prior to the verification time;
- A 30-kt or larger forecast increase in intensity in IVCN or in any of the IVCN member models, relative to the forecast intensity 24 h prior to the verification time.
For the remainder of this section, the term “RI event” refers to a time that satisfies either of the criteria mentioned above.
Unlike most HFIP performance measures, which are based on Atlantic basin statistics, the rarity of RI events argued for a combined Atlantic/eastern Pacific evaluation to increase the sample size; this is discussed further below. Additionally, it should be noted that, because RI is assessed relative to the intensity 24-h prior, no evaluations are conducted for 12-h forecasts. Finally, we note that the standard NHC verification rules (e.g., system must be a TC at the initial and verifying times, etc.) apply here as well.
With a performance measure in hand, a baseline sample for the period 2015–2017 was defined to represent the then current state of the art. One complication in performing the baseline verification was that the historical membership of IVCN at any particular forecast time was not recorded operationally nor readily determined after the fact, and the sample definition required checking each member’s forecast for occurrences of RI. Furthermore, the nominal composition of IVCN changed over the three years of the baseline period. For these reasons, the baseline errors were determined from an after-the-fact recomputed version of IVCN comprising any model used in the operational IVCN at any time during the baseline period; these models were DSHP, LGEM, GHMI, HWFI, and CTCI, where GHMI is an alternate form of the early GFDL model using a different interpolation method.
The values of the HFIP RI baseline are presented in Table 8 and Figure 12. It was seen that IVCN’s ability to predict RI was only weakly dependent on forecast lead time; the errors were high even at 24 h (26 kt) and quickly saturated. In terms of skill relative to climatology/persistence, a peak was seen from 72–96 h but skill was minimal throughout the 5-day forecast period. It is worth noting that the target MAE errors in Table 8 are still large relative to the inherent uncertainty in the best track [22], suggesting that forecast improvements, should they occur, would be readily detectable.
Historical values of the HFIP RI performance measure over the past two decades are shown in Figure 13. To construct this diagram, IVCN forecasts were regenerated using the nominal members of NHC’s operational intensity consensus for each season; the annual composition of the regenerated IVCN forecasts since 2001 is given in Table 9. The annual average errors show a large amount of year-to-year variability, due in part to the relatively small sample sizes. For example, at 72 h, the annual sample sizes range from 2–43 cases. At 24 h, the samples are larger, ranging from 17–103 cases. Despite the scatter, a downward trend in the forecast errors for these RI cases is evident at 48 and 72 h. While the 24-h errors are essentially flat over the period, there does appear to have been a reduction in forecast errors over the past few seasons. The 24-h forecasts rely more heavily on persistence of recent trends and less on model forecasts, which may partially explain the smaller reduction in the 24-h error. Comparison of the 2015–2017 baselines to the subsequent three years 2018–2020 is encouraging: at 24 h the baseline error (26.1 kt) was reduced by 27% (to 19.1 kt), at 48 h the baseline error (31.4 kt) was reduced by 19% (to 25.5 kt), and at 72 h the baseline error (36.9 kt) was reduced by 23% (to 28.5 kt).
Figure 14 shows the historical IVCN annual average errors for the entire sample of intensity forecasts (RI and non-RI cases). With hundreds of forecasts annually, there is far less year-to-year variability than for the much smaller RI sample. Not surprisingly, the mean errors for all forecasts are much smaller than the RI event errors, clustering near 10 kt in recent years at all time periods, reinforcing NHC’s oft-stated view that improvement of RI forecasting remains a key operational need. While each of the trend lines shows improvement, there has been more improvement at 48 and 72 h than at 24 h.
Comparing the slopes of the trend lines in Figure 14 with those in Figure 13 shows that the rate of improvement for the RI cases is slightly greater than for the total sample at 48 and 72 h. In contrast, the slope is essentially flat at 24 h for the RI sample, while there is some improvement for the total sample. This result indicates that the IVCN forecasts improved more for the RI cases than for the total sample at 48 and 72 h. However, the RI sample forecast errors are much larger than for the total sample. Dividing the 20-yr improvement based on trend line by the average error value in the 20-yr sample shows that, for the RI sample, the forecasts improved by about 1.2% and 1.3% per year at 48 and 72 h, respectively. For the total sample, the rates of improvements were 2.2% and 1.7%, respectively. Thus, the RI forecasts were improving at a slower rate than for the total sample.
Because forecasters can make use of information other than just the models comprising IVCN (e.g., probabilistic guidance or storm structure as revealed by satellite or reconnaissance data), for context, it is also helpful to examine trends in NHC official forecast errors. Figure 15 shows the historical performance of the NHC official forecast during RI events. Comparison of Figure 13 and Figure 15 shows that the official forecasts have less variance than the intensity consensus, have slightly lower errors than the consensus in recent years, and show larger net improvements over the 20-yr period. These final two observations suggest that today’s forecasters are adding value to IVCN either through their own expertise or by taking advantage of additional, external information beyond what is available in IVCN.
It should be acknowledged that this particular RI performance measure was chosen by HFIP to assess programmatic progress over time in a manner most useful to forecasters; however, it does not answer every question one might have about RI performance and for which other diagnostics might be more appropriate. For example, the new performance measure is applicable only to deterministic models and therefore cannot measure progress in probabilistic approaches such as SHIPS-RII or DTOPS. In addition, while the new measure can be applied to any individual deterministic model to assess its improvement over time, the sample selection rules are not ideal for conducting relative performance rankings among a set of models, because the sample would need to include cases where any of the models forming the homogeneous sample forecast RI. Third, those interested in knowing specifically how models perform only when RI actually occurred will find the selected measure too expansive. Finally, if there are important differences in model performance across basins, this measure will blur those distinctions.
To this last point, Table 10 illustrates why the rarity of RI events requires the combination of the Atlantic and eastern Pacific samples. For the 3-yr baseline sample of 2015–2017, the Atlantic had only 77 cases at 24 h and fewer than 30 beyond 72 h. Trying to assess year-to-year progress is even harder: there were fewer than 10 Atlantic cases in 2015 from 48 h onward and none at all at 4 and 5 days.
Combining the two basins greatly increases the chance of diagnosing any model improvements that might be occurring. Furthermore, the two basins’ samples tend to be complementary; an active Atlantic season can compensate for an inactive eastern Pacific season and vice versa. In 2015, for example, the Atlantic sample was very small, and the east Pacific supplied most of the cases, while in 2017, the Atlantic provided the majority of the total cases. In general, Table 10 shows that the east Pacific provides a majority of cases at the shorter forecast times while the Atlantic provides the majority of cases at the longer lead times (due to the tendency of eastern Pacific TCs to reach cold water within several days of forming).
Including cases for which RI was forecast only modestly contributes to the baseline sample, because RI is currently not forecast very often. At 48 h, for example, 145 of the 181 cases represent cases where RI actually occurred. It seems likely that, in the future, model forecasts of RI will become more common. If this occurs, it will be essential for forecasters to know whether the additional forecasts of RI are helping or hurting.
4. Discussion
The NHC operational TC intensity guidance models were briefly reviewed and evaluated, starting with the 1991 season when SHIPS first became available. Three RI definitions were considered in most of the verifications (intensity increases ≥30 kt/24 h, ≥55 kt/48 h, and 65 kt/72 h). Deterministic intensity forecast models evaluated here were the statistical–dynamical SHIPS and LGEM models; the GFDL, HWRF, and HMON regional hurricane models; and the global GFS model. Consensus models comprised the equally weighted ICON and IVCN and the variably weighted HCCA models. Probabilistic guidance evaluated included a simple threshold method, the discriminant analysis, logistic regression and Bayesian versions of the SHIPS-RII, and a new technique that combines deterministic and probabilistic approaches (DTOPS). The consensus of the three components of the SHIPS-RII was also included. The deterministic models were evaluated using probability of detection (POD), false alarm ratio (FAR), and bias, while the probabilistic models were evaluated using Brier skill score (BSS), bias, and reliability diagrams. The verifications were performed using 5-yr samples from the North Atlantic and eastern North Pacific basins.
The evaluations showed that none of the deterministic models had RI forecast utility from 1991 to about 2015, a result of very low POD, very high FAR, or both. Some ability to forecast RI has emerged since 2015, with the dynamical HWRF and HMON models being the best guidance for the Atlantic and the statistical HCCA and SHIPS models providing the best RI guidance for the eastern Pacific. The dynamical COAMPS-TC model was not evaluated due to sample size limitations, but its recent improvements the past few years for the full sample of cases [1] suggest it may also have some utility for RI prediction. Even though some progress has been made, the deterministic models still have a long way to go for RI prediction, as the POD value for best model in 2016–2020 was only 21% for the Atlantic and 31% for the eastern Pacific, with corresponding FAR values of 50% and 43%.
The probabilistic SHIPS-RII first became available for the Atlantic in 2001 and had BSSs up to about 10% through 2010, indicating some marginal skill. For the next five years the BSS was generally negative, indicating a lack of skill. This corresponded to a period of unusually low RI activity in the Atlantic. The SHIPS-RII had a major upgrade in 2016 when two new statistical methods were added, allowing for a three-member consensus, and new RI thresholds were added. Since 2016, the Atlantic SHIPS-RII was more skillful, with BSS values between 15 and 20%. The eastern Pacific SHIPS-RII first became available in 2005 and was skillful for all 5-yr periods since then. The BSS showed steady improvement, with values of about 10% in the early periods and 20–25% in the most recent 5-yr period. The DTOPS model first became available to forecasters in 2018. Results for 2018–2020 showed that it had the highest BSS values among any of the components of the SHIPS-RII or its consensus for more than half of the eight RI thresholds included in the Atlantic and east Pacific RII guidance.
To help overcome the limitations of small sample sizes when using probability-based statistics, such as POD and FAR, a new programmatic RI metric was introduced by HFIP. The new metric uses the traditional mean absolute error (MAE) but restricts the sample to only those cases where RI (as defined by the 30 kt/24 h threshold) occurred in the verifying best track or in any member of NHC’s equally weighted consensus model (IVCN) in the 24-h period ending at the verification time. To increase the sample size, the Atlantic and eastern Pacific cases are combined. The MAE for IVCN for the cases with observed or forecast RI is then the measure of RI forecast error. This new metric will be used by HFIP to track progress in RI forecasting, with 2015–2017 designated as the baseline period. Results from applying the new metric to 2018–2020 are encouraging and show that the IVCN for the RI sample improved by 27, 19, and 23% at 24, 48, and 72 h, respectively, relative to the 2015–2017 baseline.
Although designed to track RI progress for HFIP using IVCN, the new metric could also be evaluated for other forecasts, such as those from individual deterministic models. The metric was applied to the NHC official forecasts since 2000, and results showed that the rate of improvement was greater than for IVCN, especially for the 24-h forecasts. This result suggests that the NHC forecasters are taking advantage of other forecast guidance, such as the probabilistic RI models, in addition to the deterministic intensity guidance.
To get a feel for how the improved RI guidance influenced the NHC official forecasts, the bias of the NHC forecasts was calculated for each 5-yr period starting in 1986 before any intensity guidance was available other than climatology and persistence. Atlantic results showed that the bias was 20% in 1986–1990, but the corresponding FAR was 67%. Thus, with no intensity guidance available, the OFCL forecasts did sometimes include RI, but it was usually wrong. The SHIPS and GFDL intensity guidance became available in the early 1990s, but the SHIPS model never forecasted RI, and the GFDL model had a very high FAR. With new intensity guidance that was not reliable for RI forecasting, the bias of the OFCL forecast decreased to less than 10% for the next 10 years, suggesting that forecasters were more reluctant to predict RI than without any guidance. When the SHIPS-RII became available and HWRF was introduced, the bias of the OFCL forecast increased to about 20% for the 30 kt/24 h RI threshold, indicating that forecasters began to have enough confidence to forecast RI more often. For the most recent 5-yr period (2016–2020), the corresponding FAR values of the OFCL forecasts were below 50%, indicating forecast utility. The results for the eastern Pacific were similar but with better bias values. For the most recent 5-yr period for the 30 kt/24 h threshold, the OFCL forecast bias was 50% with a FAR of about 30%. Additionally, OFCL forecast improvement began about five years earlier than for the Atlantic, consistent with the more accurate RI guidance for that basin. These results suggest that the improved RI guidance translated into improved NHC forecasts of RI.
Although the guidance models and NHC forecasts are beginning to show some ability to forecast RI, especially within the past five years, there is still considerable room for improvement. The best OFCL RI forecasts were for the eastern Pacific for the 30 kt/24 h threshold for the 2016–2020 sample, but they only had a POD of 35%. The best POD for the Atlantic OFCL was only 13%. Future improvements will likely come from continued progress with such regional dynamical models as HWRF, HMON and COMAPS-TC, and global model improvements. Also on the near horizon is the Hurricane Analysis and Forecast System (HAFS), which is the next generation NCEP hurricane forecasting system [23], which will include nested domains within a global model and may replace the HWRF and HMON in the longer term.
The relative success of HCCA and DTOPS for RI prediction indicates that statistical-post processing of the deterministic forecast models also has promise for improved RI forecasting. For example, if the intensity forecasts from a model are highly correlated with observed intensity change but have incorrect magnitudes, then the post-processing can improve their utility for RI prediction by correcting the biases to better take advantage of the model’s ability to distinguish between intensification rates. These techniques can be improved in a number of ways, including the addition of new forecast model input, such as HAFS, and including input from ensemble systems. For example, Torn and DeMaria [24] showed that, when bias correction methods were applied to the experimental HWRF and HMON ensemble forecast systems, they can provide reliable intensity forecasts and have some limited ability to forecast RI.
All of the NHC’s operational statistically based RI guidance uses fairly simple statistical methods, such as multiple linear regression, linear discriminant analysis, and logistic regression. A very active area of research is the application of machine learning techniques to meteorological forecasting, including TC prediction. For example, studies by Cloud et al. [25] and Su et al. [26] showed that neural network methods can provide more accurate predictions of TC intensity change, including RI, than current operational guidance. If those results prove to be robust in an operational setting, that will lead to further improvements in operational RI prediction.
Author Contributions
Conceptualization, M.D.; methodology, all; software, all; analysis of deterministic guidance, M.D.; analysis of SHIPS-RII, J.K.; analysis of DTOPS, M.J.O.; analysis of RI metric, J.L.F.; writing—original draft preparation, all; writing—review and editing, J.L.F.; visualization, J.L.F. All authors have read and agreed to the published version of the manuscript.
Funding
This work was supported by the National Oceanic and Atmospheric Association (NOAA) Hurricane Forecast Improvement Program, the NOAA Joint Hurricane Testbed, and NOAA base funding to the National Hurricane Center and Atlantic Oceanographic and Meteorological Laboratory.
Institutional Review Board Statement
Not applicable.
Informed Consent Statement
Not applicable.
Data Availability Statement
The deterministic model forecasts and best track intensity values for the verification are available in standard Automated Tropical Cyclone Forecast (ATCF) format from the National Hurricane Center public-facing ftp server at ftp.nhc.noaa.gov/atcf. The probabilistic forecasts are available in csv format upon request from the first author.
Acknowledgments
The authors thank Michael Brennan, John Cangialosi, Edward Rappaport, and David Zelinsky from the National Hurricane Center and Ben Trabing and Alan Brammer from CIRA for their valuable comments on the manuscript.
Conflicts of Interest
The authors declare no conflict of interest. The funders had no role in the design of the study; in the collection, analyses, or interpretation of data; in the writing of the manuscript, or in the decision to publish the results.
References
- Cangialosi, J.P.; Blake, E.; DeMaria, M.; Penny, A.; Latto, A.; Rappaport, E.; Tallapragada, V. Recent Progress in Tropical Cyclone Intensity Forecasting at the National Hurricane Center. Weather Forecast. 2020, 35, 1913–1922. [Google Scholar] [CrossRef]
- DeMaria, M.; Mainelli, M.; Shay, L.K.; Knaff, J.A.; Kaplan, J. Further Improvements in the Statistical Hurricane In-tensity Prediction Scheme (SHIPS). Weather Forecast. 2005, 20, 531–543. [Google Scholar] [CrossRef] [Green Version]
- DeMaria, M. A Simplified Dynamical System for Tropical Cyclone Intensity Prediction. Mon. Weather Rev. 2009, 137, 68–82. [Google Scholar] [CrossRef] [Green Version]
- Tallapragada, V. Overview of the NOAA/NCEP operational hurricane weather research and forecast (HWRF) modelling system. In Advanced Numerical Modeling and Data Assimilation Techniques for Tropical Cyclones; Springer: Dordrecht, The Netherlands, 2016; pp. 51–106. [Google Scholar] [CrossRef]
- Kieu, C.; Evans, C.; Jin, Y.; Doyle, J.D.; Jin, H.; Moskaitis, J. Track Dependence of Tropical Cyclone Intensity Forecast Errors in the COAMPS-TC Model. Weather Forecast. 2021, 36, 469–485. [Google Scholar] [CrossRef]
- DeMaria, M.; Sampson, C.R.; Knaff, J.A.; Musgrave, K.D. Is tropical cyclone intensity guidance improving? Bull. Am. Meteorol. Soc. 2014, 95, 387–398. [Google Scholar] [CrossRef] [Green Version]
- Simon, A.; Penny, A.B.; DeMaria, M.; Franklin, J.L.; Pasch, R.J.; Rappaport, E.N.; Zelinsky, D.A. A description of the re-al-time HFIP Corrected Consensus Approach (HCCA) for Tropical Cyclone Track and Intensity Guidance. Weather Forecast. 2018, 33, 37. [Google Scholar] [CrossRef]
- Trabing, B.C.; Bell, M.M. Understanding error distributions of hurricane intensity forecasts during rapid intensity changes. Weather Forecast. 2020, 35, 2219–2234. [Google Scholar] [CrossRef]
- Na, W.; McBride, J.L.; Zhang, X.-H.; Duan, Y.-H. Understanding biases in tropical cyclone intensity forecasting. Weather Forecast. 2018, 33, 129–138. [Google Scholar] [CrossRef]
- Kaplan, J.; DeMaria, M. Large-Scale Characteristics of Rapidly Intensifying Tropical Cyclones in the North Atlantic Basin. Weather Forecast. 2003, 18, 1093–1108. [Google Scholar] [CrossRef] [Green Version]
- Rogers, R.F.; Reasor, P.D.; Zhang, J.A. Multiscale Structure and Evolution of Hurricane Earl (2010) during Rapid Intensification. Mon. Weather Rev. 2015, 143, 536–562. [Google Scholar] [CrossRef]
- Hendricks, E.A.; Peng, M.S.; Fu, B.; Li, T. Quantifying Environmental Control on Tropical Cyclone Intensity Change. Mon. Weather Rev. 2010, 138, 3243–3271. [Google Scholar] [CrossRef] [Green Version]
- Sampson, C.R.; Schrader, A.J. The Automated Tropical Cyclone Forecasting System (Version 3.2). Bull. Am. Meteorol. Soc. 2000, 81, 1231–1240. [Google Scholar] [CrossRef]
- Cangialosi, J. National Hurricane Center Forecast Verification Report: 2019 Hurricane Season. 2019. Available online: https://www.nhc.noaa.gov/verification/pdfs/Verification_2019.pdf (accessed on 1 March 2021).
- Bender, M.A.; Marchok, T.; Tuleya, R.E.; Ginis, I.; Tallapragada, V.; Lord, S.J. Hurricane Model Development at GFDL: A Collaborative Success Story from a Historical Perspective. Bull. Am. Meteorol. Soc. 2019, 100, 1725–1736. [Google Scholar] [CrossRef] [Green Version]
- Levine, R.A.; Wilks, D.S. Statistical Methods in the Atmospheric Sciences. J. Am. Stat. Assoc. 2000, 95, 344. [Google Scholar] [CrossRef]
- Kaplan, J.; DeMaria, M.; Knaff, J.A. A revised tropical cyclone rapid intensification index for the Atlantic and east Pacific basins. Weather Forecast. 2010, 25, 220–241. [Google Scholar] [CrossRef]
- Kaplan, J.; Rozoff, C.M.; DeMaria, M.; Sampson, C.R.; Kossin, J.P.; Velden, C.S.; Cione, J.J.; Dunion, J.P.; Knaff, J.A.; Zhang, J.A.; et al. Evaluating Environmental Impacts on Tropical Cyclone Rapid Intensification Predictability Utilizing Statistical Models. Weather Forecast. 2015, 30, 1374–1396. [Google Scholar] [CrossRef]
- Knaff, J.A.; Sampson, C.R.; Musgrave, K.D. An Operational Rapid Intensification Prediction Aid for the Western North Pacific. Weather Forecast. 2018, 33, 799–811. [Google Scholar] [CrossRef]
- Rozoff, C.M.; Kossin, J.P. New Probabilistic Forecast Models for the Prediction of Tropical Cyclone Rapid Intensification. Weather Forecast. 2011, 26, 677–689. [Google Scholar] [CrossRef]
- HFIP. 2018. Available online: http://hfip.org/sites/default/files/documents/hfip-strategic-plan-20190625.pdf (accessed on 1 March 2021).
- Landsea, C.W.; Franklin, J.L. Atlantic Hurricane Database Uncertainty and Presentation of a New Database Format. Mon. Weather Rev. 2013, 141, 3576–3592. [Google Scholar] [CrossRef]
- Hazelton, A.; Zhang, Z.; Liu, B.; Dong, J.; Alaka, G.; Wang, W. 2019 Atlantic hurricane forecasts from the Glob-al-Nested Hurricane Analysis and Forecast System: Composite statistics and key events. Weather Forecast. 2020. [Google Scholar] [CrossRef]
- Torn, R.; DeMaria, M. Validation of Ensemble-Based Probabilistic Tropical Cyclone Intensity Change. Atmosphere 2021, 12, 373. [Google Scholar] [CrossRef]
- Cloud, K.A.; Reich, B.J.; Rozoff, C.M.; Alessandrini, S.; Lewis, W.E.; Monache, L.D. A Feed Forward Neural Network Based on Model Output Statistics for Short-Term Hurricane Intensity Prediction. Weather Forecast. 2019, 34, 985–997. [Google Scholar] [CrossRef]
- Su, H.; Wu, L.; Jiang, J.H.; Pai, R.; Liu, A.; Zhai, A.J.; Tavallali, P.; DeMaria, M. Applying Satellite Observations of Tropical Cyclone Internal Structures to Rapid Intensification Forecast with Machine Learning. Geophys. Res. Lett. 2020, 47, 10. [Google Scholar] [CrossRef]
Figure 1.
RI Probability of Detection (POD) for the SHIPS model from 1991–2000 for the Atlantic basin and from 1996–2020 for the eastern North Pacific basin for each of the three RI thresholds, 30 kt/24 h, 55 kt/48 h, and 65 kt/72 h. Each point on the diagram represents a five-year sample of forecasts ending at the year indicated (e.g., the 2016–2020 sample is shown at 2020).

Figure 2.
Atlantic basin POD (green) and FAR (red) for representative regional hurricane models for each of the three RI thresholds, 30 kt/24 h, 55 kt/48 h, and 65 kt/72 h. Each point on the diagram represents a five-year sample of forecasts ending at the year indicated. The regional models evaluated here were GFDL from 1992–1995, GFDI from 1996–2005, and HWFI from 2007–2020 (no GFDL forecasts were available in 1991 and no HWFI forecasts were available in 2006).

Figure 3.
As in Figure 2, but for the eastern North Pacific. The regional models evaluated here were GFDL from 1993–1995, GFDI from 1996–2005, and HWFI from 2007–2020 (no GFDL forecasts were available in 1991–1992 and no HWFI forecasts were available in 2006).
Figure 3.
As in Figure 2, but for the eastern North Pacific. The regional models evaluated here were GFDL from 1993–1995, GFDI from 1996–2005, and HWFI from 2007–2020 (no GFDL forecasts were available in 1991–1992 and no HWFI forecasts were available in 2006).

Figure 4.
Brier skill score (%) of Atlantic basin SHIPS-RII forecasts for two RI thresholds (30 kt/24 h and 25 kt/24 h). Each point on the diagram represents a 5-yr sample of forecasts ending at the year indicated, except for the 2004 entry, which represents a 4-yr sample. Linear best-fit lines are given by the dashed lines. Note that the trend lines extend back to the start of the periods represented by the data points. The blue trend line is extended back to the start of the red trend line for reference.

Figure 5.
Brier skill scores for 2016–2020 Atlantic basin real-time SHIPS-RII-LDA (red), SHIPS-RII-LR (green), SHIPS-RII-B (blue), and SHIPS-RII-C (orange) model forecasts relative to climatology. The different RI thresholds are listed below each bar grouping, along with the total number of cases and the number of those cases for which RI occurred. Negative scores depict thresholds for which the model had less skill than climatology.

Figure 6.
Atlantic basin 2016–2020 reliability diagram for the SHIPS-RII-LDA (red), SHIPS-RII-LR (green), SHIPS-RII-B (blue), and SHIPS-RII-C (orange) for the RI threshold of 30 kt/24 h. Perfect reliability is indicated by the sloping thin black line. The refinement distributions are given by the dashed lines.

Figure 7.
Brier skill score (%) of eastern North Pacific basin SHIPS-RII forecasts for two RI thresholds (30 kt/24 h and 25 kt/24 h). Each point on the diagram represents a 5-yr sample of forecasts, ending at the year indicated. Linear best-fit lines are given by the dashed lines.
Figure 7.
Brier skill score (%) of eastern North Pacific basin SHIPS-RII forecasts for two RI thresholds (30 kt/24 h and 25 kt/24 h). Each point on the diagram represents a 5-yr sample of forecasts, ending at the year indicated. Linear best-fit lines are given by the dashed lines.

Figure 8.
Brier skill scores for 2016–2020 eastern North Pacific basin real-time SHIPS-RII-LDA (red), SHIPS-RII-LR (green), SHIPS-RII-B (blue), and SHIPS-RII-C (orange) model forecasts relative to climatology. The different RI thresholds are listed below each bar grouping along with the total number of cases and the number of those cases for which RI occurred. Negative scores depict thresholds for which the model had less skill than climatology.

Figure 9.
Eastern north Pacific basin 2016–2020 reliability diagram for the SHIPS-RII-LDA (red), SHIPS-RII-LR (green), SHIPS-RII-B (blue), and SHIPS-RII-C (orange) for the RI threshold of 30 kt/24 h. Perfect reliability is indicated by the sloping thin black line. The refinement distributions are given by the dashed lines.

Figure 10.
2018–2020 Brier skill scores for the Atlantic (top) and eastern North Pacific (bottom) basins for the four SHIPS-RII models and DTOPS. The different RI thresholds are listed below each bar grouping, along with the total number of cases and the number of those cases for which RI occurred. Negative scores depict thresholds for which the model had less skill than climatology.

Figure 11.
Bias (%) of the NHC official forecasts from 1986–2020 for the Atlantic (red) and eastern North Pacific (blue) basins for the three RI thresholds. Each point on the diagram represents a five-year sample of forecasts ending at the year indicated.
Figure 11.
Bias (%) of the NHC official forecasts from 1986–2020 for the Atlantic (red) and eastern North Pacific (blue) basins for the three RI thresholds. Each point on the diagram represents a five-year sample of forecasts ending at the year indicated.

Figure 12.
HFIP RI performance measure baseline errors and skill. Baseline errors are the mean absolute errors over the period 2015–2017 for the Atlantic and eastern North Pacific for IVCN, the variable consensus comprising at least two of the models DSHP, LGEM, GHMI, HWFI, and CTCI. Skill values are computed relative to the climatology and persistence model OCD5.

Figure 13.
Historical annual average performance of IVCN, at 24, 48, and 72 h for the combined Atlantic and eastern North Pacific basins for the sample of cases when RI was either observed or forecast by any of the member models of IVCN. Least-squares trend lines are shown by dashed lines. Note that the verifications for the 2020 season are preliminary as not all of NHC’s post-storm best track analyses were complete at the time this manuscript was prepared.

Figure 14.
Historical annual average performance of IVCN at 24, 48, and 72 h for the combined Atlantic and eastern North Pacific basins for all forecasts. Least-squares trend lines are shown by dashed lines. Note that the verifications for the 2020 season are preliminary as not all of NHC’s post-storm best track analyses were complete at the time this manuscript was prepared.

Figure 15.
Historical annual average performance of the NHC official forecast at 24, 48, and 72 h for the combined Atlantic and eastern North Pacific basins for the sample of cases when RI was either observed or forecast by NHC. Least-squares trend lines are shown by dashed lines. Note that the verifications for the 2020 season are preliminary as not all of NHC’s post-storm best track analyses were complete at the time this manuscript was prepared.


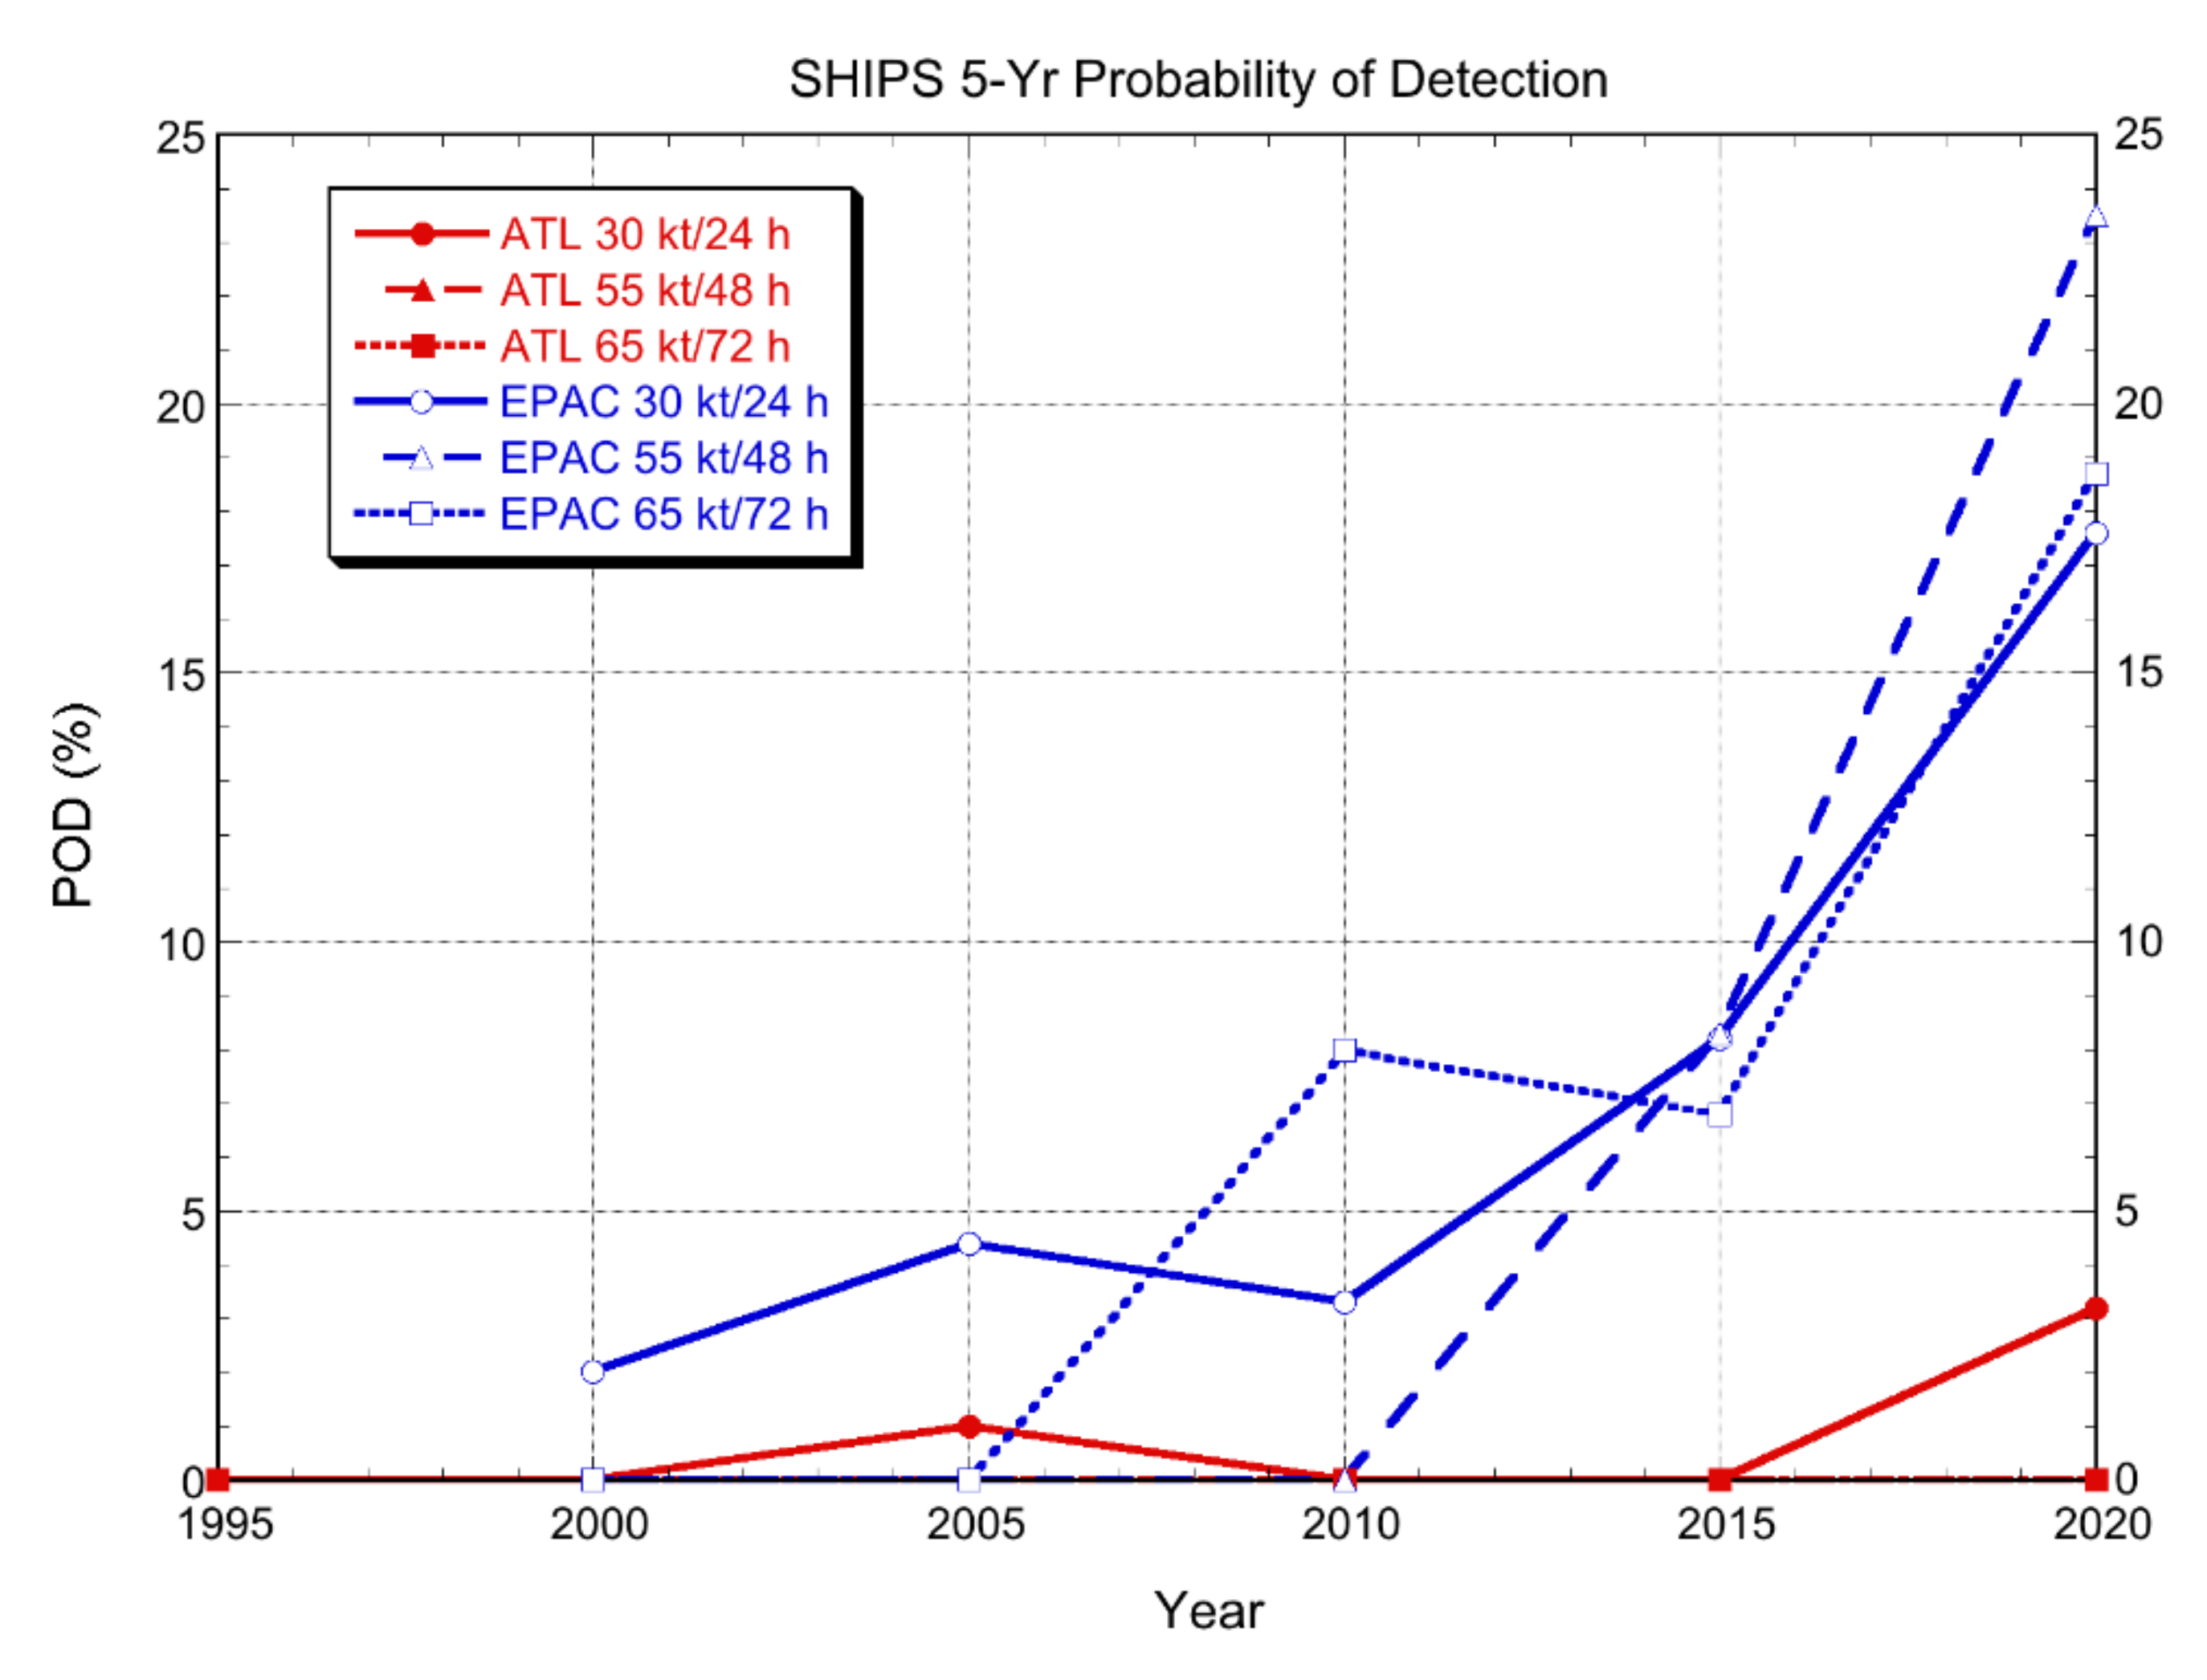
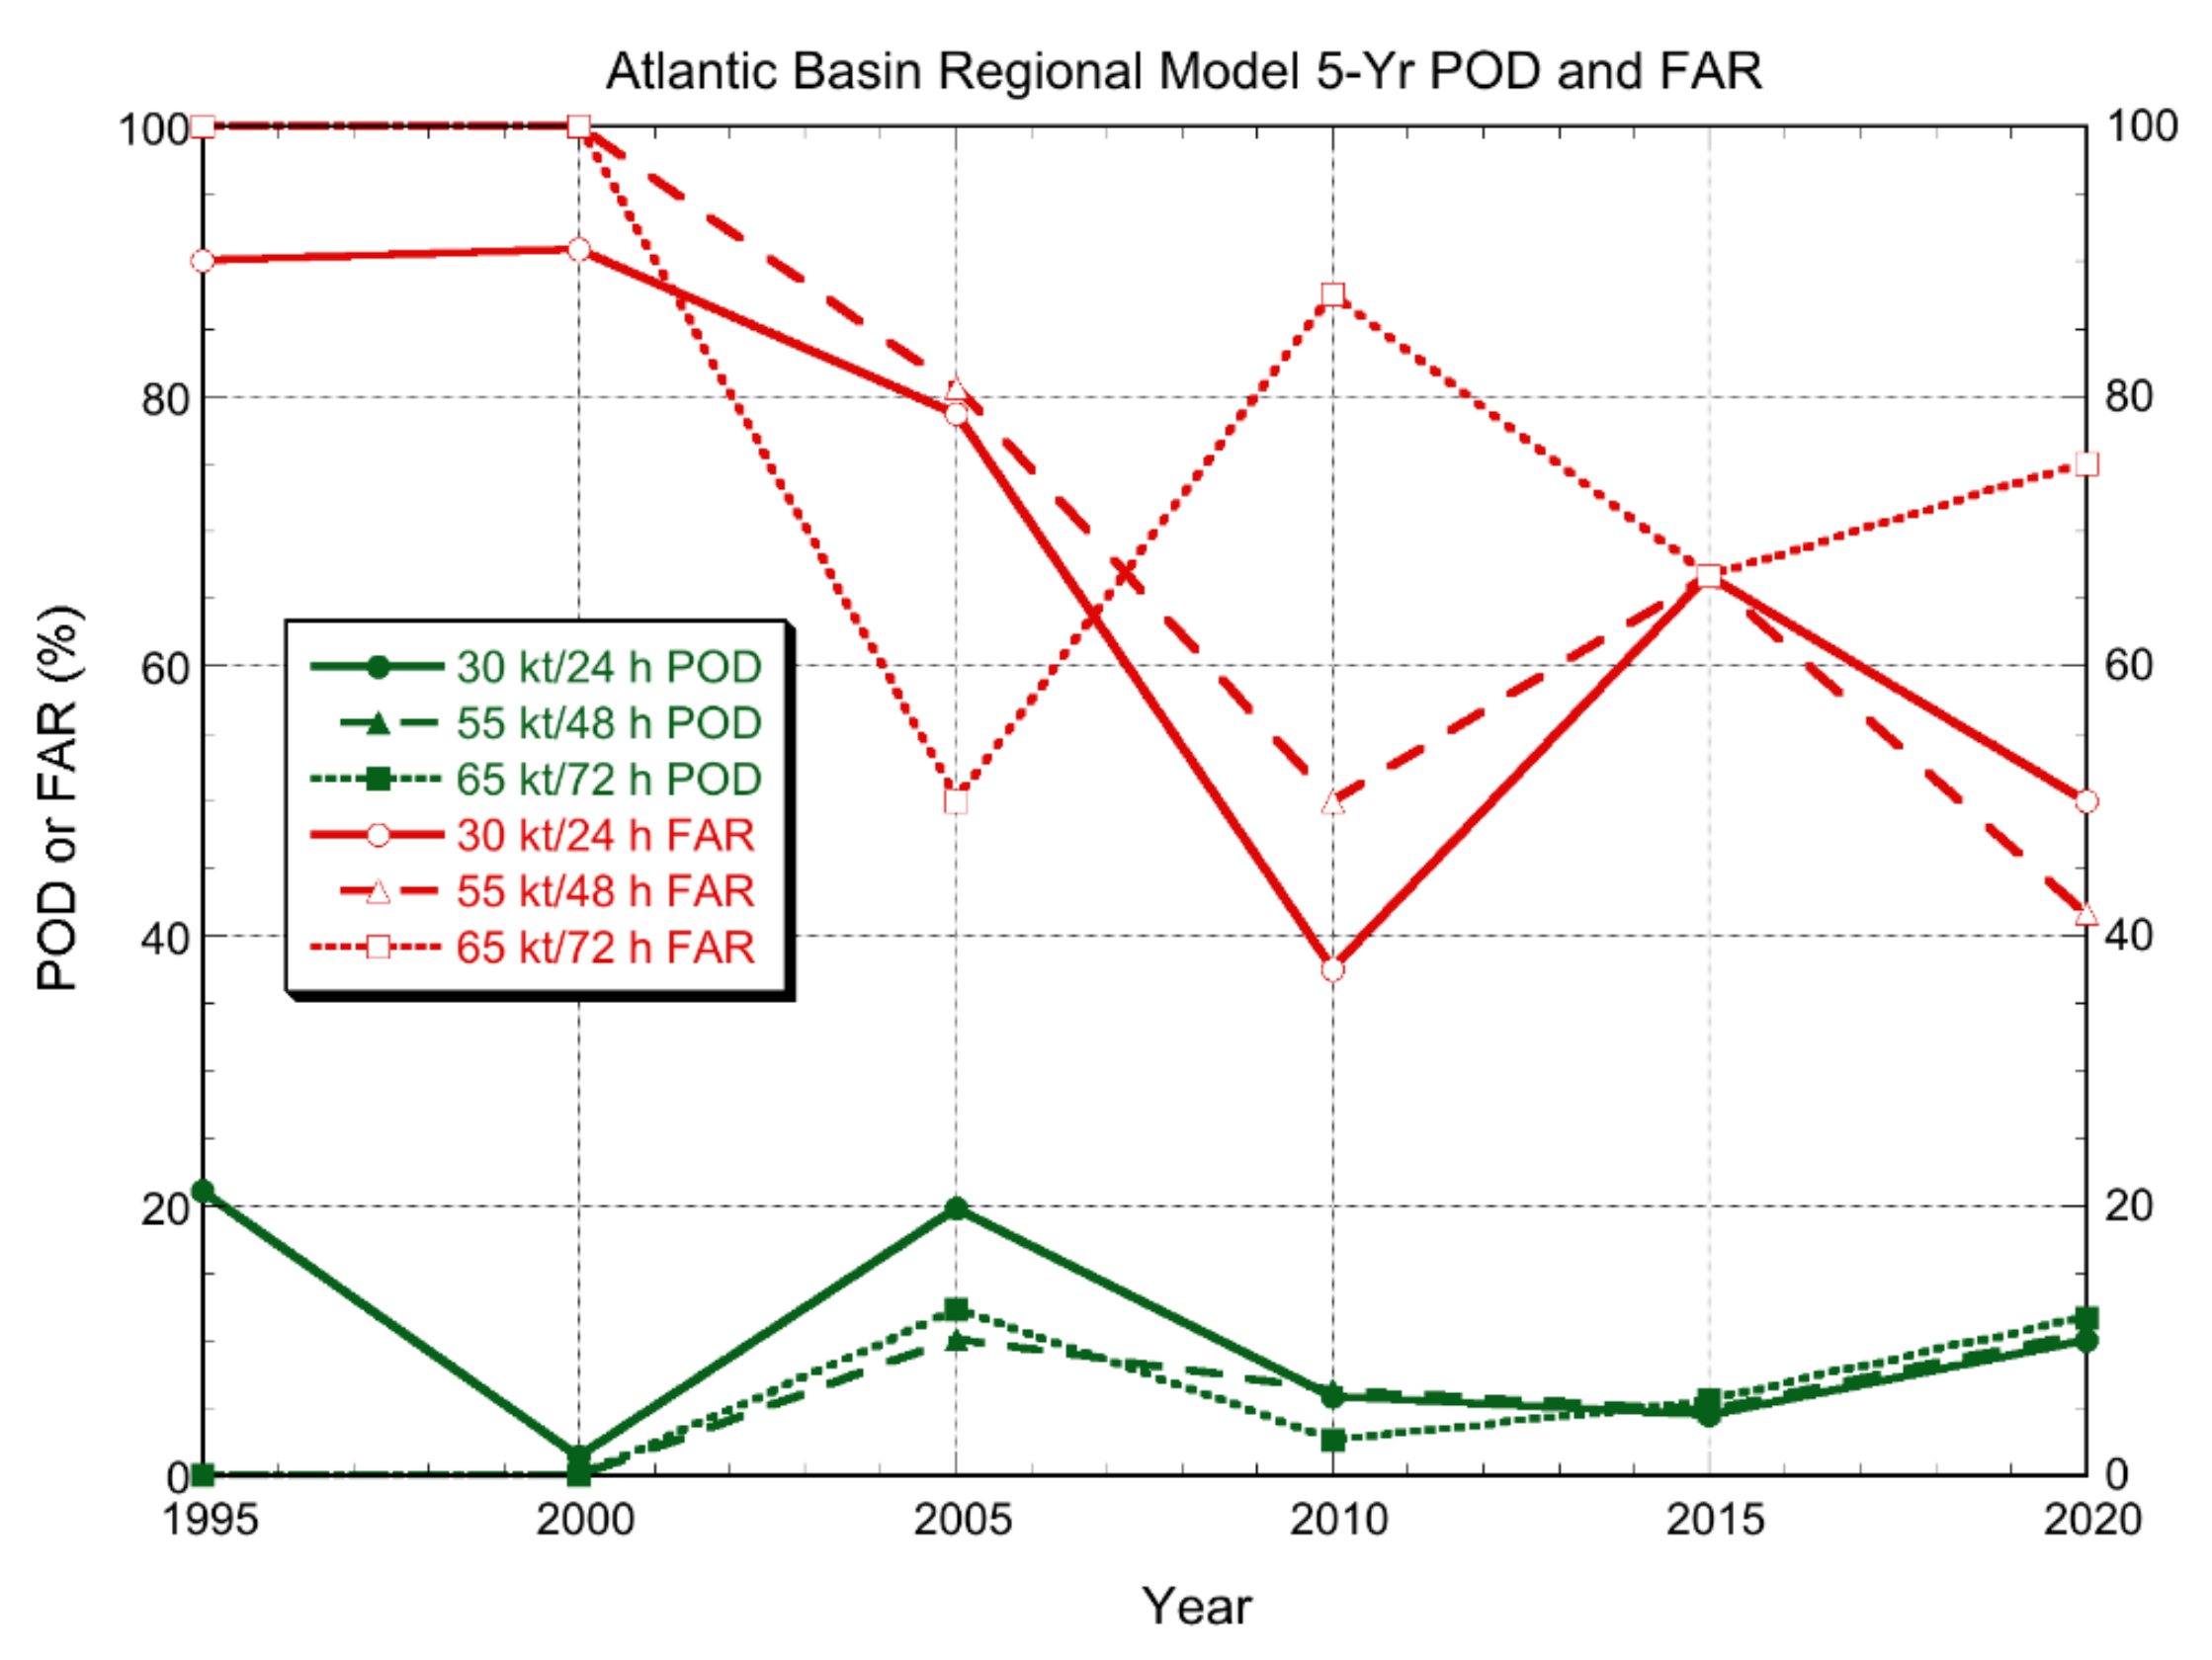
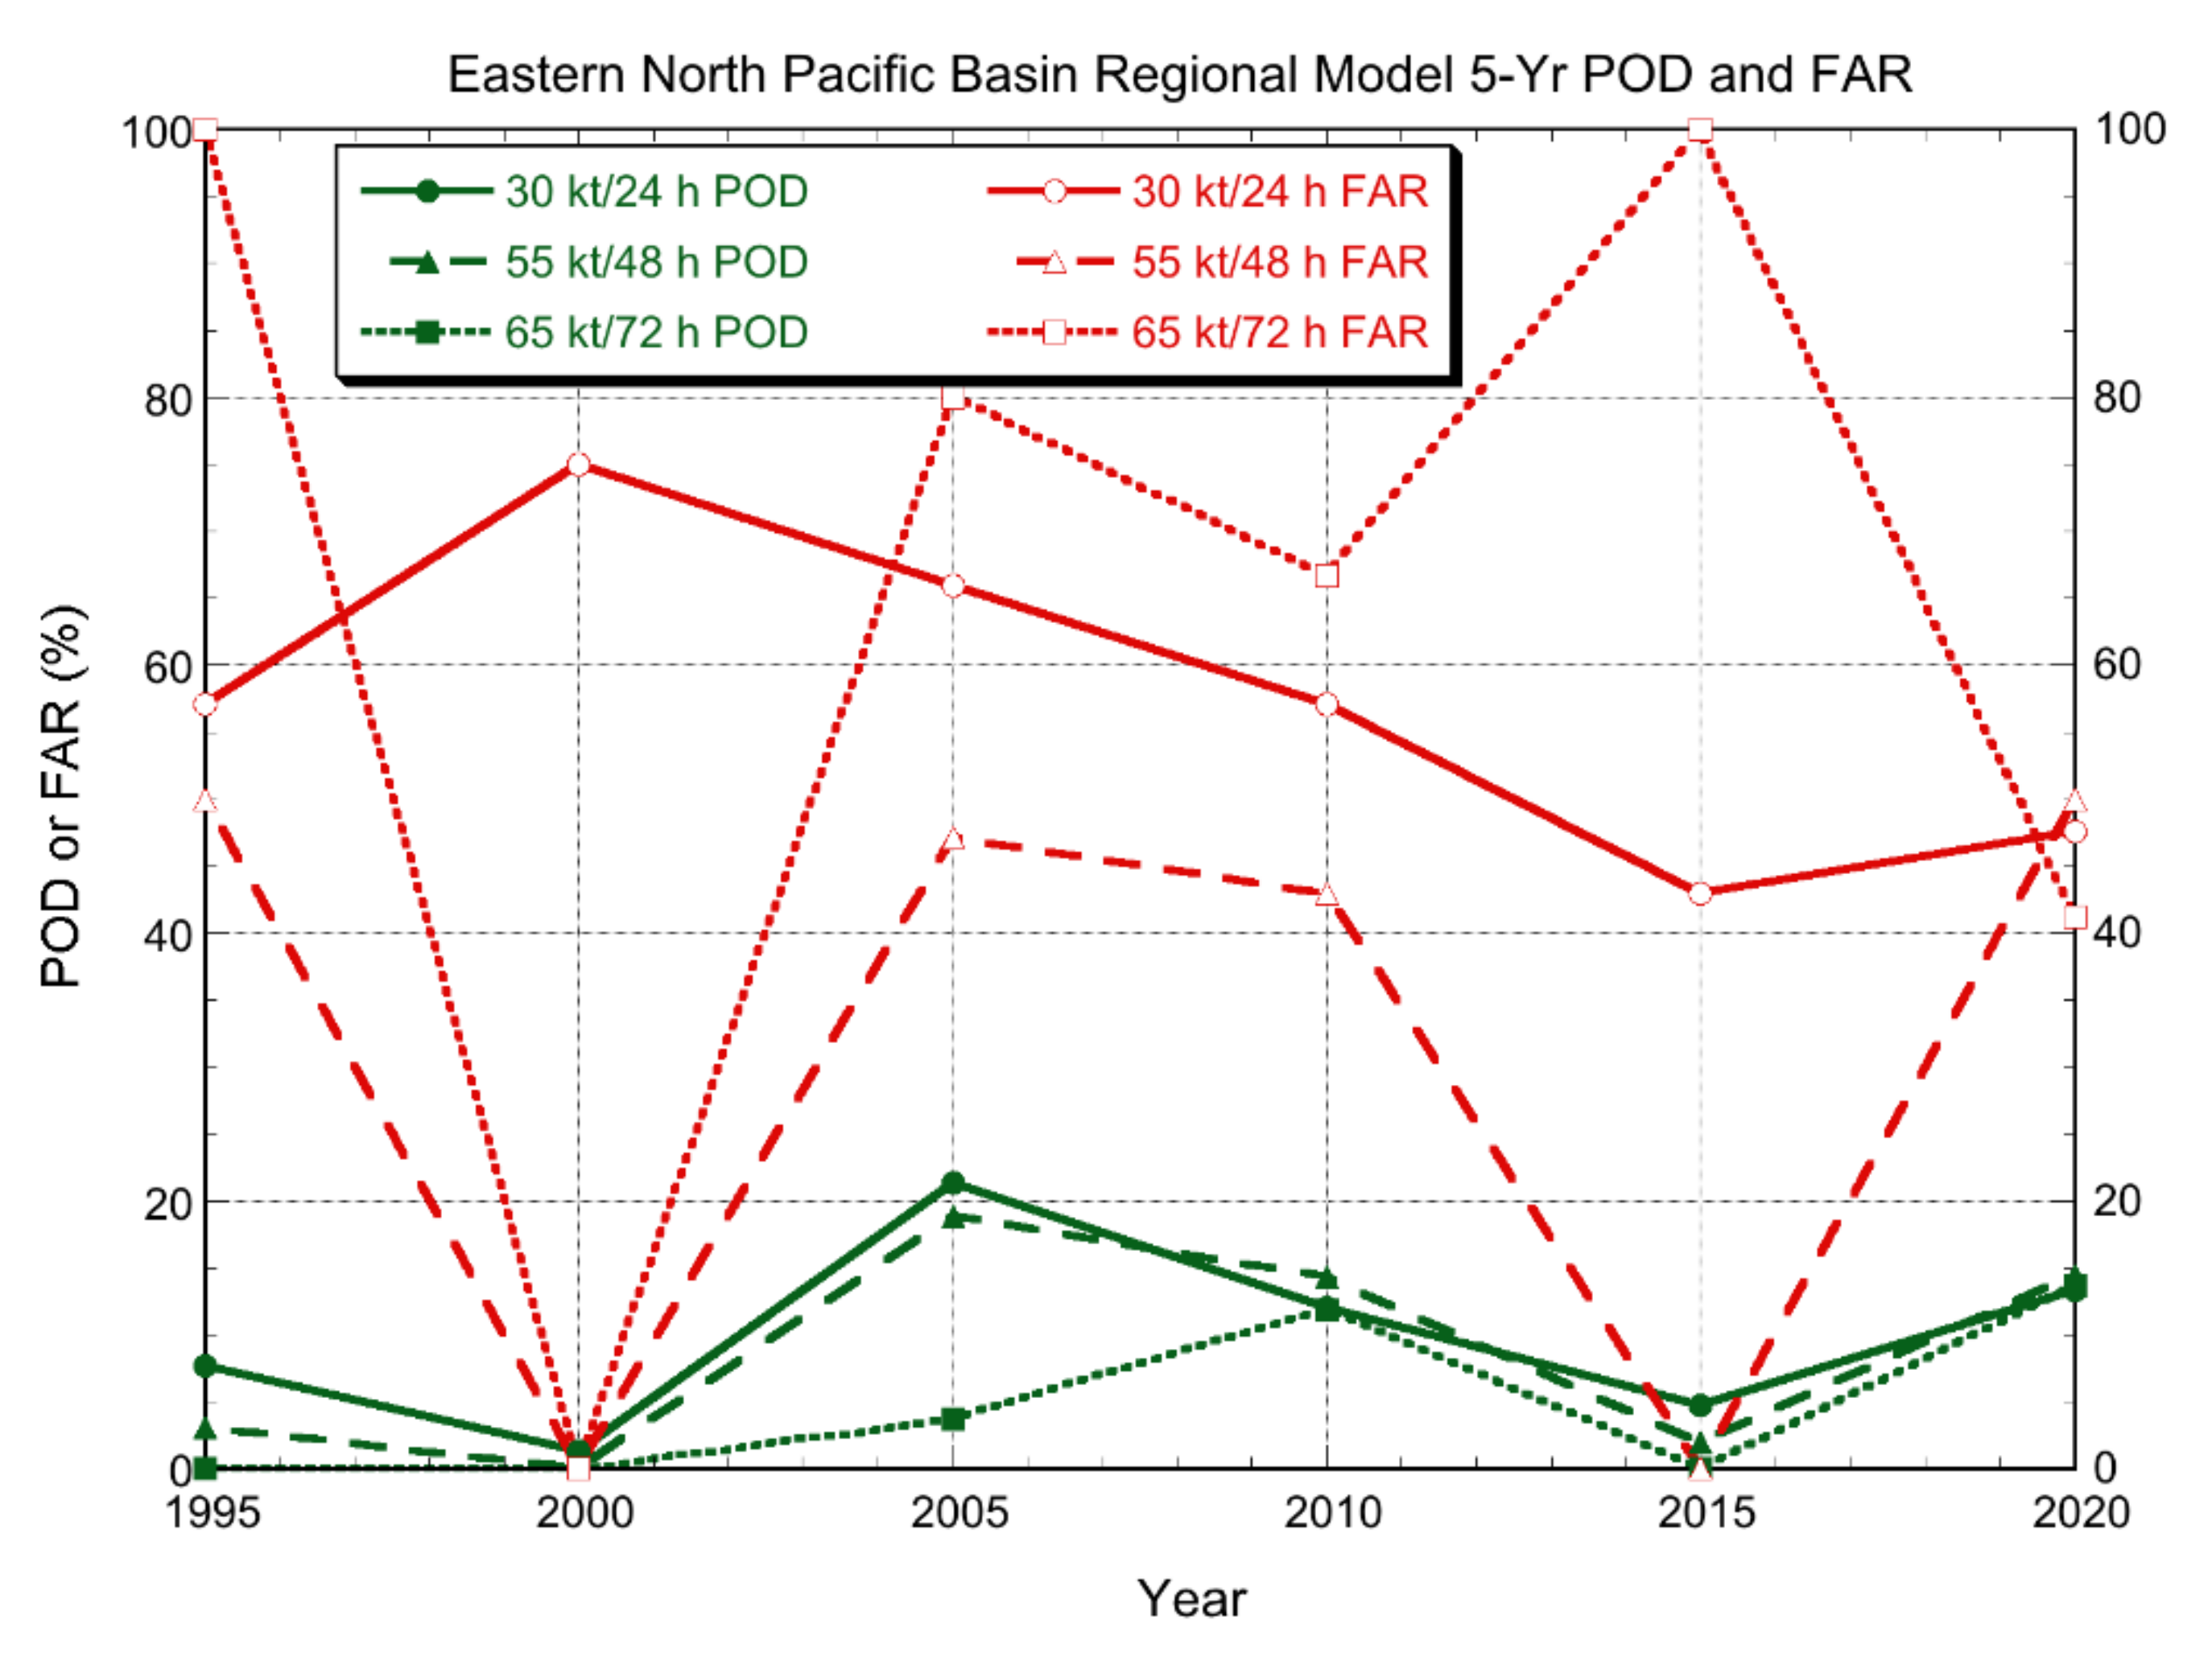
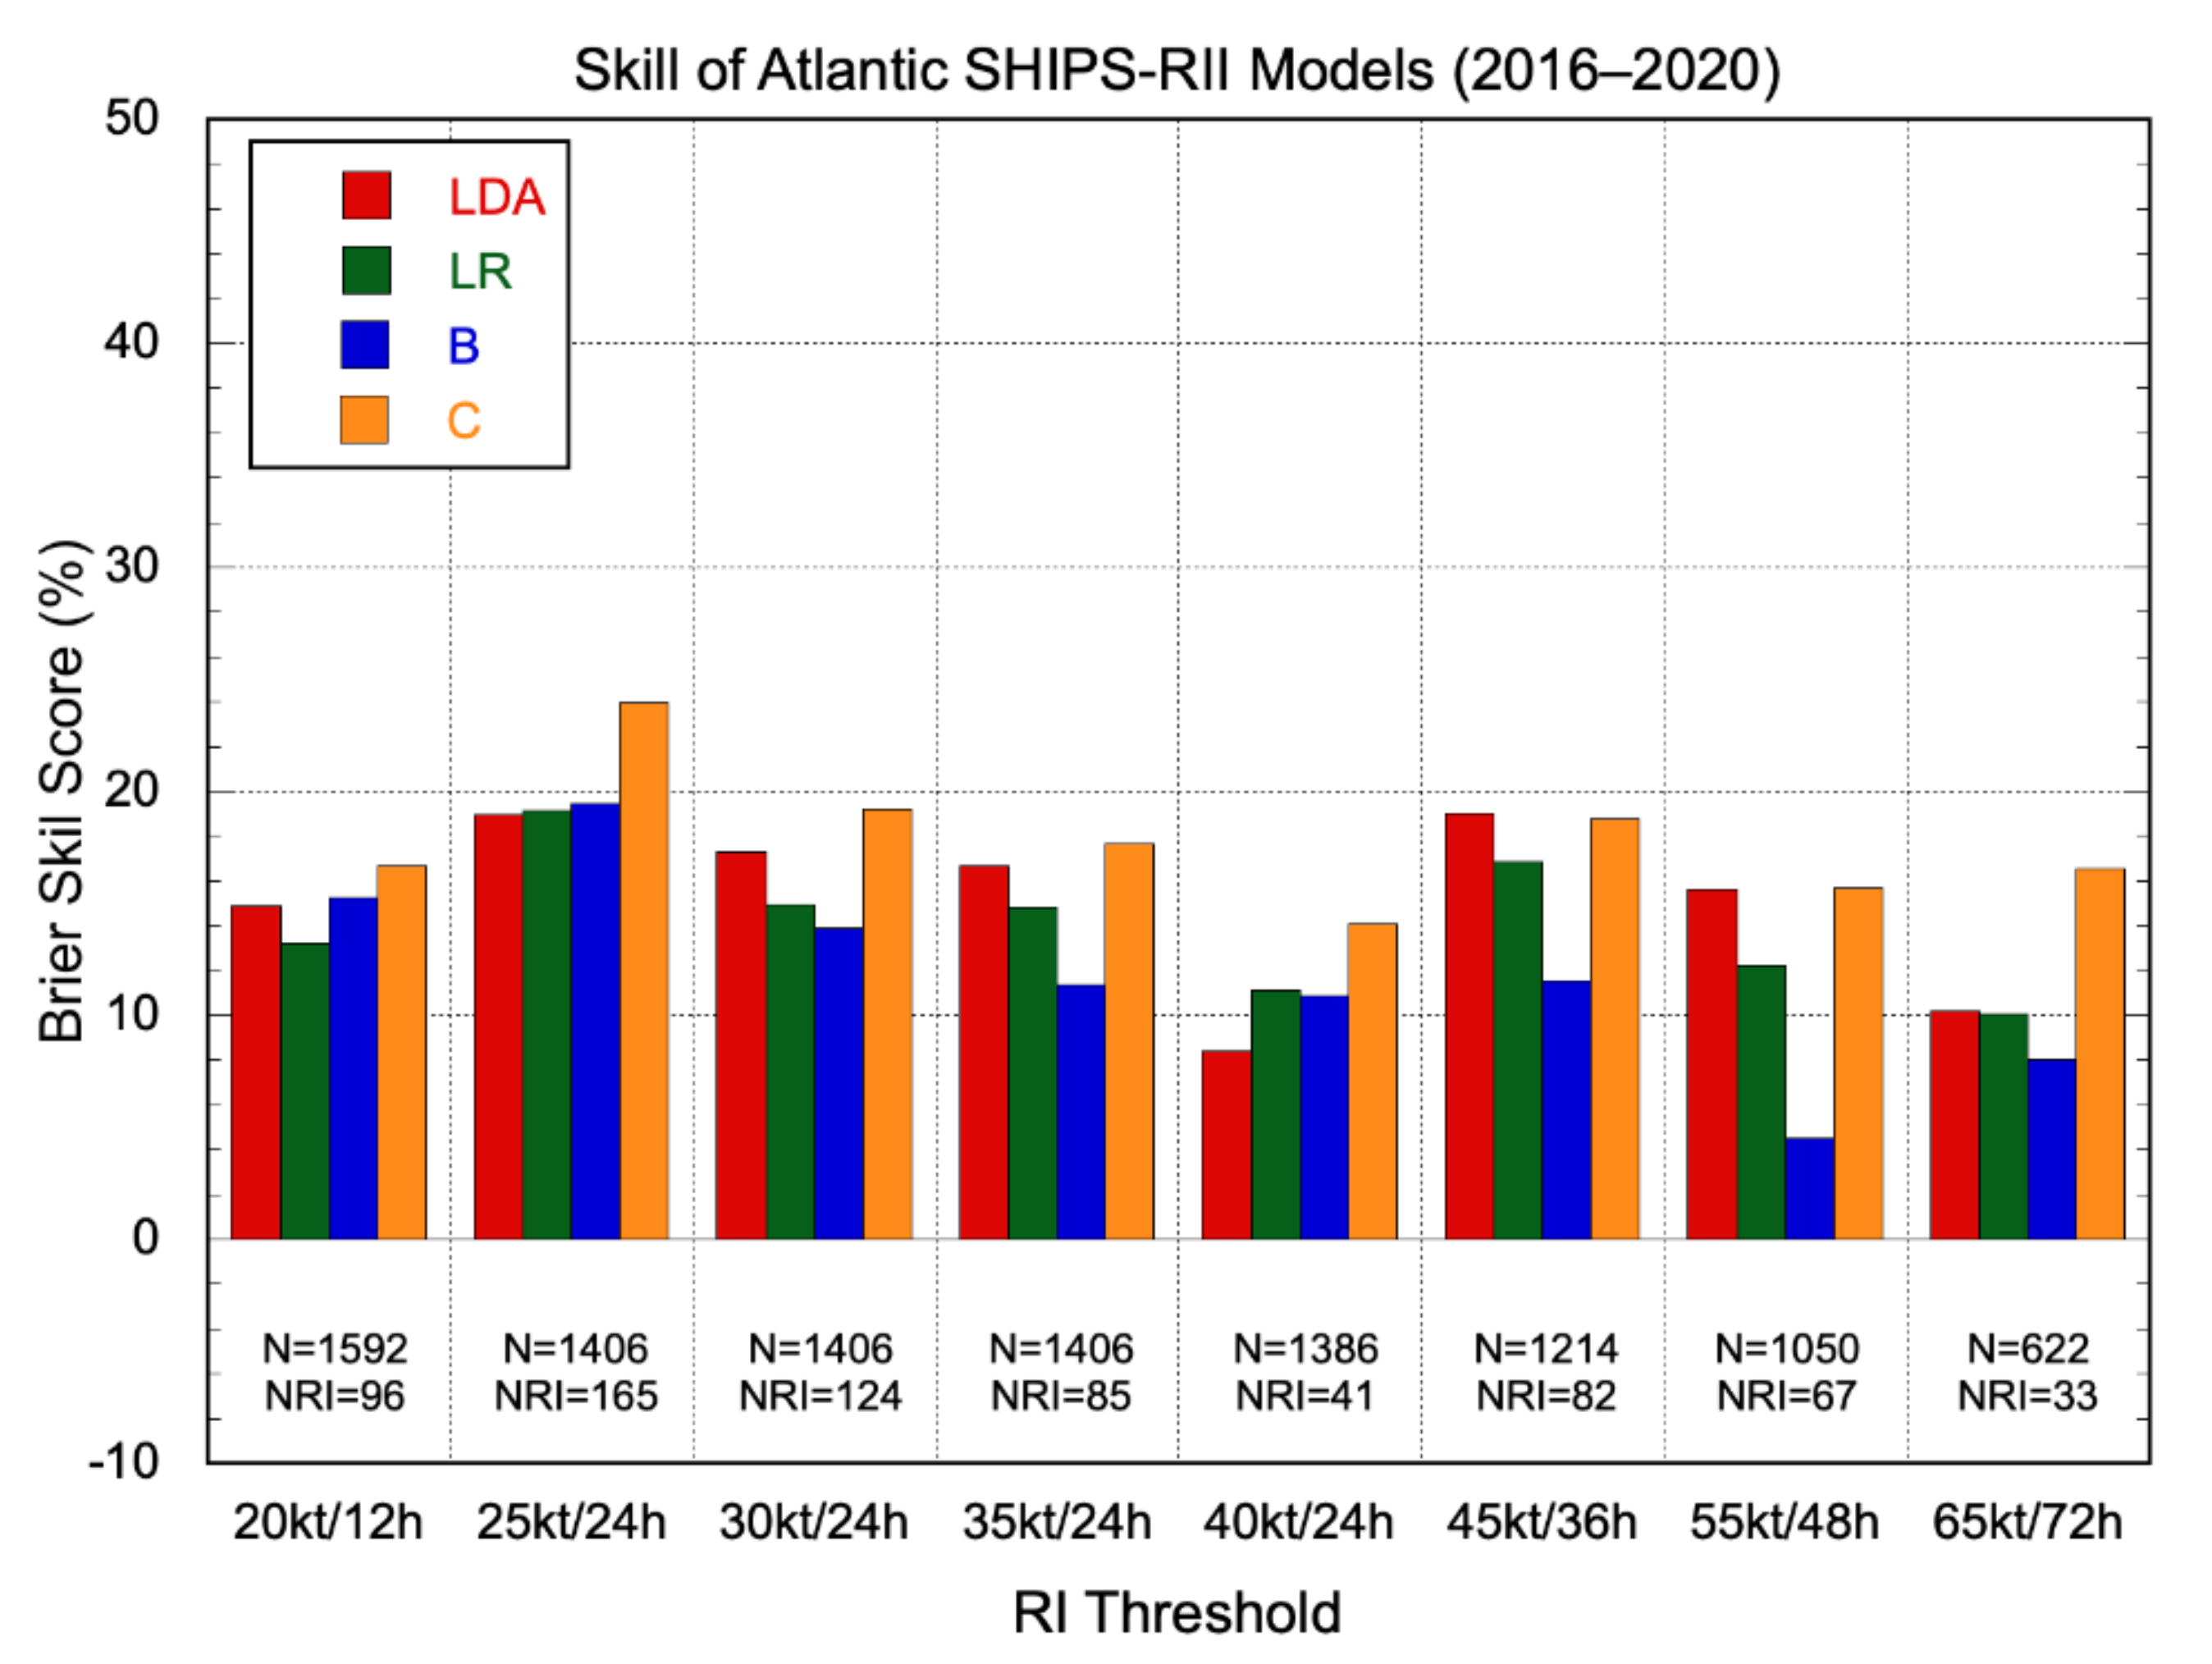
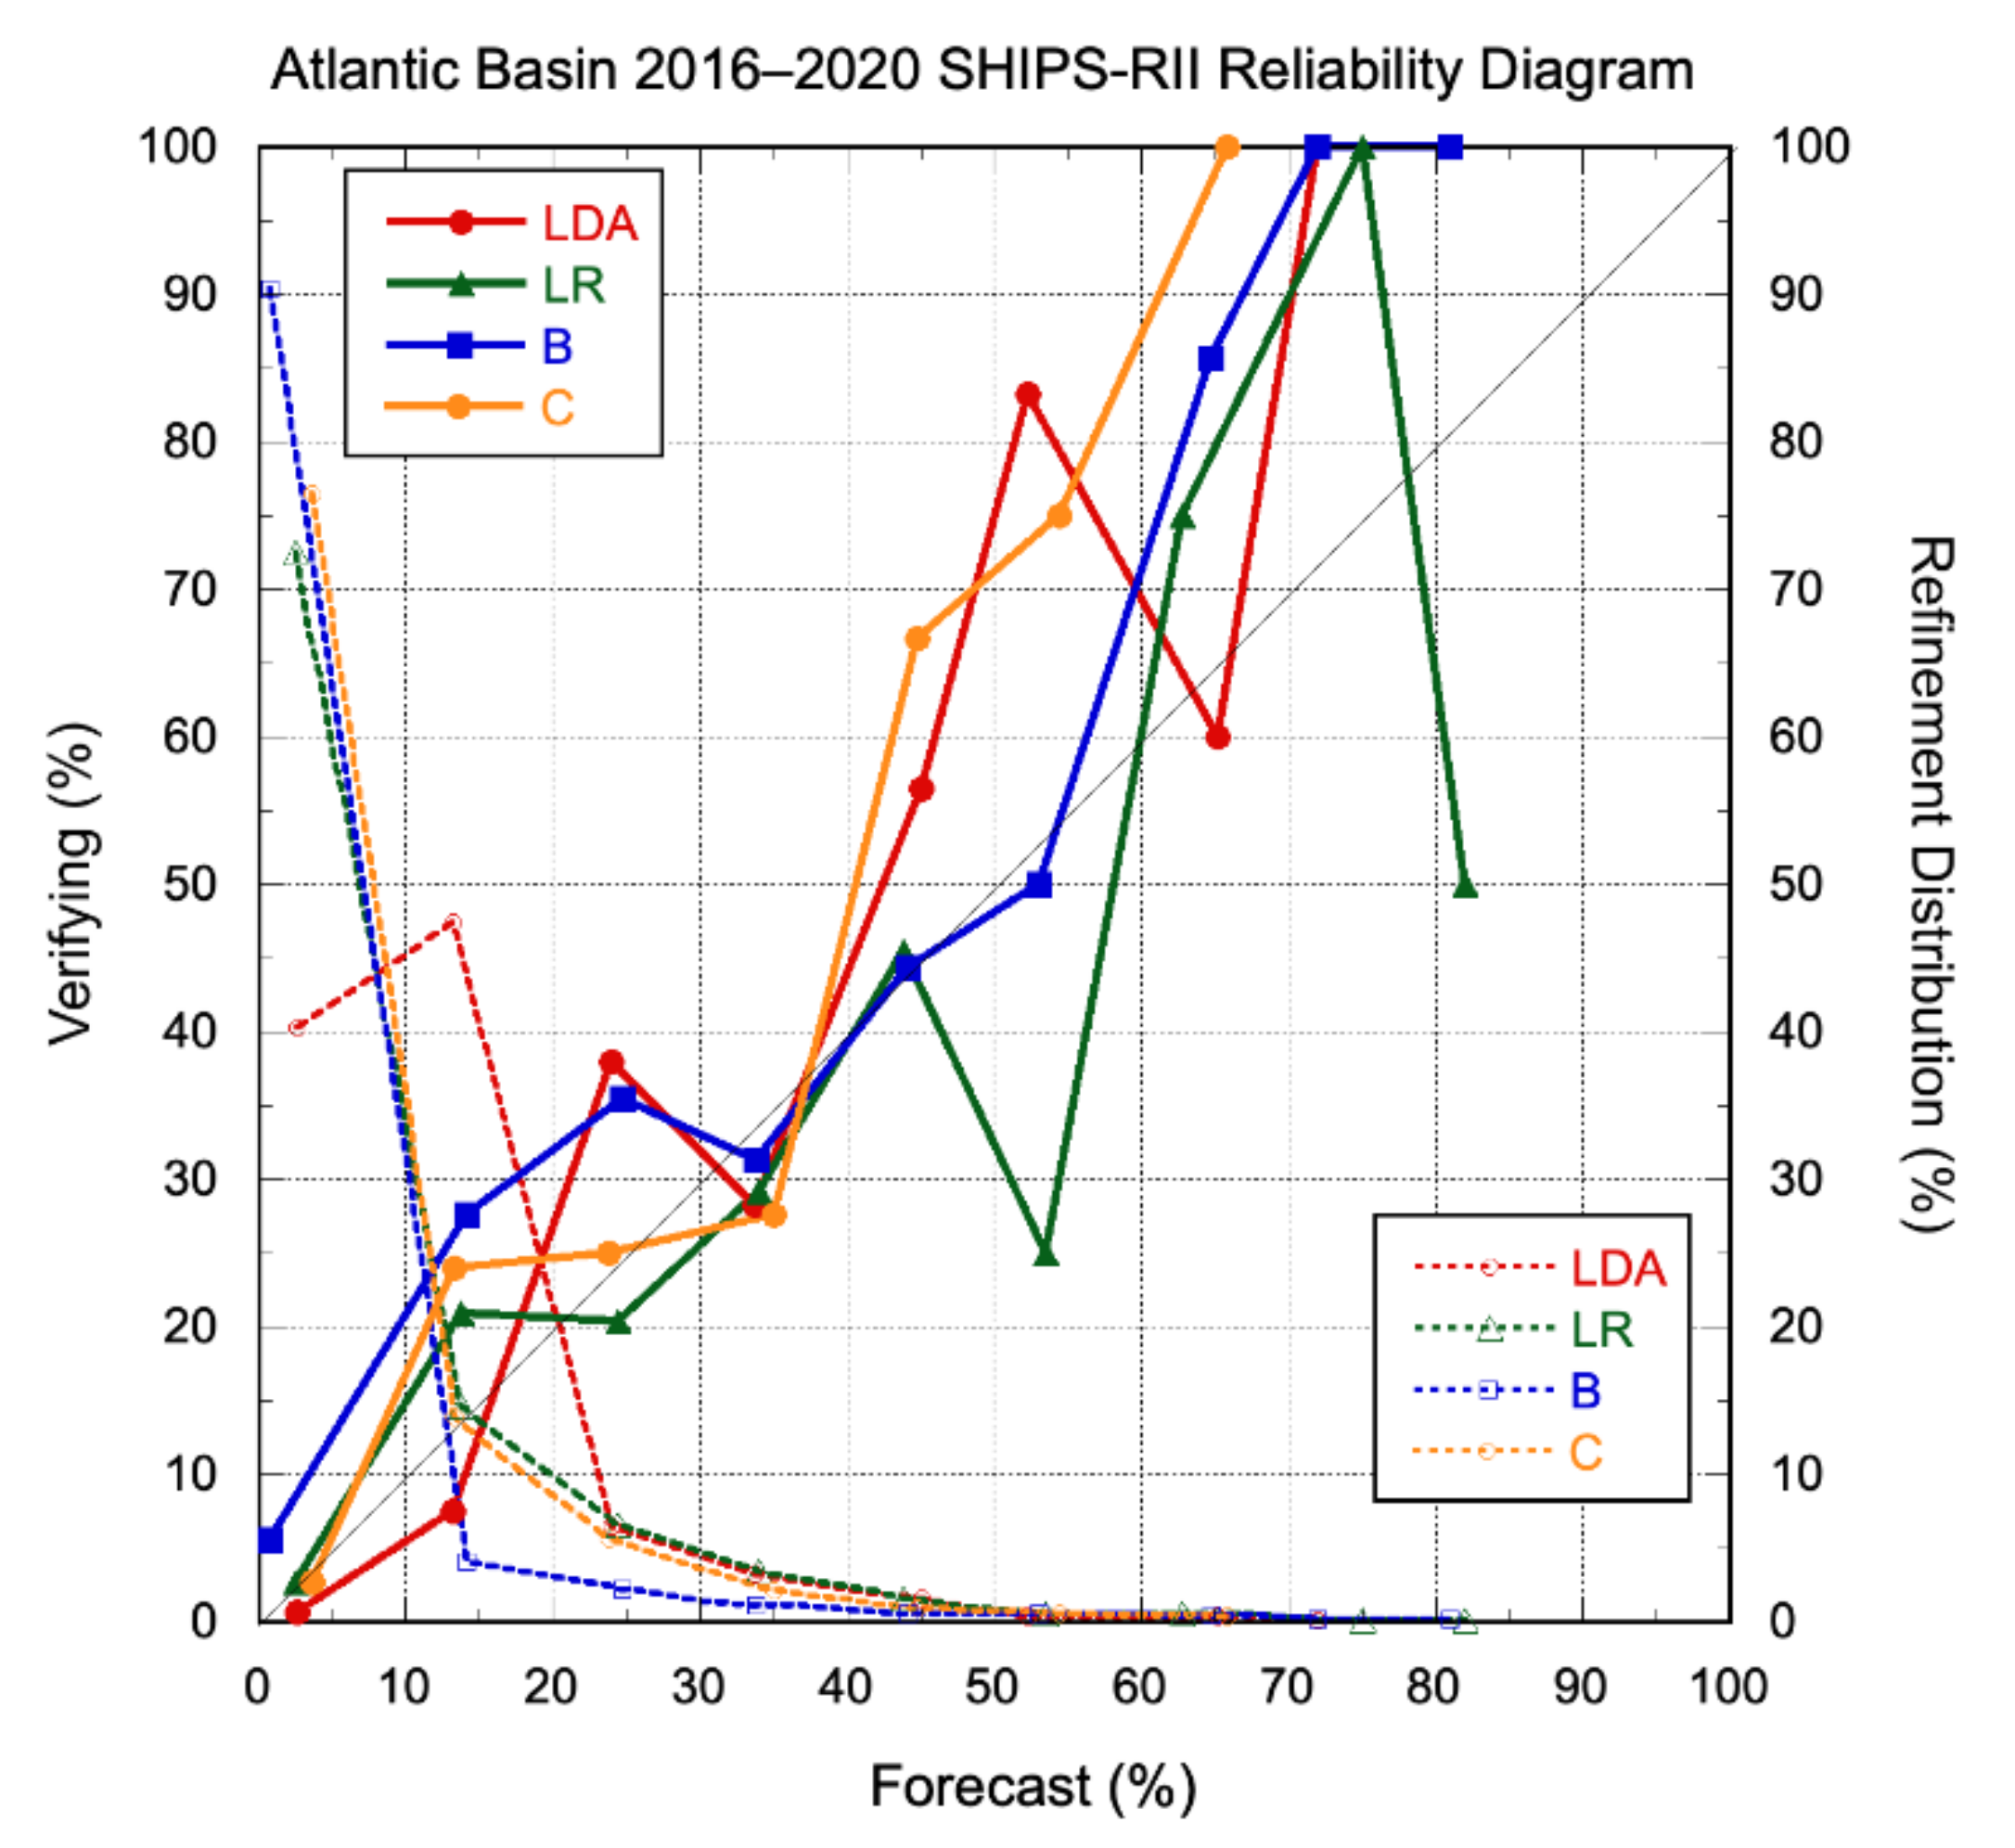
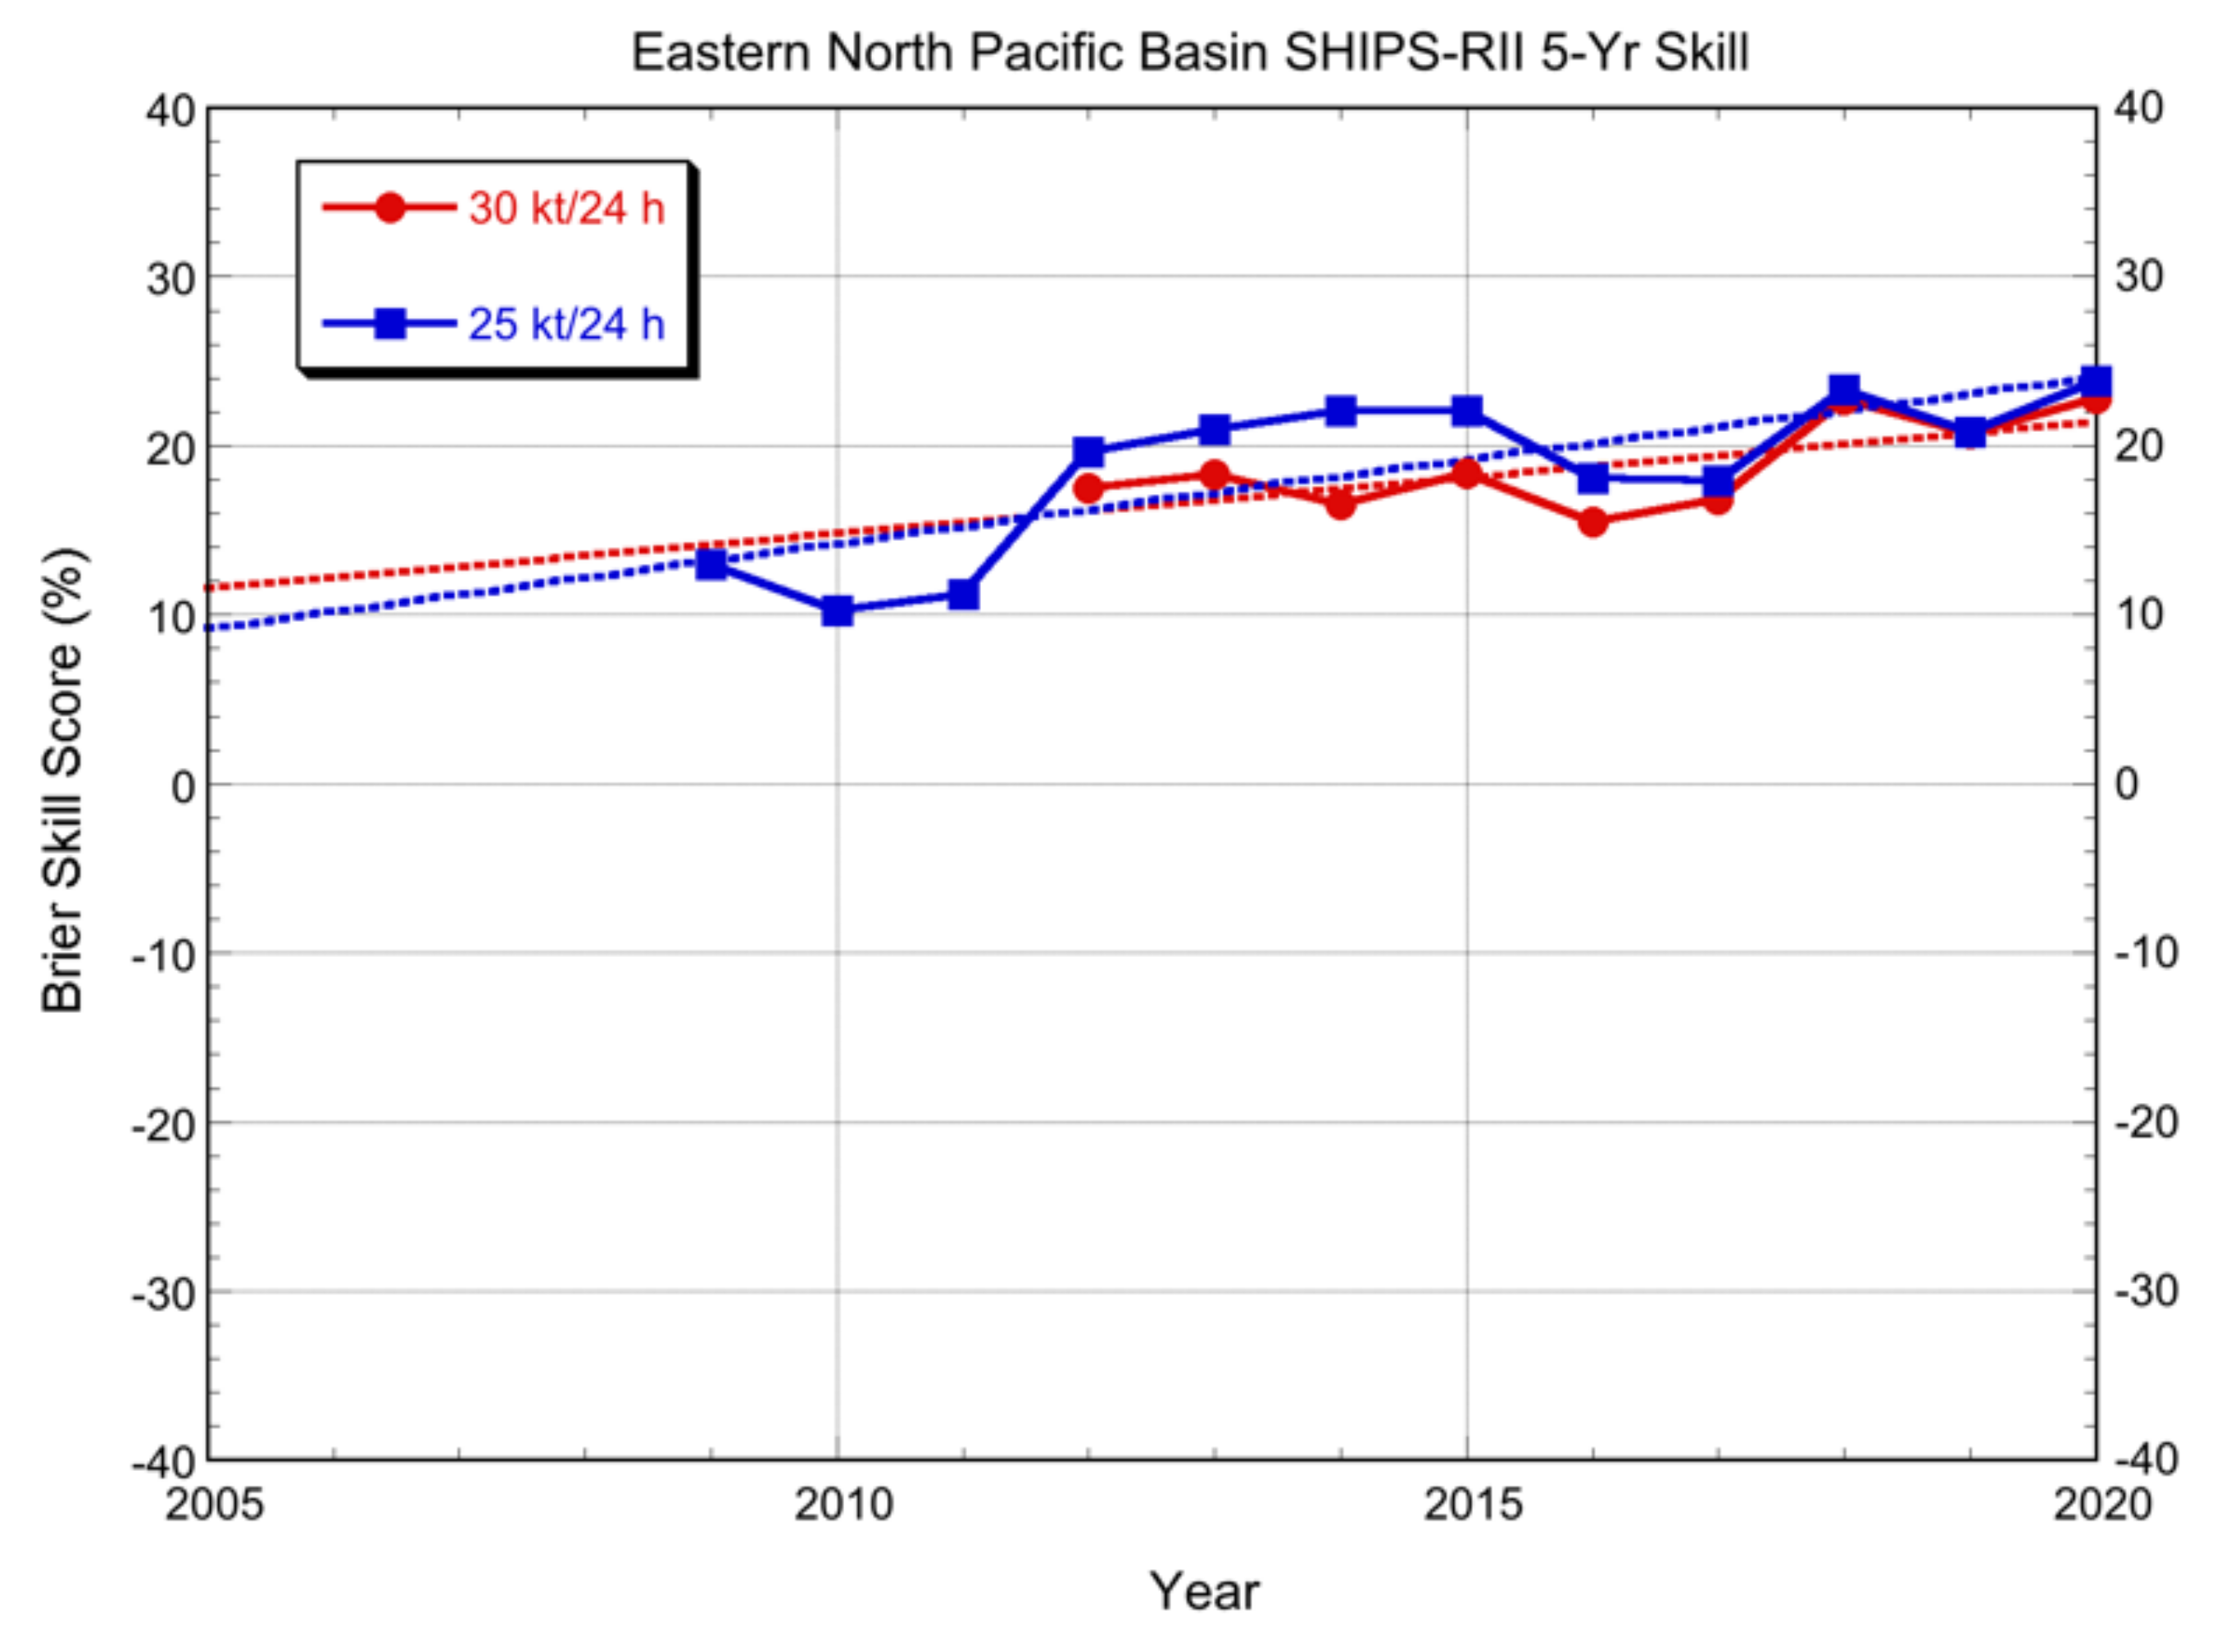
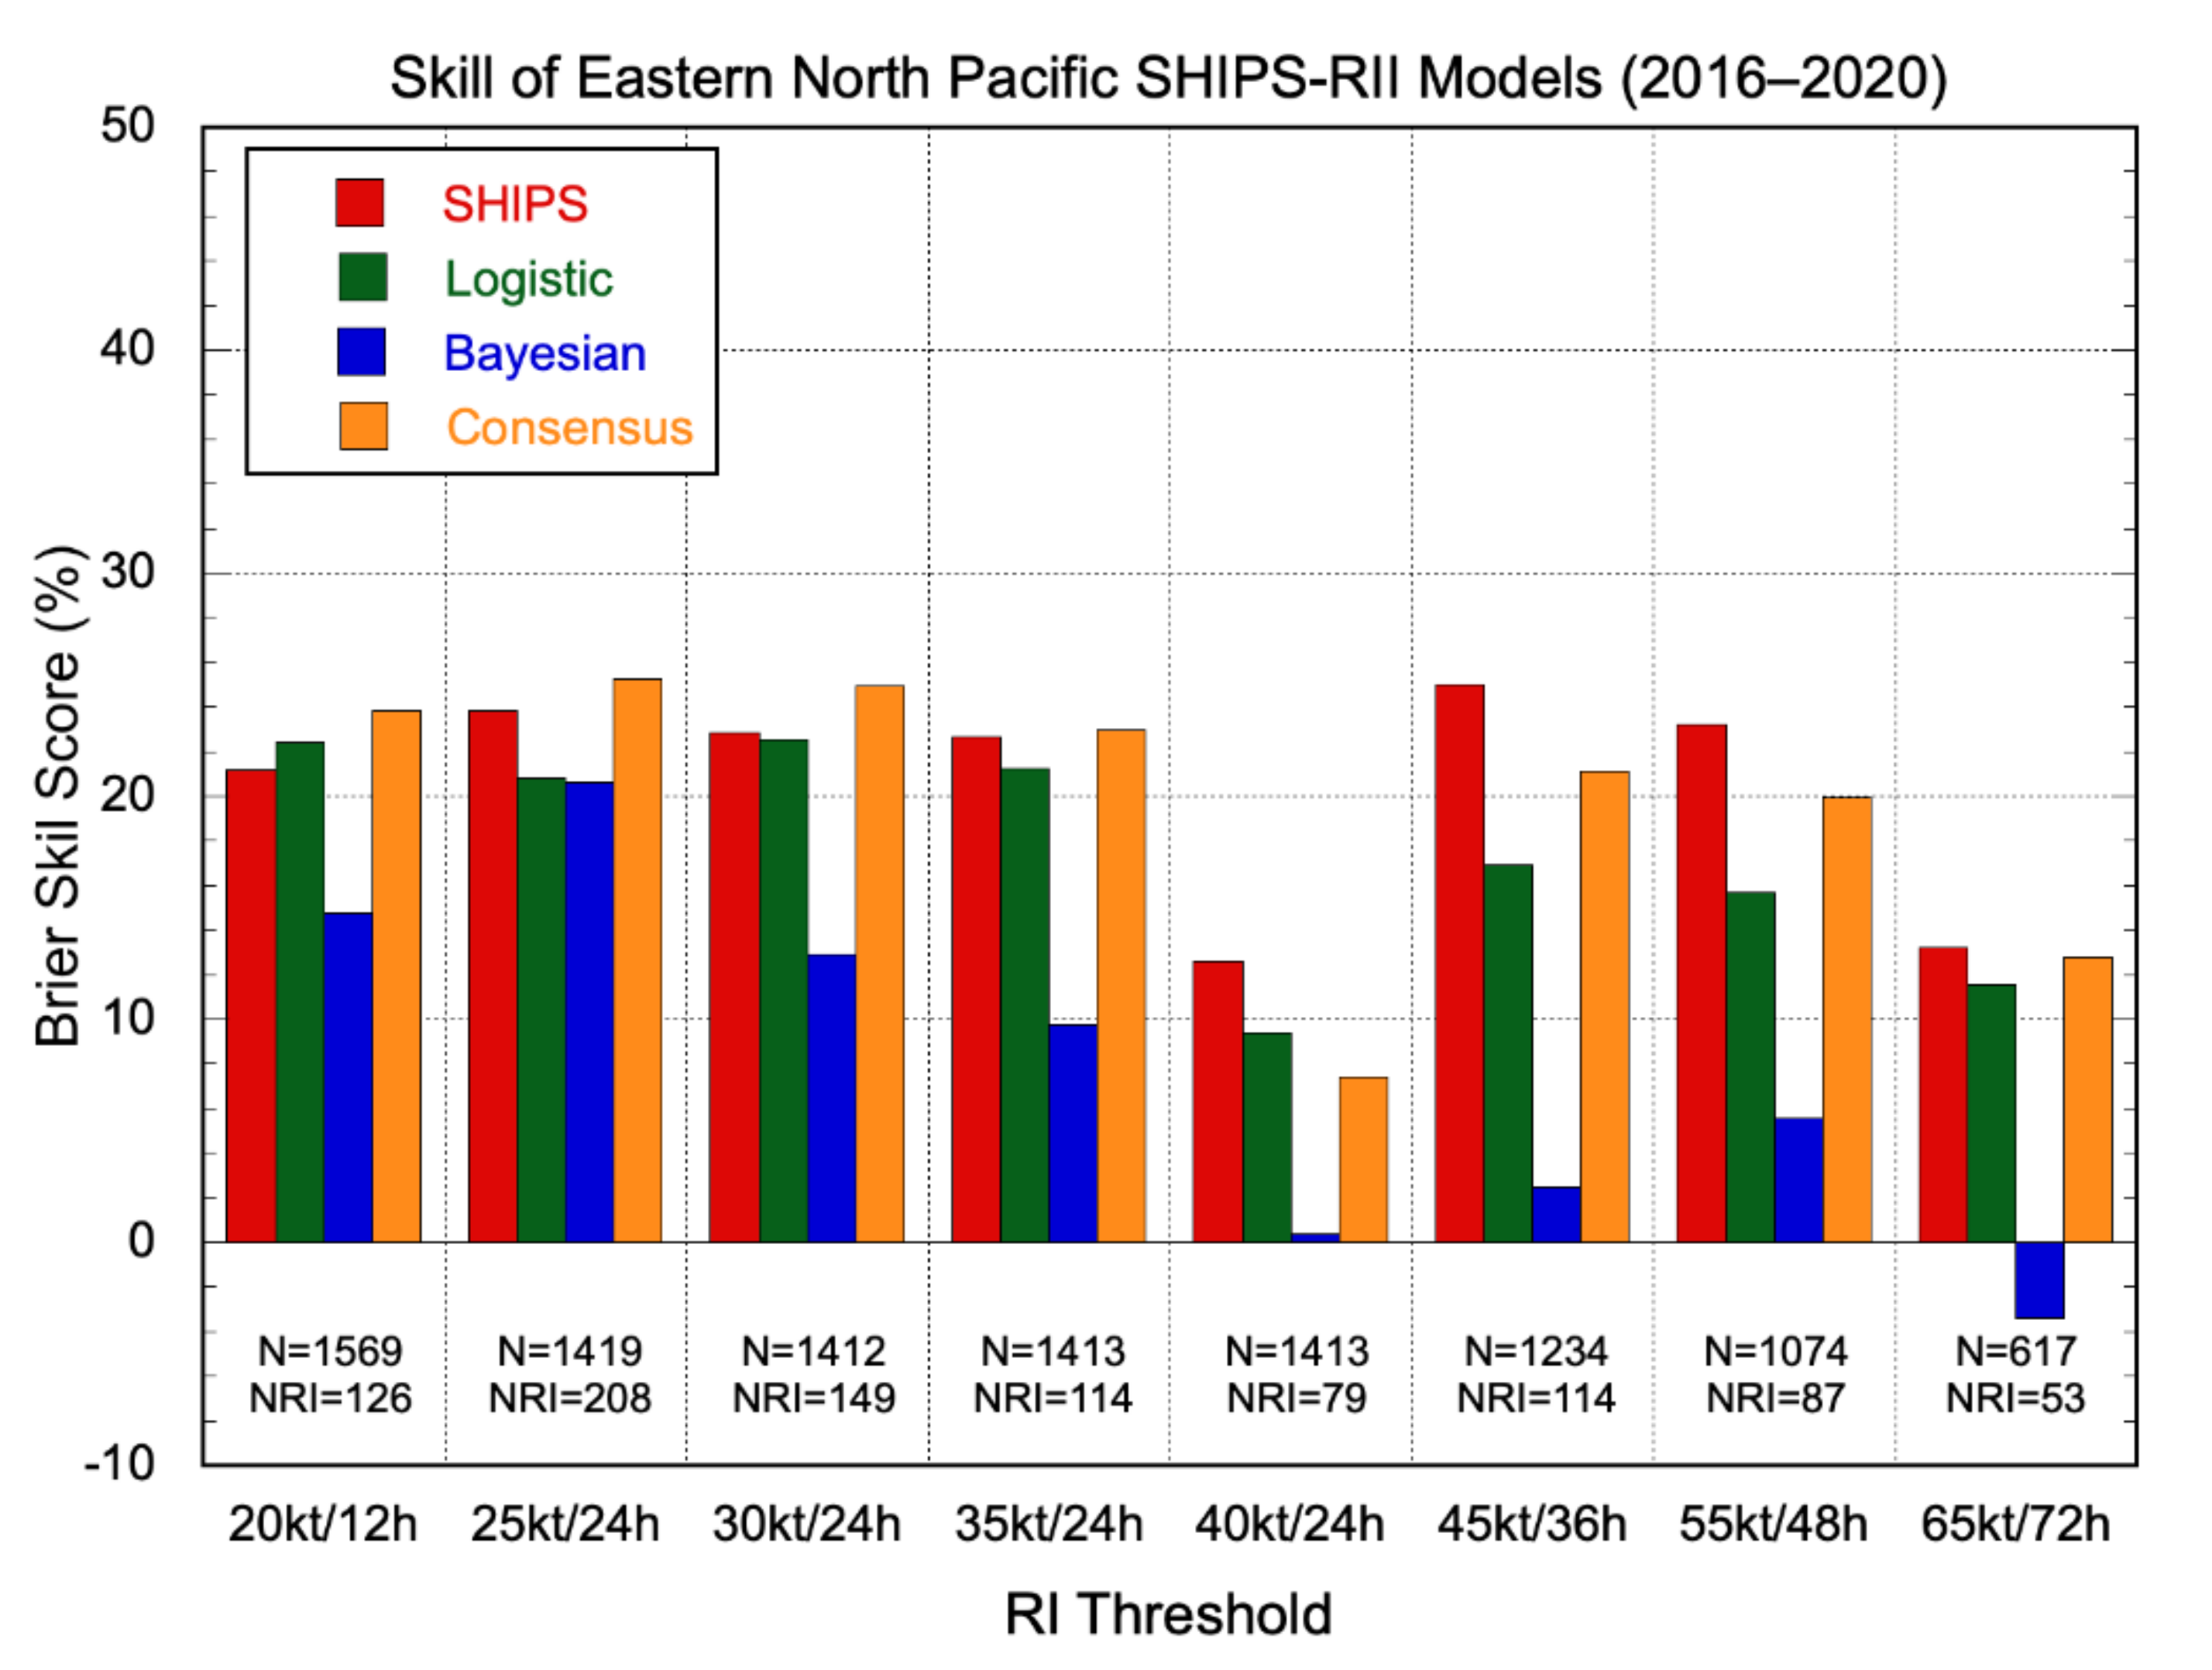
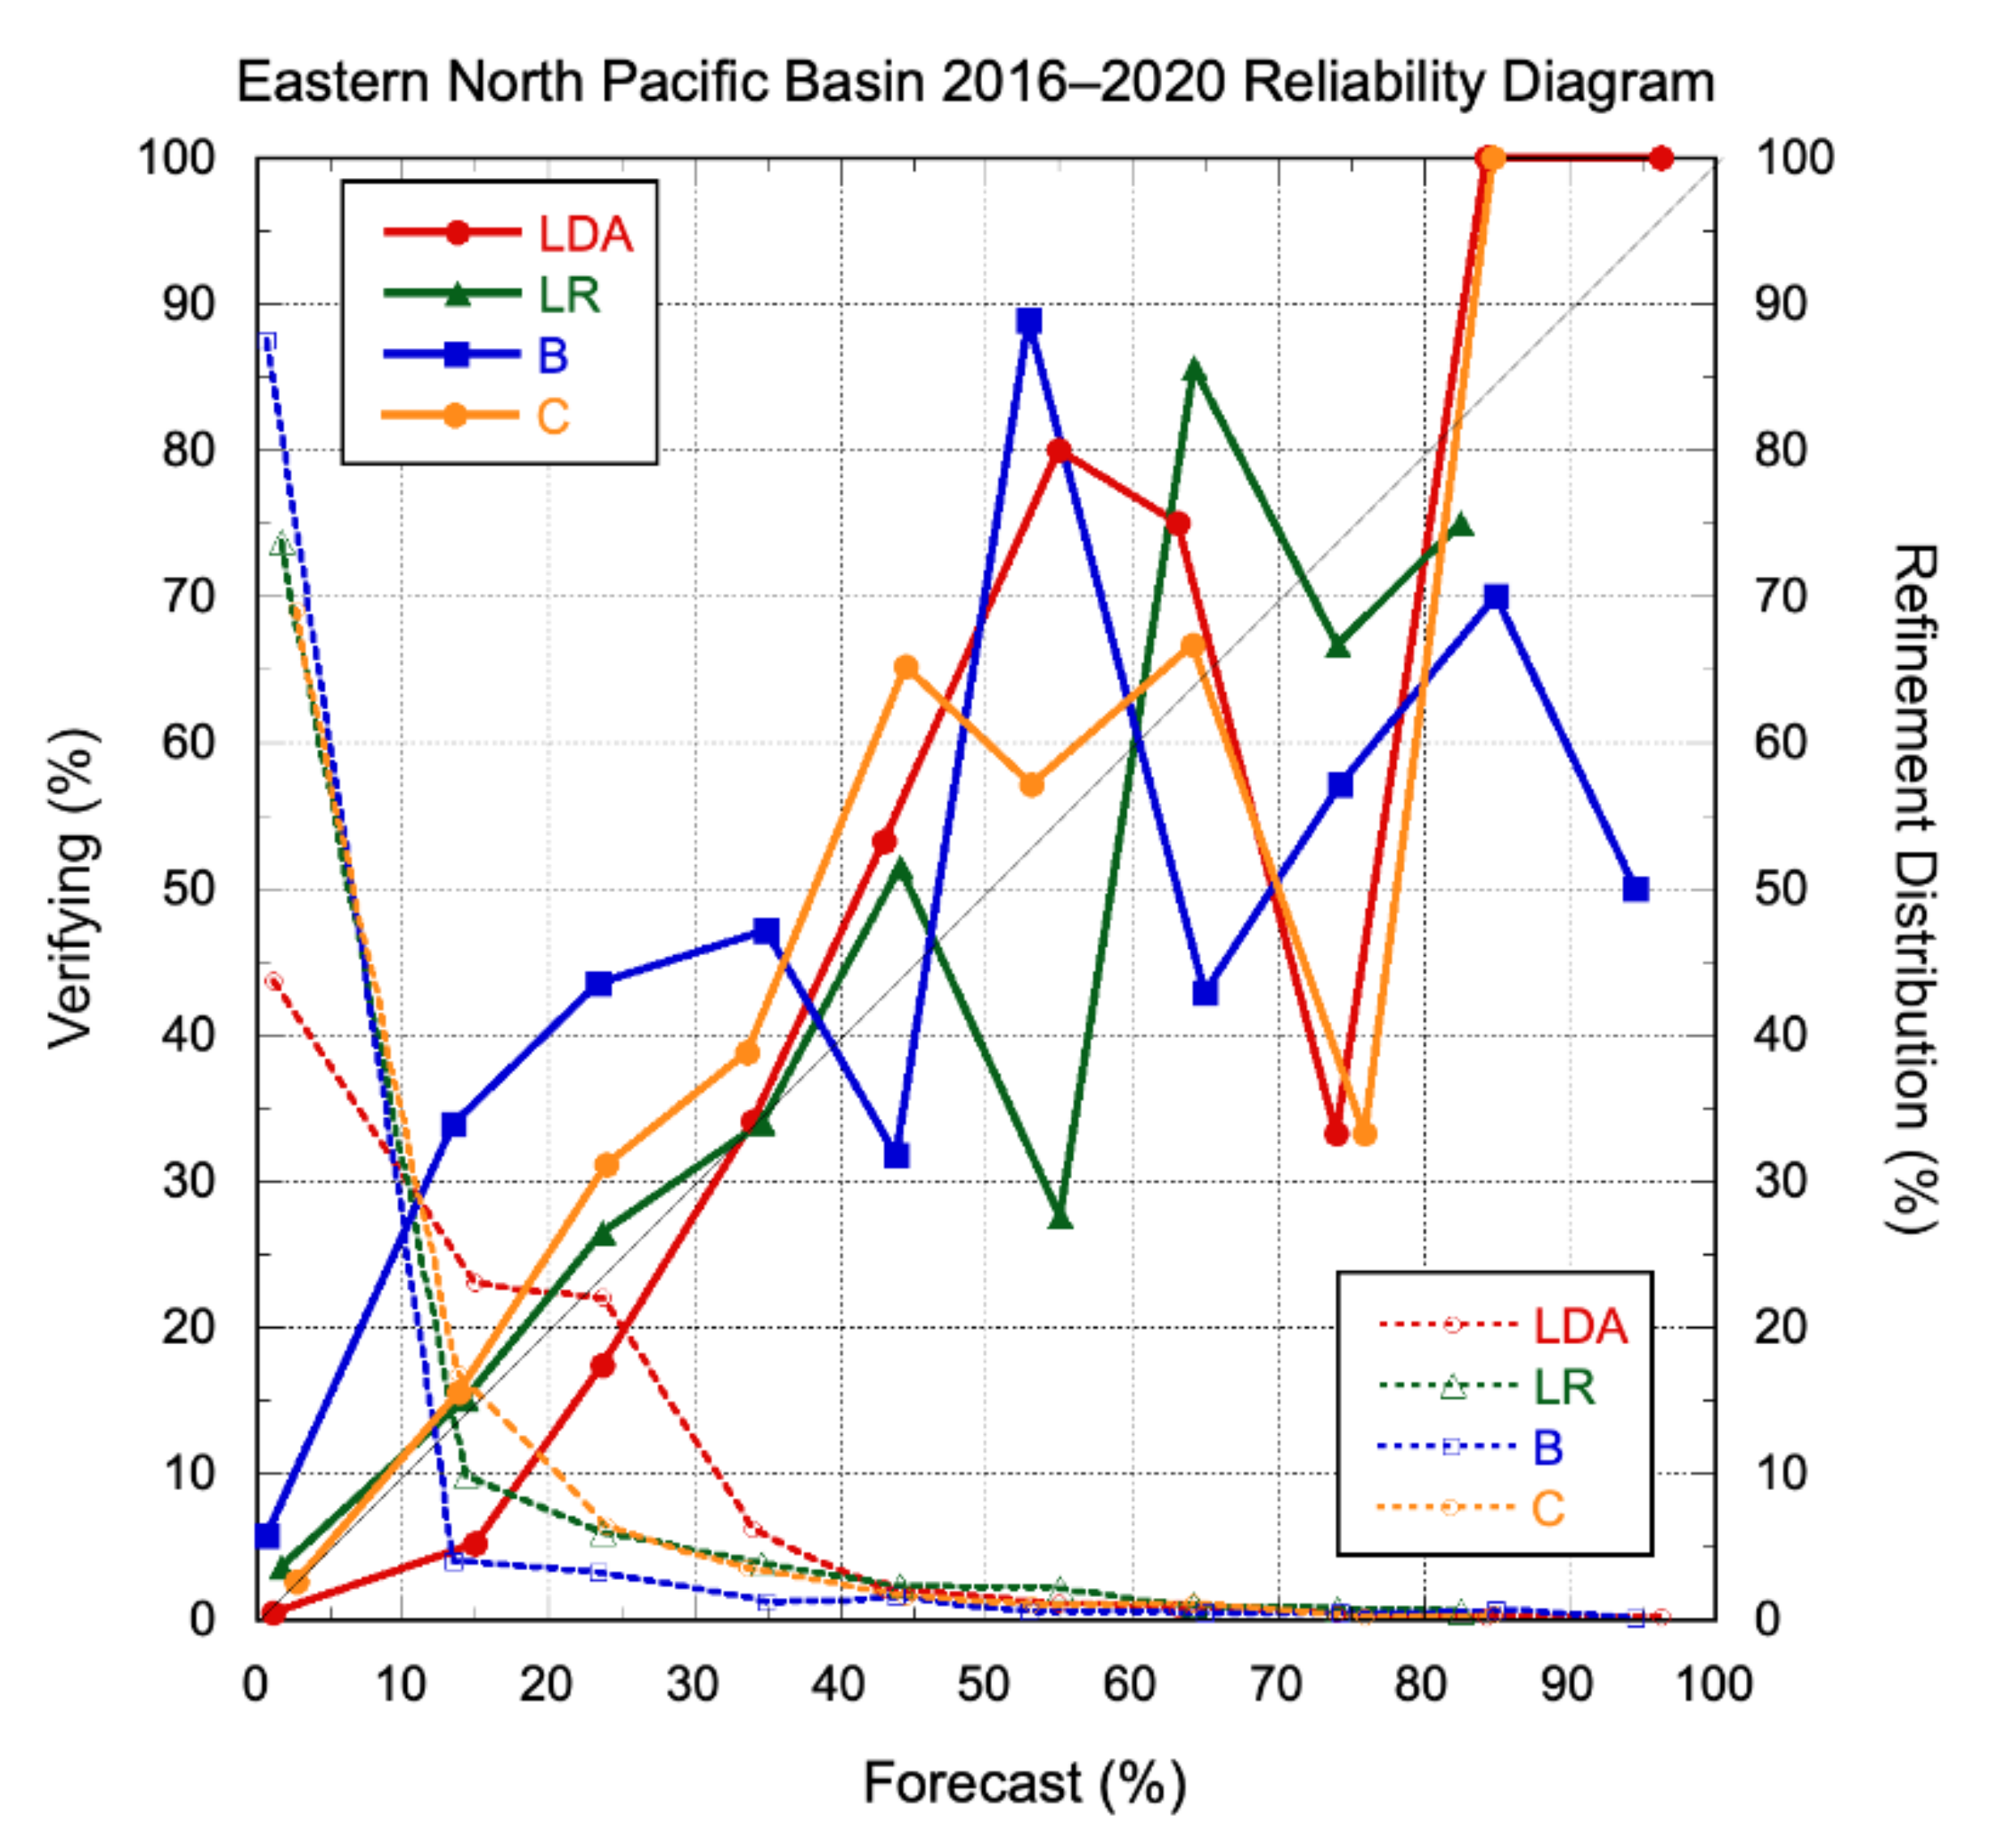
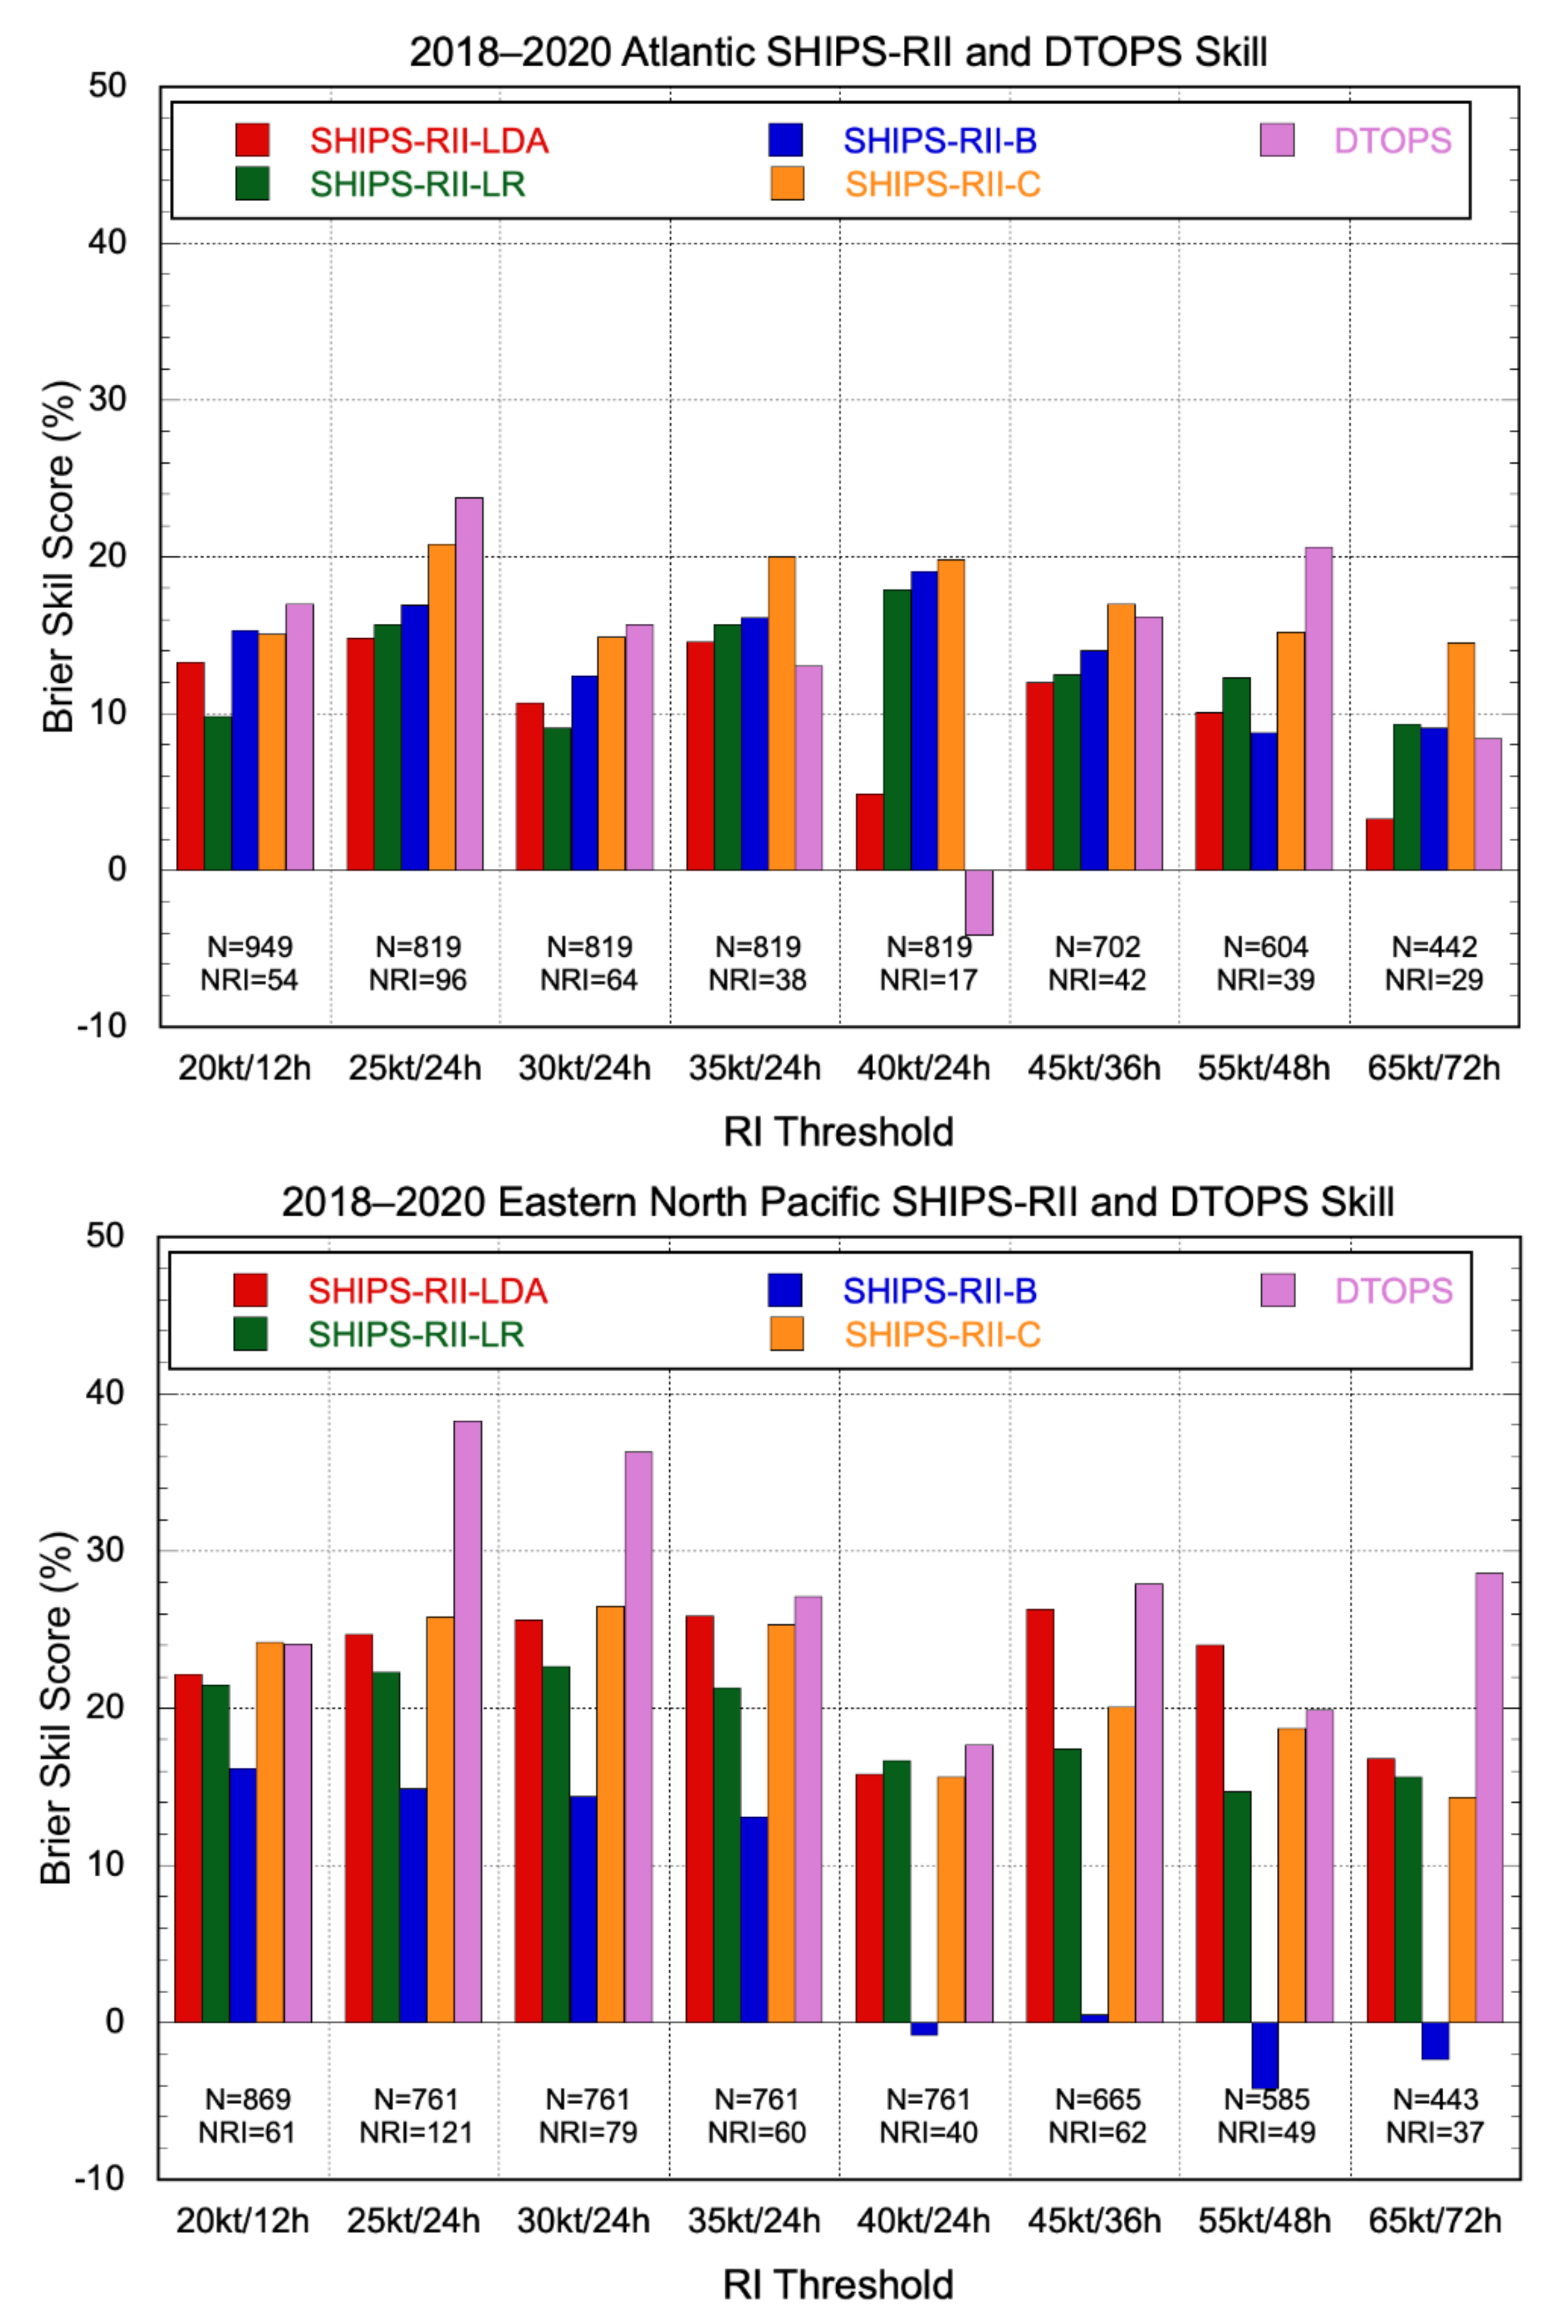
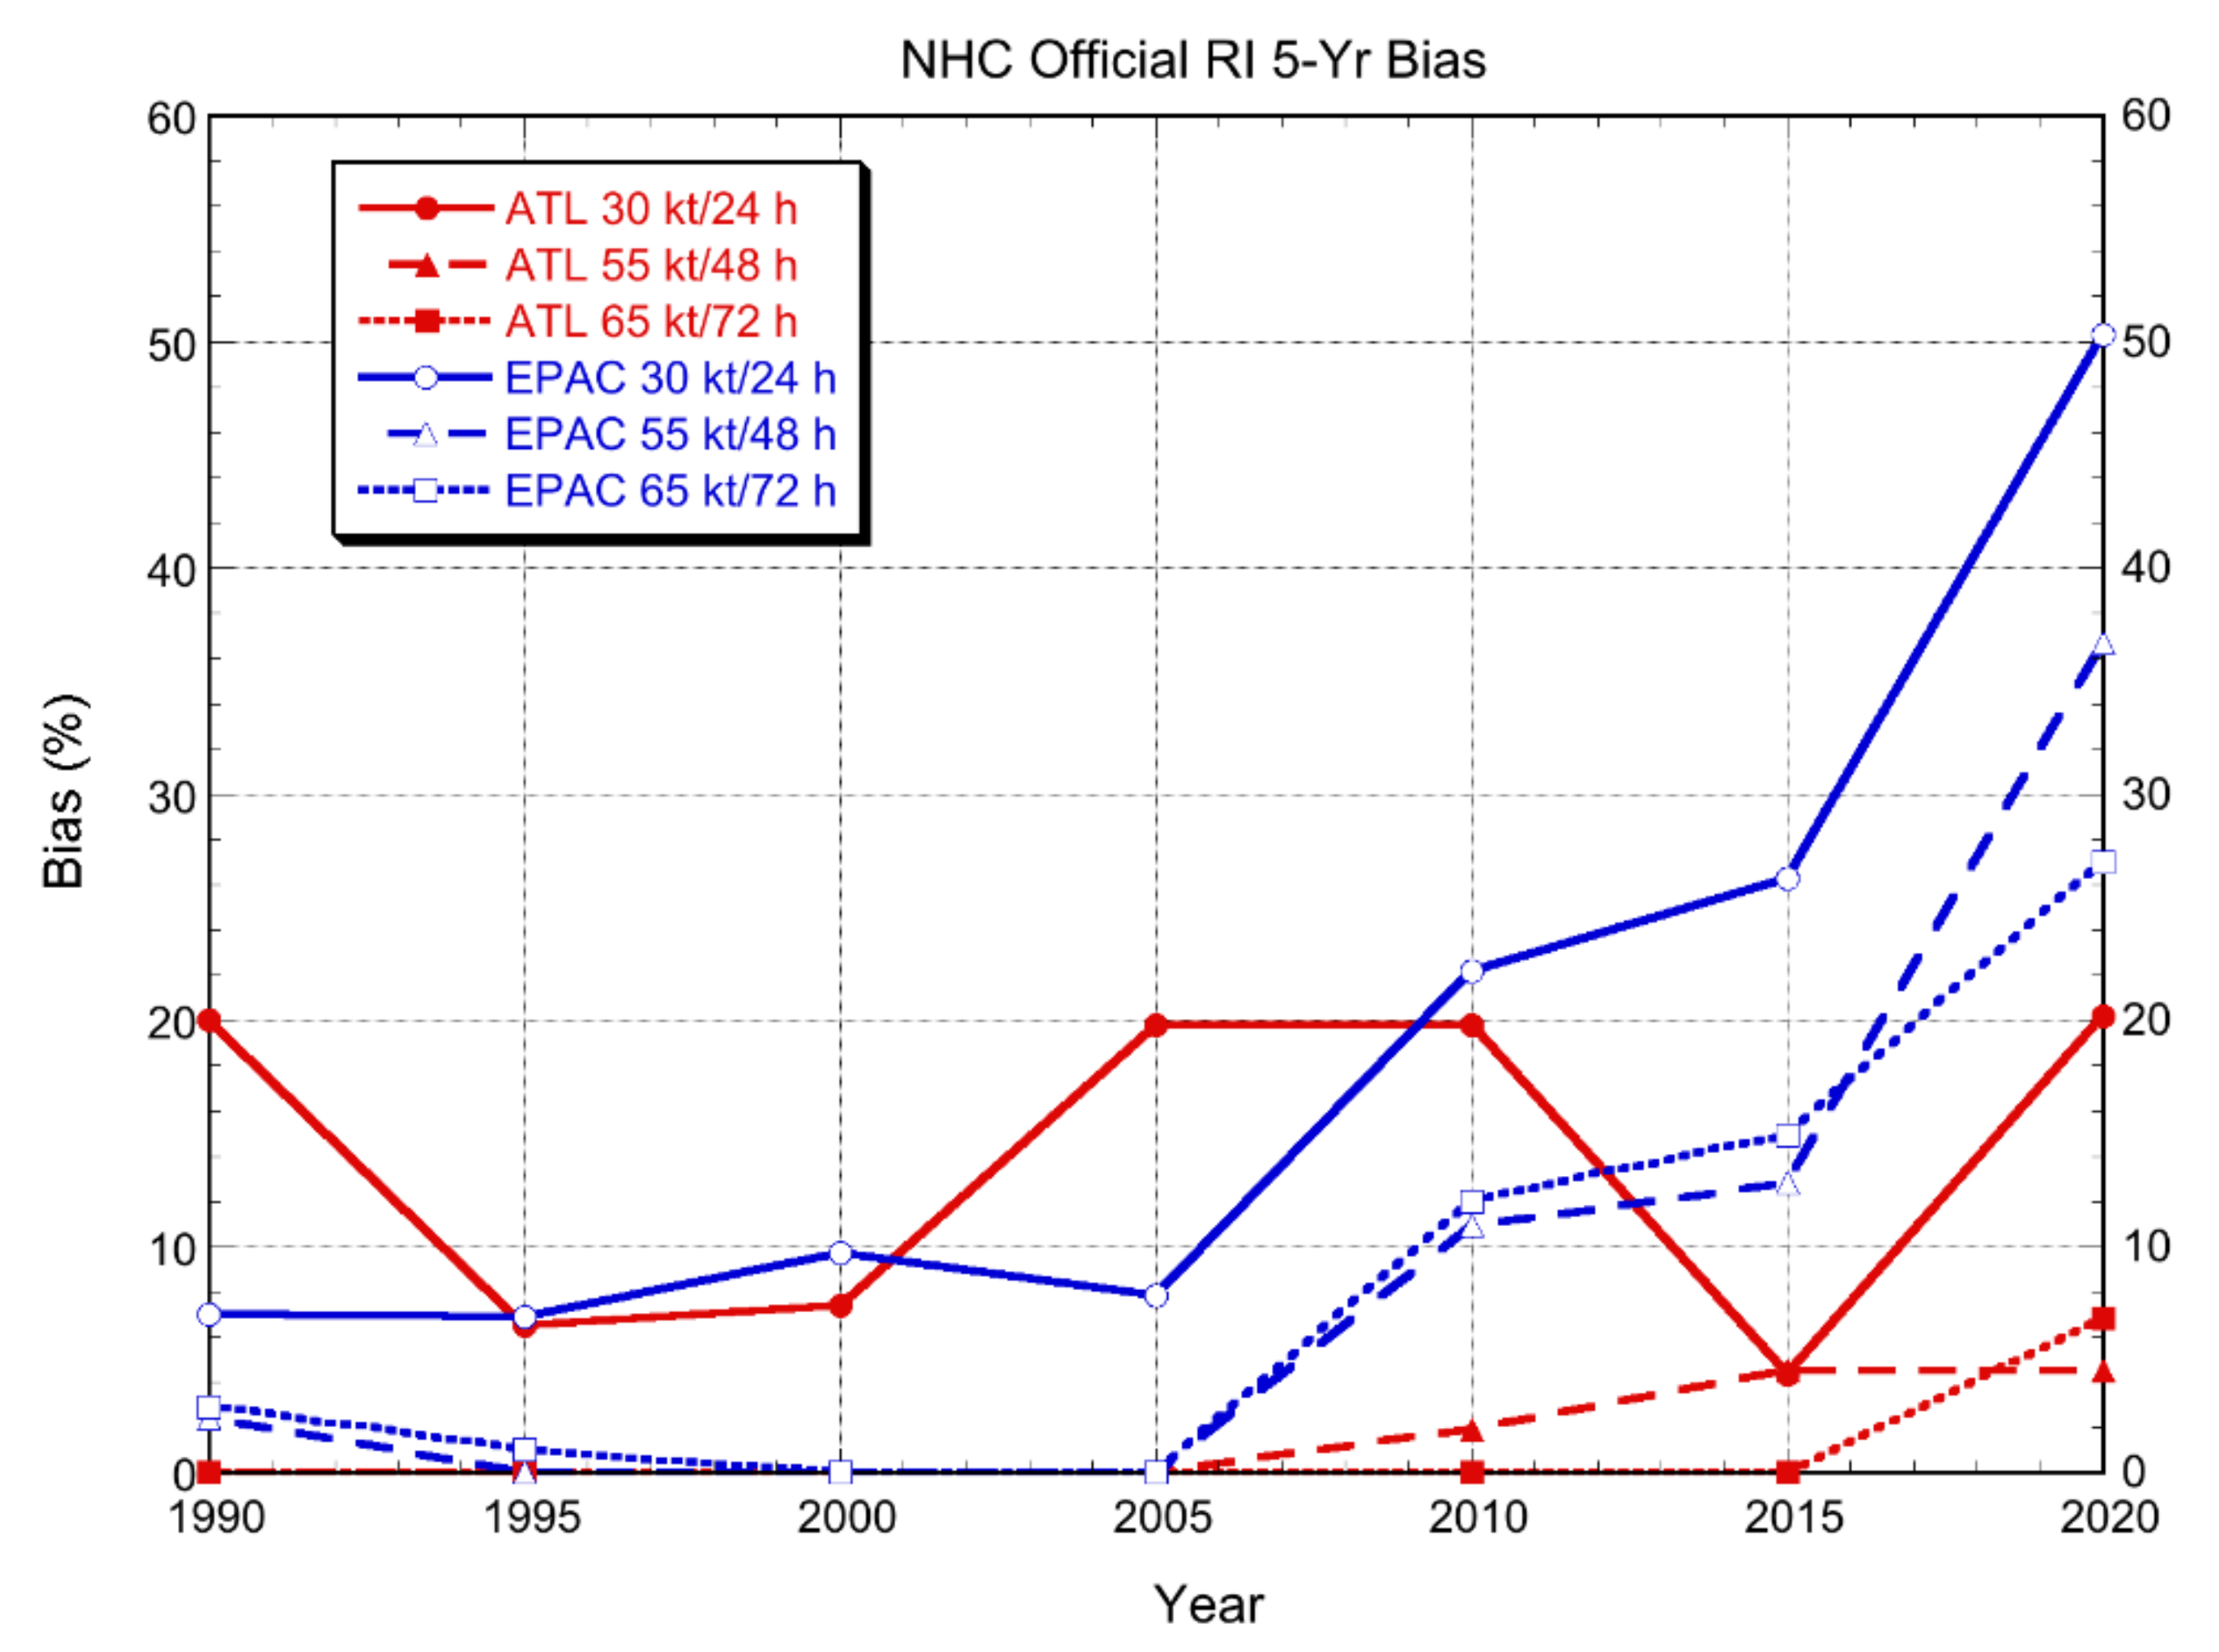
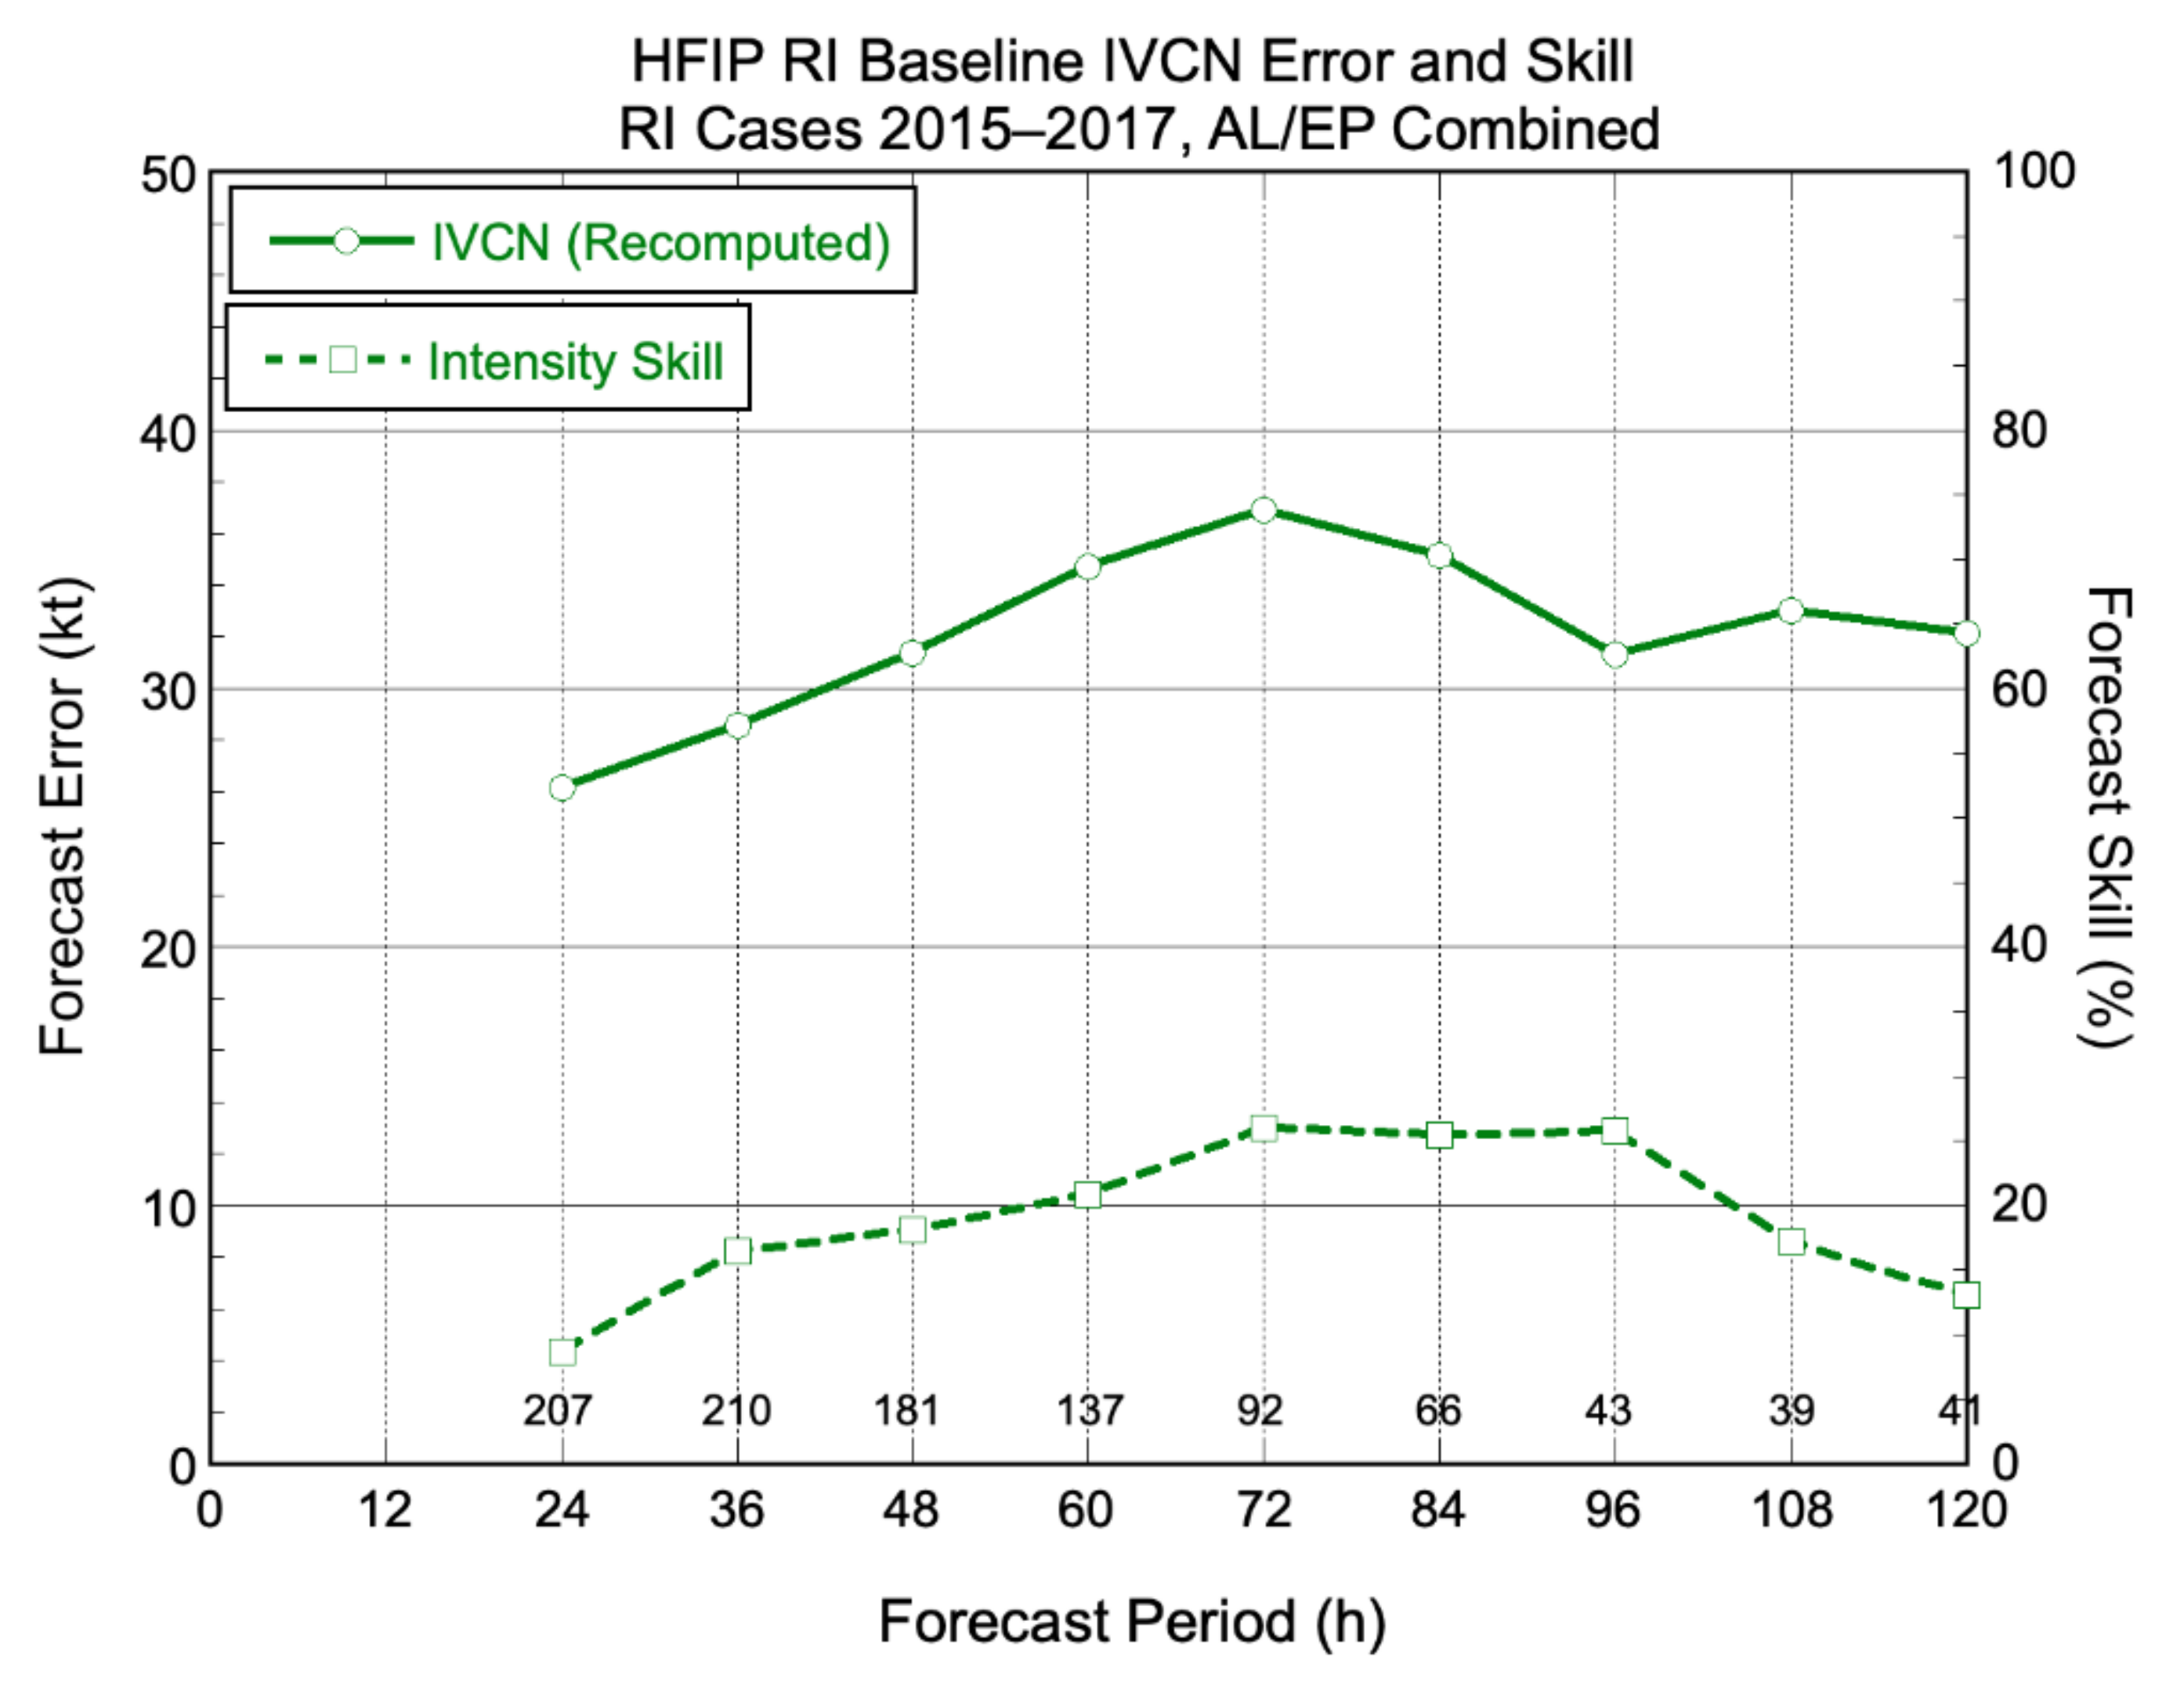
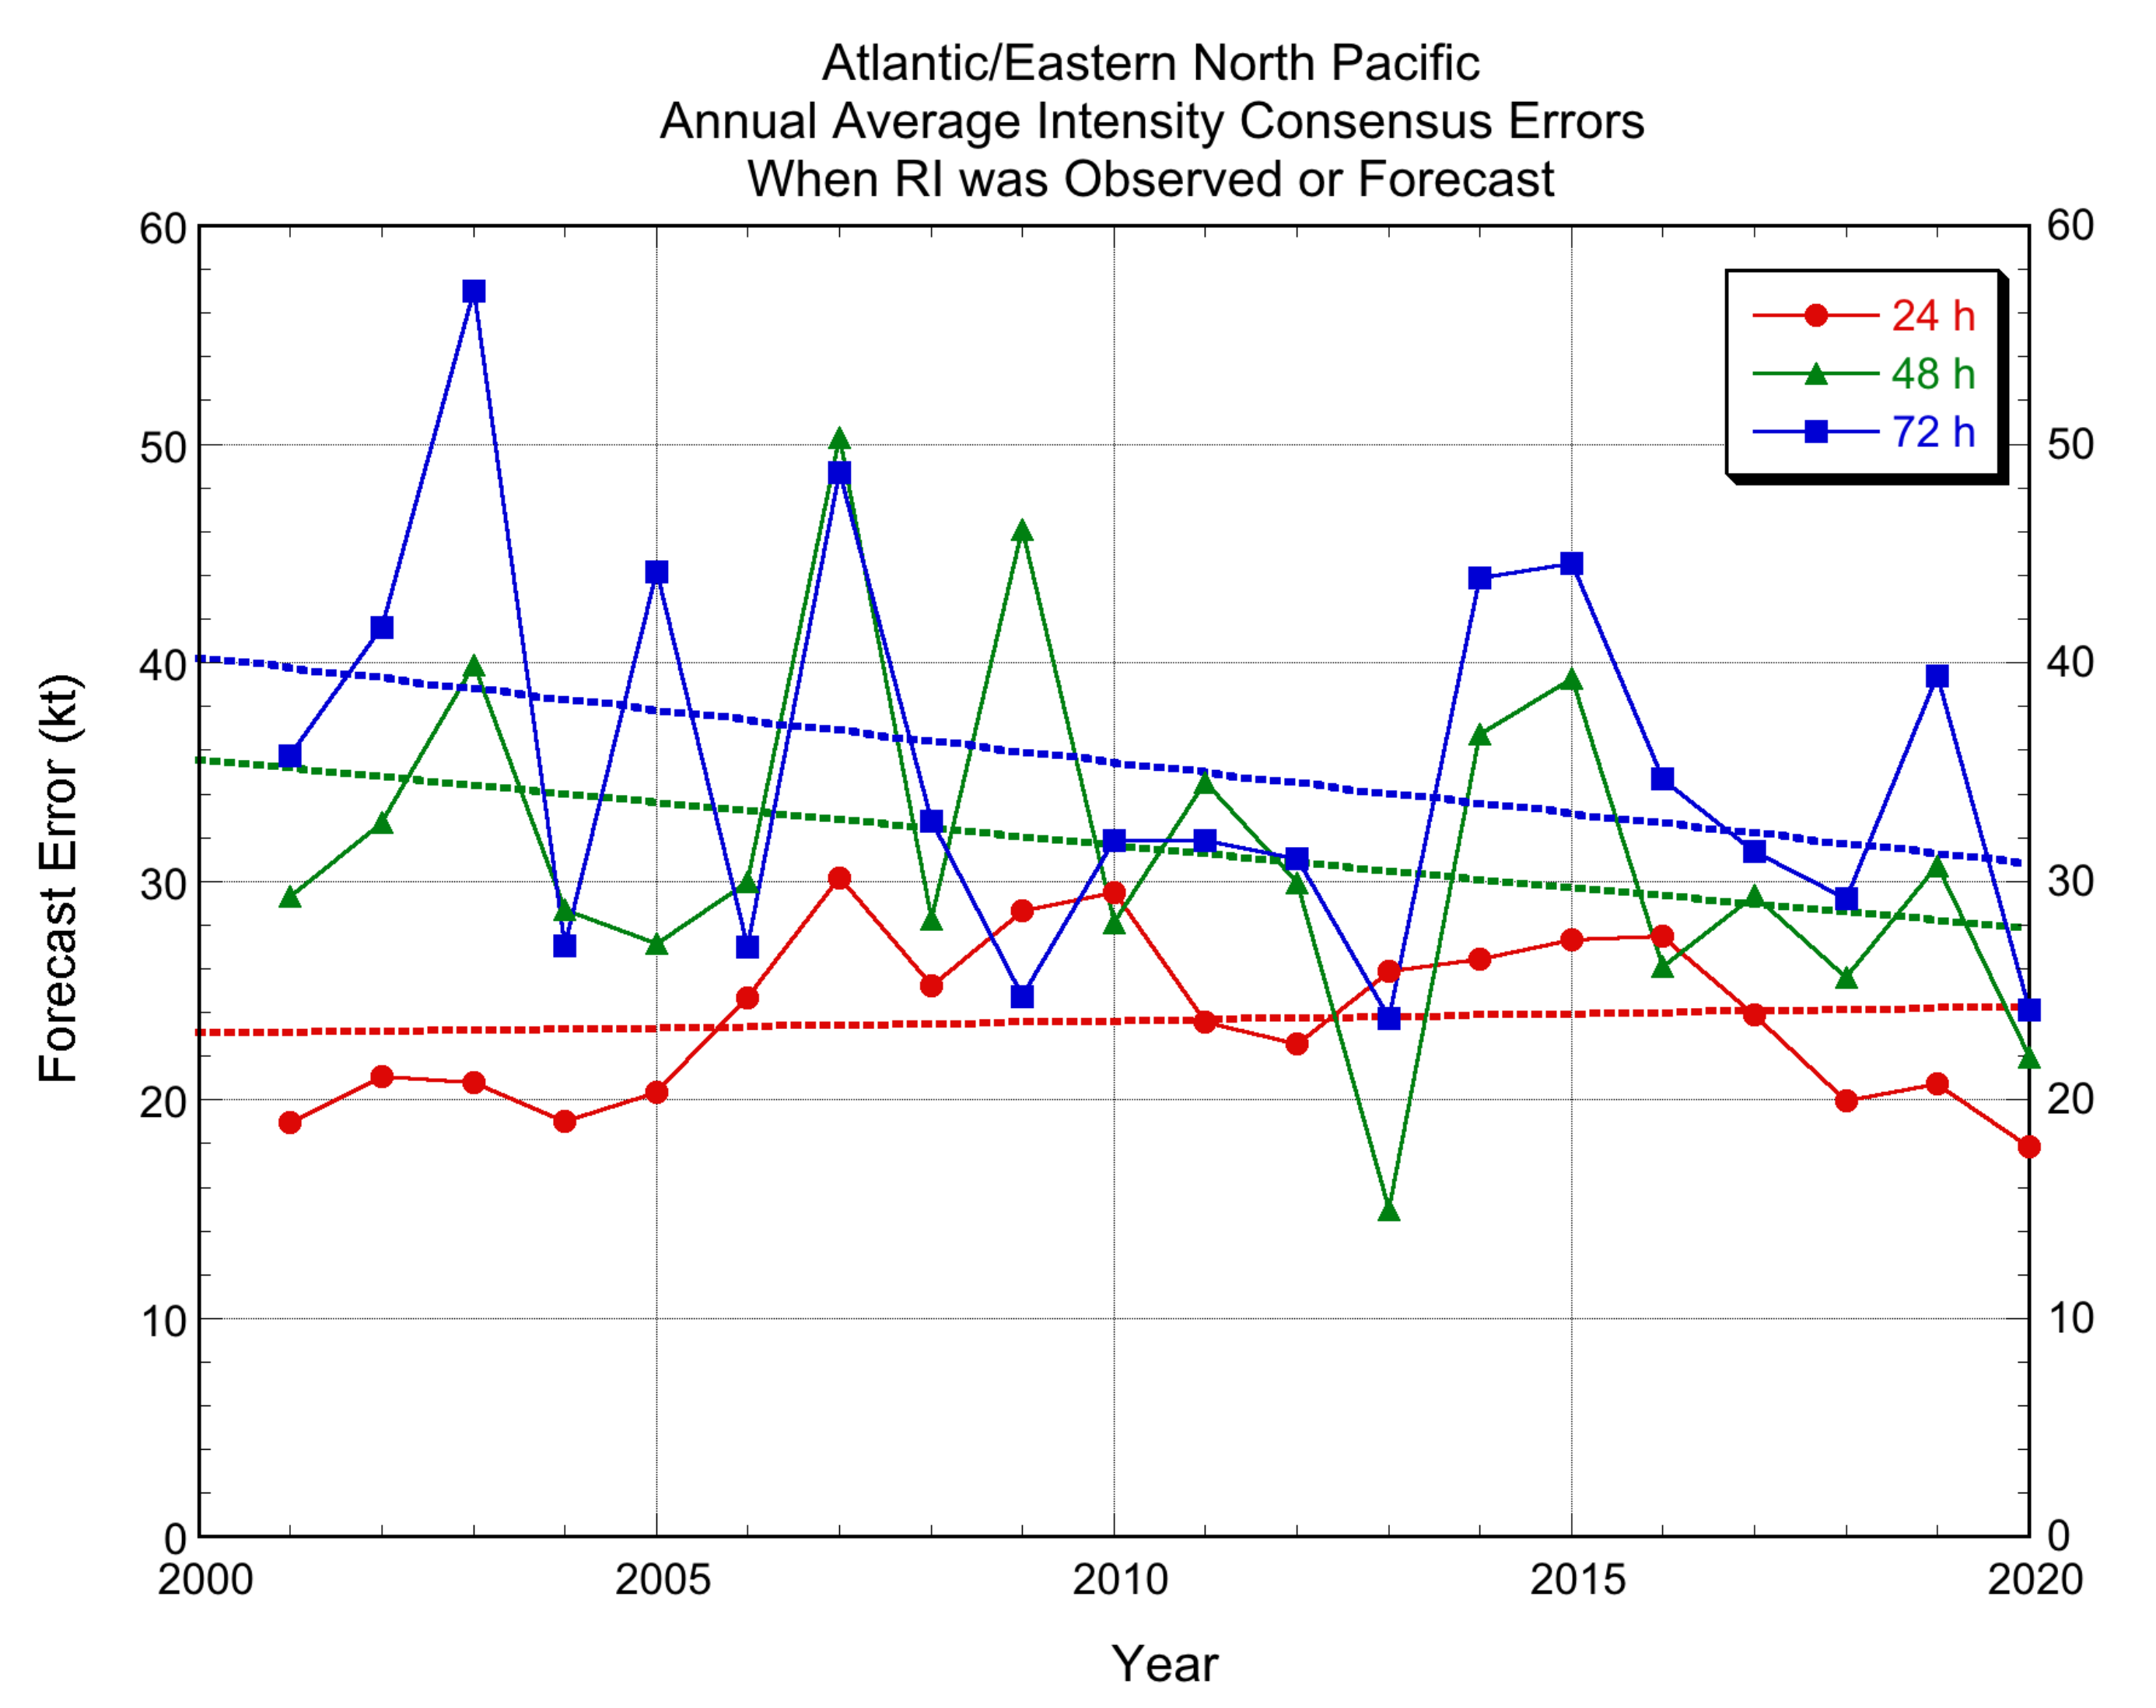
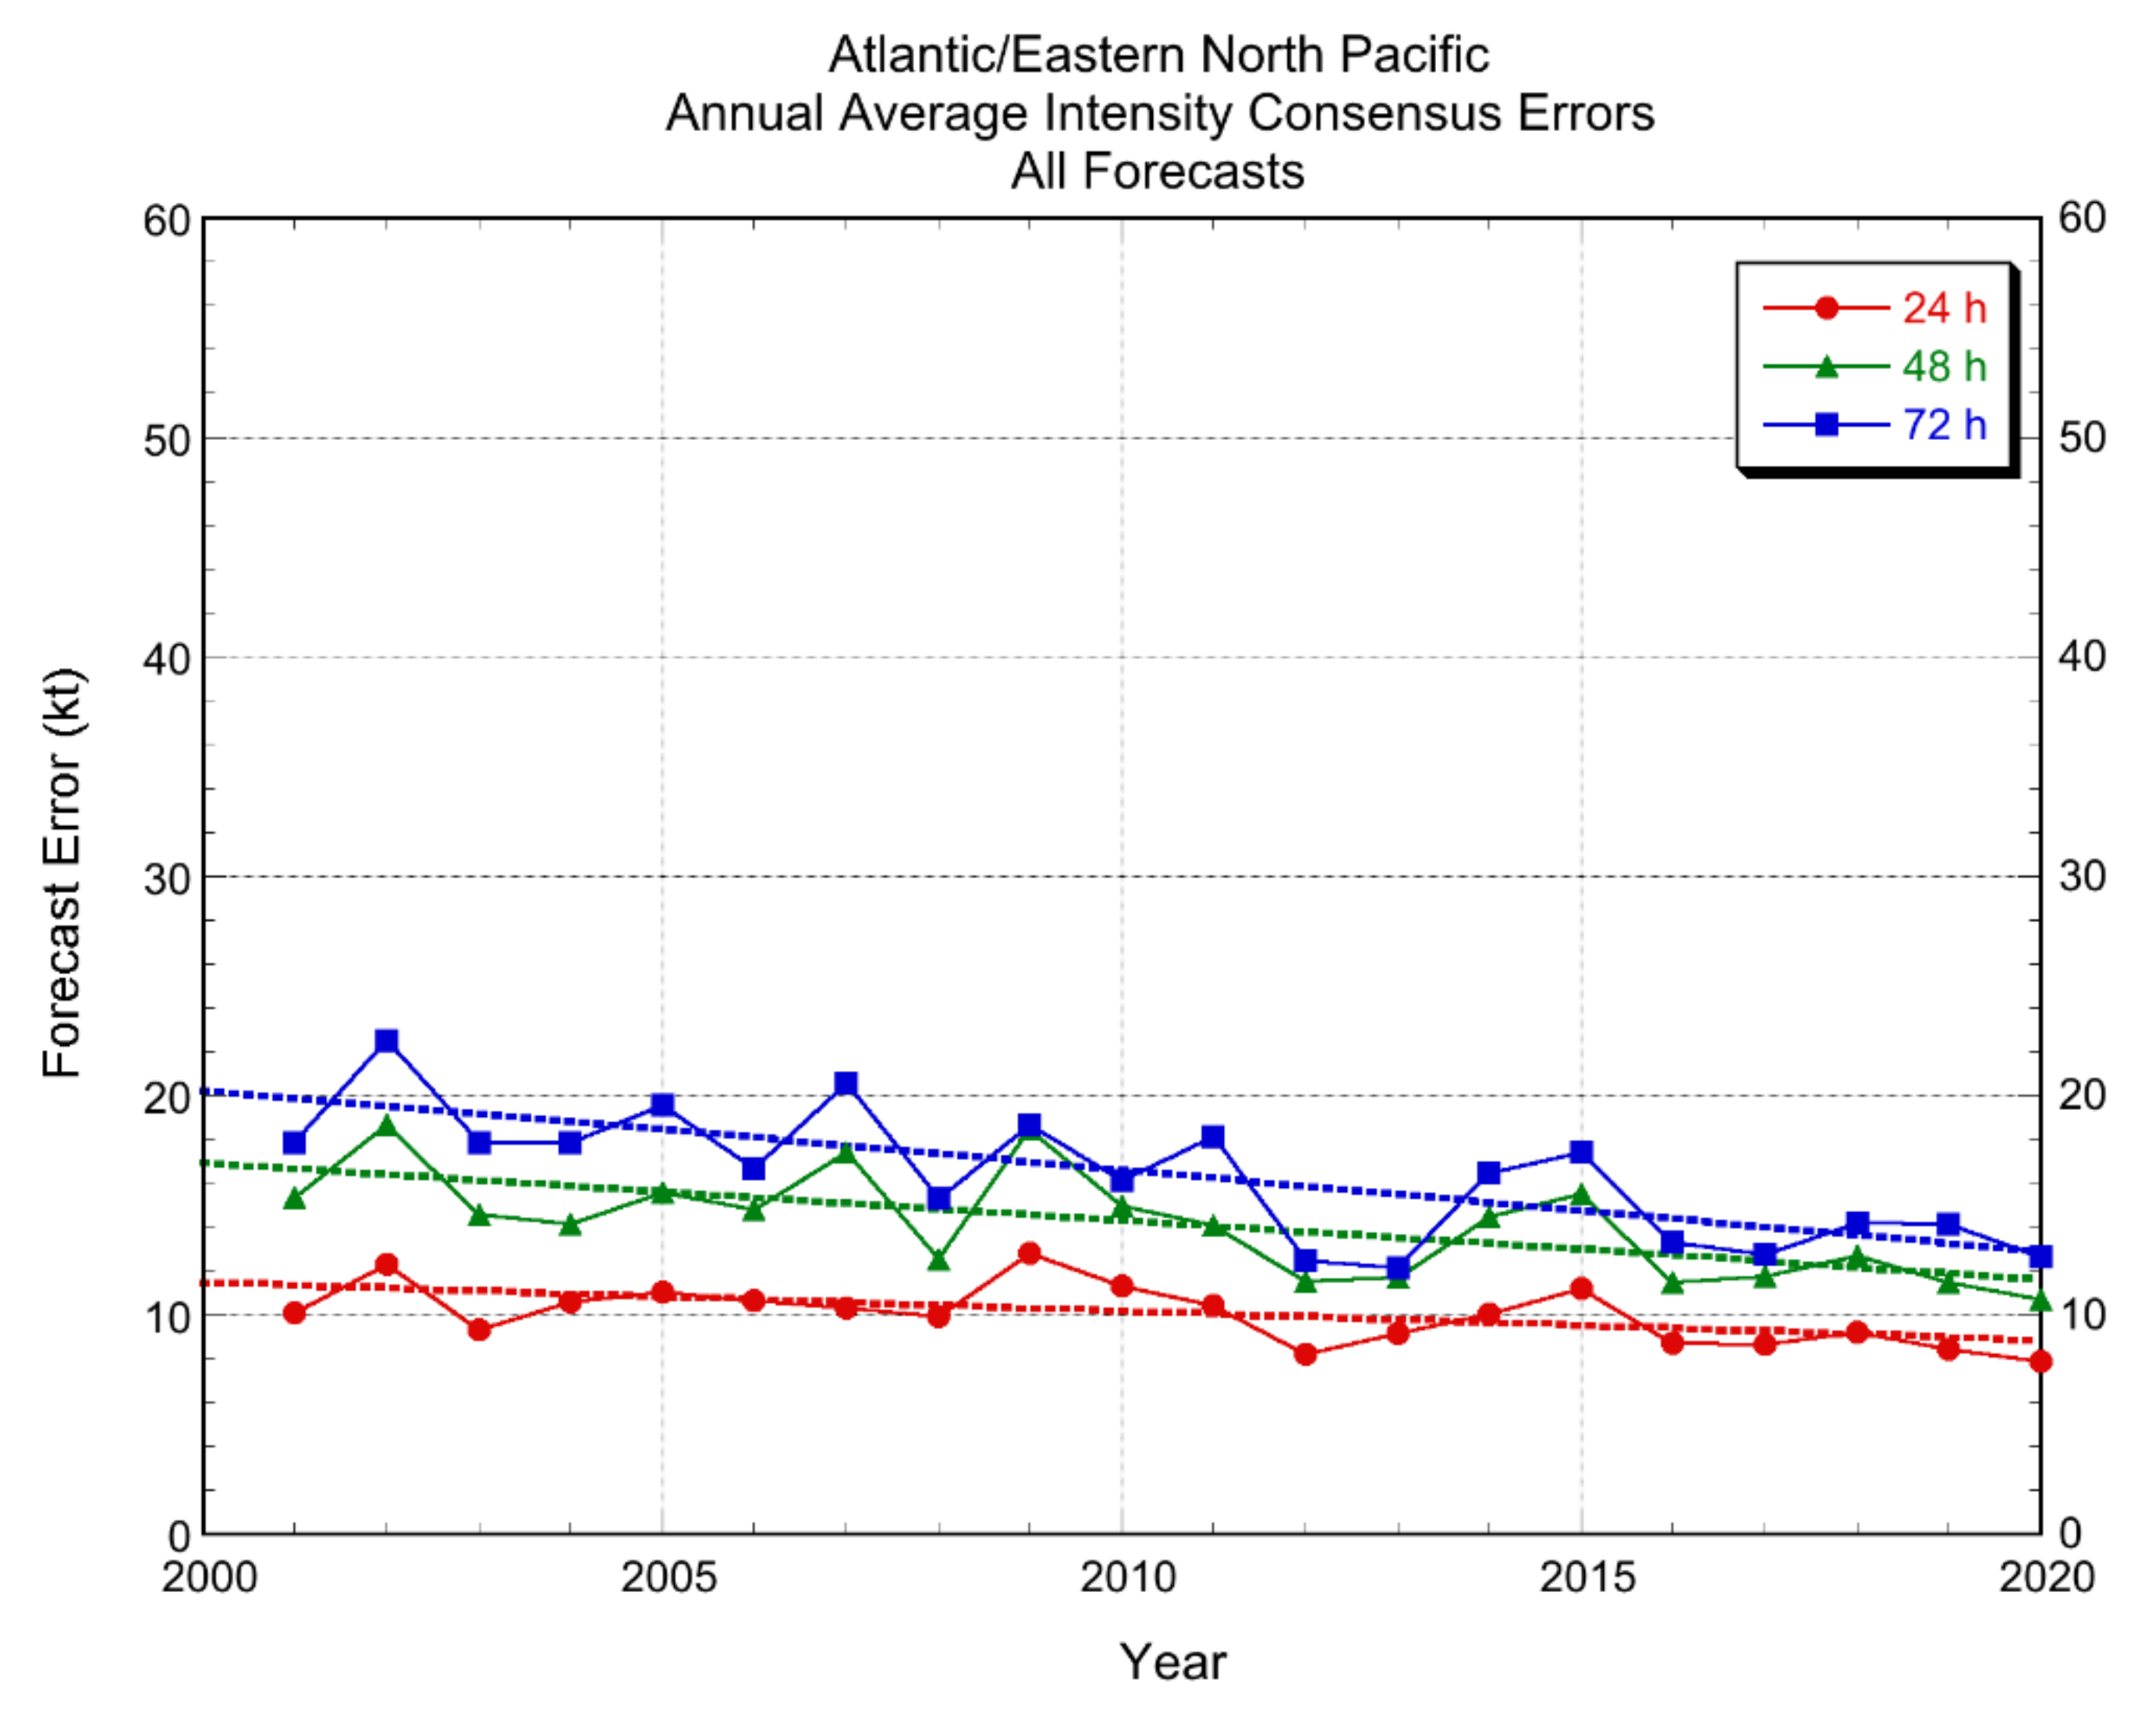
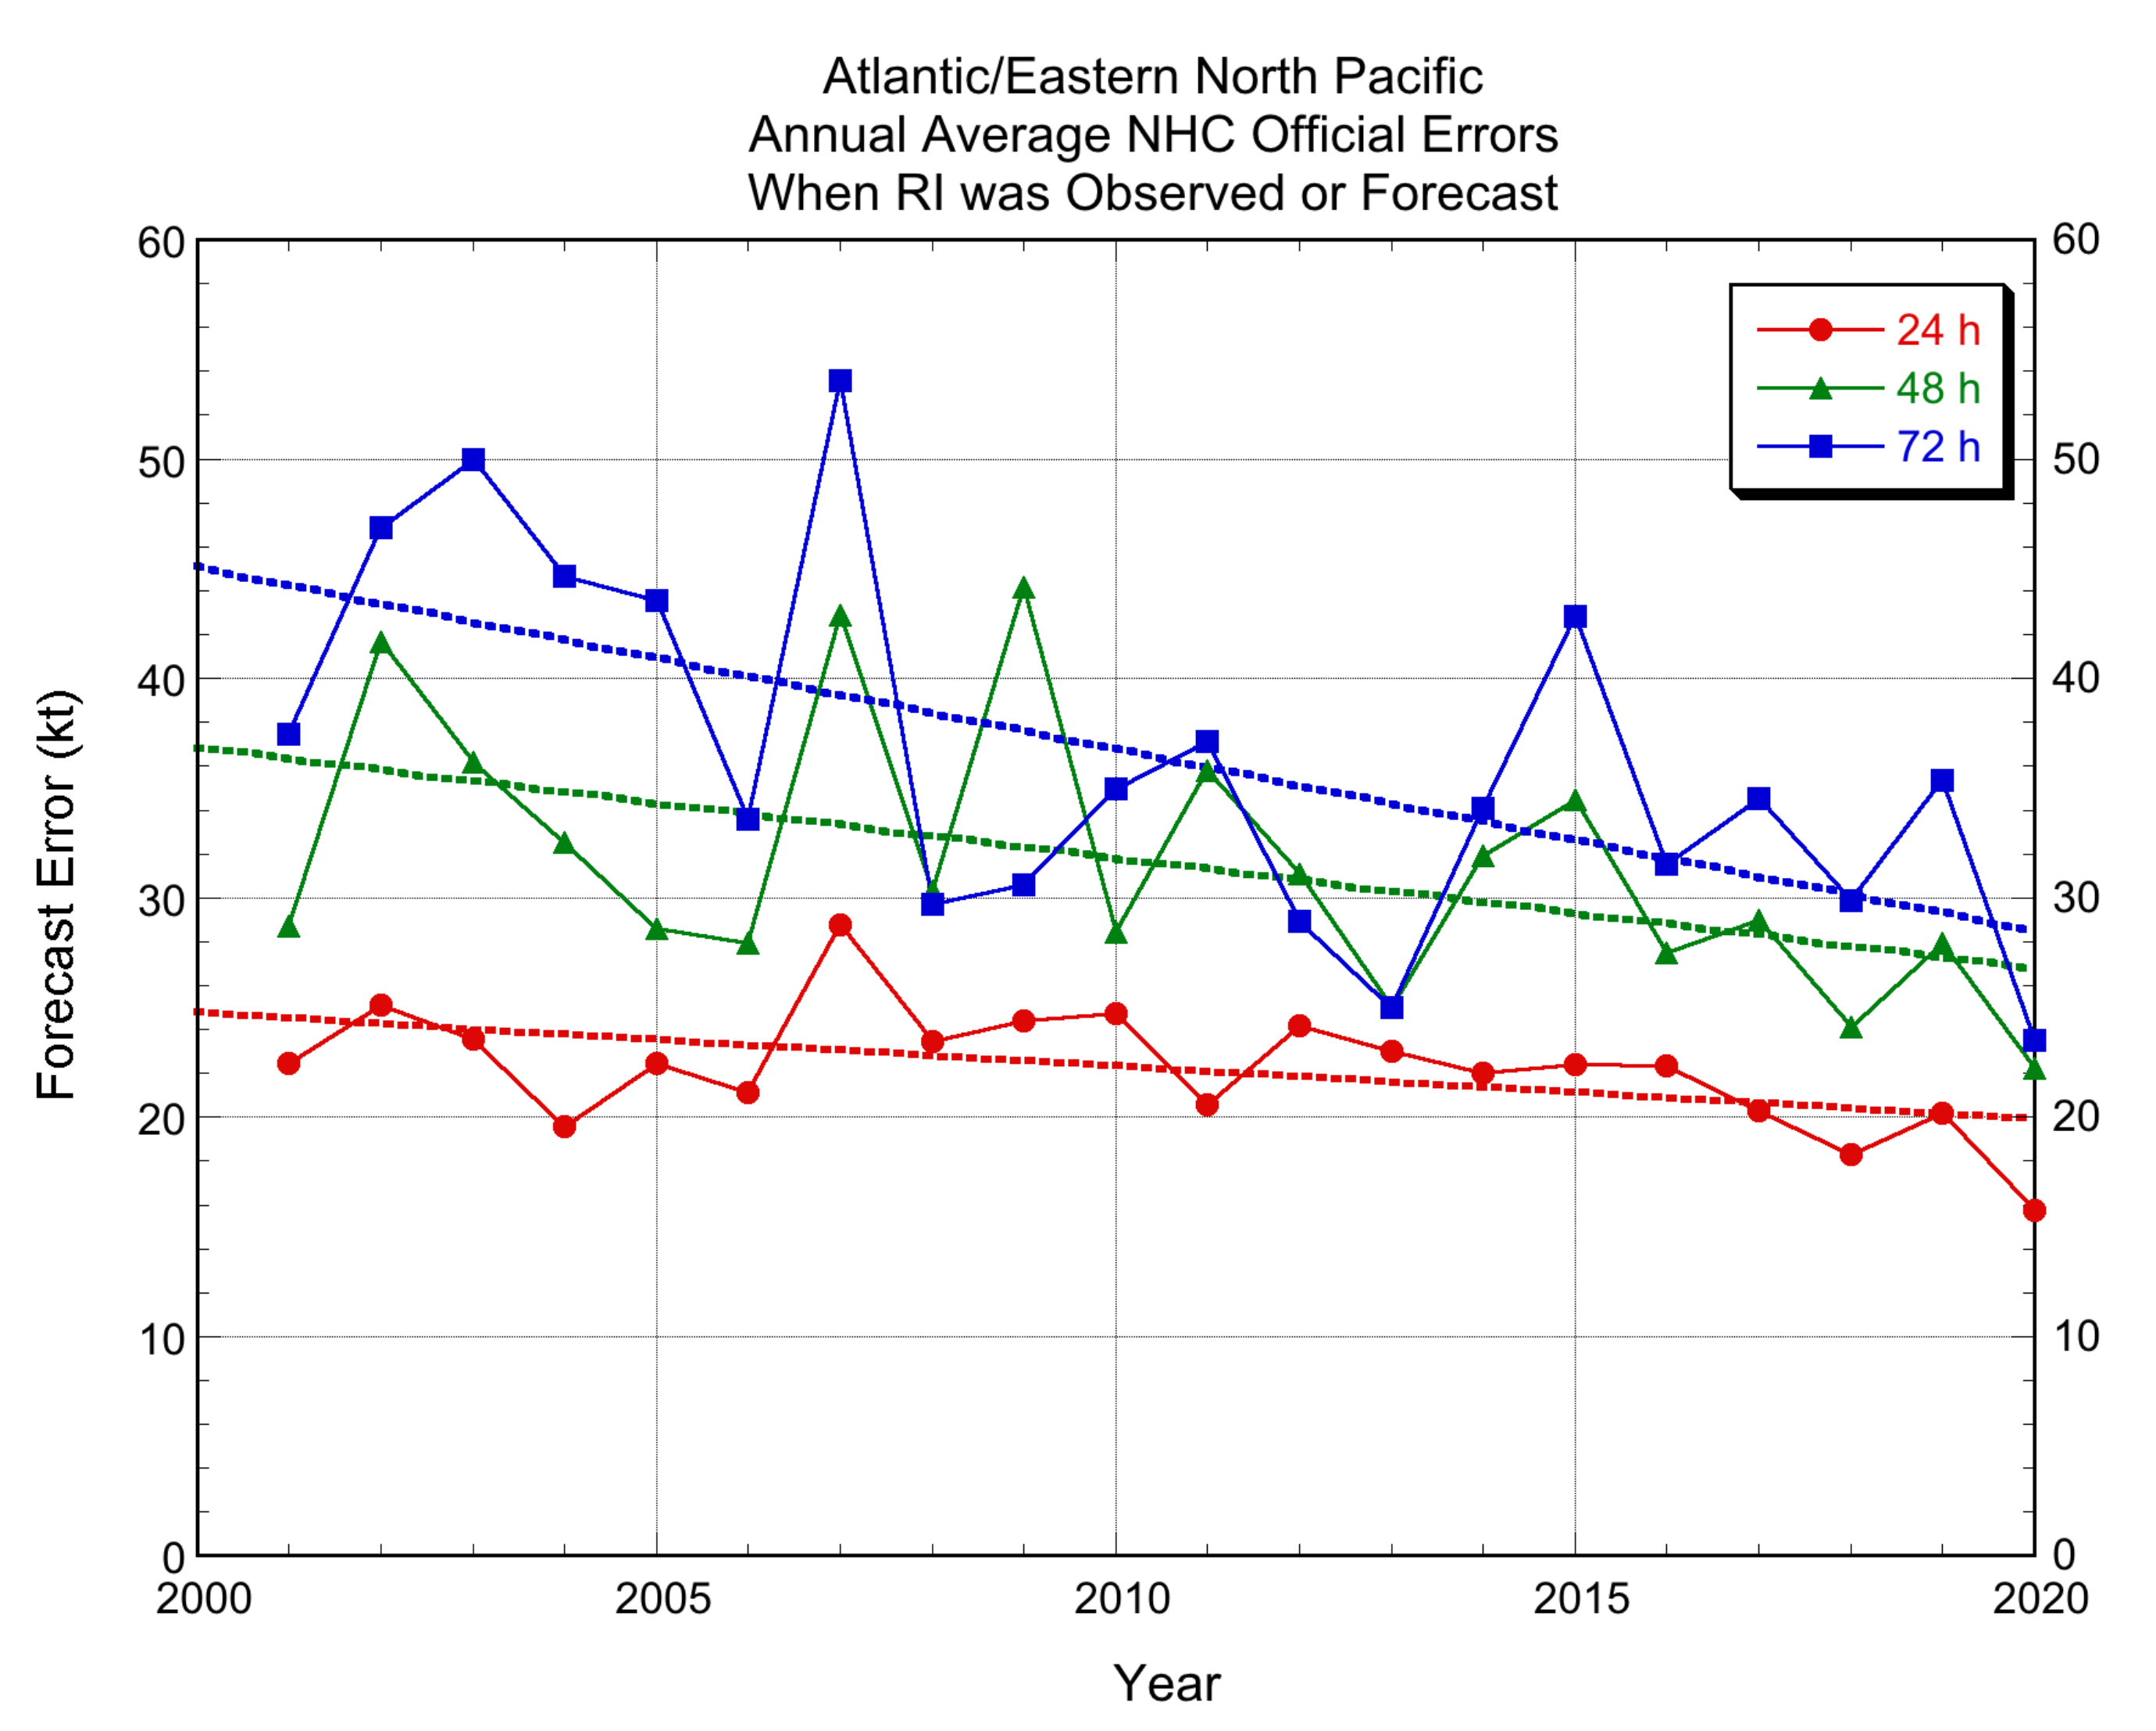
Table 1.
Contingency table verification metrics.
| Parameter | Definition |
|---|---|
| a | Event forecasted and observed |
| b | Event forecasted but not observed |
| c | Event not forecasted but observed |
| d | Event not forecasted and not observed |
| a/(a + c) | Probability of detection (POD) |
| b/(a + b) | False alarm ratio (FAR) |
| (a + b)/(a + c) | Bias (Bd) |
Table 2.
NHC’s deterministic intensity guidance.
| ATCF Model Name | Type | Years in Operations |
|---|---|---|
| SHIPS | Statistical–dynamical | 1991–2020 |
| LGEM | Statistical–dynamical | 2006–2020 |
| GFDI | Regional dynamical | 1996–2016 |
| HWFI | Regional dynamical | 2007–2020 |
| HMNI | Regional dynamical | 2017–2020 |
| GFSI | Global dynamical | 1994–2020 |
| ICON | Consensus | 2006–2020 |
| IVCN | Consensus | 2008–2020 |
| HCCA | Consensus | 2015–2020 |
Table 3.
NHC’s probabilistic RI guidance.
| Model Name | Type | Years in Operations |
| SHIPS-RII-T | Threshold method | 2001–2005 |
| SHIPS-RII-LDA | Linear discriminant analysis | 2006–2020 |
| SHIPS-RII-LR | Logistic regression | 2016–2020 |
| SHIPS-RII-B | Bayesian method | 2016–2020 |
| SHIPS-RII-C | Consensus | 2016–2020 |
| DTOPS | Consensus logistic regression | 2018–2020 |
Table 4.
DTOPS term definitions and standardized coefficients for the Atlantic (AL) and eastern North Pacific (EP) models. All terms are standardized by subtracting the mean and dividing by the standard deviation. Each of the standard deviation (STD) terms in rows 10–14 are step function terms that have a value of either 0 or 1 before standardization. If the ΔV (forecast change in maximum wind) or ΔP (forecast change in minimum pressure) exceeds 1.25 standard deviations, the pre-normalization value is set to 1.
| Predictor | Definition | Normalized Coefficient (AL) | Normalized Coefficient (EP) |
|---|---|---|---|
| Intercept term | b0 in Equation (4) | −3.94 | −4.27 |
| GFSI ΔV | GFS intensity change forecast (kt) | 1.34 | 1.13 |
| EMXI ΔP | ECMWF pressure change forecast (mb) | 0.49 | 0.67 |
| HWFI ΔV | HWFI intensity change forecast (kt) | −0.26 | 0.37 |
| LGEM ΔV | LGEM intensity change forecast (kt) | 0.42 | 0.02 |
| SHIPS ΔV | SHIPS intensity change forecast (kt) | 0.70 | 2.37 |
| (TC Intensity)2 | TC initial intensity (kt) squared | −2.52 | −3.93 |
| (TC Intensity) * cos(latitude) | TC initial intensity (kt) multiplied by the cosine of TC initial latitude | 3.33 | 4.13 |
| (HWFI ΔV)*(SHIPS ΔV) | HWFI intensity change forecast multiplied by SHIPS intensity change forecast (kt) | 0.30 | −0.53 |
| Standardized STD(GFS ΔV) | (see table caption) | 0.10 | −0.75 |
| Standardized STD(ECMWF ΔP) | 0.21 | 0.36 | |
| Standardized STD(HWFI ΔV) | 0.01 | 0.02 | |
| Standardized STD(LGEM ΔV) | −0.31 | −0.14 | |
| Standardized STD(SHIPS ΔV) | 0.17 | −0.14 |
Table 5.
Sample sizes of the NHC official forecasts, which is the maximum for the deterministic model verification. N is the yearly average number of forecasts, N-RI is the yearly average number of RI cases, and %RI is the percent of forecasts where RI was observed.
Table 5.
Sample sizes of the NHC official forecasts, which is the maximum for the deterministic model verification. N is the yearly average number of forecasts, N-RI is the yearly average number of RI cases, and %RI is the percent of forecasts where RI was observed.
| Atlantic | 30 kt/24 h | 55 kt/48 h | 65 kt/72 h | ||||||
|---|---|---|---|---|---|---|---|---|---|
| Years | N | N-RI | %RI | N | N-RI | %RI | N | N-RI | %RI |
| 1986–1990 | 176.8 | 9.0 | 5.1 | 141.0 | 3.4 | 2.4 | 108.6 | 3.4 | 3.1 |
| 1991–1995 | 215.4 | 12.4 | 5.8 | 168.2 | 6.0 | 3.6 | 136.0 | 5.4 | 4.0 |
| 1996–2000 | 278.8 | 19.0 | 6.8 | 230.6 | 8.8 | 3.8 | 190.4 | 11.0 | 5.8 |
| 2001–2005 | 348.6 | 20.2 | 5.8 | 282.0 | 14.8 | 5.2 | 227.6 | 17.8 | 7.8 |
| 2006–2010 | 217.8 | 19.2 | 8.8 | 167.8 | 10.4 | 6.2 | 132.4 | 8.6 | 6.5 |
| 2011–2015 | 218.8 | 9.2 | 4.2 | 164.6 | 4.4 | 2.7 | 122.0 | 4.2 | 3.4 |
| 2016–2020 | 351.4 | 24.8 | 7.1 | 279.4 | 13.2 | 4.7 | 219.6 | 8.8 | 4.0 |
| 1986–2020 | 258.2 | 16.3 | 6.3 | 204.8 | 8.7 | 4.3 | 162.4 | 8.5 | 5.2 |
| Eastern Pacific | 30 kt/24 h | 55 kt/48 h | 65 kt/72 h | ||||||
| Years | N | N-RI | %RI | N | N-RI | %RI | N | N-RI | %RI |
| 1988–1990 | 312.7 | 23.7 | 7.6 | 269.7 | 14.0 | 5.2 | 221.7 | 11.7 | 5.3 |
| 1991–1995 | 383.0 | 35.0 | 9.1 | 320.2 | 24.6 | 7.7 | 268.4 | 19.2 | 7.2 |
| 1996–2000 | 253.6 | 20.6 | 8.1 | 195.8 | 11.8 | 6.0 | 150.8 | 9.2 | 6.1 |
| 2001–2005 | 248.4 | 18.0 | 7.2 | 188.6 | 11.4 | 6.0 | 140.0 | 7.8 | 5.6 |
| 2006–2010 | 244.0 | 18.0 | 7.4 | 189.4 | 9.2 | 4.9 | 139.8 | 5.0 | 3.6 |
| 2011–2015 | 314.6 | 34.2 | 10.9 | 245.2 | 21.8 | 8.9 | 187.2 | 14.8 | 7.9 |
| 2016–2020 | 318.8 | 33.0 | 10.4 | 249.8 | 19.6 | 7.8 | 193.6 | 14.8 | 7.6 |
| 1988–2020 | 295.5 | 26.2 | 8.9 | 235.0 | 16.2 | 6.9 | 183.8 | 11.8 | 6.4 |
Table 6.
POD and FAR (%) for the 2016–2020 Atlantic and eastern Pacific samples for NHC’s deterministic intensity models for three RI thresholds.
Table 6.
POD and FAR (%) for the 2016–2020 Atlantic and eastern Pacific samples for NHC’s deterministic intensity models for three RI thresholds.
| POD | Atlantic | Eastern Pacific | ||||
|---|---|---|---|---|---|---|
| 30 kt/24 h | 55 kt/48 h | 65 kt/72 h | 30 kt/24 h | 55 kt/48 h | 65 kt/72 h | |
| SHIPS | 3 | 0 | 0 | 18 | 24 | 19 |
| LGEM | 4 | 0 | 0 | 14 | 13 | 15 |
| HWFI | 10 | 11 | 12 | 13 | 14 | 14 |
| HMNI | 21 | 4 | 6 | 16 | 15 | 7 |
| GFSI | 1 | 0 | 0 | 7 | 3 | 1 |
| IVCN | 3 | 0 | 0 | 7 | 14 | 8 |
| HCCA | 9 | 5 | 0 | 31 | 29 | 23 |
| OFCL | 14 | 3 | 2 | 35 | 22 | 18 |
| FAR | Atlantic | Eastern Pacific | ||||
| 30 kt/24 h | 55 kt/48 h | 65 kt/72 h | 30 kt/24 h | 55 kt/48 h | 65 kt/72 h | |
| SHIPS | 33 | 0 | 0 | 34 | 43 | 42 |
| LGEM | 17 | 100 | 0 | 23 | 48 | 35 |
| HWFI | 50 | 42 | 75 | 48 | 50 | 41 |
| HMNI | 50 | 85 | 78 | 51 | 21 | 56 |
| GFSI | 0 | 0 | 0 | 45 | 40 | 0 |
| IVCN | 0 | 0 | 0 | 30 | 13 | 25 |
| HCCA | 21 | 0 | 100 | 43 | 40 | 39 |
| OFCL | 32 | 33 | 67 | 31 | 39 | 35 |
Table 7.
Climatological frequency of RI in the Atlantic and eastern Pacific basins for the 1989–2019 period. For eight sets of RI threshold definitions, the table shows the total number of over-water intervals (N), the number of intervals meeting the RI intensity change threshold (NRI), and the corresponding frequency of RI (NRI/N).
| Atlantic Basin | ||||
|---|---|---|---|---|
| Intensity Change (kt) | Interval (h) | N | NRI | Frequency of RI (%) |
| 20 | 12 | 7792 | 385 | 4.9 |
| 25 | 24 | 6775 | 738 | 10.9 |
| 30 | 24 | 6775 | 464 | 6.8 |
| 35 | 24 | 6775 | 262 | 3.9 |
| 40 | 24 | 6775 | 162 | 2.4 |
| 45 | 36 | 5883 | 271 | 4.6 |
| 55 | 48 | 5126 | 239 | 4.7 |
| 65 | 72 | 3917 | 208 | 5.3 |
| EasternPacific Basin | ||||
| Intensity Change (kt) | Interval (h) | N | NRI | Frequency of RI (%) |
| 20 | 12 | 9481 | 602 | 6.3 |
| 25 | 24 | 8414 | 1055 | 12.5 |
| 30 | 24 | 8414 | 723 | 8.6 |
| 35 | 24 | 8414 | 523 | 6.2 |
| 40 | 24 | 8414 | 354 | 4.2 |
| 45 | 36 | 7439 | 495 | 6.7 |
| 55 | 48 | 6542 | 384 | 5.9 |
| 65 | 72 | 4975 | 235 | 4.7 |
Table 8.
HFIP RI performance measure baseline and target errors. Baseline errors are the mean absolute errors over the period 2015–2017 for the Atlantic and eastern North Pacific for the variable consensus, comprising at least two of the models DSHP, LGEM, GHMI, HWFI, and CTCI. Target errors represent 50% of the baseline errors.
| Verification Time (h) | Baseline (kt) | Target (kt) |
|---|---|---|
| 24 | 26.1 | 13.1 |
| 36 | 28.6 | 14.3 |
| 48 | 31.4 | 15.7 |
| 60 | 34.7 | 17.3 |
| 72 | 36.9 | 18.5 |
| 84 | 35.1 | 17.6 |
| 96 | 31.3 | 15.6 |
| 108 | 33.0 | 16.5 |
| 120 | 32.1 | 16.1 |
Table 9.
Annual composition of NHC’s operational intensity consensus.
| Year | Models Used in Consensus |
|---|---|
| 2001 | DSHP, GFDI |
| 2002 | DSHP, GFDI |
| 2003 | DSHP, GFDI |
| 2004 | DSHP, GFDI |
| 2005 | DSHP, GFDI |
| 2006 | DSHP, GHMI |
| 2007 | DSHP, GHMI |
| 2008 | DSHP, LGEM, GHMI, HWFI, GFNI |
| 2009 | DSHP, LGEM, GHMI, HWFI, GFNI |
| 2010 | DSHP, LGEM, GHMI, HWFI, GFNI |
| 2011 | DSHP, LGEM, GHMI, HWFI, GFNI |
| 2012 | DSHP, LGEM, GHMI, HWFI, GFNI |
| 2013 | DSHP, LGEM, GHMI, HWFI |
| 2014 | DSHP, LGEM, GHMI, HWFI |
| 2015 | DSHP, LGEM, GHMI, HWFI |
| 2016 | DSHP, LGEM, GHMI, HWFI, CTCI |
| 2017 | DSHP, LGEM, HWFI, CTCI |
| 2018 | DSHP, LGEM, HWFI, CTCI, HMNI |
| 2019 | DSHP, LGEM, HWFI, CTCI, HMNI |
| 2020 | DSHP, LGEM, HWFI, CTCI, HMNI |
Table 10.
Number of cases satisfying the HFIP RI performance measure sample requirements during the baseline period (2015–2017) and subsequent three years, showing the contributions to the sample from the Atlantic (AL) and eastern North Pacific (EP) basins.
Table 10.
Number of cases satisfying the HFIP RI performance measure sample requirements during the baseline period (2015–2017) and subsequent three years, showing the contributions to the sample from the Atlantic (AL) and eastern North Pacific (EP) basins.
| Verification Time (h) | 2015 Cases (AL/EP/Total) | 2016 Cases (AL/EP/Total) | 2017 Cases (AL/EP/Total) | 2015–2017 Cases (AL/EP/Total) | 2018–2020 Cases (AL/EP/Total) |
|---|---|---|---|---|---|
| 24 | 12/61/73 | 20/38/58 | 45/31/76 | 77/130/207 | 92/125/217 |
| 36 | 11/55/66 | 24/36/60 | 48/35/83 | 83/127/210 | 80/109/189 |
| 48 | 9/46/55 | 24/30/54 | 40/31/71 | 73/108/181 | 78/99/177 |
| 60 | 8/37/45 | 19/23/42 | 28/21/49 | 55/82/137 | 65/67/132 |
| 72 | 8/23/31 | 13/18/31 | 15/15/30 | 36/56/92 | 62/36/98 |
| 84 | 3/16/19 | 16/13/29 | 9/9/18 | 28/38/66 | 59/23/82 |
| 96 | 0/14/14 | 12/6/18 | 7/4/11 | 19/24/43 | 48/9/57 |
| 108 | 0/8/8 | 14/3/17 | 10/4/14 | 24/15/39 | 31/7/38 |
| 120 | 0/5/5 | 16/4/20 | 11/5/16 | 27/14/41 | 29/8/37 |
Publisher’s Note: MDPI stays neutral with regard to jurisdictional claims in published maps and institutional affiliations. |
© 2021 by the authors. Licensee MDPI, Basel, Switzerland. This article is an open access article distributed under the terms and conditions of the Creative Commons Attribution (CC BY) license (https://creativecommons.org/licenses/by/4.0/).
Share and Cite
MDPI and ACS Style
DeMaria, M.; Franklin, J.L.; Onderlinde, M.J.; Kaplan, J. Operational Forecasting of Tropical Cyclone Rapid Intensification at the National Hurricane Center. Atmosphere 2021, 12, 683. https://0-doi-org.brum.beds.ac.uk/10.3390/atmos12060683
AMA Style
DeMaria M, Franklin JL, Onderlinde MJ, Kaplan J. Operational Forecasting of Tropical Cyclone Rapid Intensification at the National Hurricane Center. Atmosphere. 2021; 12(6):683. https://0-doi-org.brum.beds.ac.uk/10.3390/atmos12060683
Chicago/Turabian StyleDeMaria, Mark, James L. Franklin, Matthew J. Onderlinde, and John Kaplan. 2021. "Operational Forecasting of Tropical Cyclone Rapid Intensification at the National Hurricane Center" Atmosphere 12, no. 6: 683. https://0-doi-org.brum.beds.ac.uk/10.3390/atmos12060683
Note that from the first issue of 2016, this journal uses article numbers instead of page numbers. See further details here.