
Possible Associations between the Number of Cold Days over East Asia and Arctic Oscillation and Arctic Warming


1
Aviation Meteorological Center, Air Traffic Management Bureau, Beijing 100122, China
2
China Meteorological Administration Training Center, WMO Regional Training Center, Beijing 100081, China
3
Meteorology Center of East China Regional Air Traffic Management Bureau of Civil Aviation of China, Shanghai 200335, China
*
Author to whom correspondence should be addressed.
Atmosphere 2021, 12(7), 842; https://0-doi-org.brum.beds.ac.uk/10.3390/atmos12070842
Submission received: 30 April 2021
/
Revised: 26 June 2021
/
Accepted: 28 June 2021
/
Published: 29 June 2021
(This article belongs to the Special Issue Asia-Pacific Region: Monsoons and Typhoons)
Abstract
:Based on the NECP/NCAR reanalysis dataset, the associations between the number of cold days (NCD) over East Asia (100–150° E, 25–55° N) and Arctic Oscillation (AO)/Arctic warming during 1956–2015 are explored. The results show the NCD was closely associated with AO during 1956–1990 and Arctic warming during 1991–2015. It reveals NCD over East Asia showed a downward trend and a significantly negative correlation with AO in the previous stage, while it presented an upward trend and notably positive association with Arctic warming in the later period. Meanwhile the increase in the earlier-stage AO will often be accompanied by the weakness of the Siberian high (SH), the Ural Mountains Blocking high (UBH), and the East Asian trough (EAT), and a “positive–negative–positive” wave band exist in the upper troposphere, which is linked with weakened northerly wind over East Asia. All these anomalies are unfavorable for the southward transportation of cold air, eventually leading to the decrease in NCD over East Asia. Additionally, when the near-surface temperature over the Arctic rises in the later period, on the one hand, SH reinforces and further results in more NCD over East Asia; on the other hand, the 1000–500 hPa thickness field displays a “north positive–south negative” pattern, which is conducive to the deceleration of the westerlies at mid-latitudes over Eurasia, and further bring about the enhancement of EAT and UBH, favoring the southward intrusion of cold air, finally, more NCD are generated.
1. Introduction
Cold surges are the most profound climate feature in boreal winter impacting East Asian countries, such as China, Japan, and Korea [1], and variability of winter temperature over East Asia and its causes have been investigated extensively [2,3,4,5,6]. East Asia exhibits a warming trend in winter; however, in recent decades, cold days have struck East Asia more frequently [7], which have profound influences on people’s livelihoods, transportation, energy supply, electricity transmission, economy, and agriculture production [8]. Additionally, East Asia is located in the “heart” of the East Asian winter monsoon (EAWM), between the Aleutian low and Siberian high (SH) and underneath the southern part of East Asian trough (EAT) with northerly winds, a region closely related to the main components of the EAWM circulation systems. Moreover, densely populated East Asia is home to a large number of modern industries. Therefore, understanding the causes for the variability of the number of cold days (NCD) over East Asia in winter is of great importance.
One of the main factors contributing to winter NCD anomalies over East Asia is the EAWM, interestingly, the Arctic Oscillation (AO), as the leading mode of extratropical climate variation in the north hemisphere during the boreal winter in which the sea level pressure anomalies over the Arctic have an opposite sigh to the anomalies at mid-latitudes [9,10], could influence NCD indirectly through its impact on the EAWM. Gong et al. [11] found a significant out-of-phase relationship between the AO and EAWM during the period 1951–1999, they suggested that AO affected the intensity of SH, consequently, the winter East Asian temperature changed. Jeong and Ho [12] stated that during winters with negative AO phases, cold surge frequency over East Asia was higher than that in normal AO years. Park et al. [13] pointed out that the cold surges that occurred in November–March over East Asia could be grouped into two types: wave train and blocking types, where the blocking type of cold surge tended to occur during negative AO periods, and the cold surges during negative AO were stronger than those during positive AO in terms of both intensity and duration.
The Arctic is one of the key regions for the exchange of substance and energy between the atmosphere and sea and plays an important role in the formation and change in the global climate system. Research on the Arctic and its impact has sparked a growing interest [7,8,14,15]. Global temperatures have continued to rise, and the Arctic has been the region with the largest temperature increase in the Northern Hemisphere since the 1970s; the increase in Arctic near-surface temperature was almost twice as large as that in the global average by the 21st century—a feature known as “Arctic amplification” [16]. In the last two decades, accompanied by global warming and Arctic Sea ice loss, the ecological environment over the Arctic has been changing rapidly, and the Arctic amplification effect has become more prominent [16], thus strengthening the connection between the Arctic and the mid–low-latitudes, and increasing intraseasonal and interannual variability of atmospheric circulations [17,18,19]; simultaneously, the instability of winter temperature over East Asia has increased and extreme cold events have become more frequent and intensive [7].
In the present study, we are purposed to explore the possible relationships between NCD over East Asia and AO and Arctic warming during different epochs. This paper is structured as follows. Section 2 describes the data, methods and the definition of NCD. The relevant circulation anomalies with NCD are analyzed in Section 3. Then, atmospheric circulation anomalies associated with AO/Arctic warming are further dissected in Section 4. Summary and discussion are offered in Section 5.
2. Data and Method
The primary data used in this study include (1) monthly sea level pressure (SLP), geopotential height at 500 hPa (Z500), and zonal wind at 300 hPa (U300) with a horizontal resolution of 2.5° × 2.5° [20]; 2-m air temperature (T2m) and daily minimum 2-m air temperature (Tmin_2m) at 192 × 94 T62 gaussian grids during the period 1956–2016 from the National Centers for Environmental Prediction/National Center for Atmospheric Research (NCEP/NCAR Reanalysis 1); (2) monthly AO indices from the Beijing Normal University (BNU) (http://ljp.gcess.cn/dct/page/65607, accessed on 10 June 2021), which was compared with AO indices from the National Oceanic and Atmospheric Administration Climate Prediction Center (NOAA-CPC, https://www.esrl.noaa.gov/psd/data/correlation/ao.data, accessed on 10 June 2021) [21], the results showed that they are highly correlated with each other. In this study, winter refers to December, January and February in the following year (DJF). In order to remove intraseasonal scale variations, parameters were averaged seasonally [22]. East Asia refers to 100–150° E, 25–55° N region in the present study.
The statistical methods applied in the study consist of correlation and regression analysis. The significance of the correlation and regression coefficients were determined by Student’s t-test.
Previous studies have developed some indices to quantify NCD. For example, the ‘Day-count’ index employs constant thresholds, which are unsuited for East Asia as it shows large spatial variations [23]; moreover, a given temperature threshold which is good for representing cold days at mid-latitudes may only indicate a mild winter day at higher-latitudes. However, indices based on the count of days crossing percentile thresholds can provide useful local information. For instance, Gong et al. [24] counted the number of days when daily temperature anomaly is negative, and the absolute value is less than twice the temperature standard deviation of the winter day as NCD index. Jiao et al. [25] defined the index of cold days as the number of days with daily maximum temperature below 10th percentile of daily maximum temperature, while the index of cold nights indicated the number of days with daily minimum temperature below 10th percentile of daily minimum temperature, and the indices are conducive to study its association with Arctic Sea ice reduction. Some other NCD indices were defined by the daily difference between mean temperature and a base temperature [26].
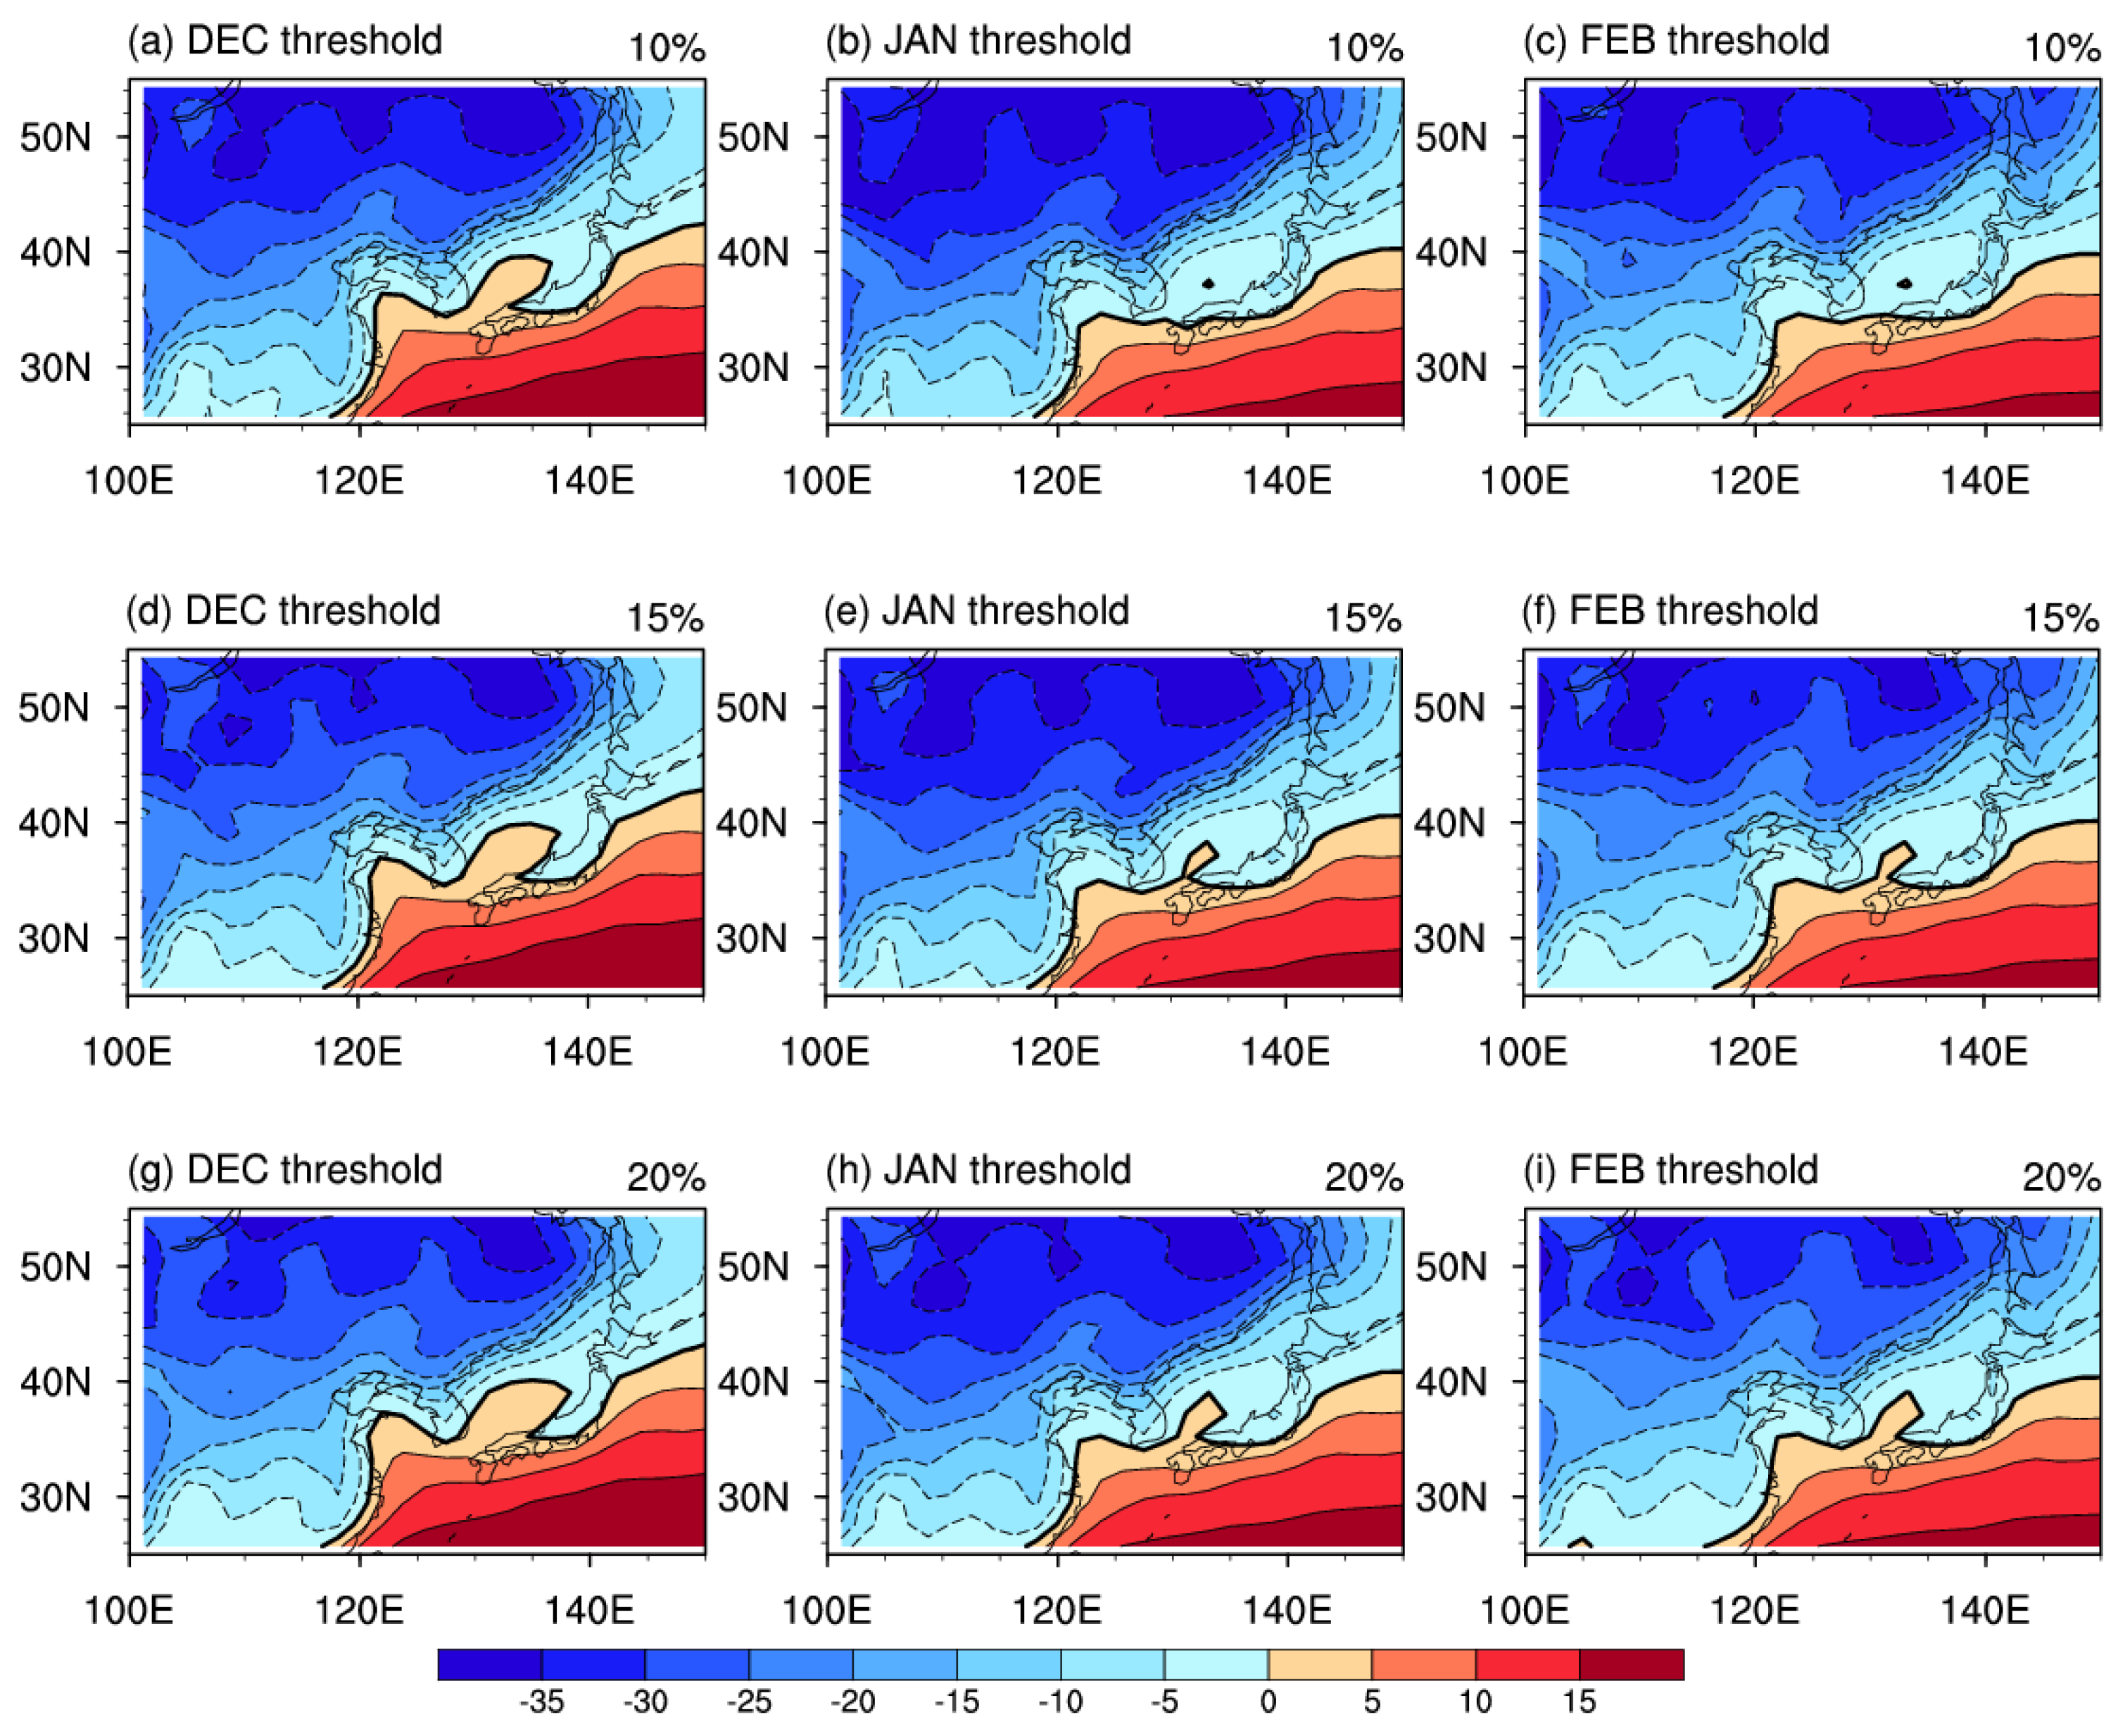
In the present study, the threshold utilized to define NCD was the 10th percentile of daily Tmin_2m at each grid instead of a fixed threshold. First, the Tmin_2m from low to high in each day during the winter of 1956–2015 at each grid over East Asia were ranked, then the 10th percentile value was taken as the threshold. When Tmin_2m was below the threshold, it was counted as a cold day. We also used the 15th and 20th percentile to conduct statistical analysis. Figure 1 shows the threshold values for winter, the threshold values did not manifest big changes from December to February: the area-average 10th percentile thresholds over the entire East Asia were −12.8 °C for December, −15.4 °C for January, and −14.3 °C for February. The 15th percentile results were −11.7 °C, −14.3 °C, and −13.0 °C, respectively, meanwhile, −10.9 °C, −13.4 °C, and −12.1 °C for the 20th percentile. Spatially, the thresholds generally increased from northwest to southeast over East Asia. The 0 °C line mainly extended northeastwardly from the eastern costal China, through the Sea of Japan, to the east of Japan.
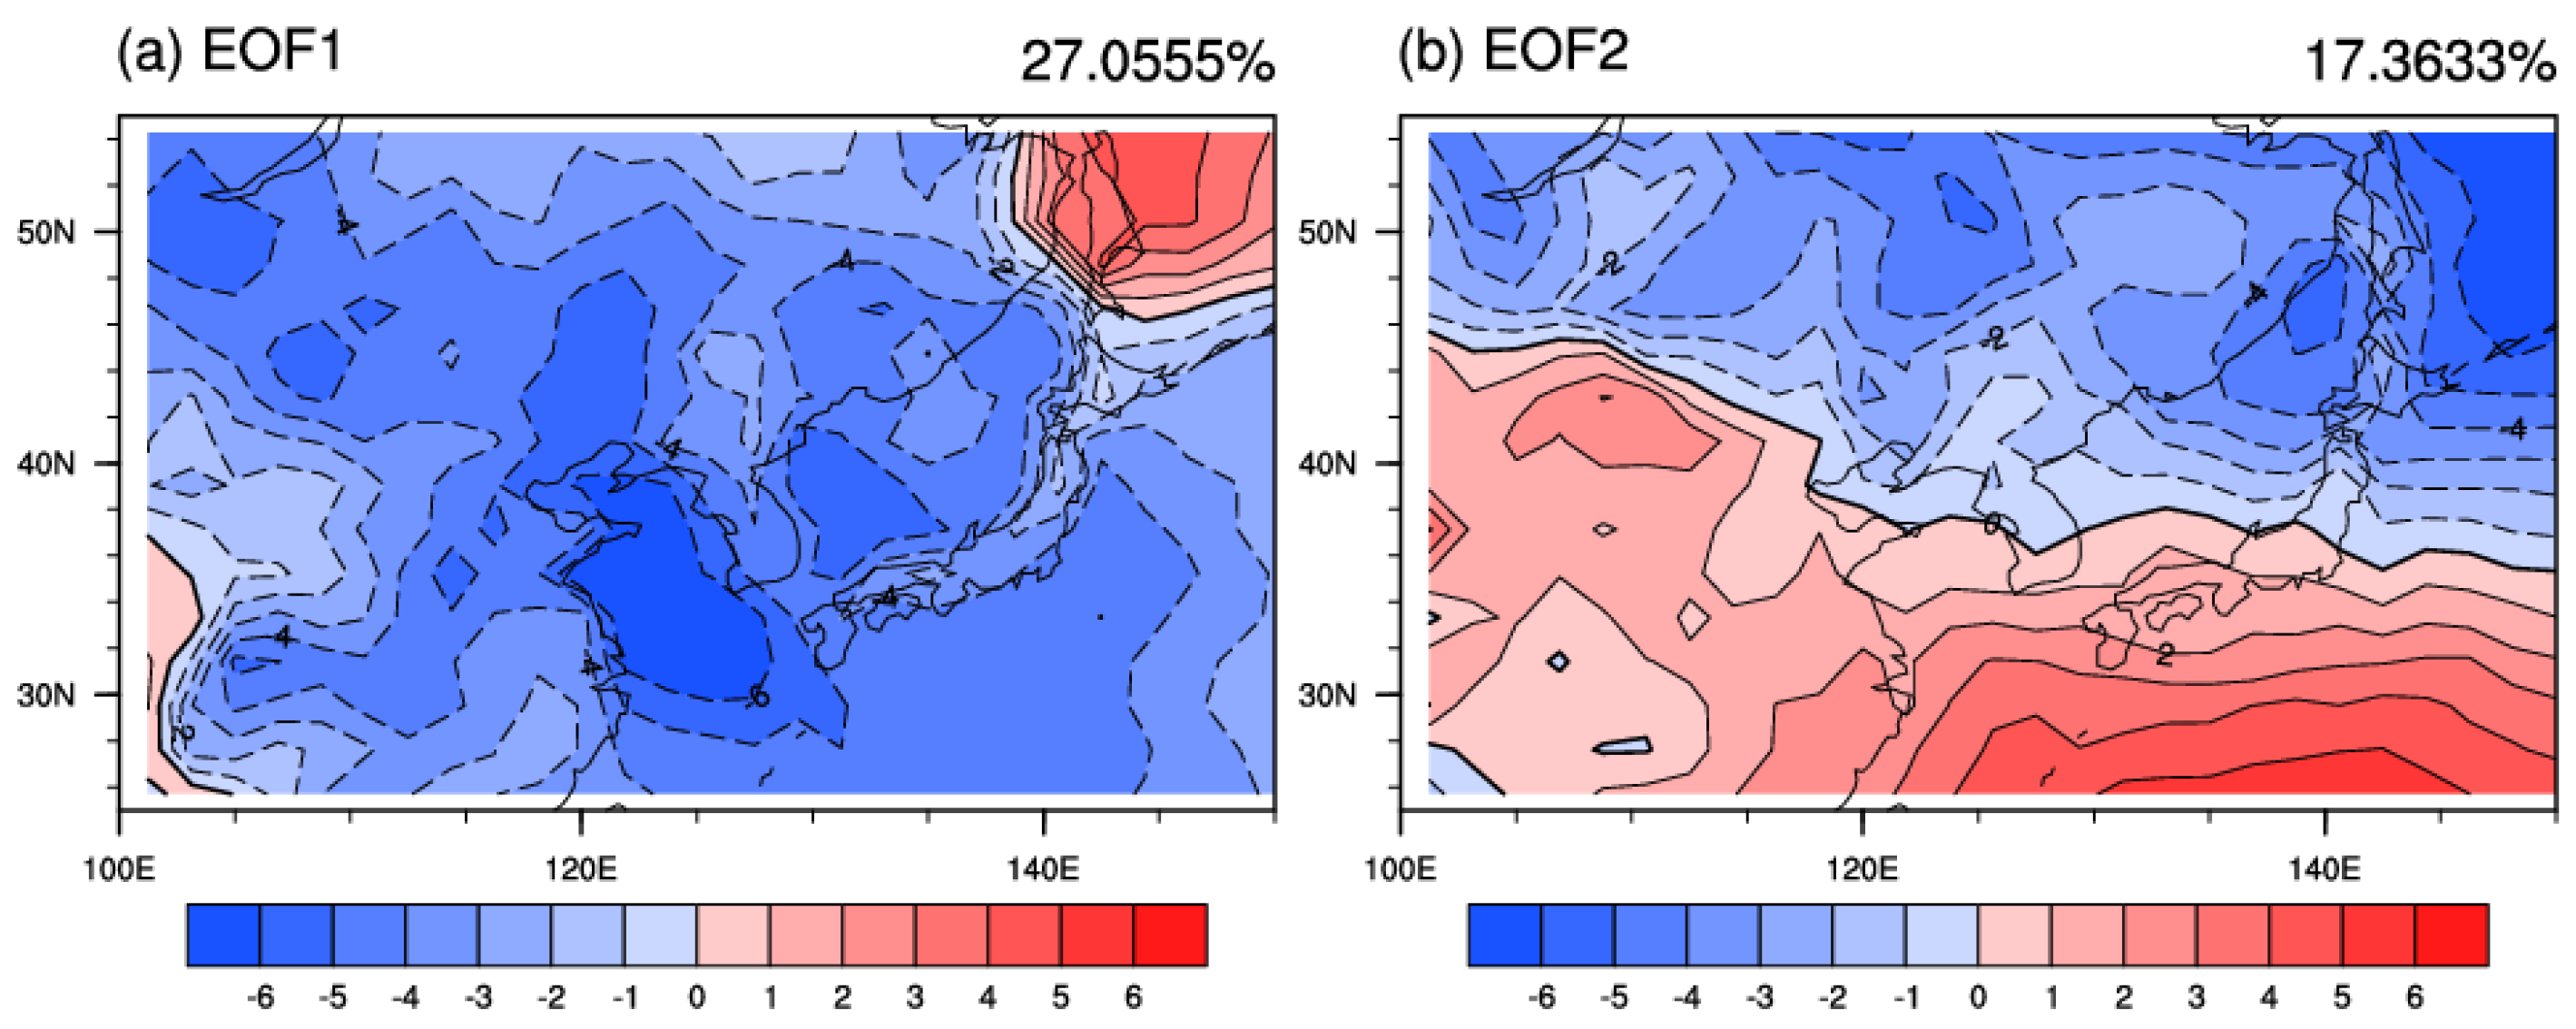
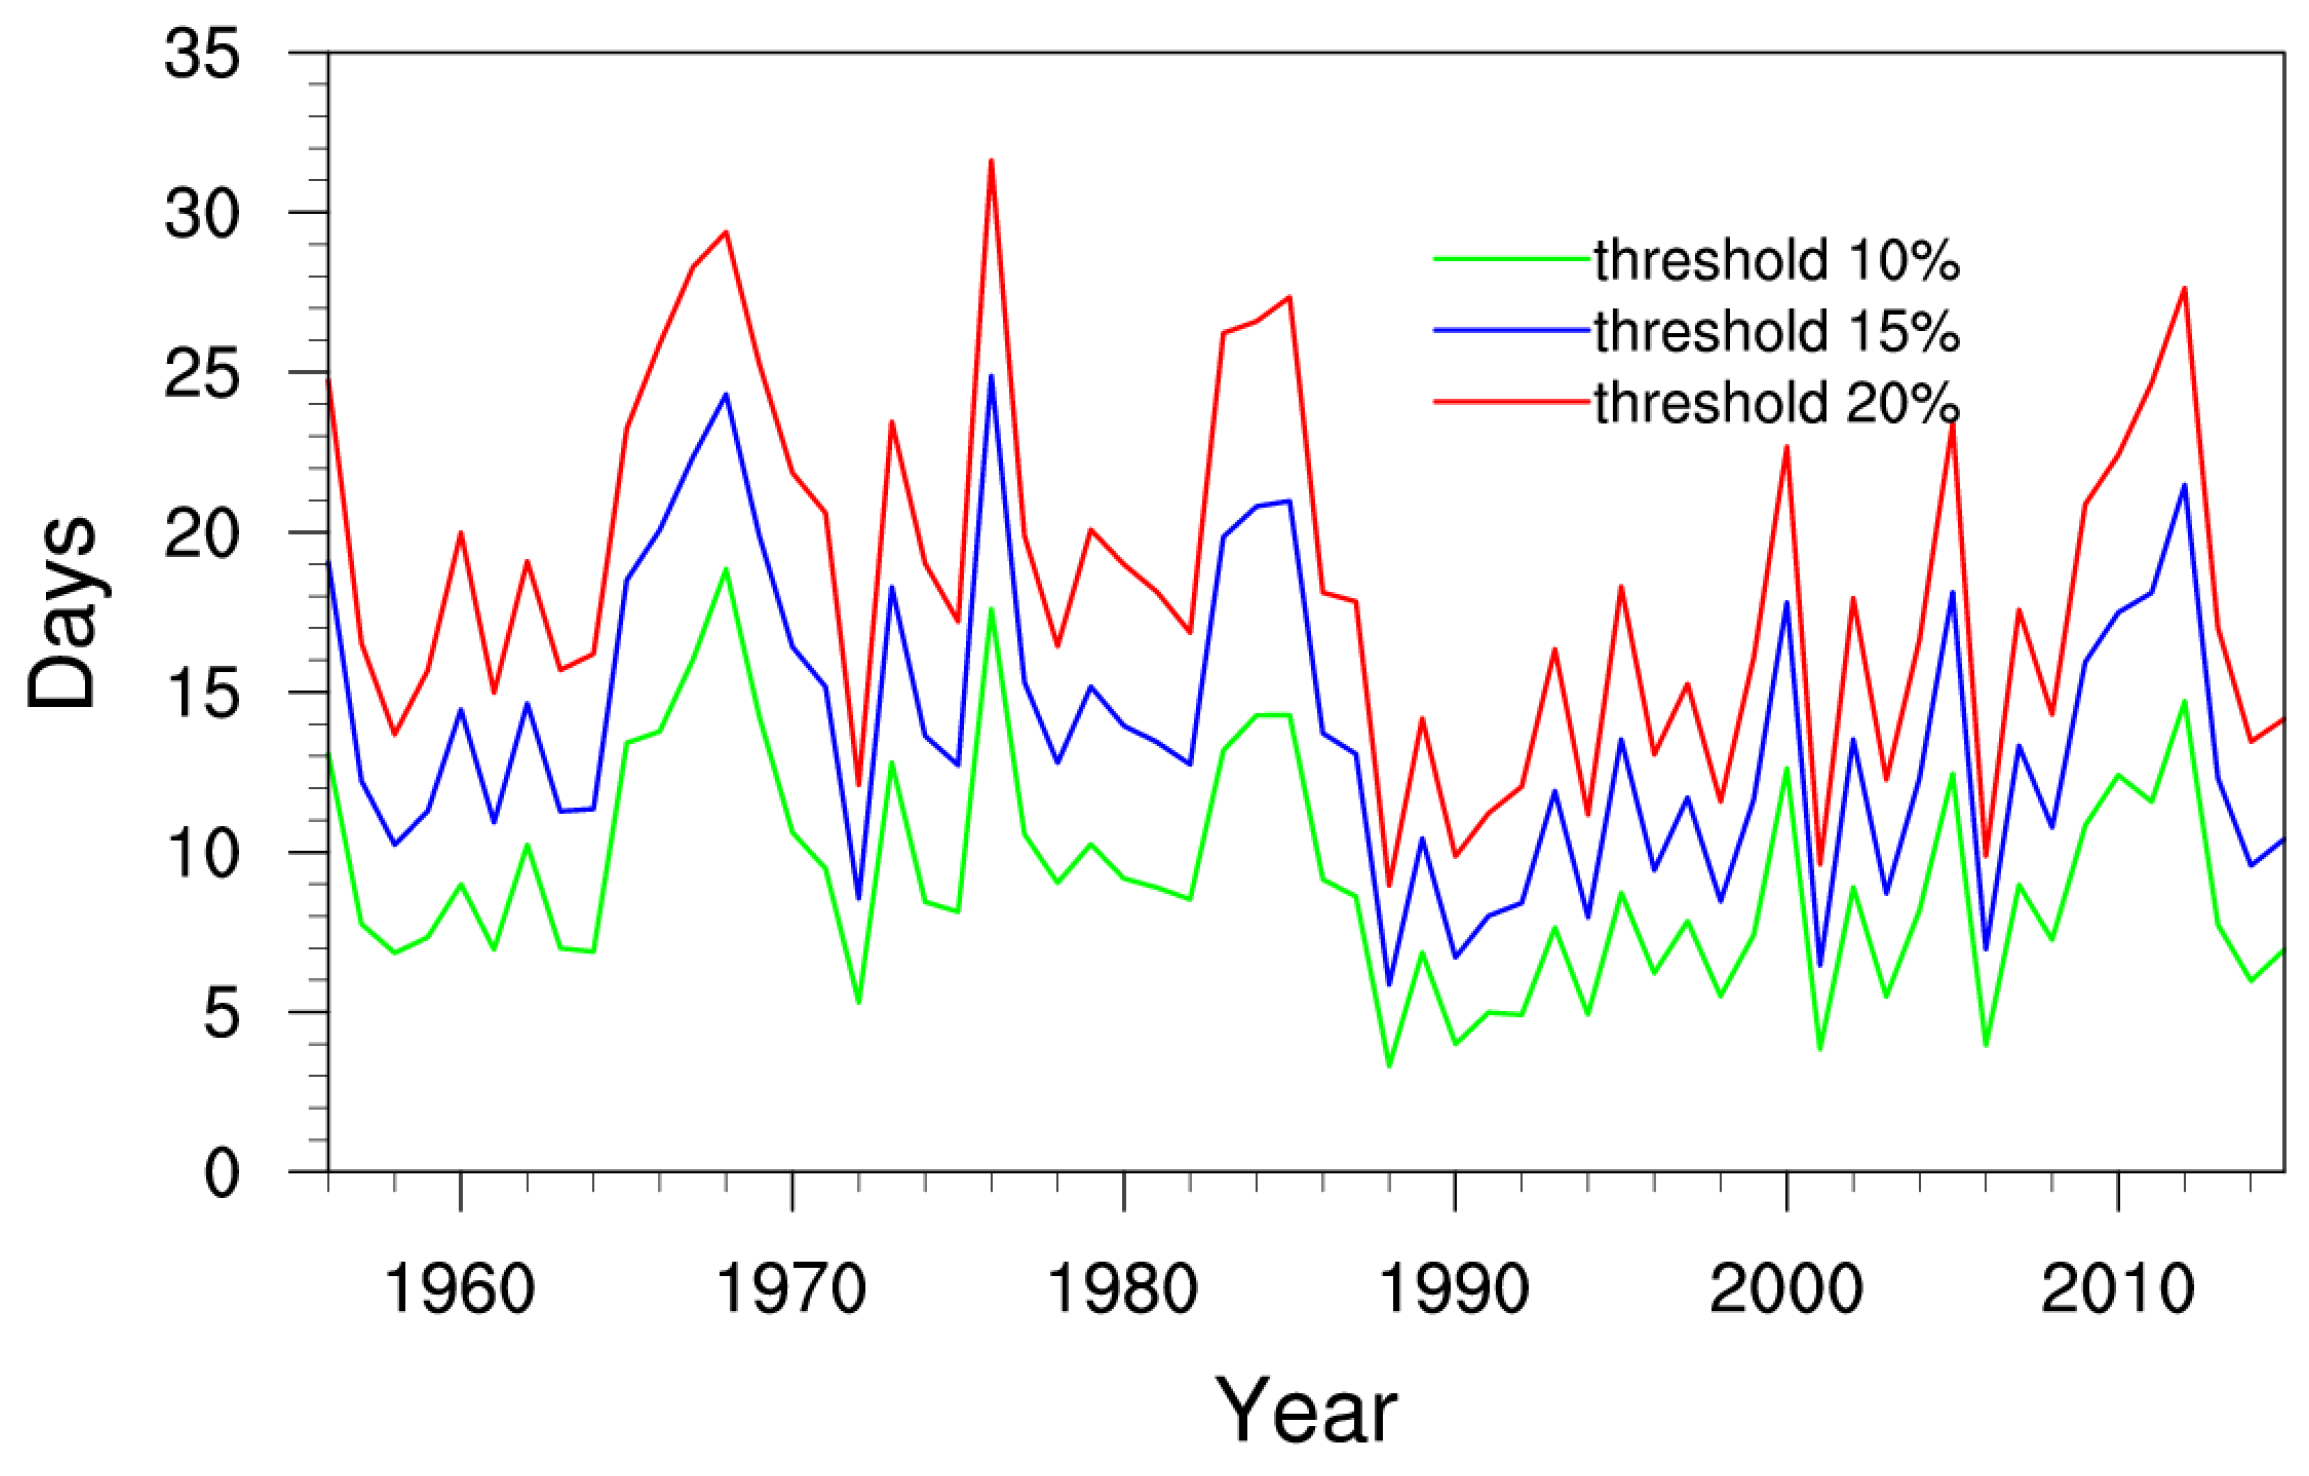
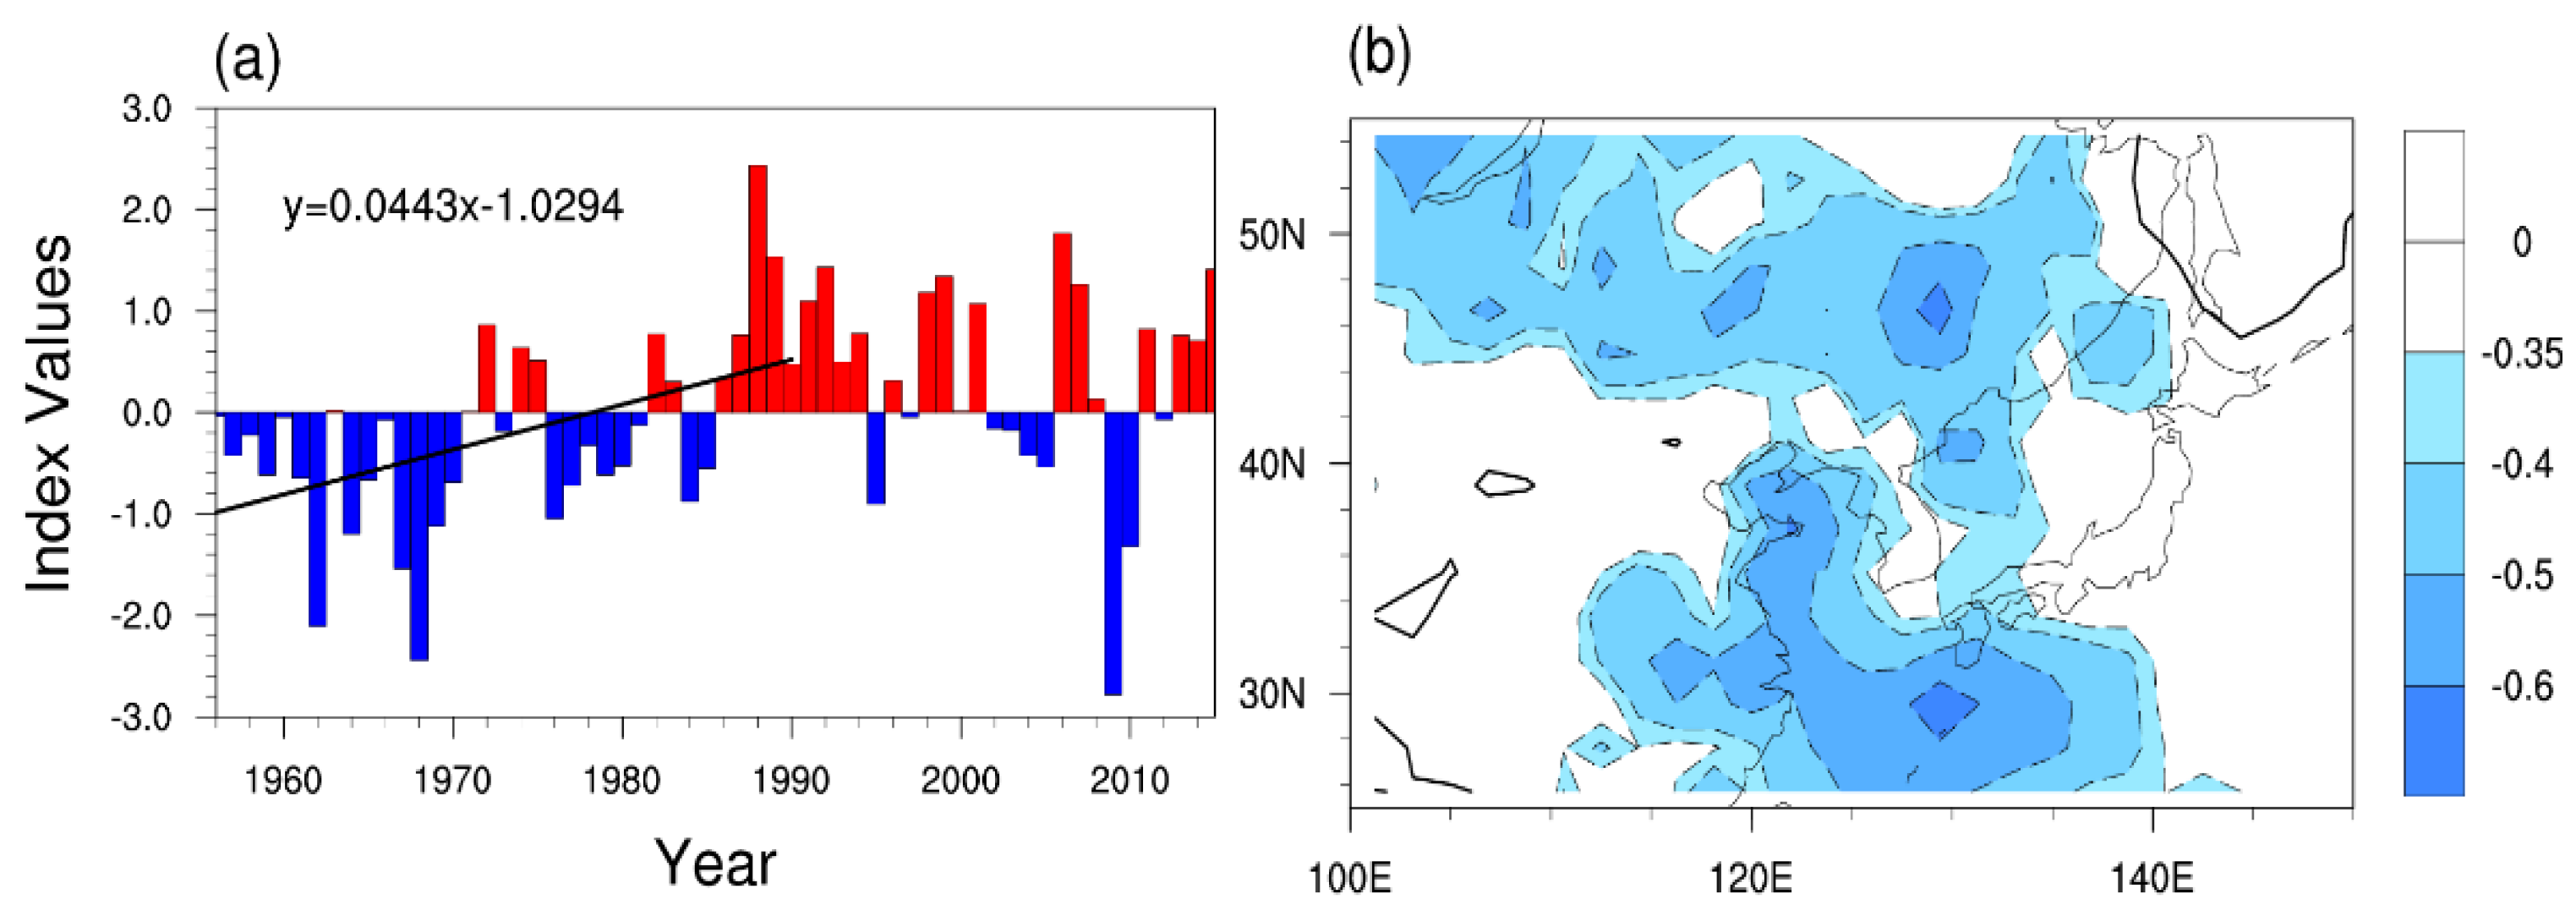
We also performed EOF analysis for NCD based on the three percentiles, the first leading mode depicted a generally homogeneous pattern over East Asia, and they severally explained 27.06%, 19.80%, and 31.84% of the total NCD variance. The first principal component was highly associated with NCD index. Meanwhile, the second leading mode showed a pattern of opposite change between the northern and southern part of East Asia, accounting for 17.36%, 17.62%, and 17.75%, respectively (Figure 2, 15% and 20% threshold not shown). The first two leading modes were distinguished from each other according to the rule put forward by North et al. [27]. However, as it is intended to analyze the NCD over the entire East Asia, we did not have to cope with the accumulated NCD at each grid. Instead, the area-average NCD index over East Asia was defined. Figure 3 shows the time series of NCD index based on 10th, 15th, and 20th percentile during 1956–2015. They were highly correlated with each other. The trend was −0.47 day·decade−1, −0.62 day·decade−1, and −0.75 day·decade−1 during 1956–2015. Thus, the statistics results of NCD in winter over East Asia are robust and not sensitive to the selection of different threshold. Therefore, NCD index based on the 10th percentile can be used to describe the climate changes in winter over East Asia, and the rest of the sections are on this basis. There was a downward trend (−0.386 day·decade−1) before 1990 and an upward trend (1.645 day·decade−1) after 1990 (Figure 4a). Stronger cold anomalies have struck East Asia more frequently in recent decades [7,28], and it is consistent with the upward trend of NCD after 1990. How the NCD index represents local information at each grid is demonstrated in Figure 4b, the index commendably represents the number of cold days over the most of grids except in the northeast corner of East Asia. Therefore, NCD index is meaningful for the majority of the grid points over East Asia.
3. Atmospheric Circulation Anomalies Associated with NCD
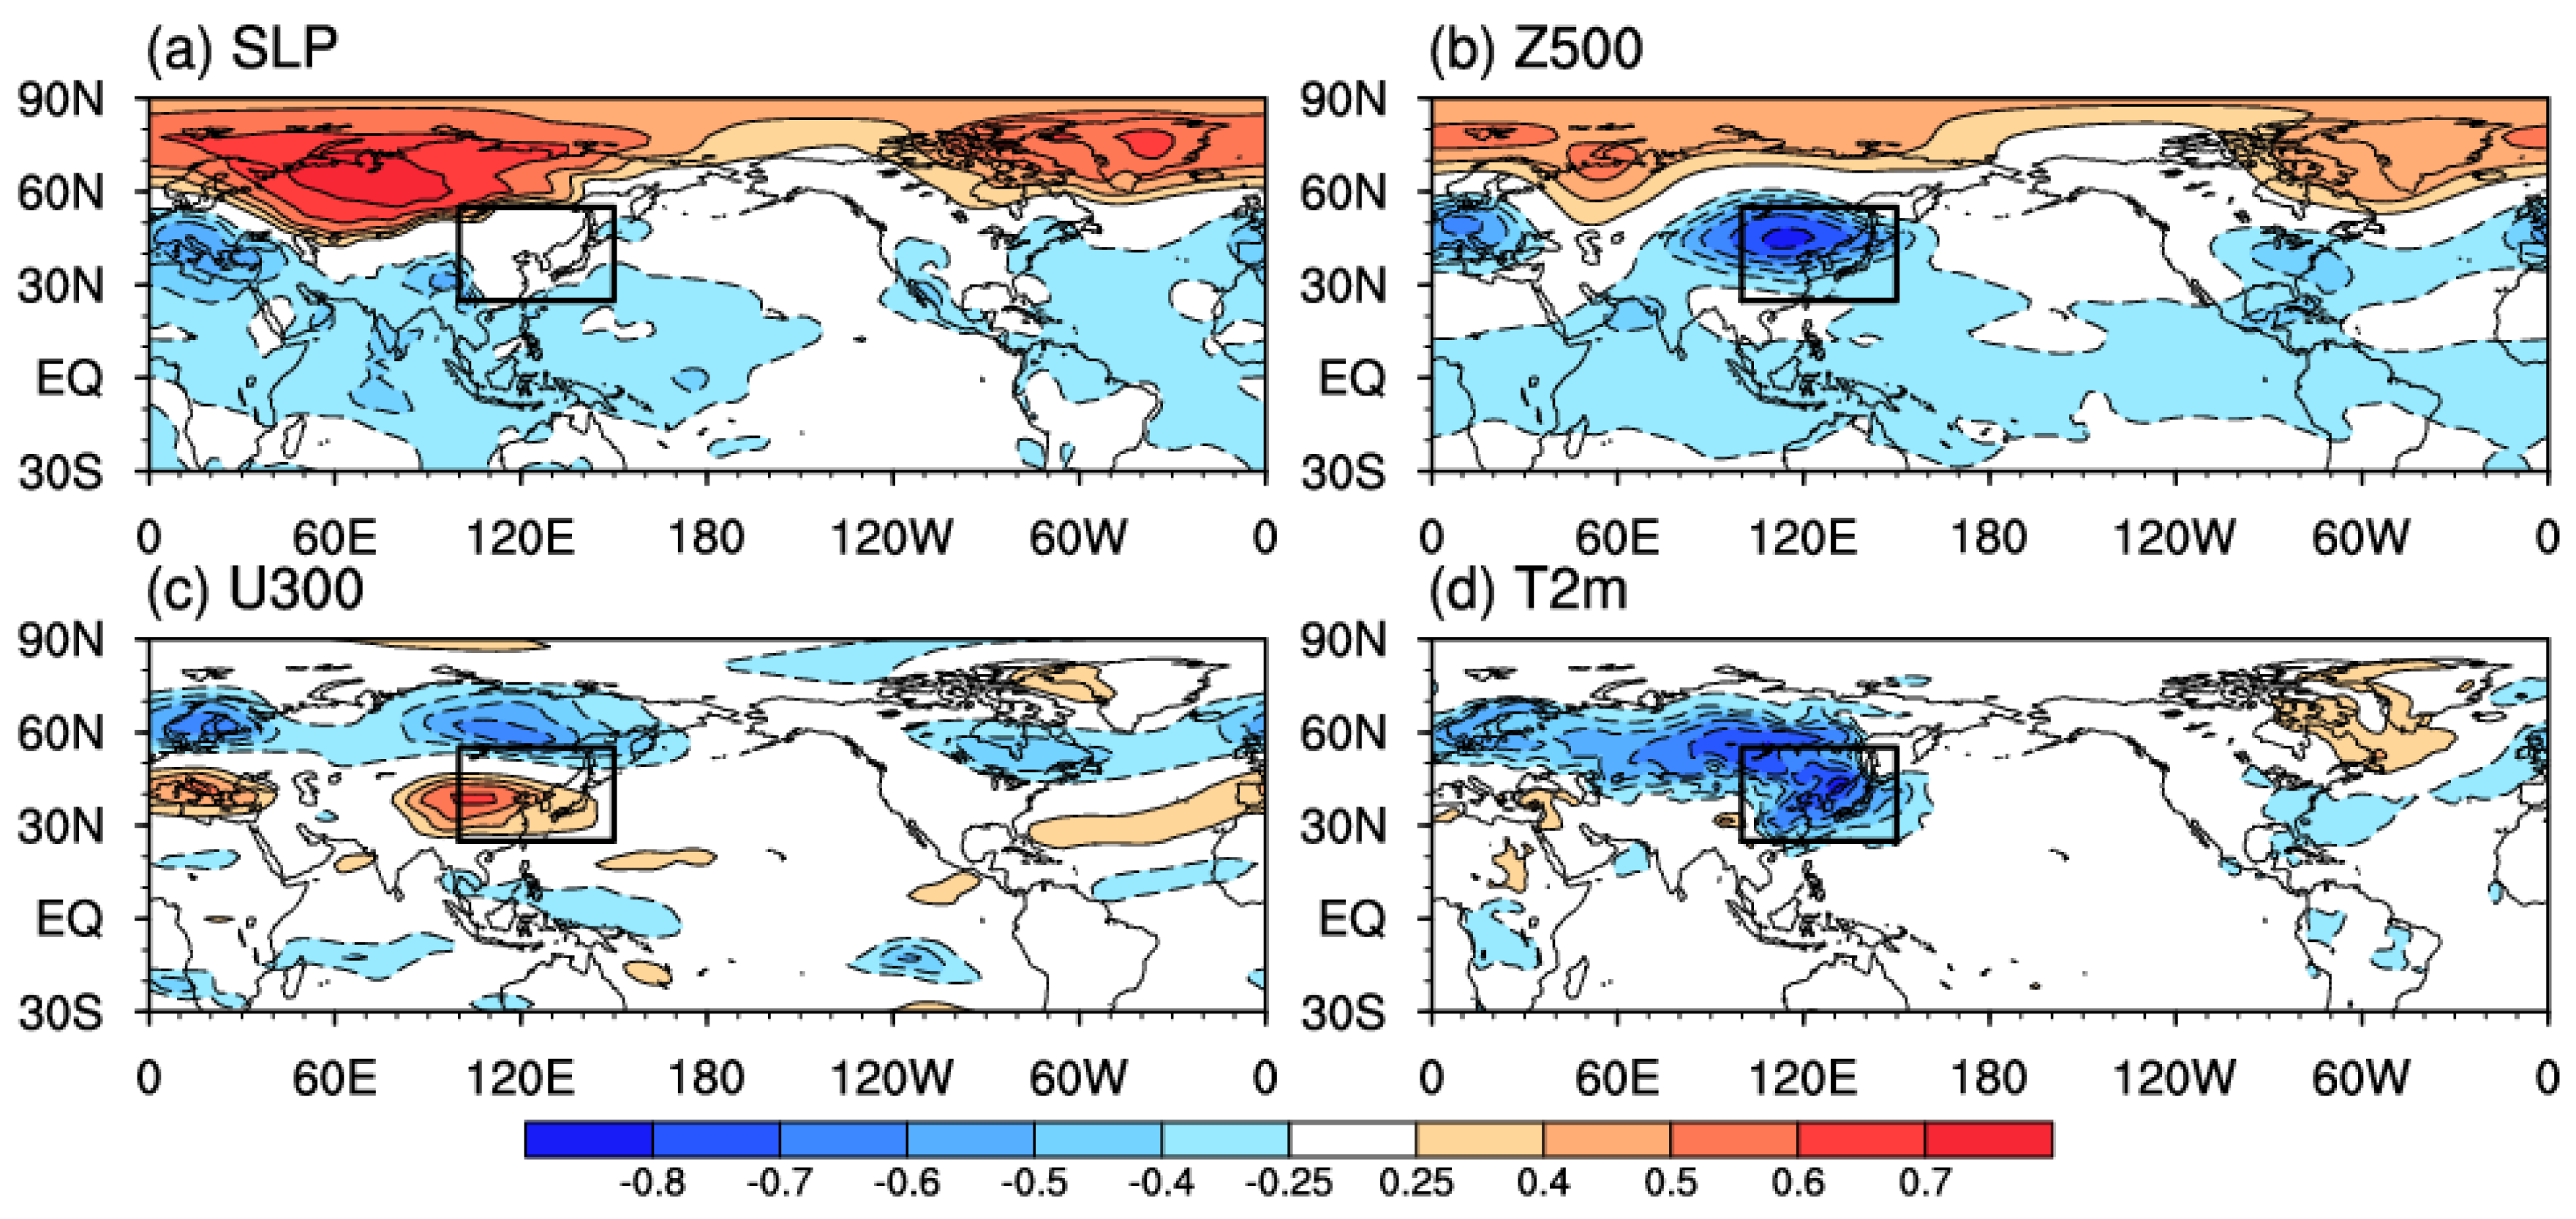
To further figure out what the circulation anomalies are when more NCD occur over East Asia, correlative patterns of SLP, Z500, U300, and T2m with NCD index are first demonstrated in Figure 5. The more NCD appeared over East Asia, and the more prominently positive SLP anomalies prevailed in the northern Ural Mountains (Figure 5a). It indicated a northwestward shift and enhancement of the SH, at the same time, a dominant large-scale seesaw existence between mid-latitudes and the Arctic, which is similar to the negative phase of AO. Correspondingly, the above circulation anomalies are favorable for the occurrence of northerly wind over the northern part of the Eurasian continent, making the transport of cold air from high-latitudes to East Asia easier. The negative Z500 anomalies lay over northeast China and eastern Mongolia (Figure 5b), suggesting the strengthening of the EAT when there were more NCD over East Asia; positive Z500 anomalies over Ural Mountains indicated the enhancement of the UBH when NCD increased. The distribution of Z500 anomalies implies a pronounced wave train which provides an upper-level dynamical condition favorable for the intrusion of cold air into East Asia [29,30,31]. Associated with the rise in the NCD index, U300 accelerated at about 30° N and decelerated at mid–high-latitudes over Eurasia (Figure 5c). Previous studies have proven that the deceleration of the mid-latitudes westerlies over Eurasia is beneficial to the energy exchange between the Arctic and lower-latitudes [14,32], including the delivery of cold air to East Asia. It is noteworthy that these circulation anomalies are similar to the ‘Northern mode’ of the EAWM [3], and NCD are remarkably associated with EAWM [33,34,35,36]. In response to the variations of the above circulation systems, cold winter appeared among most of Eurasian continent (Figure 5d).
Some studies pointed out that the East Asian temperature at the interannual timescale is significantly related to the T2m over the Arctic [37,38]. As shown in Figure 5d, NCD was closely associated with T2m over East Asia, so NCD may also be linked with T2m over the Arctic, but no obvious T2m anomalies existed over the Arctic with respect to the rise in NCD (Figure 6a). However, it does not indicate there is no relationship between them. Average wintertime temperatures have decreased over Eurasia since the late 1980s, a sustained cooling that bucks the global warming trend. Moreover, Arctic T2m has dramatically increased since 1990 (Figure not shown); simultaneously, NCD has greatly risen since 1990 (Figure 4a). For 1956–1990, NCD was positively correlated with T2m over the Arctic, but not significantly (Figure 6b). Notable changes were detected for 1991–2015 (Figure 6c), i.e., significantly positive correlations emerged over the Arctic, especially to the north of the Barents–Kara Sea (0–80° E, 73–84° N). Therefore, there existed a close relationship between NCD and T2m over the Arctic for the period 1991–2015, i.e., the increased NCD after 1990 was closely linked with Arctic warming.
As mentioned above, NCD was linked with AO pattern during 1956–2015 (Figure 5a). Moreover, there was an upward trend for AO index before 1991 (Figure 7a), and the correlation coefficient between AO and NCD reached −0.64 during 1956–1990, indicating that about 41% of the total variance of NCD could be explained by AO, while that between detrended NCD and AO was −0.67, both exceeding 99% confidence level based on Student’s t-test. Additionally, the correlation coefficient between AO and NCD over East Asia is demonstrated in Figure 7b, and a significantly negative correlation prevailed over the majority of East Asia. This implies NCD was associated with AO during 1956–1990 and the decreased NCD can be explained by the ascendant AO. However, during 1991–2015, the correlation coefficient between AO and NCD decreased. Thus, the following will explore the associations between Arctic warming (1991–2015)/AO (1956–1990) and NCD in different epochs, respectively. In order to analyze influence pathways and mechanisms of Arctic warming/AO on NCD, atmospheric circulation anomalies caused by Arctic warming/AO should be discussed first.
4. Atmospheric Circulation Anomalies Associated with AO/Arctic Warming
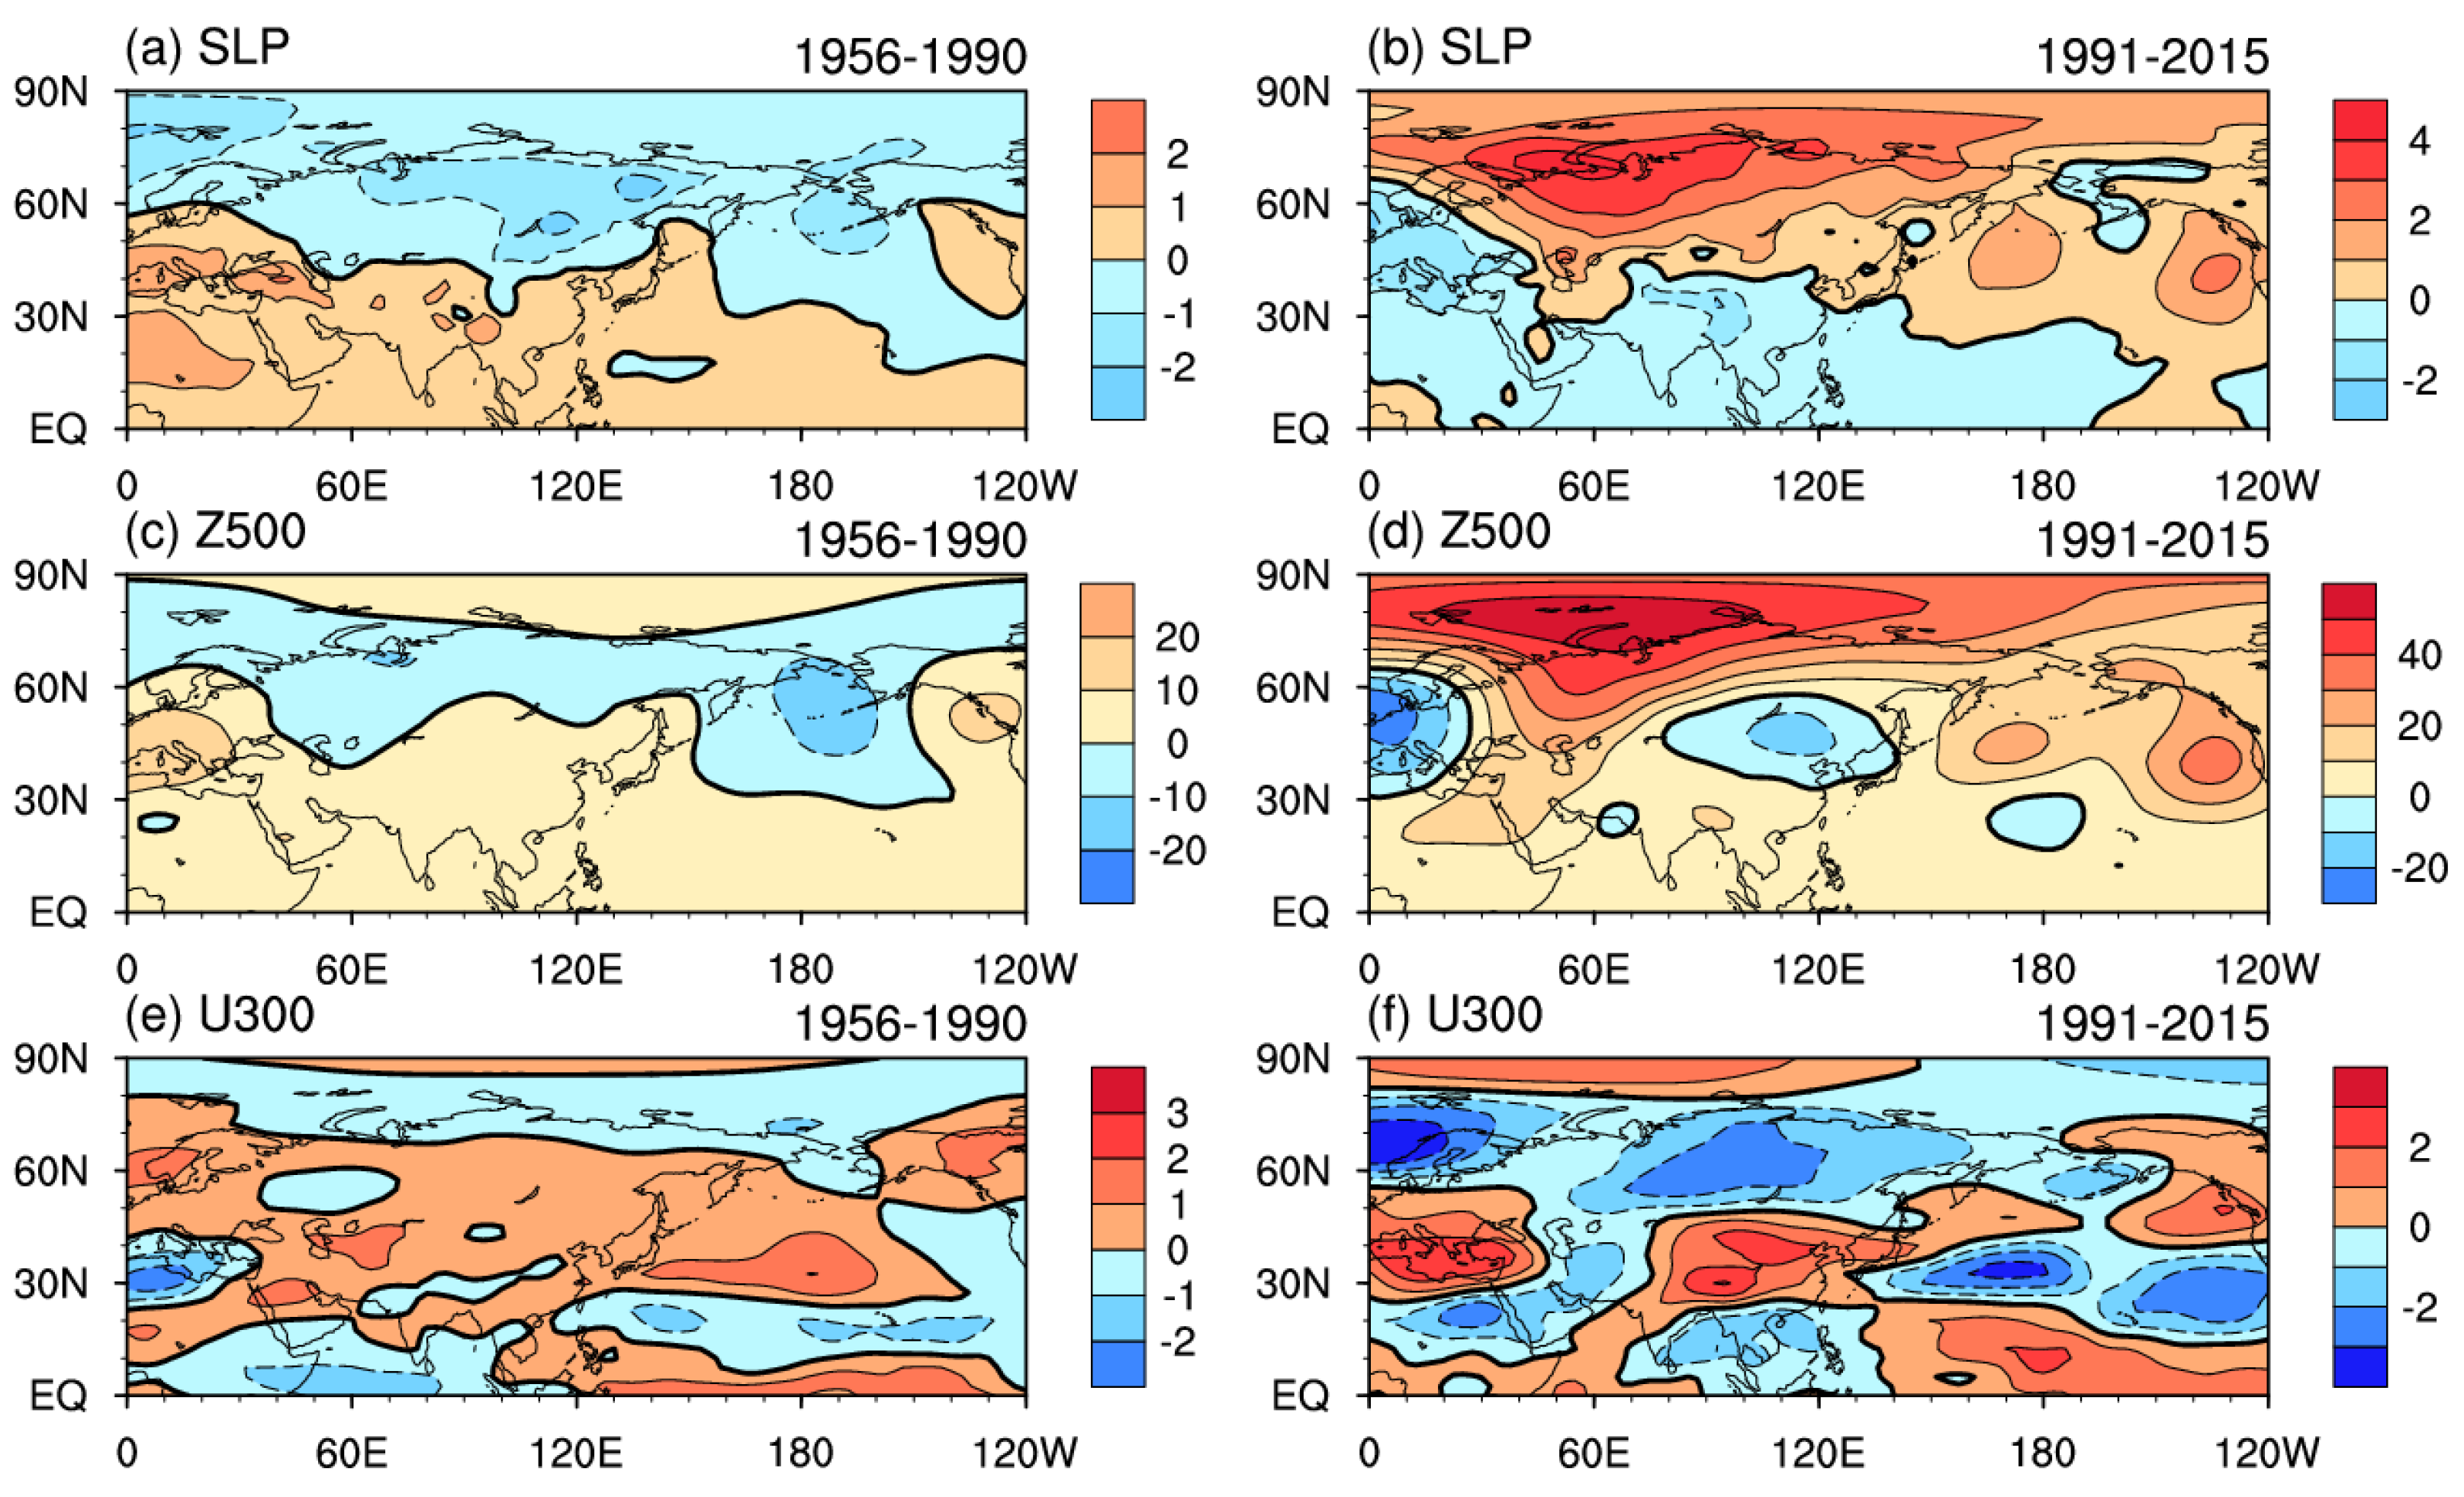
Figure 8 compares the trend of circulations in the two epochs. In the lower troposphere, over Eurasia, SLP exhibited a downtrend during 1956–1990 (Figure 8a) and an uptrend during 1991–2015 (Figure 8b), implying the enhancement and weakening of SH in the two epochs. In the middle troposphere, during 1956–1990, there were declines for Z500 at middle–high-latitudes over Eurasia, indicating the weakening of Eurasia Blockings, simultaneously, increasing trends emerged over East Asia, suggesting the weakening of EAT (Figure 8c); during 1991–2015, the spatial patterns of Z500 trend signified the reinforcement of UBH and EAT (Figure 8d). In the upper troposphere, middle–high-latitudes westerlies over Eurasia increased during 1956–1990 (Figure 8e), and the situation was the opposite during 1991–2015 (Figure 8f). The trend of different systems revealed why there was a decline for NCD during the former epoch and a rise during the latter epoch.
Previously, we found NCD was linked with AO/Arctic warming during 1956–1990/1991–2015. To better understand how AO/Arctic warming influenced NCD over East Asia during 1956–1990/1991–2015, maps of regressed circulation anomalies, which are related to EAWM, against AO/Arctic warming are provided.
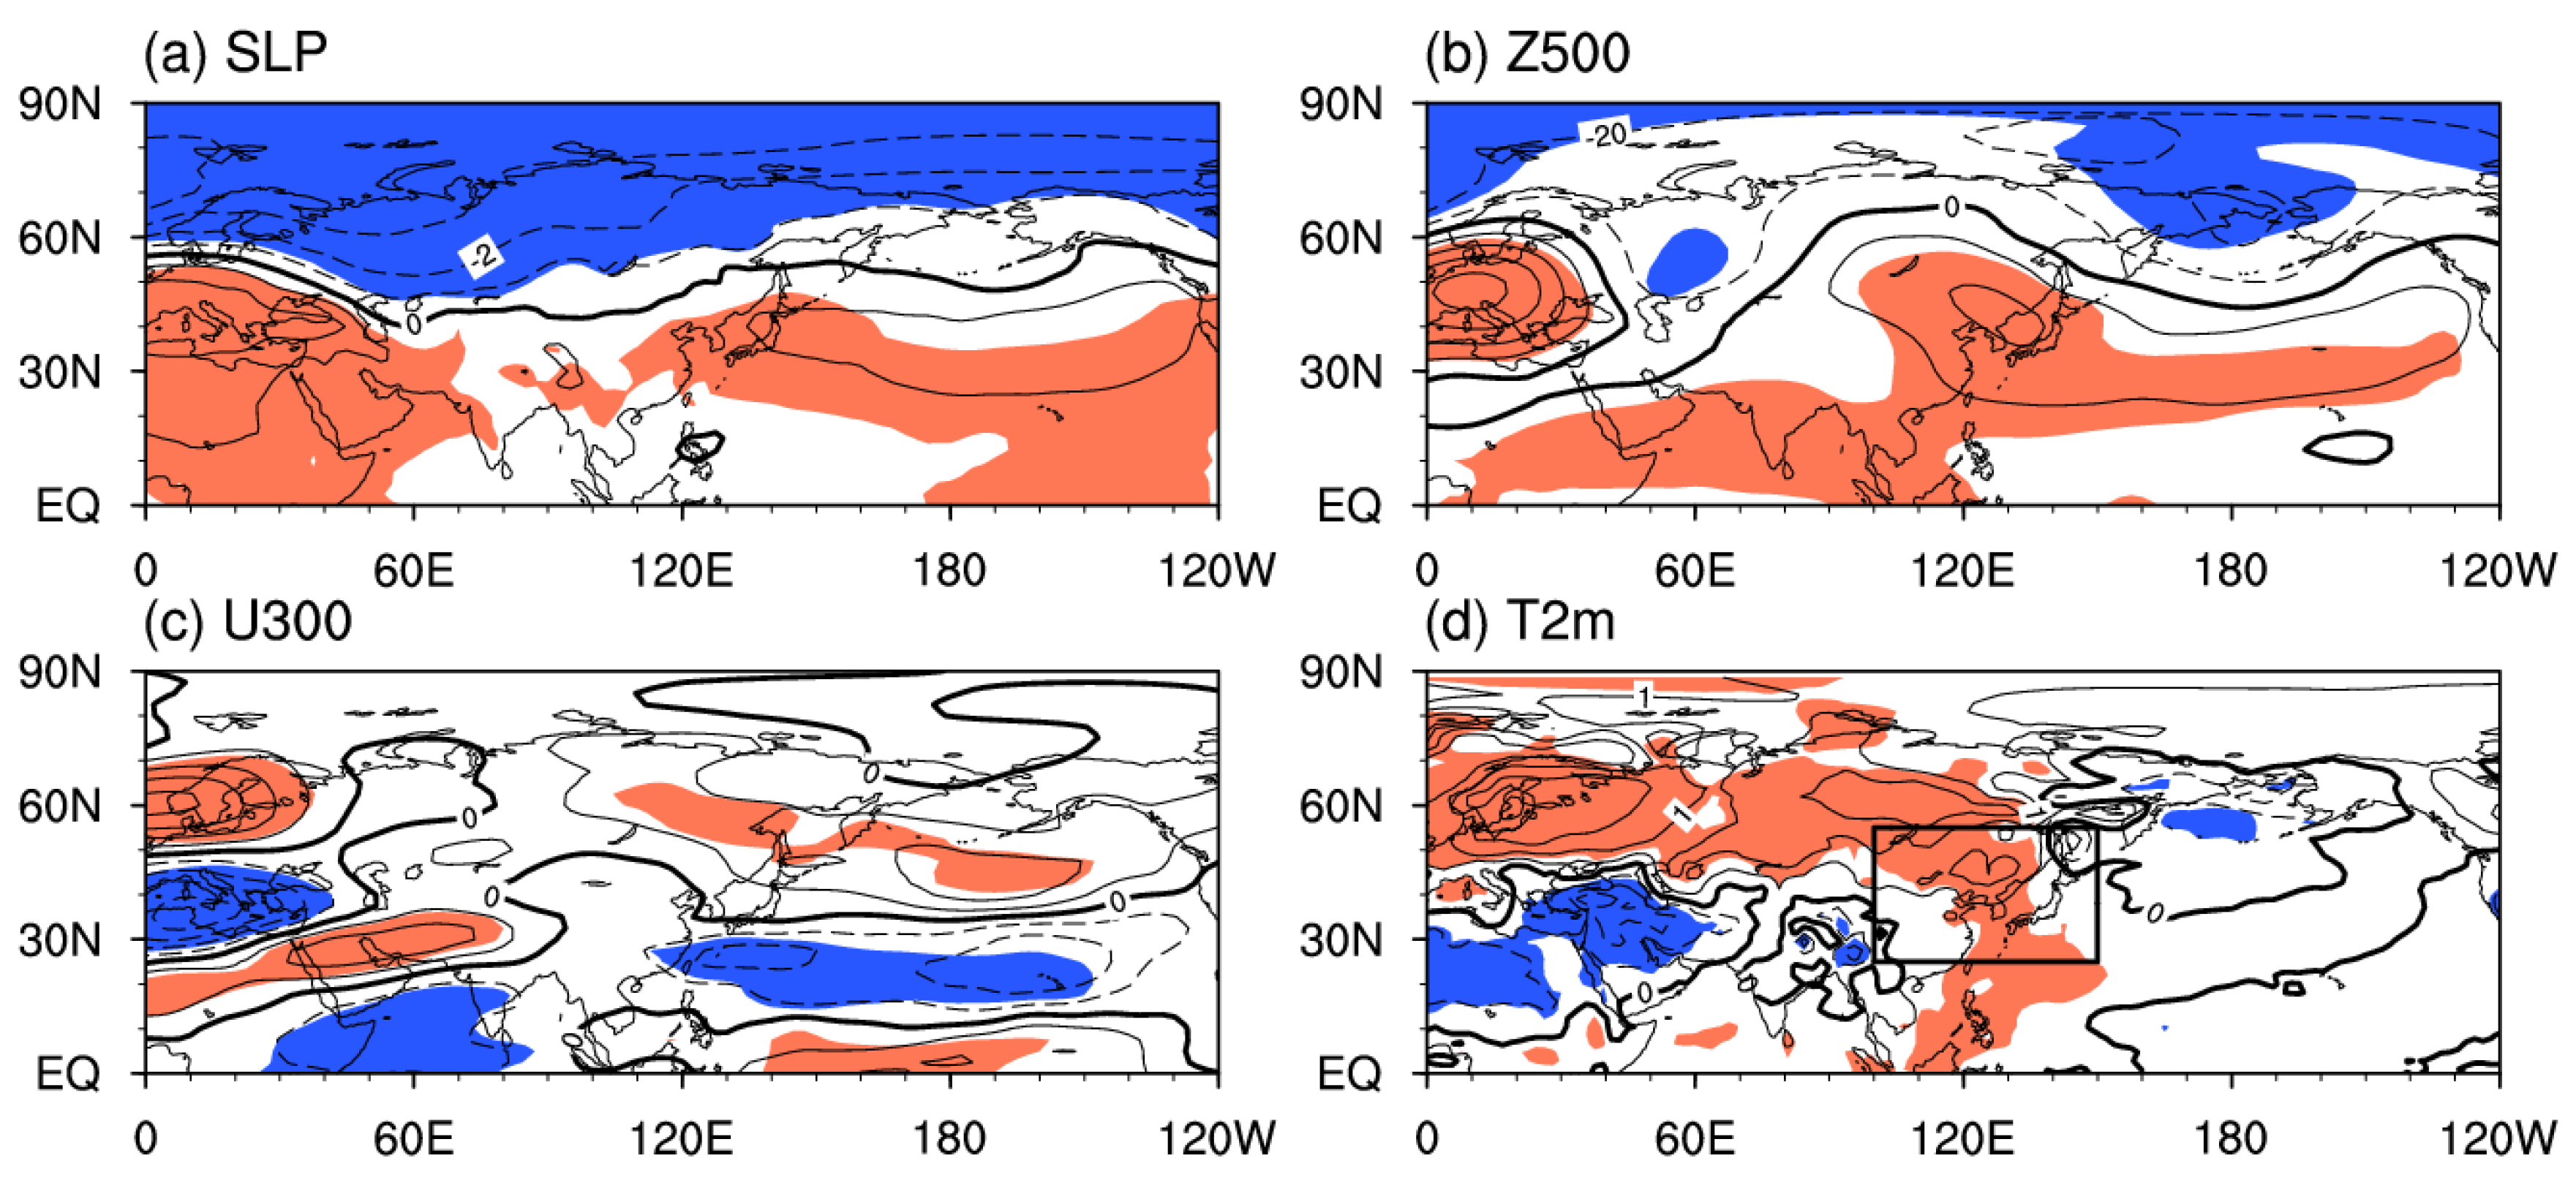
Figure 9 illustrates regressed SLP, Z500, U300, and T2m against AO during 1956–1990. In the lower troposphere, in response to the increasing AO index, significantly negative SLP anomalies formed over the Arctic and at middle–high-latitudes over Eurasia (Figure 9a), indicating the weakening of SH. In the middle troposphere, when AO index rose, negative Z500 anomalies existed over the Ural Mountains, and positive Z500 anomalies emerged over East Asia (Figure 9b), suggesting the weakening of UBH and EAT which is unfavorable for the southward transportation of cold air from high-latitudes. In the upper troposphere, significant ‘positive–negative–positive’ U300 anomalies existed over the Pacific Ocean. This three-band structure was closely connected to the weakening of low-level meridional northerly wind over East Asia; in addition, positive U300 anomalies existed at mid–high-latitudes over Eurasia (Figure 9c), which is not conducive to the cold air outbreaks [32]. Additionally, when AO index increased, positive T2m anomalies were located over Eurasia (Figure 9d), implying the decrease in NCD over East Asia. In this sense, during 1956–1990, AO exerted considerable influences on NCD over East Asia through its direct control of the EAWM-related circulations.
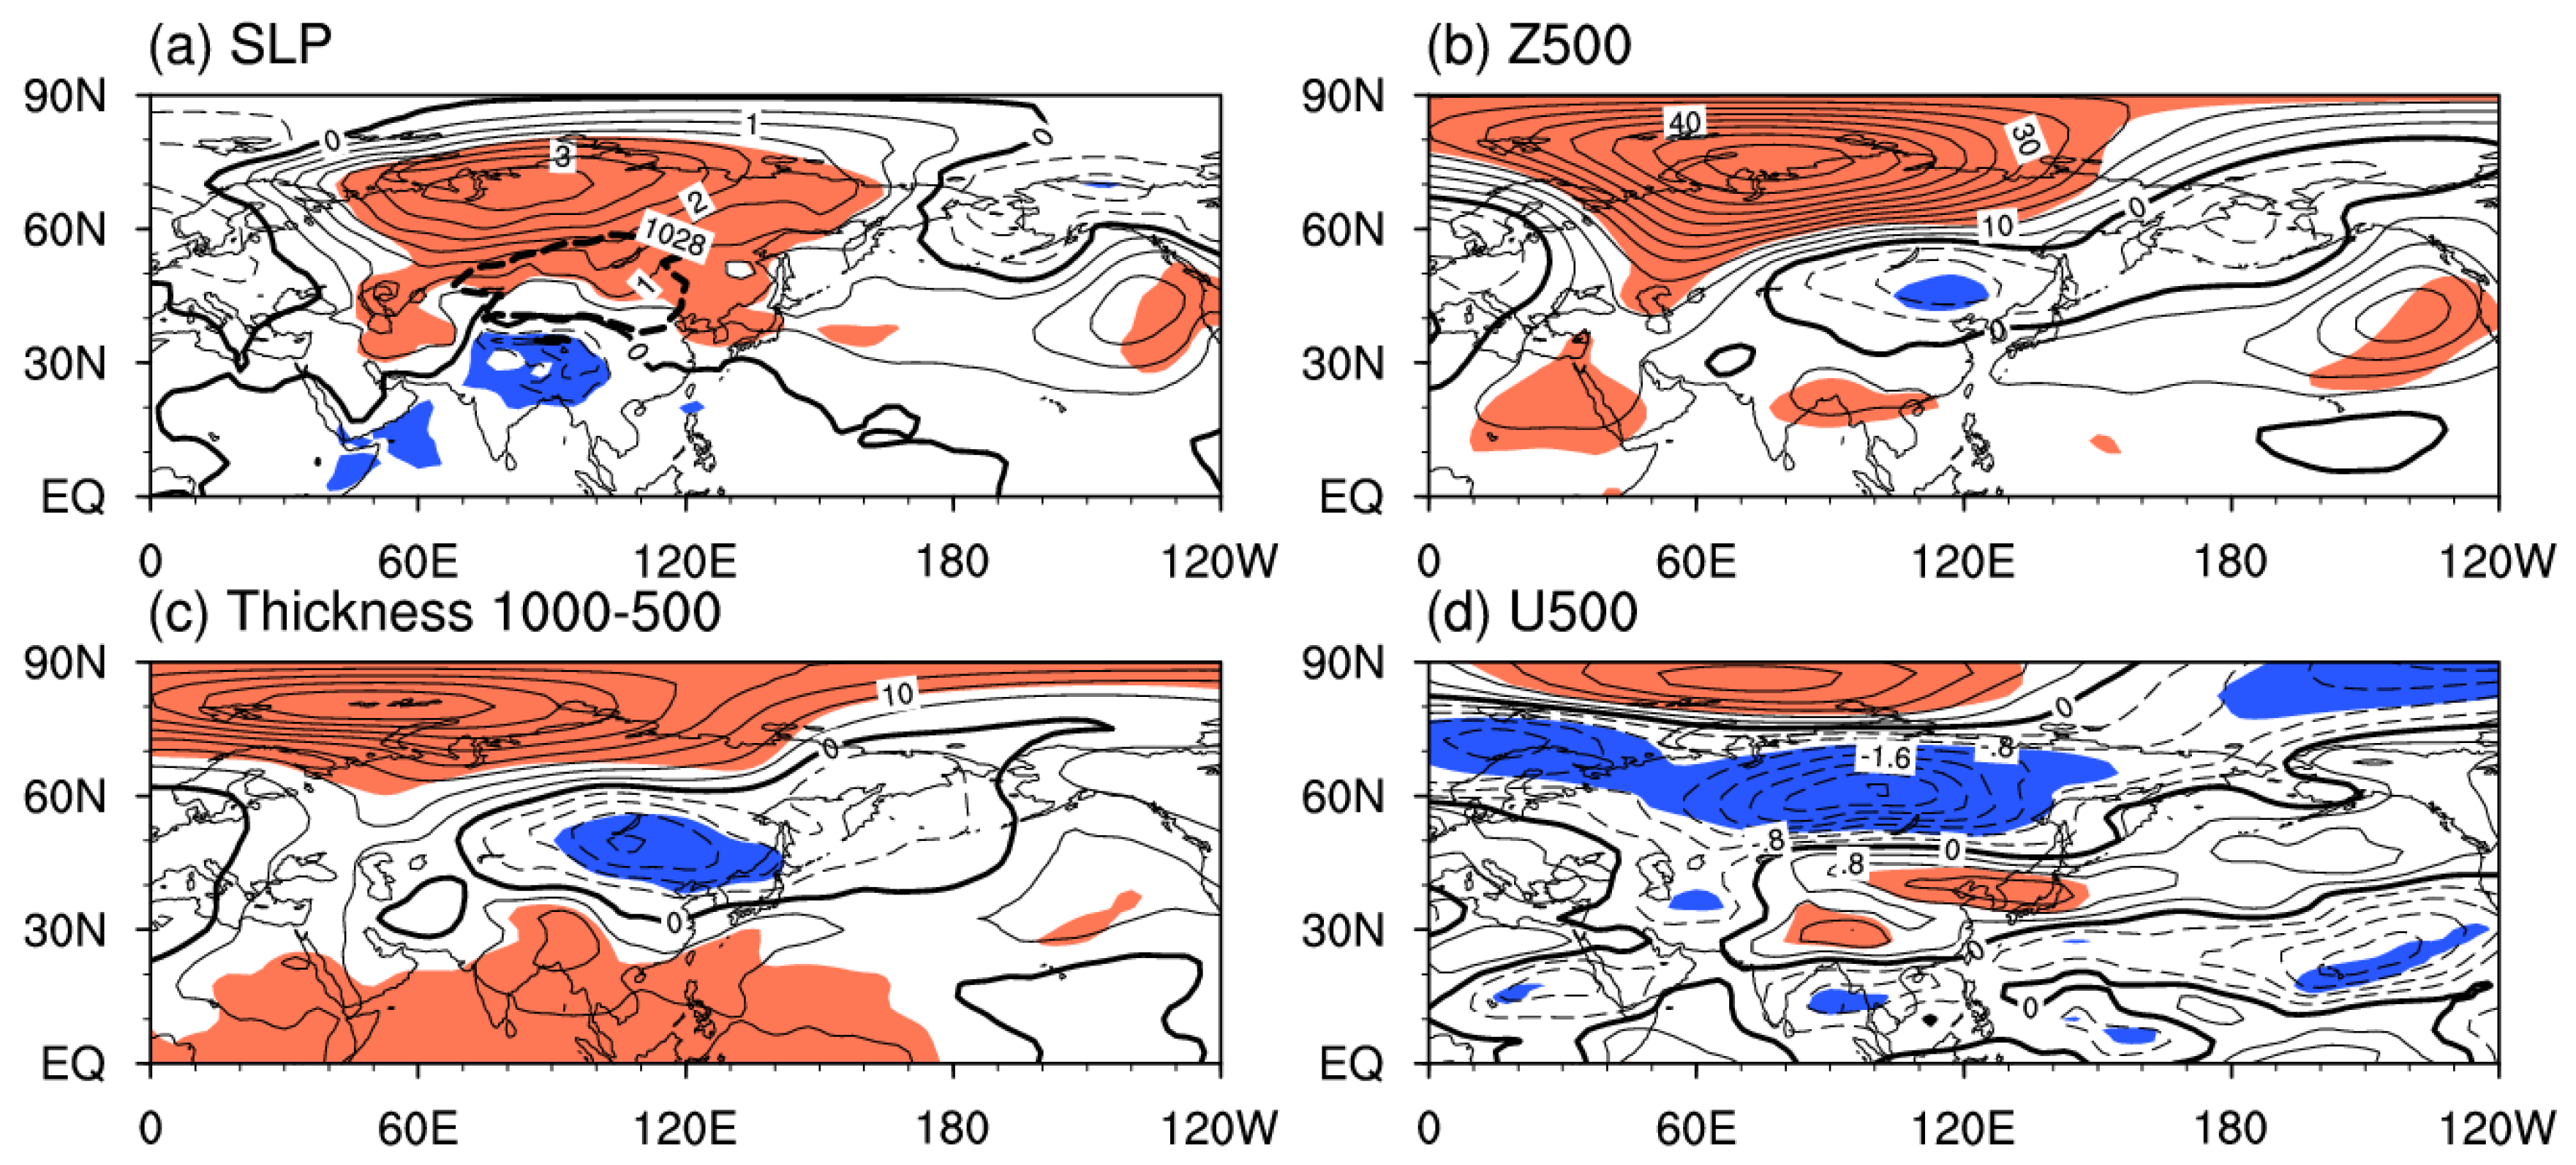
In the previous section, we found NCD was significantly correlated with T2m to the north of the Barents–Kara Sea (0–80° E, 73–84° N), and the average T2m over this region was defined as Arc-index. Song et al. [39] pointed out the area and location of SH are not fixed, and variations in intensity, area and location will cause significant changes in East Asian temperatures; when Siberian high central intensity enhances (weakens), its coverage expands (shrinks), its eastern boundary extends eastward (retreats westward), and the temperature over East Asia decreases (increases). Figure 10a demonstrates the regressed SLP against the Arc-index. When Arc-index increased, the Siberian high central intensity enhanced, the Siberian high area enlarged, and the Siberian high east boundary extended eastward, thus leading to lower temperatures over East Asia; when Arc-index decreased, the situation tended to be opposite. This indicates the Siberian high is a bridge linking the Arctic and East Asian climate to some extent, i.e., the Arctic warming → Siberian high central intensity enhances, Siberian high area expands, and Siberian high east boundary extends eastward → East Asia become colder → more NCD occur over East Asia.
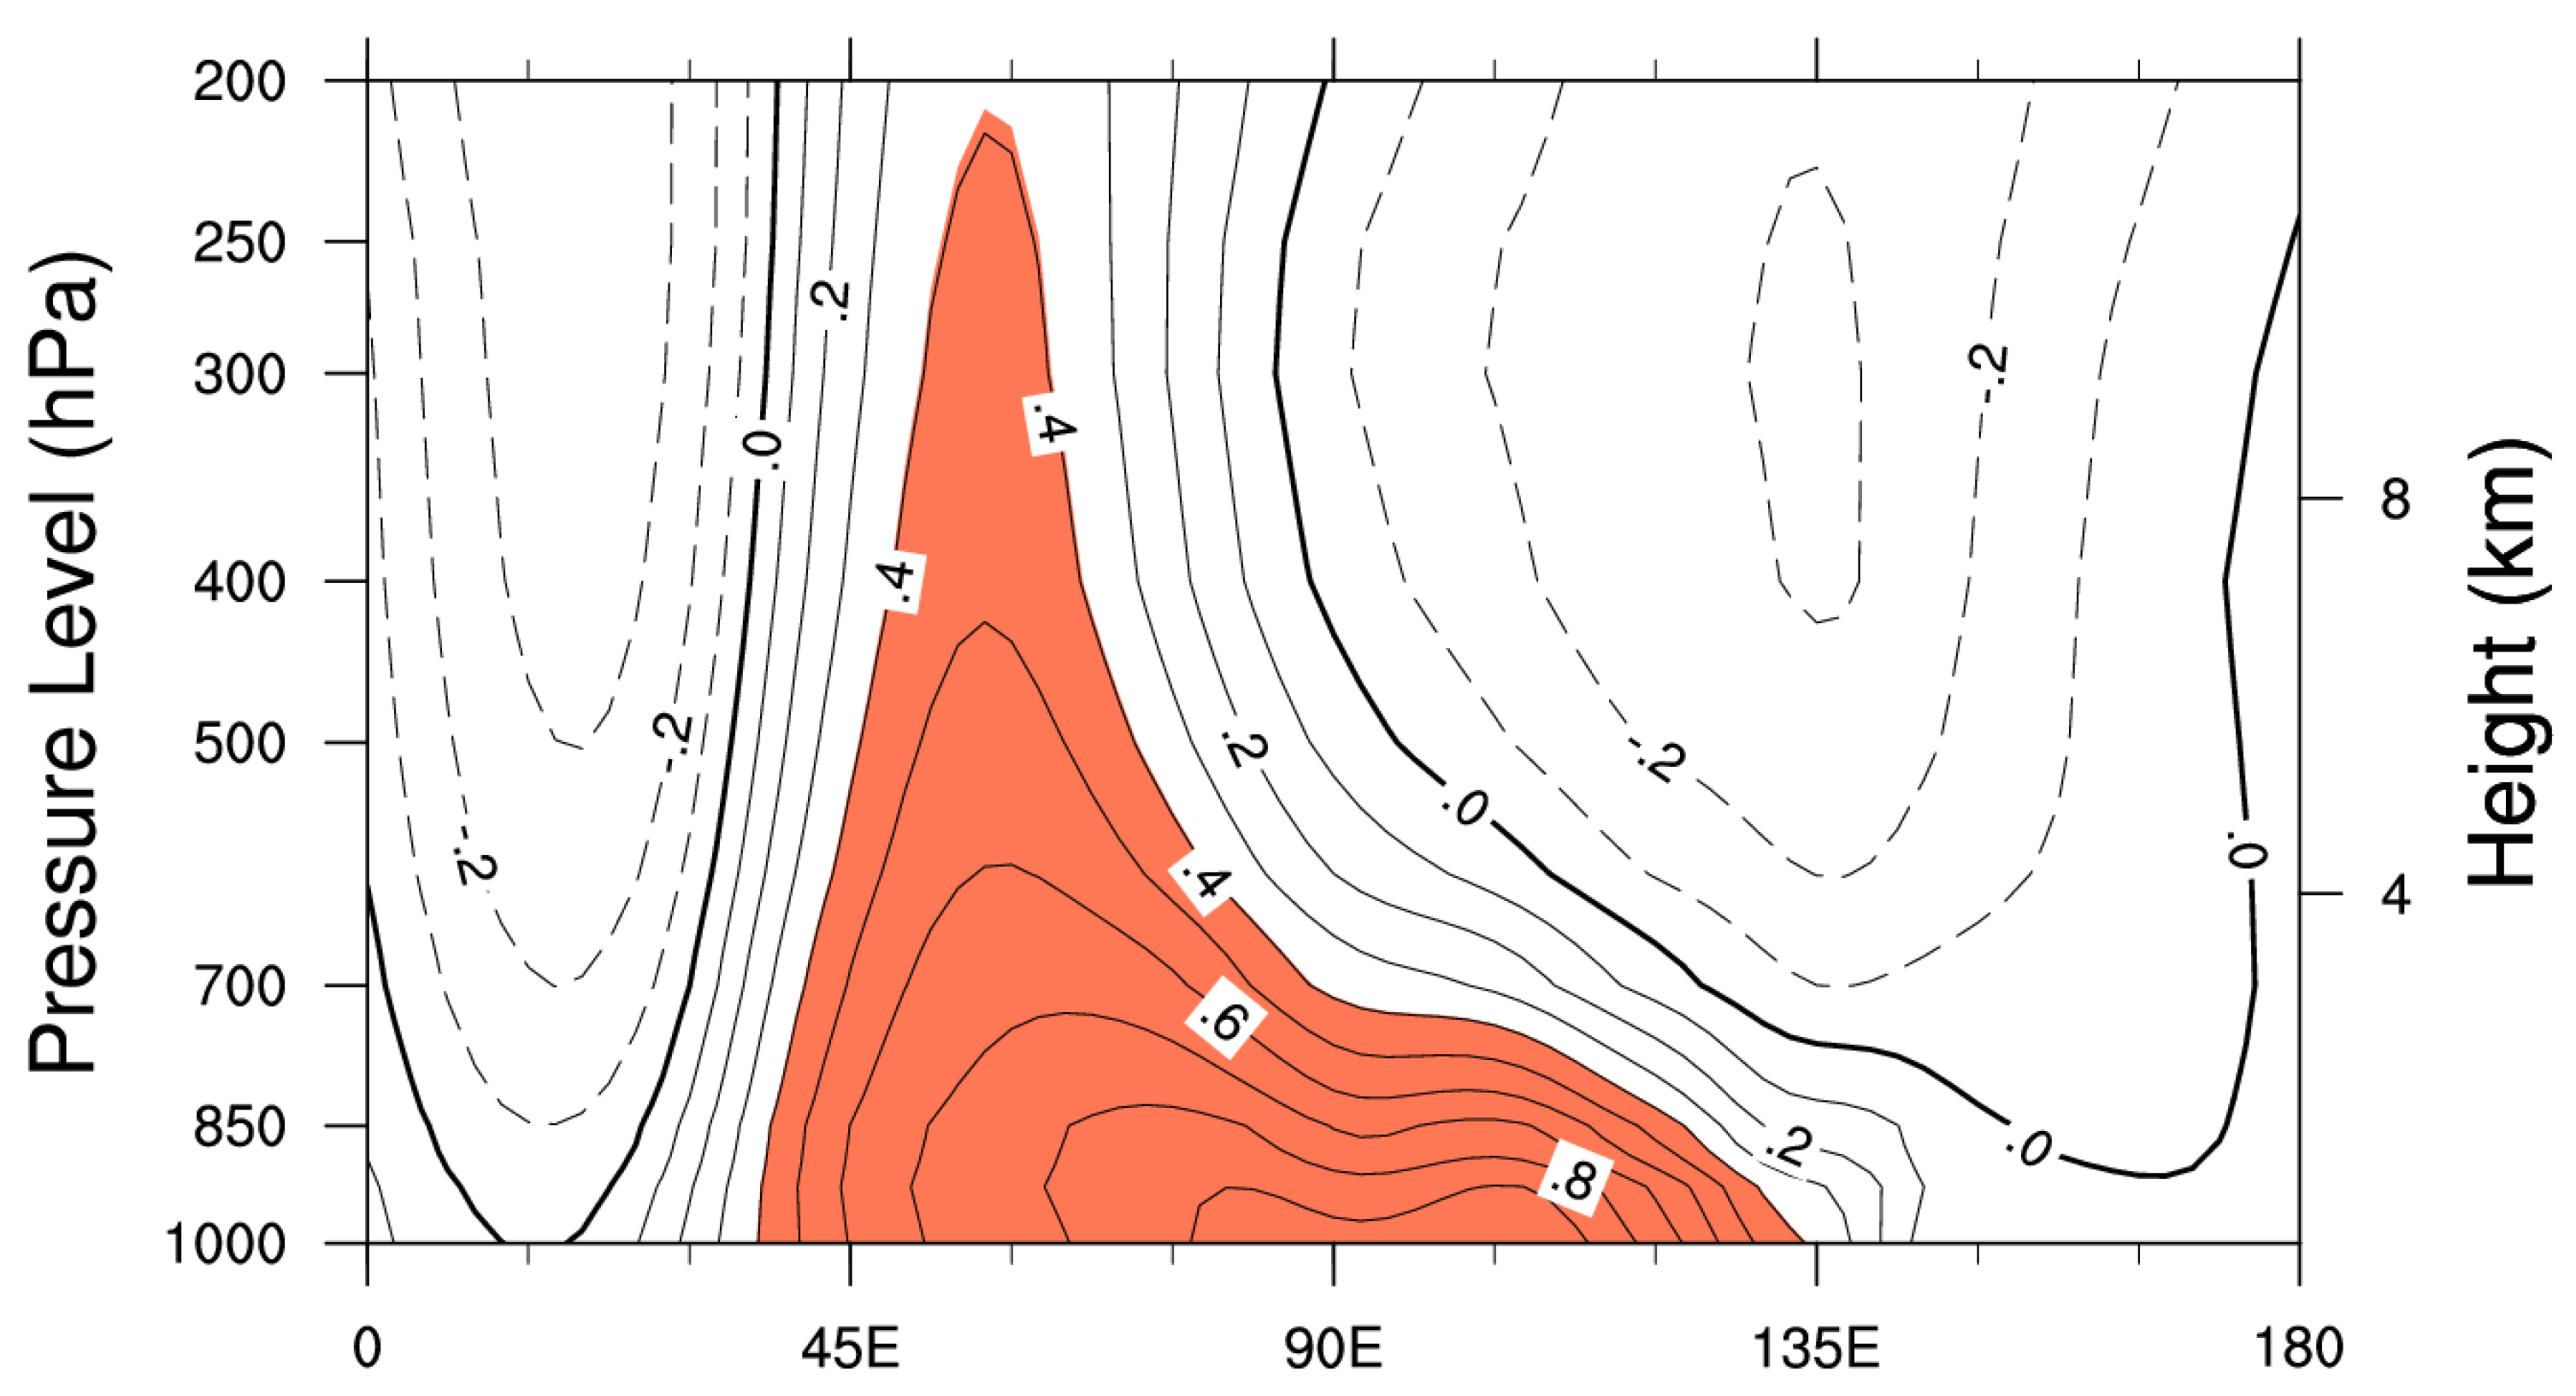
Additionally, when Arc-index rose, a positive SLP anomalous center emerged on the northwest side of the Baikal Lake (Figure 10a), extending southeast to East Asia, simultaneously, there was an unusually strong northerly wind near costal East Asia, conducive to the transportation of cold air from high-latitudes to East Asia, i.e., the enhanced SH favors more occurrences of NCD over East Asia. Regressed Z500 anomalies against the Arc-index (Figure 10b) implied that associated with Arctic warming, positive Z500 anomalies appeared at middle-high-latitudes over Eurasia, indicating the reinforcement of UBH and the Baikal Lake Blockings, especially UBH. It can be seen from the vertical distribution of the correlation coefficient between SH index (defined as the average SLP among 80–120° E, 40–60° N) and geopotential height (Figure 11) that the “negative–positive–negative” wave train from the west to the east was linked with the enhancement of SH; the positive anomalies were more pronounced over the Ural Mountains and the positive anomaly signals traveled downward and eastward to the Siberian plateau, eventually leading to the enhancement of SH. It suggests that when the Arc-index rises (decreases), it is favorable (unfavorable) for the establishment and development of UBH, further strengthening (weakening) SH, resulting in cold (warm) East Asia, finally, more (fewer) NCD emerge over East Asia. Numerical simulation results also suggest that the reduction in Arctic Sea ice (increase in near-surface temperature) has a stimulating effect on the formation of UBH [40], and Wang et al. [3] pointed out that at the interannual timescale, UBH activities have a good relationship with SH and East Asian winter climate. These in turn reflect that SH is an important bridge connecting the Arctic and East Asian climate, i.e., Arctic warming→ Eurasian blockings develop → SH reinforce → East Asian temperature decrease → more NCD occur over East Asia.
When the Arctic Sea ice reduces in summer, the thickness of the atmosphere increases at high-latitudes in autumn and winter due to the heating effect of the lower troposphere [41], which makes the thickness gradient between middle and high latitudes smaller. The thickness gradient, as one of the driving forces of the zonal wind, satisfies the thermal wind relationship with zonal wind [42], and the decrease in it will cause the zonal wind to weaken. The zonal wind can significantly influence the propagation velocity and amplitude of the Rossby wave. The wave velocity formula (1) suggests that when zonal wind weakens, the large-scale Rossby wave propagates to the east at a slower speed, usually accompanied by an increase in wave amplitude,
where is the zonal wind speed; , f is Coriolis force parameter, y is the north direction of the local cartesian coordinate system, β is smaller at middle–high-latitudes, and is considered constant at the latitude range of the wave amplitude; L is the wavelength, deepening of the trough and elongation of the ridge [43], and this circulation situation is conducive to an increase in the meridional pressure gradient at middle–high-latitudes, thus cold air at high-latitudes is more easily to be transported southward, resulting in more cold events [14]. It is well known that the average atmospheric thickness of 1000–500 hPa is thick at low-latitudes and thin at high-latitudes. The regressed 1000–500 hPa thickness anomalies against Arc-index (Figure 10c) showed that when Arc-index increased, positive thickness anomalies existed to the north of 60° N, and the positive center was located near the Barents–Kara Sea, and significant negative thickness anomalies were found to the south of the Baikal Lake. The pattern of the thickness variation reduced the gradient of the thickness between middle-latitudes and high-latitudes in the northern hemisphere, resulting in deceleration of zonal wind at middle-latitudes over the Eurasia. As demonstrated in Figure 10d, when Arctic warming happened, a “positive–negative–positive” pattern of U500 from the subtropical to the Arctic emerged, i.e., a positive “northeast–southwest” direction anomalous wind speed belt prevailed from the southern part of Japan to JiangHuai River Basin. Meanwhile, a negative “east–west” direction wind speed belt existed at 50–70° N over the Eurasian continent; a positive wind speed belt also located over the Arctic. The deceleration of zonal wind at middle-latitudes over Eurasia was conducive to the invasion of cold air from high-latitudes to the south, resulting in cold in East Asia. In order to prove the relationship between the deceleration of zonal wind and UBH and EAT, a zonal wind index was defined—average U500 among 60–135° E, 50–70° N. Z500 anomalies were regressed against this index. When the zonal wind over Eurasia decelerated, the positive Z500 anomalies were observed from the Barents–Kara Sea to the Baikal Lake, and negative Z500 anomalies prevailed in East Asia (Figure not shown) implying the reinforcement of UBH and EAT. To conclude, when Arc-index rises, the anomalous thickness of the “north positive–south negative” makes the meridional gradient between middle-latitudes and high-latitudes decrease, and the reduced thickness gradient leads to the deceleration of zonal wind at middle-latitudes over Eurasia, further strengthens UBH and EAT, and these can increase the meridional pressure gradient of the Eurasian middle–high-latitudes circulations, causing cold air to be transported southward, resulting in a colder East Asia, and eventually, more NCD occur over East Asia correspondingly. The situation tends to be opposite when Arc-index decreases.
5. Summary and Discussions
In this study, we preliminarily inquired into the variations of NCD over East Asia, and its possible relationships with AO and Arctic warming were further discussed. The results are as follows:
- NCD over East Asia had a downtrend (−0.386 day·decade−1) during 1956–1990 and an uptrend (1.645 day·decade−1) during 1991–2015. Additionally, increasing NCD was associated with the enhancement of SH in the lower troposphere, strengthening of EAT and UBH in the middle troposphere and deceleration of the westerlies at mid–high-latitudes over Eurasia, and the variations of the above systems were conducive to the intrusion of cold air into East Asia.
- During 1956–1990, NCD was significantly linked with AO (r = −0.59, exceeding 99% confidence level based on the Student’s t-test). During 1991–2015, the NCD index was notably correlated with T2m to the north of the Barents–Kara Sea (0–80° E, 73–84° N).
- During 1956–1990, the trends of SLP, Z500 and U300 indicated the weakening of SH, Eurasian Blockings and EAT, acceleration of mid–high-latitudes westerlies, and they explained why NCD decreased over East Asia. During 1991–2015, the situation tended to be the opposite, and this was why NCD increased over East Asia.
- When AO index increased during 1956–1990, the SLP field showed significantly negative anomalies at mid–high-latitudes over Eurasia and over the Arctic, indicating an obvious weakening of SH. Meanwhile, significant negative Z500 anomalies existed over the Ural Mountains and positive Z500 anomalies emerged over East Asia, implying the weakening of UBH and EAT. In addition, U300 displayed a “positive–negative–positive” anomalous band from low-latitudes, mid-latitudes to high-latitudes over East Asia–North Pacific region; this three-band structure was linked with the weakening of northerly wind over East Asia. These were favorable conditions for a weaker-than-normal EAWM, and T2m over East Asia increased, suggesting decreased NCD over East Asia. When AO index decreased, the situation tended to be opposite.
- When Arc-index increased during 1991–2015, on the one hand, SH reinforced and further led to more NCD over East Asia; on the other hand, the 1000–500 hPa thickness field demonstrated a “north positive–south negative” pattern, resulting in a thickness meridional gradient decrease between mid-latitudes and high-latitudes in the northern hemisphere, and the reduced thickness meridional gradient led to the decelerated westerlies at mid-latitudes over Eurasia, further bring about the enhancement of EAT and UBH, i.e., the meridional pressure gradient of the Eurasian mid–high-latitudes circulation increased, which was conducive to the southward transportation of cold air, eventually causing a colder East Asia, i.e., more NCD emerged over East Asia. When Arc-index decreased, the situation tends to be opposite.
Recent studies show that the Arctic sea-ice-air coupled system has a close connection with the extreme weather and climate events across Eurasian continent during winter. Simultaneously, the key processes and physical mechanisms involved in this connection is far from being fully understood. Therefore, more observational analyses, dynamical diagnoses and numerical simulation experiments should be carried out for thorough understanding of Arctic’s impacts on East Asian winter climate.
Author Contributions
Methodology, X.Y.; Writing—original draft, W.S. Both authors have read and agreed to the published version of the manuscript.
Funding
This work was supported by the National Natural Science Foundation of China, grant number 41675095.
Institutional Review Board Statement
Not applicable.
Informed Consent Statement
Not applicable.
Data Availability Statement
Our data are publicly available, and the specific website can refer to references.
Conflicts of Interest
The authors declare no conflict of interest.
References
- He, S.; Wang, H. Impact of the November/December Arctic Oscillation on the following January temperature in East Asia. J. Geophys. Res. Atmos. 2013, 118, 12981–12998. [Google Scholar] [CrossRef]
- Kang, L.; Chen, W.; Wang, L.; Chen, L. Interdecadal variations of winter temperature in China and their relationship with the atmospheric circulation and sea surface temperature. Chin. J. Atmos. Sci. 2006, 14, 45–53. (In Chinese) [Google Scholar]
- Wang, B.; Wu, Z.; Chang, C.; Liu, J. Another look at interannual-to-interdecadal variations of the East Asian Winter Monsoon: The northern and southern temperature modes. J. Clim. 2010, 23, 1495–1512. [Google Scholar] [CrossRef] [Green Version]
- Yang, L.; Wu, B. Interdecadal variations of the East Asian winter surface air temperature and possible causes. Chin. Sci. Bull. 2013, 58, 3969–3977. [Google Scholar] [CrossRef] [Green Version]
- Wang, L.; Chen, W. An intensity index for the East Asian winter monsoon. J. Clim. 2014, 27, 2361–2374. [Google Scholar] [CrossRef]
- Liu, Y.; Wang, L.; Zhou, W.; Chen, W. Three Eurasian teleconnection patterns: Spatial structures, temporal variability, and associated winter climate anomalies. Clim. Dyn. 2014, 42, 2817–2839. [Google Scholar] [CrossRef]
- Song, W.; Li, Y.; Wu, Z. Comparative analysis of cold events over central and eastern China associated with Arctic warming in early 2008 and 2016. Atmos. Ocean 2020, 58, 110–126. [Google Scholar] [CrossRef]
- Wu, Z.; Li, X.; Li, Y.; Li, Y. Potential influence of Arctic sea ice to the interannual variations of East Asian Spring Precipitation. J. Clim. 2016, 29, 1797–1813. [Google Scholar] [CrossRef]
- Thompson, D.; Wallace, J. The Arctic oscillation signature in the wintertime geopotential height and temperature fields. Geophys. Res. Lett. 1998, 25, 1297–1300. [Google Scholar] [CrossRef] [Green Version]
- Thompson, D.; Wallace, J. Annular modes in the extratropical circulation Part I: Month-to-month variability. J. Clim. 2000, 13, 1000–1016. [Google Scholar] [CrossRef]
- Gong, D.; Wang, S.; Zhu, J. East Asian winter monsoon and Arctic Oscillation. Geophys. Res. Lett. 2001, 28, 2073–2076. [Google Scholar] [CrossRef]
- Jeong, J.; Ho, C. Changes in occurrence of cold surges over East Asia in association with Arctic Oscillation. Geophys. Res. Lett. 2005, 32, L14704. [Google Scholar] [CrossRef]
- Park, T.; Ho, C.; Yang, S. Relationship between the Arctic Oscillation and cold surges over East Asia. J. Clim. 2011, 24, 68–83. [Google Scholar] [CrossRef]
- Francis, J.; Vavrus, S. Evidence linking Arctic amplification to extreme weather in mid-latitudes. Geophys. Res. Lett. 2012, 39, L06801. [Google Scholar] [CrossRef]
- Li, Y.; Leung, L. Potential impacts of the Arctic on interannual and interdecadal summer precipitation over China. J. Clim. 2013, 26, 899–917. [Google Scholar] [CrossRef]
- Screen, J.; Simmonds, I. The central role of diminishing sea ice in recent Arctic temperature amplification. Nature 2010, 464, 1334–1337. [Google Scholar] [CrossRef] [PubMed] [Green Version]
- Wu, B.; Handorf, D.; Dethloff, K.; Rinke, A.; Hu, A. Winter weather patterns over northern Eurasia and Arctic sea ice loss. Mon. Wea. Rev. 2013, 141, 3786–3800. [Google Scholar] [CrossRef] [Green Version]
- Wu, B.; Yang, K.; Francis, J. Summer Arctic dipole wind pattern affects the winter Siberian high. Int. J. Clim. 2016, 36, 4187–4201. [Google Scholar] [CrossRef]
- Wu, B. Winter atmospheric circulation anomaly associated with recent Arctic winter warm anomalies. J. Clim. 2017, 30, 8469–8479. [Google Scholar] [CrossRef]
- Kalnay, E.; Kanamitsu, M.; Kistler, R.; William, G.; Deaven, D.; Gandin, L.; Iredell, M.; Satyajit, S.; White, G.; Woollen, J. The NCEP/NCAR 40-year reanalysis project. Bull. Am. Meteor. Soc. 1996, 77, 437–470. [Google Scholar] [CrossRef] [Green Version]
- Zhou, S.; Miller, A.; Wang, J.; Angell, J. Trends of NAO and AO and their associations with stratospheric processes. Geophys. Res. Lett. 2001, 28, 4107–4110. [Google Scholar] [CrossRef]
- Gong, D.; Gao, Y.; Dong, G.; Rui, M.; Jing, Y.; Miao, H. Interannual linkage between Arctic/North Atlantic Oscillation and tropical Indian ocean precipitation during boreal winter. Clim. Dyna. 2014, 42, 1007–1027. [Google Scholar] [CrossRef]
- Zhang, X.; Alexander, L.; Hegerl, G.; Jones, P.; Tank, A.; Peterson, T.; Trewin, B.; Zwiers, F. Indices for monitoring changes in extremes based on daily temperature and precipitation data. Wiley Interdiscip. Rev. Clim. Chang. 2011, 2, 851–870. [Google Scholar] [CrossRef]
- Gong, D.; Wang, S.; Zhu, J. Arctic Oscillation in influence on daily temperature variance in winter over China. Chin. Sci. Bull. 2004, 49, 487–492. (In Chinese) [Google Scholar] [CrossRef]
- Jiao, Y.; You, Q.; Lin, H.; Min, J. Relationship of Arctic sea ice coverage anomalies in summer-autumn and extreme cold days over the Tibetan Plateau in autumn-winter and the mechanism. Clim. Environ. Res. 2017, 22, 435–445. (In Chinese) [Google Scholar]
- Arguez, A.; Durre, I.; Applequist, S.; Russell, S.; Timothy, W. NOAA’s 1981–2010 U.S. climate normals: An overview. Bull. Am. Meteorol. Soc. 2012, 93, 1687–1697. [Google Scholar] [CrossRef]
- North, G.; Bell, T.; Cahalan, R.; Moeng, F. Sampling errors in the estimation of empirical orthogonal functions. Mon. Weather Rev. 1982, 110, 699–706. [Google Scholar] [CrossRef]
- Wang, L.; Gao, G.; Zhang, Q.; Sun, J.; Wang, Z.; Zhang, Y.; Zhao, S.; Chen, X.; Chen, Y.; Wang, Y.; et al. Analysis of the severe Cold surge, ice-snow and frozen disasters in South China during January 2008: I. climatic features and its impact. Meteorol. Mon. 2008, 34, 95–100. (In Chinese) [Google Scholar]
- Wang, L.; Chen, W.; Zhou, W.; Chan, J.; Barriopedro, D.; Huang, R. Effect of the climate shift around mid 1970s on the relationship between wintertime Ural blocking circulation and East Asian climate. Int. J. Clim. 2010, 30, 153–158. [Google Scholar] [CrossRef] [Green Version]
- Sun, C.; Yang, S.; Li, W.; Zhang, R.; Wu, R. Interannual variations of the dominant modes of East Asian winter monsoon and possible links to Arctic sea ice. Clim. Dyn. 2015, 47, 1–16. [Google Scholar]
- Lim, Y.; Kim, H. Comparison of the impact of the Arctic Oscillation and Eurasian teleconnection on interannual variation in East Asian winter temperatures and monsoon. Theor. Appl. Clim. 2016, 124, 267–279. [Google Scholar] [CrossRef]
- Liu, C.; Li, Y.; Song, W.; Liu, Z. Theoretical analysis about quasi-periodic conversion of the westerly belt in the northern hemisphere-the mechanism of energy transfer. Chin. J. Atmos. Sci. 2019, 43, 456–466. (In Chinese) [Google Scholar]
- Wu, B.; Wang, J. Winter Arctic Oscillation, Siberian High and East Asian winter monsoon. Geophys. Res. Lett. 2002, 29, 1897. [Google Scholar] [CrossRef]
- Yan, H.; Duan, W.; Xiao, Z. A study on relation between east Asian winter monsoon and climate change during raining season in China. J. Trop. Meteorol. 2003, 19, 368–376. (In Chinese) [Google Scholar]
- Jhun, J.; Lee, E. A new east Asian winter monsoon index and associated characteristics of the winter monsoon. J. Clim. 2004, 17, 711–788. [Google Scholar] [CrossRef]
- Zhu, Y. An index of east Asian winter monsoon applied to description the Chinese mainland winter temperature changes. Acta Meteorol. Sin. 2008, 66, 781–788. (In Chinese) [Google Scholar]
- Kug, J.; Jeong, J.; Jang, Y.; Kim, B.; Folland, C.; Min, S.; Son, S. Two distinct influences of Arctic warming on cold winters over North America and East Asia. Nat. Geosci. 2015, 10, 759–762. [Google Scholar] [CrossRef]
- Song, W. On the Linkage between Arctic Near-Surface Temperature Variations and East Asian Winter Monsoon; Nanjing University of Information, Science and Technology: Nanjing, China, 2019. [Google Scholar]
- Song, W.; Wu, Z.; Li, Y.; Liu, C. Interannual association of the near-surface temperature between eastern China and the Arctic in winter. Clim. Environ. Res. 2018, 23, 463–478. (In Chinese) [Google Scholar]
- Han, Z.; Li, S. Impact of Arctic sea ice on the high pressure over the Ural Mountains during January 2008. Clim. Environ. Res. 2013, 18, 671–680. (In Chinese) [Google Scholar]
- Francis, J.; Chan, W.; Leathers, D.; Miller, J.; Veron, D. Winter Northern Hemisphere weather patterns remember summer Arctic sea-ice extent. Geophys. Res. Letts. 2009, 36, L07503. [Google Scholar] [CrossRef] [Green Version]
- Zhu, Q.; Lin, J.; Shou, S. The Principle and Method of Synoptic Meteorology, 4th ed.; China Meteorological Press: Beijing, China, 2007; pp. 49–181. (In Chinese) [Google Scholar]
- Palmén, E.; Newton, C. Atmospheric Circulation Systems; Academic Press: New York, NY, USA, 1969; pp. 90–91. [Google Scholar]
Figure 1.
Definition of NCD. Threshold values (°C) defined NCD over East Asia, which were 10th percentile of Tmin_2m within the month of (a) December, (b) January, and (c) February. The contour interval (CI) was 5 °C. (d–f) and (g–i) the same as (a–c), but for the 15th and 20th, respectively.
Figure 1.
Definition of NCD. Threshold values (°C) defined NCD over East Asia, which were 10th percentile of Tmin_2m within the month of (a) December, (b) January, and (c) February. The contour interval (CI) was 5 °C. (d–f) and (g–i) the same as (a–c), but for the 15th and 20th, respectively.

Figure 2.
Spatial pattern of the first two EOF mode (a,b) of NCD (based on 10% threshold) in the winter during 1956–2015.
Figure 2.
Spatial pattern of the first two EOF mode (a,b) of NCD (based on 10% threshold) in the winter during 1956–2015.

Figure 3.
Time series of NCD index defined by 10th (Green), 15th (Blue), and 20th (Red) percentile during 1956–2015.
Figure 3.
Time series of NCD index defined by 10th (Green), 15th (Blue), and 20th (Red) percentile during 1956–2015.

Figure 4.
(a) Time series of NCD index (Black) during 1956–2015. Blue and Red lines refer to linear trend of NCD during 1956–1990 and 1991–2015, respectively; (b) map of correlation coefficients between NCD index and the NCD at each grid point in winter over East Asia during 1956–2015. Shaded values are significant, exceeding 95% confidence level based on Student’s t-test.

Figure 5.
Maps of correlation coefficients between NCD index and winter (a) SLP, (b) Z500, (c) U300, and (d) T2m during 1956–2015. The black rectangle-shaped box indicates East Asia (100–150° E, 25–55° N). Shaded values are significant, exceeding 95% confidence level based on Student’s t-test.
Figure 5.
Maps of correlation coefficients between NCD index and winter (a) SLP, (b) Z500, (c) U300, and (d) T2m during 1956–2015. The black rectangle-shaped box indicates East Asia (100–150° E, 25–55° N). Shaded values are significant, exceeding 95% confidence level based on Student’s t-test.

Figure 6.
Maps of correlation coefficients between NCD index and winter T2m (65–90° N) during (a) 1956–2015, (b) 1956–1990, and (c) 1991–2015. CI is 0.1, the black fan-shaped box in c indicates the Arctic key region (0–80° E, 73–84° N), shaded values are significant, exceeding 95% confidence level based on Student’s t-test.

Figure 7.
(a) Time series of AO index (bar) during 1956–2015. Black line refers to linear trend of AO during 1956–1990; (b) map of correlation coefficients between AO index and the number of cold days at each grid point in winter over East Asia during 1956–1990. Shaded values are significant, exceeding 95% confidence level based on Student’s t-test.

Figure 8.
Maps of linear trend of (a,b) SLP (hPa·decade−1), (c,d) Z500 (gpm·decade−1), and (e,f) U300 (m·s−1·decade−1) during 1956–1990 and 1991–2015.
Figure 8.
Maps of linear trend of (a,b) SLP (hPa·decade−1), (c,d) Z500 (gpm·decade−1), and (e,f) U300 (m·s−1·decade−1) during 1956–1990 and 1991–2015.

Figure 9.
The (a) SLP (CI = 1 hPa), (b) Z500 (CI = 10 gpm), (c) U300 (CI = 1 m·s−1), and (d) T2m (CI = 0.5 °C) pattern regressed against the AO index during 1956–1990. The black rectangle-shaped box in (d) indicates East Asia (100–150°E, 25–55°N). Shaded values are significant, exceeding 95% confidence level based on Student’s t-test.

Figure 10.
The (a) SLP (CI = 0.5 hPa), (b) Z500 (CI = 5 gpm), (c) Thickness 1000–500 hPa (CI = 5 gpm), and (d) U500 (CI = 0.4 m·s−1) pattern regressed against the Arc-index during 1991–2015. Shaded values are significant, exceeding 95% confidence level based on Student’s t-test.
Figure 10.
The (a) SLP (CI = 0.5 hPa), (b) Z500 (CI = 5 gpm), (c) Thickness 1000–500 hPa (CI = 5 gpm), and (d) U500 (CI = 0.4 m·s−1) pattern regressed against the Arc-index during 1991–2015. Shaded values are significant, exceeding 95% confidence level based on Student’s t-test.

Figure 11.
The longitude-height cross-section of correlation coefficients between SH index and geopotential height averaged over 40–60° N in the winter during 1991–2015. Shaded values are significant, exceeding 95% confidence level based on Student’s t-test.
Figure 11.
The longitude-height cross-section of correlation coefficients between SH index and geopotential height averaged over 40–60° N in the winter during 1991–2015. Shaded values are significant, exceeding 95% confidence level based on Student’s t-test.

Publisher’s Note: MDPI stays neutral with regard to jurisdictional claims in published maps and institutional affiliations. |
© 2021 by the authors. Licensee MDPI, Basel, Switzerland. This article is an open access article distributed under the terms and conditions of the Creative Commons Attribution (CC BY) license (https://creativecommons.org/licenses/by/4.0/).
Share and Cite
MDPI and ACS Style
Song, W.; Ye, X. Possible Associations between the Number of Cold Days over East Asia and Arctic Oscillation and Arctic Warming. Atmosphere 2021, 12, 842. https://0-doi-org.brum.beds.ac.uk/10.3390/atmos12070842
AMA Style
Song W, Ye X. Possible Associations between the Number of Cold Days over East Asia and Arctic Oscillation and Arctic Warming. Atmosphere. 2021; 12(7):842. https://0-doi-org.brum.beds.ac.uk/10.3390/atmos12070842
Chicago/Turabian StyleSong, Wei, and Xiaochen Ye. 2021. "Possible Associations between the Number of Cold Days over East Asia and Arctic Oscillation and Arctic Warming" Atmosphere 12, no. 7: 842. https://0-doi-org.brum.beds.ac.uk/10.3390/atmos12070842
Note that from the first issue of 2016, this journal uses article numbers instead of page numbers. See further details here.