Article

Office Indoor PM and BC Level in Lithuania: The Role of a Long-Range Smoke Transport Event

by
Julija Pauraite
1,*,
Gediminas Mainelis
2,
Simonas Kecorius
3,
Agnė Minderytė
1,
Vadimas Dudoitis
1,
Inga Garbarienė
1,
Kristina Plauškaitė
1,
Jurgita Ovadnevaite
4 and
Steigvilė Byčenkienė
1
1
Center for Physical Sciences and Technology (FTMC), Saulėtekio av. 3, LT-10257 Vilnius, Lithuania
2
Department of Environmental Sciences, Rutgers, The State University of New Jersey, 14 College Farm Road, New Brunswick, NJ 08901, USA
3
Leibniz Institute for Tropospheric Research, Permoserstraße 15, 04318 Leipzig, Germany
4
School of Physics, Ryan Institute’s Centre for Climate & Air Pollution Studies, and Marine Renewable Energy Ireland, National University of Ireland Galway, H91 CF50 Galway, Ireland
*
Author to whom correspondence should be addressed.
Submission received: 13 July 2021 / Revised: 12 August 2021 / Accepted: 13 August 2021 / Published: 15 August 2021
(This article belongs to the Special Issue Air Quality Management)

Abstract

:
While the impacts of climate change on wildfires and resulting air pollution levels have been observed, little is known about how indoor air filtering systems are performing under intensive smoke conditions. For this aim, particle number size distribution and concentration in a size range 0.5–18 µm and equivalent black carbon (eBC) mass concentration were measured in a modern office with a mechanical ventilation system. Measurements took place from 30 September to 6 October 2020 in the Center for Physical Sciences and Technology (FTMC) campus located in the urban background environment in Lithuania. During the measurement campaign, an intensive pollution episode, related to long-range transport wildfire smoke, was observed. The results indicated that the smoke event increased both indoor and outdoor eBC mass concentrations twice. Filters were non-selective for different eBC sources (biomass burning versus traffic) or chemical composition of carbonaceous aerosol particles (eBC versus brown carbon (BrC)). Air filtering efficiency was found to be highly dependent on particle size. During the smoke event the highest particle number concentration was observed at 2.1 µm and 1.0 µm size particles in outdoor and indoor air, respectively. Differences of indoor to outdoor ratio between event and non-event days were not significant. Because of lower removal rate for small particles, eBC had higher contribution to total PM2.5 mass concentration in indoor air than in outdoor air. The results gained are crucial for decision-making bodies in order to implement higher-quality air-filtering systems in office buildings and, as a result, minimize potential health impacts.

1. Introduction

Numerous studies found that climate change has greatly enhanced the probability of extreme wildfires [1,2,3]. A record of burned areas globally was recently reported [4,5]. Wildfires are a significant source of fine airborne particulate matter (PM2.5) [6,7,8,9]. Recent literature on wildfires observation and forecast has been limited to locations and intensity of wildfires themselves and estimation of potential for future burned areas [10].
Fine particulate matter (PM2.5) is the main pollutant emitted by fires, and it has been linked to various respiratory and cardiovascular health effects, such as cardiopulmonary and lung cancer mortality [11,12]. While exposures to PM2.5 are typically estimated based on PM2.5 mass concentration, Manigrasso et al. (2020) [13] showed that fine particle number concentration is a more adequate metric than the PM mass. These findings are important, because to date, environmental legislation is based on mass concentration of particulate matter, such as PM10 and PM2.5, rather than on other particle parameters that could be associated with human health effects (e.g., particle number, shape, and chemical composition). Importantly, it was reported that current air-quality standards based on PM mass concentration are not well suited for characterizing health risks due to air pollution in wood smoke-dominated areas [14]. In addition to particle physical properties (e.g., shape, size, number concentration), analyzing particles based on their chemical composition is equally important for accurately determining particle health effects. For example, equivalent black carbon (eBC) is widely known for its negative effect on human health [15,16,17,18]. Janssen et al. (2011) [14] observed that estimated health effects caused by each increase of 1 µg m−3 were greater for eBC than for PM10 and PM2.5. In the urban environment, two main sources of eBC are known—emissions from fossil fuel and biomass burning [19]. Reid et al. (2009) [20] demonstrated consistent evidence linking exposure to eBC-rich wildfire smoke with respiratory health effects such as asthma and chronic obstructive pulmonary disease.
As people spend most of the time at home or at the workplace (around 90% [21], indoor air quality has a significant impact on human wellbeing. Multiple studies examined indoor air quality and possible aerosol sources in residential buildings (e.g., [22,23,24]). However, studies of office air quality remain limited [25,26]. Hassanvand et al. (2014) [27] observed that 79–83% of indoor PM1 fraction in buildings originated from an outdoor environment. In addition, Custódio et al. (2014) [28] concluded that indoor concentrations were mainly controlled by outdoor sources such as vehicular emissions and biomass burning. Therefore, a proper selection of a building filtering system becomes crucial. The indoor filtration system is even more important during wildfires as it is recommended that people stay indoors during such events to minimize exposure to PM. However, current air cleaning technologies and filtration systems for indoor air have not been widely tested under intensive outdoor wildfire conditions. Thus, little is known about how indoor air filtration systems will handle pollution levels due to increasingly recurring wildfires. This lack of testing of filtration systems under high pollution levels associated with wildfires creates a concern about indoor air quality during such events.
Mechanical air filtration is the most widely utilized method to reduce indoor air pollutants [29,30]. In the European Union, filters of classes G1-G4 and M5-M6 are usually used as pre-filters for the final filters F7-F9 in mechanical ventilation systems for residential houses and office buildings (ISO16890, 2016). Fisk et al. (2000) [31] showed that a fine particle filter (F7-F9) can substantially reduce submicron particle concentration (PM from 0.3 to 1 µm) in a mechanically ventilated building, and that reduces indoor exposure to outdoor particles leading to human health benefits. Happo et al. (2014) [32] concluded that PM generated outdoors has a limited effect on indoor air quality in a modern mechanically ventilated house at low outdoor air pollution levels. However, Zee et al. (2017) [33] indicated that the removal efficiency of an F8 filter for PM2.5 and BC was only ~30% at a hot spot location (classroom near the highway). Portable air cleaners with HEPA filters and other high-efficiency filtration systems have been evaluated for their ability to remove smoke, dust, and transportation-related particles in residential buildings. A recent study by Cox et al. (2018) [34] showed that a HEPA cleaner can significantly reduce the indoor BC/PM2.5 fraction (from 1/3 outdoor to 1/7 indoor), indicating that BC could be successfully captured by HEPA filtration.
This study aimed to investigate how outdoor air affects indoor air quality (IAQ), particularly PM and eBC, in an office building. It just so happened that a long-range wildfire event took place during our study and offered a natural experiment to investigate how a long-range wildfire smoke event affects IAQ. Thus, outdoor and indoor office air was simultaneously investigated through various metrics: particle size distribution, PM2.5, PM10, and eBC mass concentrations. Since all parameters were evaluated for indoor and outdoor air during the event (fire) and non-event (no fire) days, it also allowed evaluating the air filtration system’s performance during a long-range wildfire event. Due to increasing frequency of global wildfires, this study provides a crucial knowledge for air quality management in office buildings.

2. Methods

2.1. Location

The eBC mass concentration, aerosol particle number concentration, and particle light scattering coefficient measurements were performed from 30 September to 6 October 2020 in the building of the Center for Physical Sciences and Technology (FTMC) main campus (54°72′ N, 25°32′ E) in Vilnius, Lithuania. The building is located 6 km to the east from the city center and 600 m from a high-capacity urban road. All instruments were deployed on the 2nd floor of the building (12 m above ground level). The outdoor sampling port was at the same height.
The indoor measurement site was a laboratory space that could also be described as a typical office with an air supply system containing three-stage filtration. The indoor air supply was treated with G4 class pre-filters, and F7, as well as F9 filters, were in the final stage (Manufacturer Ygla, Vilnius, Lithuania). G4 is used for the initial removal of insects, sand, fly ash, spores, pollen, cement dust, and other air pollutant particles larger than 10 µm. According to the DIN EN ISO 16890 standard, pre-filter G4 removes coarse particles with a 60–70% filtration efficiency. Meanwhile, F7 and F9 filters reduce oil fumes, agglomerated soot, tobacco, and other types of smoke particles from the air supply. F7 filters PM2.5 particles with 65 to 95% efficiency and PM1 particles with 50–65% efficiency. The final filter (F9) achieves at least 80% efficiency for PM1. The filtered air flow rate into the office was 1414 m3 h−1. It is worth mentioning that during the measurement campaign, indoor aerosol sources were kept to a minimum: indoor activity in the laboratory and adjacent rooms was limited; there is no food service located in the building; windows and doors were kept closed; etc. In addition, F7 filters were installed between rooms within the building. Therefore, any changes in indoor PM presence were due to the changes in outdoor PM and the air filtration system’s performance.

2.2. Instrumentation and Data Sources

An aethalometer (A Magee Scientific, Model AE31 Spectrum, manufactured by Aerosol d.o.o., Ljubljana, Slovenia) and an aerodynamic particle sizer (APS; TSI model 3321) were used to measure airborne particles indoors and outdoors using a proprietary system which automatically switched sampling from indoor to outdoor air every 30 min. The aethalometer measures light absorption at 7 different wavelengths. The channel at 880 nm was used for equivalent black carbon (eBC) mass concentration and default fixed mass absorption cross-section (MAC) (16.6 m2 g−1) was used for the evaluation. Uncertainties evaluated during intercomparison campaigns were applied to the aethalometer (10% [35]) and APS measurements (10% [36]). A nephelometer (TSI model 3563) was used to measure outdoor environment only. Additional data of outdoor PM10 (hourly) and PM2.5 (daily) mass concentration for comparison was gathered from nearby (2.5 km away) monitoring station.
A detailed description of instrumentation used, evaluation of in-situ aerosol properties, data correction description, satellite data and fire map tool are presented in supplementary material.

3. Results

3.1. Outdoor Smoke Event

During the 1–3 of October boundary layer depth and vertical mixing significantly decreased creating suitable conditions for particle accumulation in the boundary layer (Figure 1). Concurrently, high mass concentration of PM10 (on average 132.9 µg m−3, measured at the nearest monitoring station) was registered. The European Union 24 h standard for PM10 is 50 µg m−3 and this concentration was exceeded by up to 2.7 times during those days (Figure 1). The reason behind the increased pollution level was air mass transport of particles from forest fires south-east of our measurement location. The Fire Information for Resource Management System (FIRMS) map revealed that several days before the air pollution event in Vilnius, a large area of forests were burning in the Luhansk region, Ukraine, near the border with Russia. Figure 2 shows active fire locations during the period of 30 September–3 October 2020. The gathered data agrees well with backward trajectories indicating that air mass from the wildfire location in the Luhansk region was transported over to Lithuania (Figure 2). Combination of obtained data from the Hybrid Single-Particle Lagrangian Integrated Trajectory model (HYSPLIT), Navy Aerosol Analysis and Prediction System (NAAPS) and FIRMS suggests that elevated aerosol concentrations in Vilnius were caused by smoke and dust particles brought from severe wildfire locations. Thus, we hypothesized the confluence of stable atmospheric conditions in the lower troposphere and the long-range transport of smoke and dust particles from the wildfire area led to the accumulation of high levels of airborne pollutants.
The hypothesis above was tested by investigating aerosol optical properties (described at supplementary material). Cappa et al. (2016) [37] introduced a classification scheme based on sections within the AAE532/660 (absorption Angström exponent) vs. SAE450/550 (scattering Angström exponent) space. The classification of carbonaceous particles consists of 8 different segments with different optical and size-related parameters. The names of different segments were suggested by Cappa et al. (2016) [37], and their distribution based on our data are shown in Figure 3. As we can see from Figure 3, before and after the smoke event carbonaceous particles were characterized as BC dominated. On the other hand, during the pollution event, the presence of dust and brown carbon (BrC) increased. Therefore, the in situ measurement results are in agreement with satellites and air masses trajectories observations.

3.2. Particulate Matter (PM) Levels in Indoor and Outdoor Air

The number concentration of particles measured by APS was converted to airborne mass concentration using a procedure described in supplementary material. Outdoor PM10 and PM2.5 mass concentrations calculated from aerosol number distribution were compared with data collected at the air pollution monitoring station located 2.5 km away and represent an urban background level with minor not direct influence from traffic and industry emissions (Figure 4a). A clear correlation (r = 0.84, p < 0.01) was found between PM10 concentrations obtained by the station measurement and our device, showing consistency between measurements.
The same APS also measured PM levels indoors, as described in Methods. The average indoor PM10 mass was 1.3 µg m−3 (standard deviation (SD) = 1.6 µg m−3): 31.7 times lower than the average outdoor PM10 level. The average indoor PM2.5 mass concentration was 1.2 µg m−3 (SD = 1.4 µg m−3): 9.2× lower than the average outdoor PM2.5 concentration (Figure 4b). Strong and significant correlations between PM10 and PM2.5 in indoor air and those in outdoor air were observed (r = 0.78 and r = 0.81, respectively (p < 0.01)). During the smoke event, the highest indoor PM10 and PM2.5 concentrations were 6.5 µg m−3 and 5.7 µg m−3, respectively; these levels were 3% and 9% of the respective PM concentrations outdoors.
After applying aethalometer and wave-depended models to both indoor and outdoor air data, eBC levels were compared (Figure 5). Outside the event days, eBC mass concentration from fossil fuels origin (eBCff) was dominating in both outdoor and indoor air (68% and 64%, respectively). These findings are consistent with our previous study of organic aerosol (OA) and eBC source apportionment in Vilnius outdoor air [38] which revealed that during the non-heating season, traffic-related OA contributed to the PM1 fraction by 10% and the contribution of eBCff to total eBC was dominant (up to 92%).
In the current study because of the smoke event, eBC mass concentration in both indoor and outdoor air increased twice. During the event days, the contribution of eBC from biomass burning (eBCbb) to the total BC increased by 22% and 20% (on an absolute scale) in outdoor and indoor air, respectively. A strong correlation between eBCbb and eBCff concentrations both indoors and outdoors was found (r = 0.96 and r = 0.86, respectively; p < 0.01 for both). When contributions of eBC in indoor and outdoor air were compared, eBCbb and eBCff were lower by 29.6% and 37.5%, respectively. These results demonstrate that no significant differences between filtering eBCbb and eBCff particles through the office air supply treatment were observed.
In addition to eBC, coloured organic carbon known as brown carbon (BrC) was evaluated in both indoor and outdoor air. The comparison of light absorption coefficients related to BrC and eBC (babs BrC and babs eBC, respectively) was in agreement with results from the aethalometer model study. Outside the smoke event, babs BC was dominant in both indoor and outdoor air (73% and 71%, respectively) while during the smoke event babs BrC contribution to total babs increased on average by 17% on an absolute scale. Due to the office air filtration system, babs BrC and babs eBC were reduced by 30% and 34%, respectively; there was a strong and significant correlation between babs BrC and babs eBC levels indoors and outdoors (r = 0.97 and r = 0.92, respectively; p < 0.01). Since difference of ratio between babs BrC and babs eBC levels indoors and outdoors was insignificant, we can conclude that office air supply treatment is not selective for different eBC or BrC particles either.
However, the removal of different eBC and BrC factions by the filtration system were lower compared to the removal of total PM10. In order to understand the reason behind this difference, we investigated particle number and mass removal efficiency as a function of their size, as described in the following paragraph.

3.3. Aerosol Size and Mass Distributions during Smoke and Non-Smoke Events

PND and PMD in indoor and outdoor air based on APS measurements are presented in Figure 6. In general, both size-normalized particle number concentration (PNC) and particle mass concentration (PMC) in indoor air were lower than in outdoor air, except for the smallest particles. During the non-event days, outdoors two local PNC peaks were observed: at 0.5 µm (8.2 cm−3) and at 2.1 µm (1.7 cm−3). Byčenkiene et al. (2014) [39] observed that the submicron particle mode in Vilnius was related to local urban pollution (traffic, biomass burning and other primary particles). Therefore, it is likely that the smaller particle mode could be associated with local urban environment sources. In indoor air during non-event days only one peak of smaller particles (around 0.5 µm, 6.7 cm−3) was present. In addition, most of the particles (99.6%) observed in indoor air during non-event days were smaller than 2.5 µm. The correlation between hourly number concentrations of fine particles (0.5 µm < Da < 2.5 µm) in indoor and outdoor air was r = 0.99 (p < 0.01) indicating a significant influence of outdoor pollutants on the indoor air quality. The same correlation for coarse particles (2.5 µm < D < 10 µm) was slightly lower (r = 0.85, p < 0.01) proving that a part of the bigger particles were removed by the filtering system more efficiently.
During the smoke event days a substantial increase in the number concentration of larger particles was observed in both indoor and outdoor air. During the event days, the highest PNC was observed at 2.1 µm (21.9 cm−3) and 1.0 µm (2.5 cm−3) in outdoor and indoor air, respectively. In indoor air, particle size ranged up to 3.5 µm while the majority of particles (95.6%) remained smaller than 2.5 µm. During the event days, a correlation between hourly number concentrations of fine particles (0.5 µm < Da < 2.5 µm) in indoor and outdoor air (r = 0.59, p < 0.01) was lower than during non-event days. A moderate correlation (r = 0.70, p < 0.01) was observed for coarse particles (2.5 µm < Da < 10 µm) indoors and outdoors.
Thus, a substantial increase in coarse particle number concentration was observed in both outdoor and indoor air and the increase was associated with the smoke event. In addition, large particles were more efficiently removed from indoor air, and PNC in indoor air was dominated by fine particles. Furthermore, these results suggests that coarse particles originating from a long-range smoke transport event were more efficiently removed by the filtration system.
In addition to PSD, PMD was also analyzed for entire measurement campaign. As can be seen in Figure 6d–f, the size-normalized mass concentration in indoor air was significantly lower than in outdoor air. During non-event days two local peaks in PMD were observed in both indoor and outdoor air. In the case of outdoor air, the highest mass concentration was attributed to 3.5–3.8 µm size particles (14.7 µg m−3). Another, yet substantially smaller, peak was observed at 0.6 µm (0.7 µg m−3). The peak at 0.6 µm (0.6 µg m−3) was evident in indoor air as well. This confirms a tendency observed via PNC analysis: pollution by fine particles is not efficiently removed by the filtering system. A second peak in PMD indoors was observed at 1.8 µm (0.5 µg m−3)—a lower size and mass concentration value compared to outdoors.
During non-event days a strong correlation between PM2.5 in indoor and outdoor air was observed (r = 0.98, p < 0.01). Likewise, PM10 time series was compared and slightly weaker correlation was identified (r = 0.91, p < 0.01). During the smoke event, a significant increase in mass concentration was observed in both indoor and outdoor air, attributable to coarse particles. In outdoor air, a PMD peak was observed at 3.5 µm (218.1 µg m−3). In indoor air, a peak of PMD remained at 1.8–2.0 µm (3.7 µg m−3). Correlation between time series of PM2.5 in indoor and outdoor air was lower (r = 0.78, p < 0.01) during smoke event days. A similar correlation was observed for PM10 time series as well (r = 0.76, p < 0.01). Thus, an evident increase of mass concentration associated with bigger particles in indoor and outdoor air was related to the smoke event. Both PND and PMD analysis identified bigger particles as smoke event-related pollutants which were still present in indoor air.
We also analyzed the number and mass concentrations of fine (0.5 µm < Da < 2.5 µm) and coarse (2.5 µm < Da < 10 µm) particles during the event and non-event days indoors and outdoors (Figure 7). In outdoor air during smoke event days, PM10 and PM2.5 mass concentrations were on average 9.3 and 6.9 times higher compared to non-event days. The same ratios were significantly lower in indoor air (3.9 and 3.3 for PM10 and PM2.5, respectively). Thus, the smoke event had a much weaker effect on indoor air than on outdoor air.
Comparison of particle number concentration during the smoke event and non-event days revealed that the highest difference caused by smoke event in indoor and outdoor air was observed for coarse particles. In outdoor and indoor air coarse particle number concentration increased 10.2× and 14.0×, respectively. The same ratios of event versus non-event days for fine particles were substantially lower (2.0 and 0.9 for outdoor and indoor air, respectively). This shows that because of long-range transport smoke particles were mainly bigger, therefore it did not result in significant changes in smaller particle fraction.

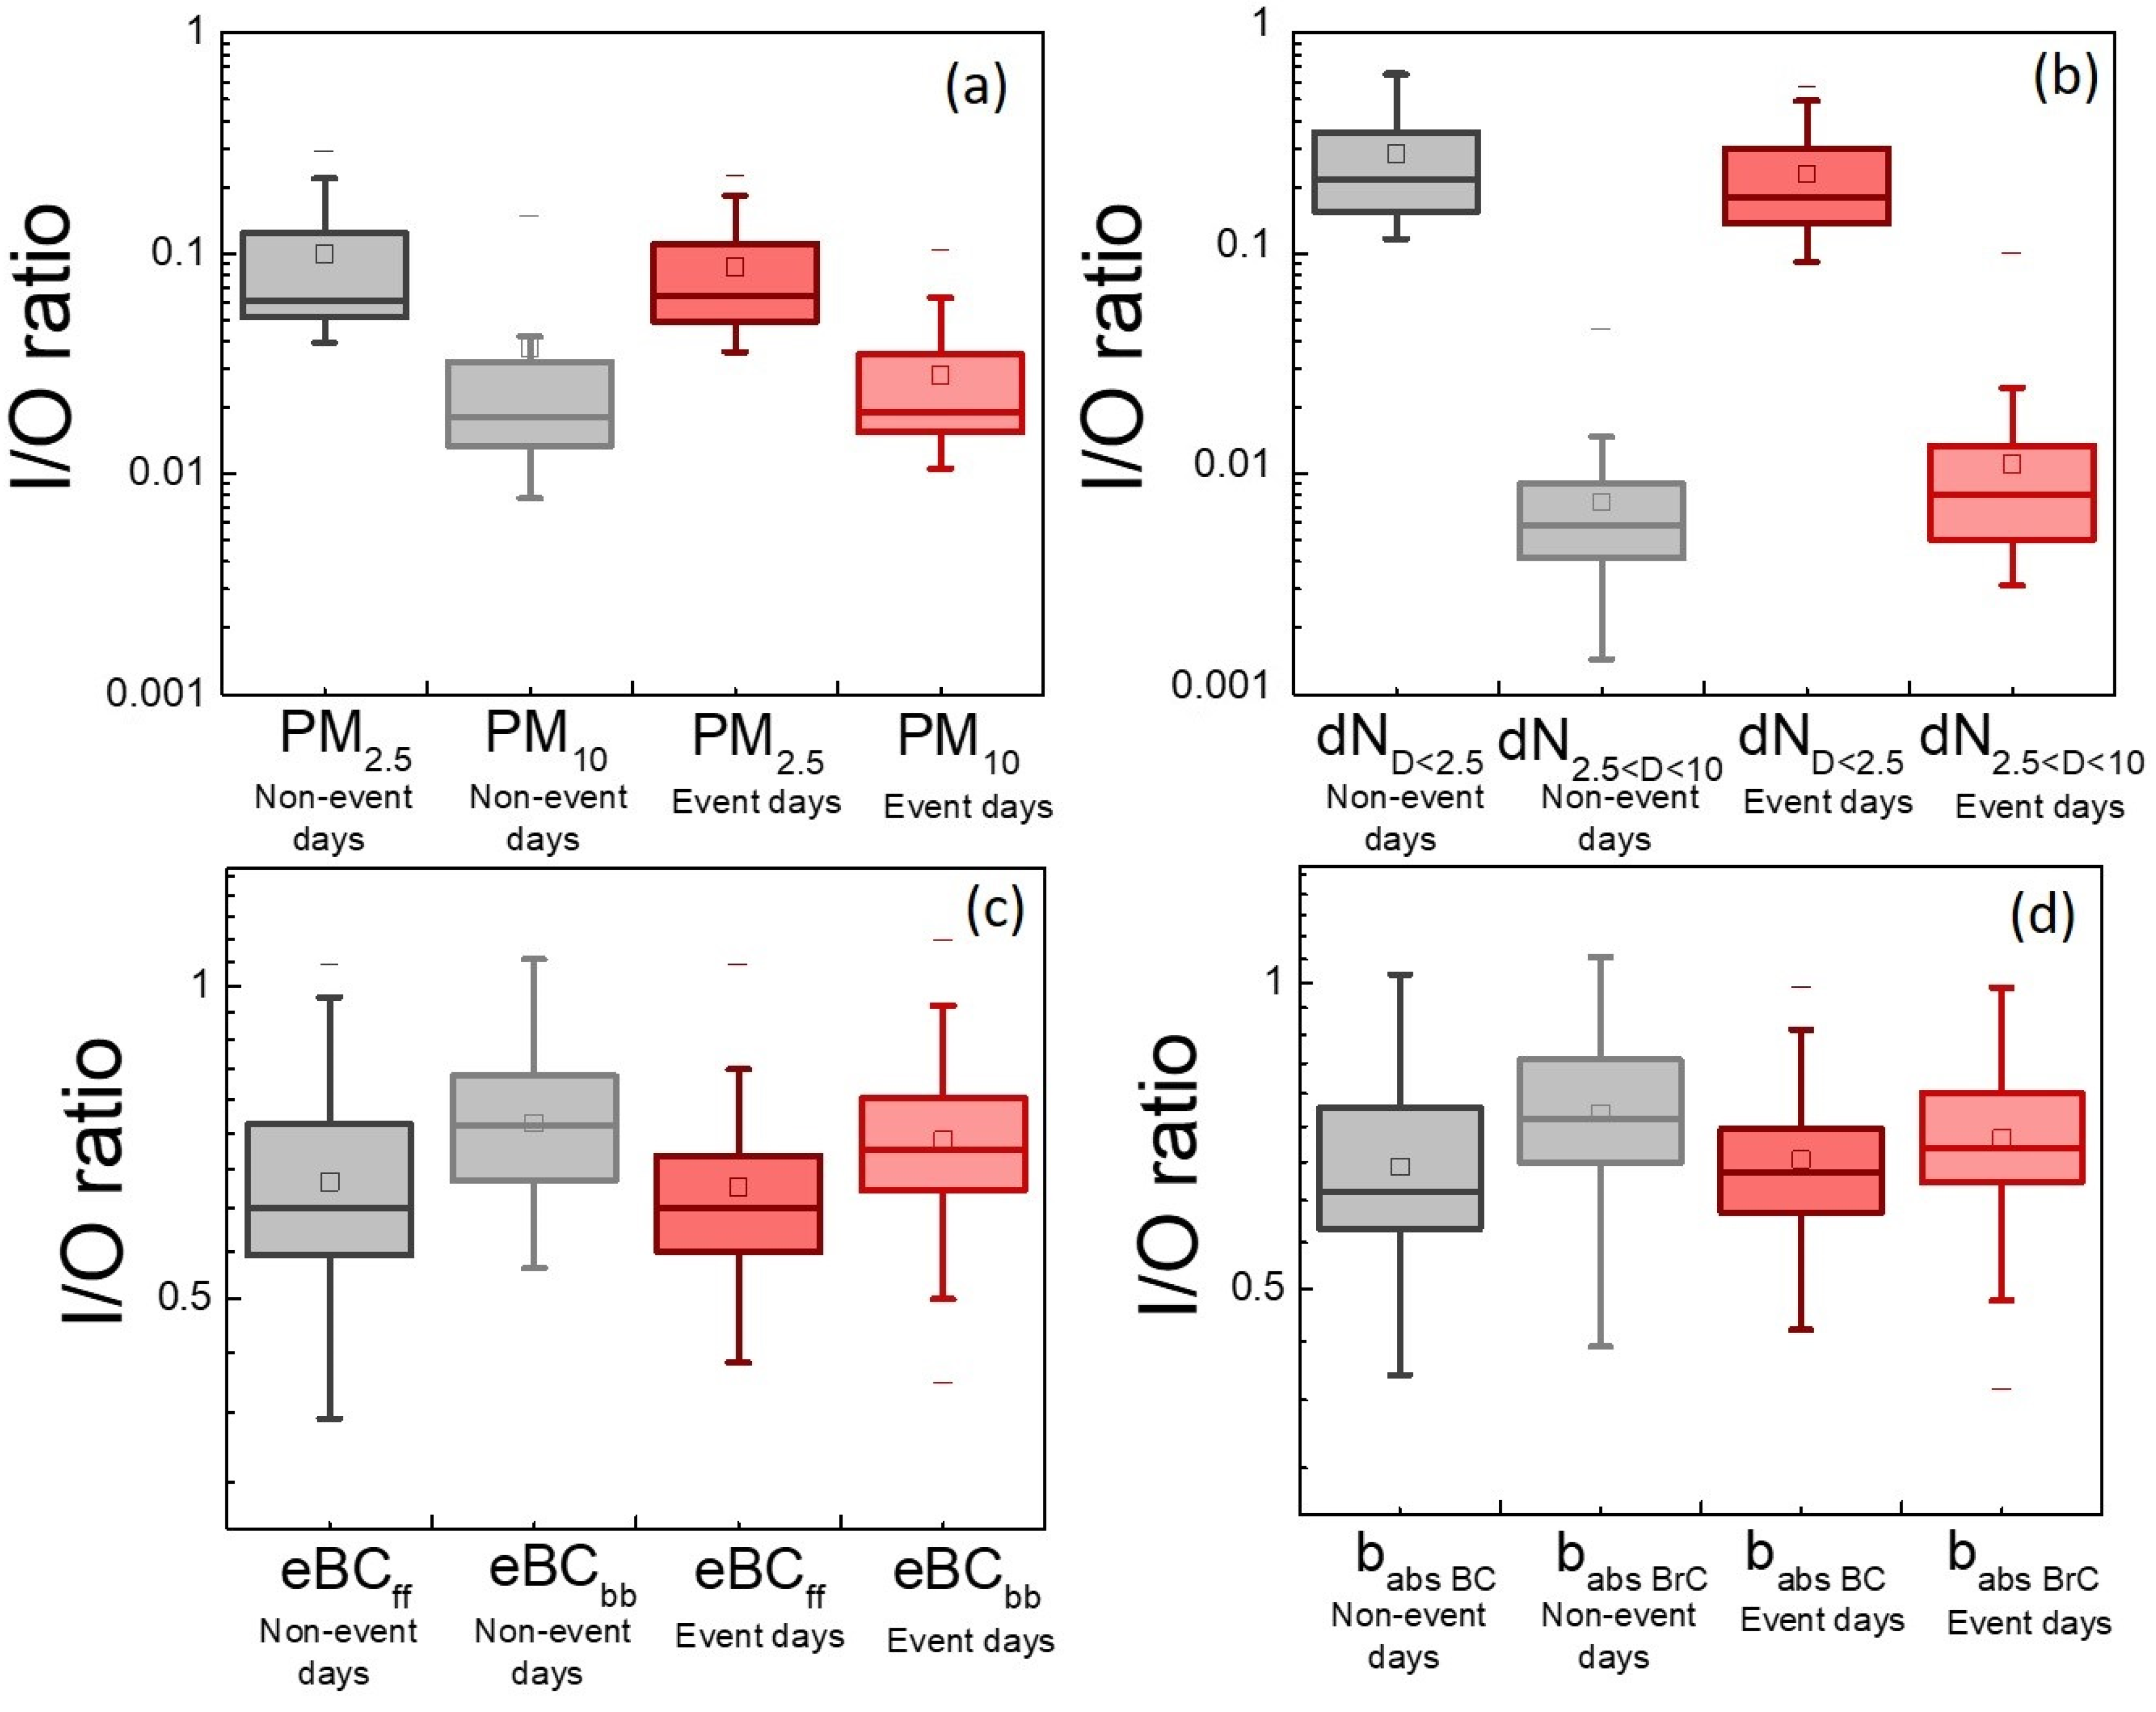
3.4. Patterns of Outdoor Pollutant Penetration into Indoor Air

In order to better evaluate the contribution of outdoor pollution to indoor air pollution, the indoor/outdoor (I/O) ratios were evaluated for all above analyzed parameters during event and non-event days (Figure 8). The I/O below 1 indicates removal of pollutants by the filtration system, while I/O = 1 shows that all outdoor pollutants reached indoor air. I/O ratios for PM2.5, PM10, PNCs of fine and coarse particles were assessed separately for non-event and event days. The average of I/O ratios for PM2.5 were very similar during non-event and event days (0.10 and 0.09, respectively), while I/O ratios for PM10 were lower (0.04 and 0.03 for non-event and event days, respectively), indicating 3× more efficient removal of the larger particles by the filtration system. The higher efficiency of larger particle removal was more evident in I/O for particle number concentrations (Figure 8b). While the difference in I/O between event and non-event days was not significant, a substantial differences in I/O for particle number concentrations of bigger and smaller particles were observed. For fine particles, the I/O ratio of 0.01 indicated a great removal efficiency. This I/O ratio however, increased up to 0.23–0.28 (on average for non-event and event days, respectively).
An evident difference between I/O for small and bigger particles exposes a major flaw of the filtering system: it is designed to remove bigger particles rather than the small ones. As a result, particles less harmful for human health are being stopped from penetrating indoor air while the more harmful ones are just partially removed by filters. In addition, removal rate decreases with decreasing particle size leading I/O ratio of particles Da = 0.5 µm on average to be 0.72.
I/O of eBC and BrC were compared and are depicted in Figure 8c,d. Whereas I/O ratio did not significantly varied between event and non-event days, slight differences appeared within eBC species and BrC. I/O ratio on average was higher for eBCbb (0.73 and 0.71 during non-event and event days, respectively) than for eBCff (0.64 for both periods). Meanwhile babs BrC showed somewhat higher I/O ratio (0.75 and 0.70 during non-event and event days, respectively) than babs eBC (0.67 for both periods). On average, all eBC and BrC related I/O ratios were significantly higher than for PM2.5. Because I/O ratios of both babs eBC and babs BrC were very similar, the reason for higher I/O could not be related to aerosol chemical composition. Therefore, the size of eBC should be considered. Eriksson et al. (2017) [40] showed that fresh traffic dominated BC plumes were up to 1 µm size with the peak at 0.4–0.5 µm. Another study conducted by Ning et al. (2013) [41] estimated that eBC mass distribution from fresh diesel emissions show a mode of about 0.2 µm but due to both internal and external mixing of soot particles an increase in size occurred quickly upon release to the atmosphere. In addition, Cheng et al. (2018) [42] observed that fresh eBC from biomass burning plumes was characterized by particles around 0.2 µm. Therefore, the higher I/O ratio observed for eBC was likely caused by lower removal rate of smaller particles. As a result, more eBC reached indoor air and skewed PM2.5 chemical composition. As can be seen in Figure 9, while eBC contributed from 4% to 10% (during event and non-event days, respectively) of the total PM2.5 mass concentration in outdoor air, eBC fraction in indoor PM2.5 was much higher (31% and 33% during non-event and event days, respectively). The smoke event caused an increase in eBCbb contribution to total PM2.5 mass concentration by 8% in indoor air. Thus, eBC from local pollution and long-range transport smoke affects indoor air quality. Therefore, because of negative health effects of eBC, an improved filtration system should be considered for office buildings. In addition, the importance of eBC to indoor air quality was not observed via PM2.5 mass concentration measurements. This suggests that in order to ensure higher quality of indoor air, eBC mass concentration should be monitored separately.

4. Conclusions

The present study focuses on the ratio of particle number concentration and mass concentration in office indoor air during days with long-range transport wildfire smoke present. The office, in which indoor air-quality experiment was conducted, was equipped with a F7–F9 air filtering system commonly used in offices. No office equipment or human activity was present in the office, thus the possible impact of internal sources was minimal. During the campaign an intensive pollution episode was recorded, which was associated with long-range transport of smoke from wildfires located in Ukraine. During this time outdoor PM10 mass concentration increased up to 253 µg m−3 (hourly average). Increase in PM10 (by 3.9 times) and PM2.5 (by 3.3×) levels in indoor air was observed. The smoke event caused an increased level of biomass burning related eBCbb and babs BrC levels (by 21% and 17%, respectively) in both indoor and outdoor air but did not have a significant influence on I/O ratio of those parameters. The filtering system was non-selective for different eBC sources (biomass burning versus traffic) or chemical composition of carbonaceous particles (eBC versus brown carbon (BrC)). In addition, air filtering efficiency was found to be highly dependent on particle size. During smoke event days, a significant increase in bigger particles’ number concentration was observed in both indoor and outdoor air. In the same period, the highest PNC was observed at 2.1 µm and 1.0 µm size particles in outdoor and indoor air, respectively. While the difference of I/O between event and non-event days for observed parameters was not significant, a substantial difference between I/O of PNC of bigger and smaller particles was observed. Removal rate decreased with decreasing particles size leading the I/O ratio of particles Da = 0.5 µm on average to be 0.72. As a result, because of small size, eBC input to total PM2.5 increased from 4–10% (outdoor air) to 31–33% (indoor air). It is recommended that during smoke events upgrading of mechanical filtration system is necessary. Thus, mostly bigger particles were associated with long-range transport smoke pollution which were efficiently removed by the air filtering system. Because of size selectivity, different results could be expected because of pollution from nearby wildfires. In order to improve indoor air quality, a higher standard air filtering systems (such as HEPA filters) could be recommended for office buildings, which would provide a higher efficiency in BC and other submicron particles removal and, as a result, reduce related possible health impacts.

Supplementary Materials

Author Contributions

Conceptualization, S.B. and J.P.; Methodology, J.P. and V.D.; Validation, J.P. and A.M.; Formal Analysis, J.P., A.M.; Investigation, J.P.; Data Curation, V.D., A.M., J.P. and K.P.; Writing—Original Draft Preparation, J.P. and I.G.; Writing—Review and Editing, G.M., S.K. and J.O.; Visualization, J.P.; Supervision, S.B.; Project Administration, S.B.; Funding Acquisition, S.B. All authors have read and agreed to the published version of the manuscript.

Funding

This research was funded by a grant (No. S-MIP-20-28) from the Research Council of Lithuania.

Institutional Review Board Statement

Not applicable.

Informed Consent Statement

Not applicable.

Data Availability Statement

Not applicable.

Acknowledgments

The authors gratefully acknowledge the Environment Protection Agency in Lithuania for PM data provided.

Conflicts of Interest

The authors declare no conflict of interest.

References

  1. Kirchmeier-Young, M.C.; Gillett, N.P.; Zwiers, F.W.; Cannon, A.J.; Anslow, F.S. Attribution of the Influence of Human-Induced Climate Change on an Extreme Fire Season. Earth’s Future 2019, 7, 2–10. [Google Scholar] [CrossRef]
  2. Kirchmeier-Young, M.C.; Zwiers, F.W.; Gillett, N.P.; Cannon, A.J. Attributing extreme fire risk in Western Canada to human emissions. Clim. Chang. 2017, 144, 365–379. [Google Scholar] [CrossRef] [Green Version]
  3. Stevens-Rumann, C.S.; Kemp, K.B.; Higuera, P.E.; Harvey, B.J.; Rother, M.T.; Donato, D.C.; Morgan, P.; Veblen, T.T. Evidence for declining forest resilience to wildfires under climate change. Ecol. Lett. 2018, 21, 243–252. [Google Scholar] [CrossRef] [PubMed]
  4. Goss, M.; Swain, D.L.; Abatzoglou, J.T.; Sarhadi, A.; Kolden, C.A.; Williams, A.P.; Diffenbaugh, N.S. Climate change is increasing the likelihood of extreme autumn wildfire conditions across California. Environ. Res. Lett. 2020, 15, 094016. [Google Scholar] [CrossRef] [Green Version]
  5. Michetti, M.; Pinar, M. Forest Fires Across Italian Regions and Implications for Climate Change: A Panel Data Analysis. Environ. Resour. Econ. 2019, 72, 207–246. [Google Scholar] [CrossRef] [Green Version]
  6. Knorr, W.; Dentener, F.; Lamarque, J.-F.; Jiang, L.; Arneth, A. Wildfire air pollution hazard during the 21st century. Atmos. Chem. Phys. 2017, 17, 9223–9236. [Google Scholar] [CrossRef] [Green Version]
  7. Zhou, S.; Collier, S.; Jaffe, D.A.; Briggs, N.L.; Hee, J.; Sedlacek, A.J., III; Kleinman, L.; Onasch, T.B.; Zhang, Q. Regional influence of wildfires on aerosol chemistry in the western US and insights into atmospheric aging of biomass burning organic aerosol. Atmos. Chem. Phys. 2017, 17, 2477–2493. [Google Scholar] [CrossRef] [Green Version]
  8. McClure, C.D.; Jaffe, D.A. US particulate matter air quality improves except in wildfire-prone areas. Proc. Natl. Acad. Sci. USA 2018, 115, 7901–7906. [Google Scholar] [CrossRef] [Green Version]
  9. Gunsch, M.J.; May, N.W.; Wen, M.; Bottenus, C.L.H.; Gardner, D.J.; VanReken, T.M.; Bertman, S.B.; Hopke, P.K.; Ault, A.P.; Pratt, K.A. Ubiquitous influence of wildfire emissions and secondary organic aerosol on summertime atmospheric aerosol in the forested Great Lakes region. Atmos. Chem. Phys. 2018, 18, 3701–3715. [Google Scholar] [CrossRef] [Green Version]
  10. Liu, J.C.; Mickley, L.J.; Sulprizio, M.P.; Dominici, F.; Yue, X.; Ebisu, K.; Anderson, G.B.; Khan, R.F.A.; Bravo, M.A.; Bell, M.L. Particulate air pollution from wildfires in the Western US under climate change. Clim. Chang. 2016, 138, 655–666. [Google Scholar] [CrossRef] [Green Version]
  11. Lepeule, J.; Laden, F.; Dockery, D.; Schwartz, J. Chronic exposure to fine particles and mortality: An extended follow-up of the Harvard six cities study from 1974 to 2009. Environ. Health Perspect. 2012, 120, 965–970. [Google Scholar] [CrossRef]
  12. Pope, C.A., III; Burnett, R.T.; Thun, M.J.; Calle, E.E.; Krewski, D.; Thurston, G.D. To Fine Particulate Air Pollution. J. Am. Med. Assoc. 2002, 287, 1132–1141. [Google Scholar] [CrossRef] [Green Version]
  13. Manigrasso, M.; Costabile, F.; Liberto, L.D.; Gobbi, G.P.; Gualtieri, M.; Zanini, G.; Avino, P. Size resolved aerosol respiratory doses in a Mediterranean urban area: From PM10 to ultrafine particles. Environ. Int. 2020, 141, 105714. [Google Scholar] [CrossRef]
  14. Janssen, N.A.H.; Hoek, G.; Simic-Lawson, M.; Fischer, P.; van Bree, L.; ten Brink, H.; Keuken, M.; Atkinson, R.W.; Anderson, H.R.; Brunekreef, B.; et al. Black Carbon as an Additional Indicator of the Adverse Health Effects of Airborne Particles Compared with PM 10 and PM 2.5. Environ. Health Perspect. 2011, 119, 1691–1699. [Google Scholar] [CrossRef] [Green Version]
  15. Boniardi, L.; Dons, E.; Longhi, F.; Scuffi, C.; Campo, L.; Van Poppel, M.; Int Panis, L.; Fustinoni, S. Personal exposure to equivalent black carbon in children in Milan, Italy: Time-activity patterns and predictors by season. Environ. Pollut. 2021, 274, 116530. [Google Scholar] [CrossRef]
  16. Pani, S.K.; Wang, S.H.; Lin, N.H.; Chantara, S.; Lee, C.T.; Thepnuan, D. Black carbon over an urban atmosphere in northern peninsular Southeast Asia: Characteristics, source apportionment, and associated health risks. Environ. Pollut. 2020, 259, 113871. [Google Scholar] [CrossRef]
  17. Lin, W.; Dai, J.; Liu, R.; Zhai, Y.; Yue, D.; Hu, Q. Integrated assessment of health risk and climate effects of black carbon in the Pearl River Delta region, China. Environ. Res. 2019, 176, 108522. [Google Scholar] [CrossRef] [PubMed]
  18. Li, Y.; Henze, D.K.; Jack, D.; Henderson, B.H.; Kinney, P.L. Assessing public health burden associated with exposure to ambient black carbon in the United States. Sci. Total Environ. 2016, 539, 515–525. [Google Scholar] [CrossRef] [Green Version]
  19. Sandradewi, J.; Prévôt, A.S.H.; Weingartner, E.; Schmidhauser, R.; Gysel, M.; Baltensperger, U. A study of wood burning and traffic aerosols in an Alpine valley using a multi-wavelength Aethalometer. Atmos. Environ. 2008, 42, 101–112. [Google Scholar] [CrossRef]
  20. Reid, J.S.; Hyer, E.J.; Prins, E.M.; Westphal, D.L.; Zhang, J.; Wang, J.; Christopher, S.A.; Curtis, C.A.; Schmidt, C.C.; Eleuterio, D.P.; et al. Global monitoring and forecasting of biomass-burning smoke: Description of and lessons from the fire Locating and Modeling of Burning Emissions (FLAMBE) program. IEEE J. Sel. Top. Appl. Earth Obs. Remote Sens. 2009, 2, 144–162. [Google Scholar] [CrossRef]
  21. Leech, J.A.; Nelson, W.C.; Burnett, R.T.; Aaron, S.; Raizenne, M.E. It’s about time: A comparison of Canadian and American time-activity patterns. J. Expo. Anal. Environ. Epidemiol. 2002, 12, 427–432. [Google Scholar] [CrossRef] [Green Version]
  22. Luo, Z.; Zhang, L.; Li, G.; Du, W.; Chen, Y.; Cheng, H.; Tao, S.; Shen, G. Evaluating co-emissions into indoor and outdoor air of EC, OC, and BC from in-home biomass burning. Atmos. Res. 2021, 248, 105247. [Google Scholar] [CrossRef]
  23. Omelekhina, Y.; Eriksson, A.; Canonaco, F.; Prevot, A.S.H.; Nilsson, P.; Isaxon, C.; Pagels, J.; Wierzbicka, A. Cooking and electronic cigarettes leading to large differences between indoor and outdoor particle composition and concentration measured by aerosol mass spectrometry. Environ. Sci. Process. Impacts 2020, 22, 1382–1396. [Google Scholar] [CrossRef] [PubMed]
  24. Prasauskas, T.; Martuzevicius, D.; Kalamees, T.; Kuusk, K.; Leivo, V.; Haverinen-Shaughnessy, U. Effects of Energy Retrofits on Indoor Air Quality in Three Northern European Countries. Energy Procedia 2016, 96, 253–259. [Google Scholar] [CrossRef] [Green Version]
  25. Szigeti, T.; Dunster, C.; Cattaneo, A.; Spinazzè, A.; Mandin, C.; Le Ponner, E.; de Oliveira Fernandes, E.; Ventura, G.; Saraga, D.E.; Sakellaris, I.A.; et al. Spatial and temporal variation of particulate matter characteristics within office buildings—The OFFICAIR study. Sci. Total Environ. 2017, 587, 59–67. [Google Scholar] [CrossRef]
  26. Chatoutsidou, S.E.; Ondráček, J.; Tesar, O.; Tørseth, K.; Ždímal, V.; Lazaridis, M. Indoor/outdoor particulate matter number and mass concentration in modern offices. Build. Environ. 2015, 92, 462–474. [Google Scholar] [CrossRef] [Green Version]
  27. Hassanvand, M.S.; Naddafi, K.; Faridi, S.; Arhami, M.; Nabizadeh, R.; Sowlat, M.H.; Pourpak, Z.; Rastkari, N.; Momeniha, F.; Kashani, H.; et al. Indoor/outdoor relationships of PM10, PM2.5, and PM1 mass concentrations and their water-soluble ions in a retirement home and a school dormitory. Atmos. Environ. 2014, 82, 375–382. [Google Scholar] [CrossRef]
  28. Custódio, D.; Pinho, I.; Cerqueira, M.; Nunes, T.; Pio, C. Indoor and outdoor suspended particulate matter and associated carbonaceous species at residential homes in northwestern Portugal. Sci. Total Environ. 2014, 473, 72–76. [Google Scholar] [CrossRef]
  29. Azimi, P.; Zhao, D.; Stephens, B. Estimates of HVAC filtration efficiency for fine and ultrafine particles of outdoor origin. Atmos. Environ. 2014, 98, 337–346. [Google Scholar] [CrossRef]
  30. Stephens, B.; Siegel, J.A. Penetration of ambient submicron particles into single-family residences and associations with building characteristics. Indoor Air 2012, 22, 501–513. [Google Scholar] [CrossRef]
  31. Fisk, W.J.; Faulkner, D.; Sullivan, D.; Mendell, M.J. Particle Concentrations and Sizes with Normal and High Efficiency Air Filtration in a Sealed Air-Conditioned Office Building. Aerosol Sci. Technol. 2000, 32, 527–544. [Google Scholar] [CrossRef]
  32. Happo, M.S.; Sippula, O.; Jalava, P.I.; Rintala, H.; Leskinen, A.; Komppula, M.; Kuuspalo, K.; Mikkonen, S.; Lehtinen, K.; Jokiniemi, J.; et al. Role of microbial and chemical composition in toxicological properties of indoor and outdoor air particulate matter. Part. Fibre Toxicol. 2014, 11, 60. [Google Scholar] [CrossRef] [Green Version]
  33. Zee, S.C.; Strak, M.; Dijkema, M.B.A.; Brunekreef, B.; Janssen, N.A.H. The impact of particle filtration on indoor air quality in a classroom near a highway. Indoor Air 2017, 27, 291–302. [Google Scholar] [CrossRef]
  34. Cox, J.; Isiugo, K.; Ryan, P.; Grinshpun, S.A.; Yermakov, M.; Desmond, C.; Jandarov, R.; Vesper, S.; Ross, J.; Chillrud, S.; et al. Effectiveness of a portable air cleaner in removing aerosol particles in homes close to highways. Indoor Air 2018, 28, 818–827. [Google Scholar] [CrossRef] [PubMed]
  35. Cuesta-Mosquera, A.; Močnik, G.; Drinovec, L.; Müller, T.; Pfeifer, S.; Minguillón, M.C.; Björn, B.; Buckley, P.; Dudoitis, V.; Fernández-García, J.; et al. Intercomparison and characterization of 23 Aethalometers under laboratory and ambient air conditions: Procedures and unit-to-unit variabilities. Atmos. Meas. Tech. Discuss. 2021, 14, 3195–3216. [Google Scholar] [CrossRef]
  36. Pfeifer, S.; Müller, T.; Weinhold, K.; Zikova, N.; Martins dos Santos, S.; Marinoni, A.; Bischof, O.F.; Kykal, C.; Ries, L.; Meinhardt, F.; et al. Intercomparison of 15 aerodynamic particle size spectrometers (APS 3321): Uncertainties in particle sizing and number size distribution. Atmos. Meas. Tech. 2016, 9, 1545–1551. [Google Scholar] [CrossRef] [Green Version]
  37. Cappa, C.D.; Kolesar, K.R.; Zhang, X.; Atkinson, D.B.; Pekour, M.S.; Zaveri, R.A.; Zelenyuk, A.; Zhang, Q. Understanding the optical properties of ambient sub- and supermicron particulate matter: Results from the CARES 2010 field study in northern California. Atmos. Chem. Phys. 2016, 16, 6511–6535. [Google Scholar] [CrossRef] [Green Version]
  38. Pauraite, J.; Plauškaitė, K.; Dudoitis, V.; Ulevicius, V. Relationship between the Optical Properties and Chemical Composition of Urban Aerosol Particles in Lithuania. Adv. Meteorol. 2018, 2018, 1–10. [Google Scholar] [CrossRef] [Green Version]
  39. Byčenkiene, S.; Plauškaite, K.; Dudoitis, V.; Ulevicius, V. Urban background levels of particle number concentration and sources in Vilnius, Lithuania. Atmos. Res. 2014, 143, 279–292. [Google Scholar] [CrossRef]
  40. Eriksson, A.C.; Wittbom, C.; Roldin, P.; Sporre, M.; Öström, E.; Nilsson, P.; Martinsson, J.; Rissler, J.; Nordin, E.Z.; Svenningsson, B.; et al. Diesel soot aging in urban plumes within hours under cold dark and humid conditions. Sci. Rep. 2017, 7, 1–10. [Google Scholar] [CrossRef] [PubMed]
  41. Ning, Z.; Chan, K.L.; Wong, K.C.; Westerdahl, D.; Močnik, G.; Zhou, J.H.; Cheung, C.S. Black carbon mass size distributions of diesel exhaust and urban aerosols measured using differential mobility analyzer in tandem with Aethalometer. Atmos. Environ. 2013, 80, 31–40. [Google Scholar] [CrossRef]
  42. Cheng, Y.; Li, S.M.; Gordon, M.; Liu, P. Size distribution and coating thickness of black carbon from the Canadian oil sands operations. Atmos. Chem. Phys. 2018, 18, 2653–2667. [Google Scholar] [CrossRef] [Green Version]
Figure 1. Atmospheric conditions during smoke event days.
Atmosphere 12 01047 g001
Figure 2. A Fire Information for Resource Management System (FIRMS) fire maps (a), air mass backward trajectory (c) and aerosol satellite measurements of smoke (b) and dust (d) over Europe. In each graph a pin shows location of Vilnius.
Atmosphere 12 01047 g002
Figure 3. AAE and SAE space divided into segments based on Cappa et al. (2016). Blue dots represent non-event days, while red dots show data points during smoke event.
Atmosphere 12 01047 g003
Figure 4. Particulate matter (PM) mass concentration of PM10 and PM2.5 in indoor (a) and outdoor (b) air.
Atmosphere 12 01047 g004
Figure 5. Time series of eBCff and eBCbb mass concentrations in outdoor (a) and indoor (c) air. Time series and contributions of babs BrC and babs eBC to total babs in outdoor (b) and indoor (d) air. The pink and yellow areas mark the smoke event. Pie charts represent contributions of each parameter during non-event and event days.
Atmosphere 12 01047 g005
Figure 6. Particle number size distribution in outdoor (a) and indoor (b) air together with their averages for the event and non-event days (c). Particle mass-weighted size distribution in outdoor (d) and indoor (e) air together with their averages for the event and non-event days (f).
Atmosphere 12 01047 g006
Figure 7. Box charts of PM10 (a), PM2.5 (b), particle number concentration of coarse particles (dN2.5<D<10) (c) and particle number concentration of fine particles (dND<2.5) (d) during event and non-event days in indoor and outdoor air.
Atmosphere 12 01047 g007
Figure 8. Box charts of indoor/outdoor (I/O) ratios of PM2.5 and PM10 (a), particle number concentration of big (dN2.5<D<10) and smaller particles (dND<2.5) (b), eBCff and eBCbb (c), babs eBC and babs BrC (d) during event and non-event days in indoor and outdoor air.
Atmosphere 12 01047 g008
Figure 9. Pie charts of PM2.5 chemical composition during non-event days in outdoor (a) and indoor (c) air and during event days in outdoor (b) and indoor (d) air.
Atmosphere 12 01047 g009
Publisher’s Note: MDPI stays neutral with regard to jurisdictional claims in published maps and institutional affiliations.

