Article

Assessment of COVID-19 Lockdown Impact on the Air Quality in Eastern Spain: PM and BTX in Urban, Suburban and Rural Sites Exposed to Different Emissions

EUPHORE Laboratories, Fundación Centro de Estudios Ambientales del Mediterráneo (CEAM), Avda. Charles R. Darwin, 14, Parque Tecnológico, 46980 Paterna, Spain
*
Author to whom correspondence should be addressed.
Submission received: 21 December 2021 / Revised: 30 December 2021 / Accepted: 1 January 2022 / Published: 8 January 2022

Abstract

:
In early 2020, the COVID-19 pandemic spread globally, and severe measures to control it were implemented. This study investigates the impact of the lockdown on the air quality of three provinces in the Valencia region, eastern Spain, in the years 2015–2020, focusing on particulate matter (PM). A thorough statistical analysis using different approaches is conducted. Hourly patterns are also assessed. In addition, the role of meteorological parameters on PM is explored. The results indicate an overall PM10 reduction of 16.5% when comparing the lockdown in 2020 and the 2015–2019 period, while PM2.5 increased by 3.1%. As expected, urban zones experienced higher reductions than suburban zones, which experienced a PM concentration increase. The impact of the drastic drops of benzene, toluene and xylene (77.4%, 58.0% and 61.8%, respectively) on the PM values observed in urban sites is discussed. Our study provides insights on the effect of activity changes over a wide region covering a variety of air quality stations, urban, suburban and rural, and different emission types. The results of this work are a valuable reference and suggest the need for considering different factors when establishing scientific air pollution control strategies.

1. Introduction

Negative effects of atmospheric particulate matter (PM) pollution on health have been assessed in a large number of studies. Typically, PM10 and/or PM2.5 (PM finer than 10 and 2.5 µm, respectively) data are used in epidemiological studies to evaluate the effect of the PM pollution on human health. PM causes respiratory and pulmonary diseases [1,2] and also affects the cardiovascular system [3,4].
Despite successful legislation implemented in Europe to reduce air pollutants emissions, the World Health Organization (WHO) [5] estimated that the exposure to PM2.5 particles caused nearly seven million people deaths, mainly related to respiratory system illnesses. Urban population was exposed to high levels of PM10 in 2018 [6]: 15% above EU standards and 48% above WHO air quality guideline value. Equally, the urban population exposure to PM2.5 concentrations above standards were 4% and 74%, respectively.
The sources of particulate matter are very varied, and their relevance depends on the environment. According to their origin, they can be distinguished between anthropogenic: road traffic, industrial activities, biomass burning and domestic heating, and natural: resuspension and transport of by wind, volcanic eruptions, seismic activity, specific events such as Saharan dust intrusions, particularly relevant in the western Mediterranean [7,8].
Volatile organic compounds (VOCs) constitute another large group of air pollutants, which include a mixture of hundreds of species with a well-known harmful effect on human health [9,10] and on the environment, due to their implication on the production of secondary pollutants such as tropospheric ozone and secondary organic aerosol [11,12,13]. Among them, benzene, toluene and xylene (BTX) are the most common traffic-related monoaromatic hydrocarbons in urban environments [14,15]. The continuous measurement of VOCs is essential to estimate population exposure to hazardous gases and implement effective control strategies.
The COVID-19 pandemic that began at the end of 2019 continues to spread globally today, having so far caused millions of deaths around the world, and the situation remains very serious. Spain was one of the countries hardest hit by the pandemic in the first half of 2020. At the end of March 2020, confirmed SARS-CoV-2 cases in Spain made it the most affected country worldwide. On 11 March 2020, the WHO declared a global pandemic of COVID-19. Following this, on 14 March 2020, the Spanish government, aiming to contain the pandemic spread, announced the implementation of a series of drastic measures. These included a lockdown, traffic restrictions, cancellation of national and international flights and the cease of every nonessential activity. These measures came into force on 15 March for two months, until 17 May, to curb the spread of infection by limiting people’s movement, helping to maintain “social distancing”. The measures were gradually lifted until activity returned to normal. By this point, the world had 6,234,322 confirmed cases of COVID-19 and 375,541 deaths [16].
The prevention and control measures mentioned above resulted in a diminution of anthropogenic activity and therefore were closely related to the air quality. The unprecedented mobility and economy activity reduction measures implemented in response to COVID-19 posed a unique opportunity to better understand the impact of natural versus anthropogenic causes of air pollution, which will help to draft policies aimed at improving the air quality. Within this framework, a number of studies have explored the impact of lockdown on air quality. Rodriguez-Urrego et al. [17] reported an average PM2.5 decrease of 12.5% over the 50 most polluted capital cities worldwide, although a discrete reduction of only 5% was observed in European cities under study versus 22% on the American continent and 16% on the Asian continent. Most of the cities experienced a reduction during the COVID-19 lockdown, although a non-negligible figure of 14 out of the 50 cities reported an increase of PM2.5, part of which was attributed to an isolated effect produced by winds or fires. The reason for the results for other cities, such as Paris, with an increase of nearly 30%, was not evident in the study.
Nitrogen dioxide (NO2), nitrogen oxide (NO), PM2.5 and PM10 concentrations were reduced in many countries and locales around the world during the COVID-19 lockdown. However, this was not always the case for PM. For instance, in southern and in central China, in situ measurements indicated a decrease of PM2.5 (10% to 60%) [18], while increases were found in the north and east in a study using satellite data and models [19]. In that study, the PM2.5 increase was also attributed to the higher relative humidity and to the increased oxidation capacity of the atmosphere. Zhang et al. [20] and Mao et al. [21] also suggested that complex aerosol chemistry and meteorological influence are the reasons for this PM increase.
Traffic is a major source of primary aerosols. It contributes to the formation of secondary aerosols through the emission of SO2, VOCs and NOx, which are precursors of aerosols. For this reason, the increase in aerosols despite the dramatic limitation in the traffic activity is, to date, not well understood. Reduction in NOx emissions is known to result in enhanced ozone concentration due to reduced titration [12]. Shen et al. [22] found similar percentage decreases in urban and background sites in the Po Valley for NO2 and NO (above 41% and 59%, respectively). They also found benzene and toluene concentration reductions of 33 and 37%, respectively, while they reported only slight changes in PM2.5 and PM10. Ciarelli et al. [23] observed a mild increase in PM2.5 levels in a modeling study at the same sites investigated in the current study and in Swiss Plateau regions. They indicated that the ozone enhancement increased the overall oxidizing capacity of the atmosphere, i.e., OH· and NO3· radicals, which favored SOA formation. This lowered the overall levels of particulate pollution, which suggests that emission sources other than traffic and processes have an important impact on particulate number and mass concentration, and should be considered in control pollution strategies.
Sicard et al. [24] found overall reductions in PM2.5 and PM10 of 8% in urban stations of the European cities studied, which is a much smaller reduction than in Wuhan (~42%). The PM reduction due to the traffic and industrial activity limitation was, in part, caused by the PM emissions from indoor activities during lockdown in some cities. Variability in PM10 reduction was observed in [25], which studied 11 cities in Spain, with one AQC from each city, finding significant reductions in Barcelona, Valencia and Sevilla and no significant reduction in the remaining eight cities.
Several approaches have been used to evaluate the effect of lockdown on air quality, typically consisting of statistical studies comparing data from air quality cabins (AQCs) during the lockdown period with (a) the period before [26] and (b) the same period in previous years [24,27]. The same methods have been used based on satellite observations rather than AQCs [28]. On the other hand, meteorology has a significant role in controlling PM levels [29]. The processes of formation, removal and dispersion are influenced by meteorological parameters such as temperature, radiation, relative humidity, precipitation, wind speed and direction. This has led to numerous studies exploring this correlation between meteorological variables and the behavior of different pollutants in order to get a better understanding of their effect on climate change [30]. Authors of these studies state that, while meteorology has a clearer correlation with pollutants such as ozone and NOx, its correlation with PM remains uncertain in many scenarios due to the large variety of PM components. Therefore, the closing of schools, industrial activities and businesses had a clear impact on activity levels and air pollutant emissions and air quality during the lockdown.
The aim of this study is to quantify the effect of the COVID-19 lockdown on air quality (PM and BTX) by considering the reference period of March–May of 2015–2019 using option (b) described in the previous paragraph and assessing the impact of meteorology. The lockdown affected urban sites as well as industrial and rural sites, whose activity was limited by direct legislative restrictions and by a general reduction in the demand of products and the slowdown of the economy. Therefore, and unlike most of the studies based on urban sites, this work has considered a network of AQCs, which includes cabins in different environments: urban, rural, suburban, exposed to traffic, industrial and background emissions. This allows us to compare and discuss the effect of lockdown on the air quality based on the site and type of emission.

2. Methodology

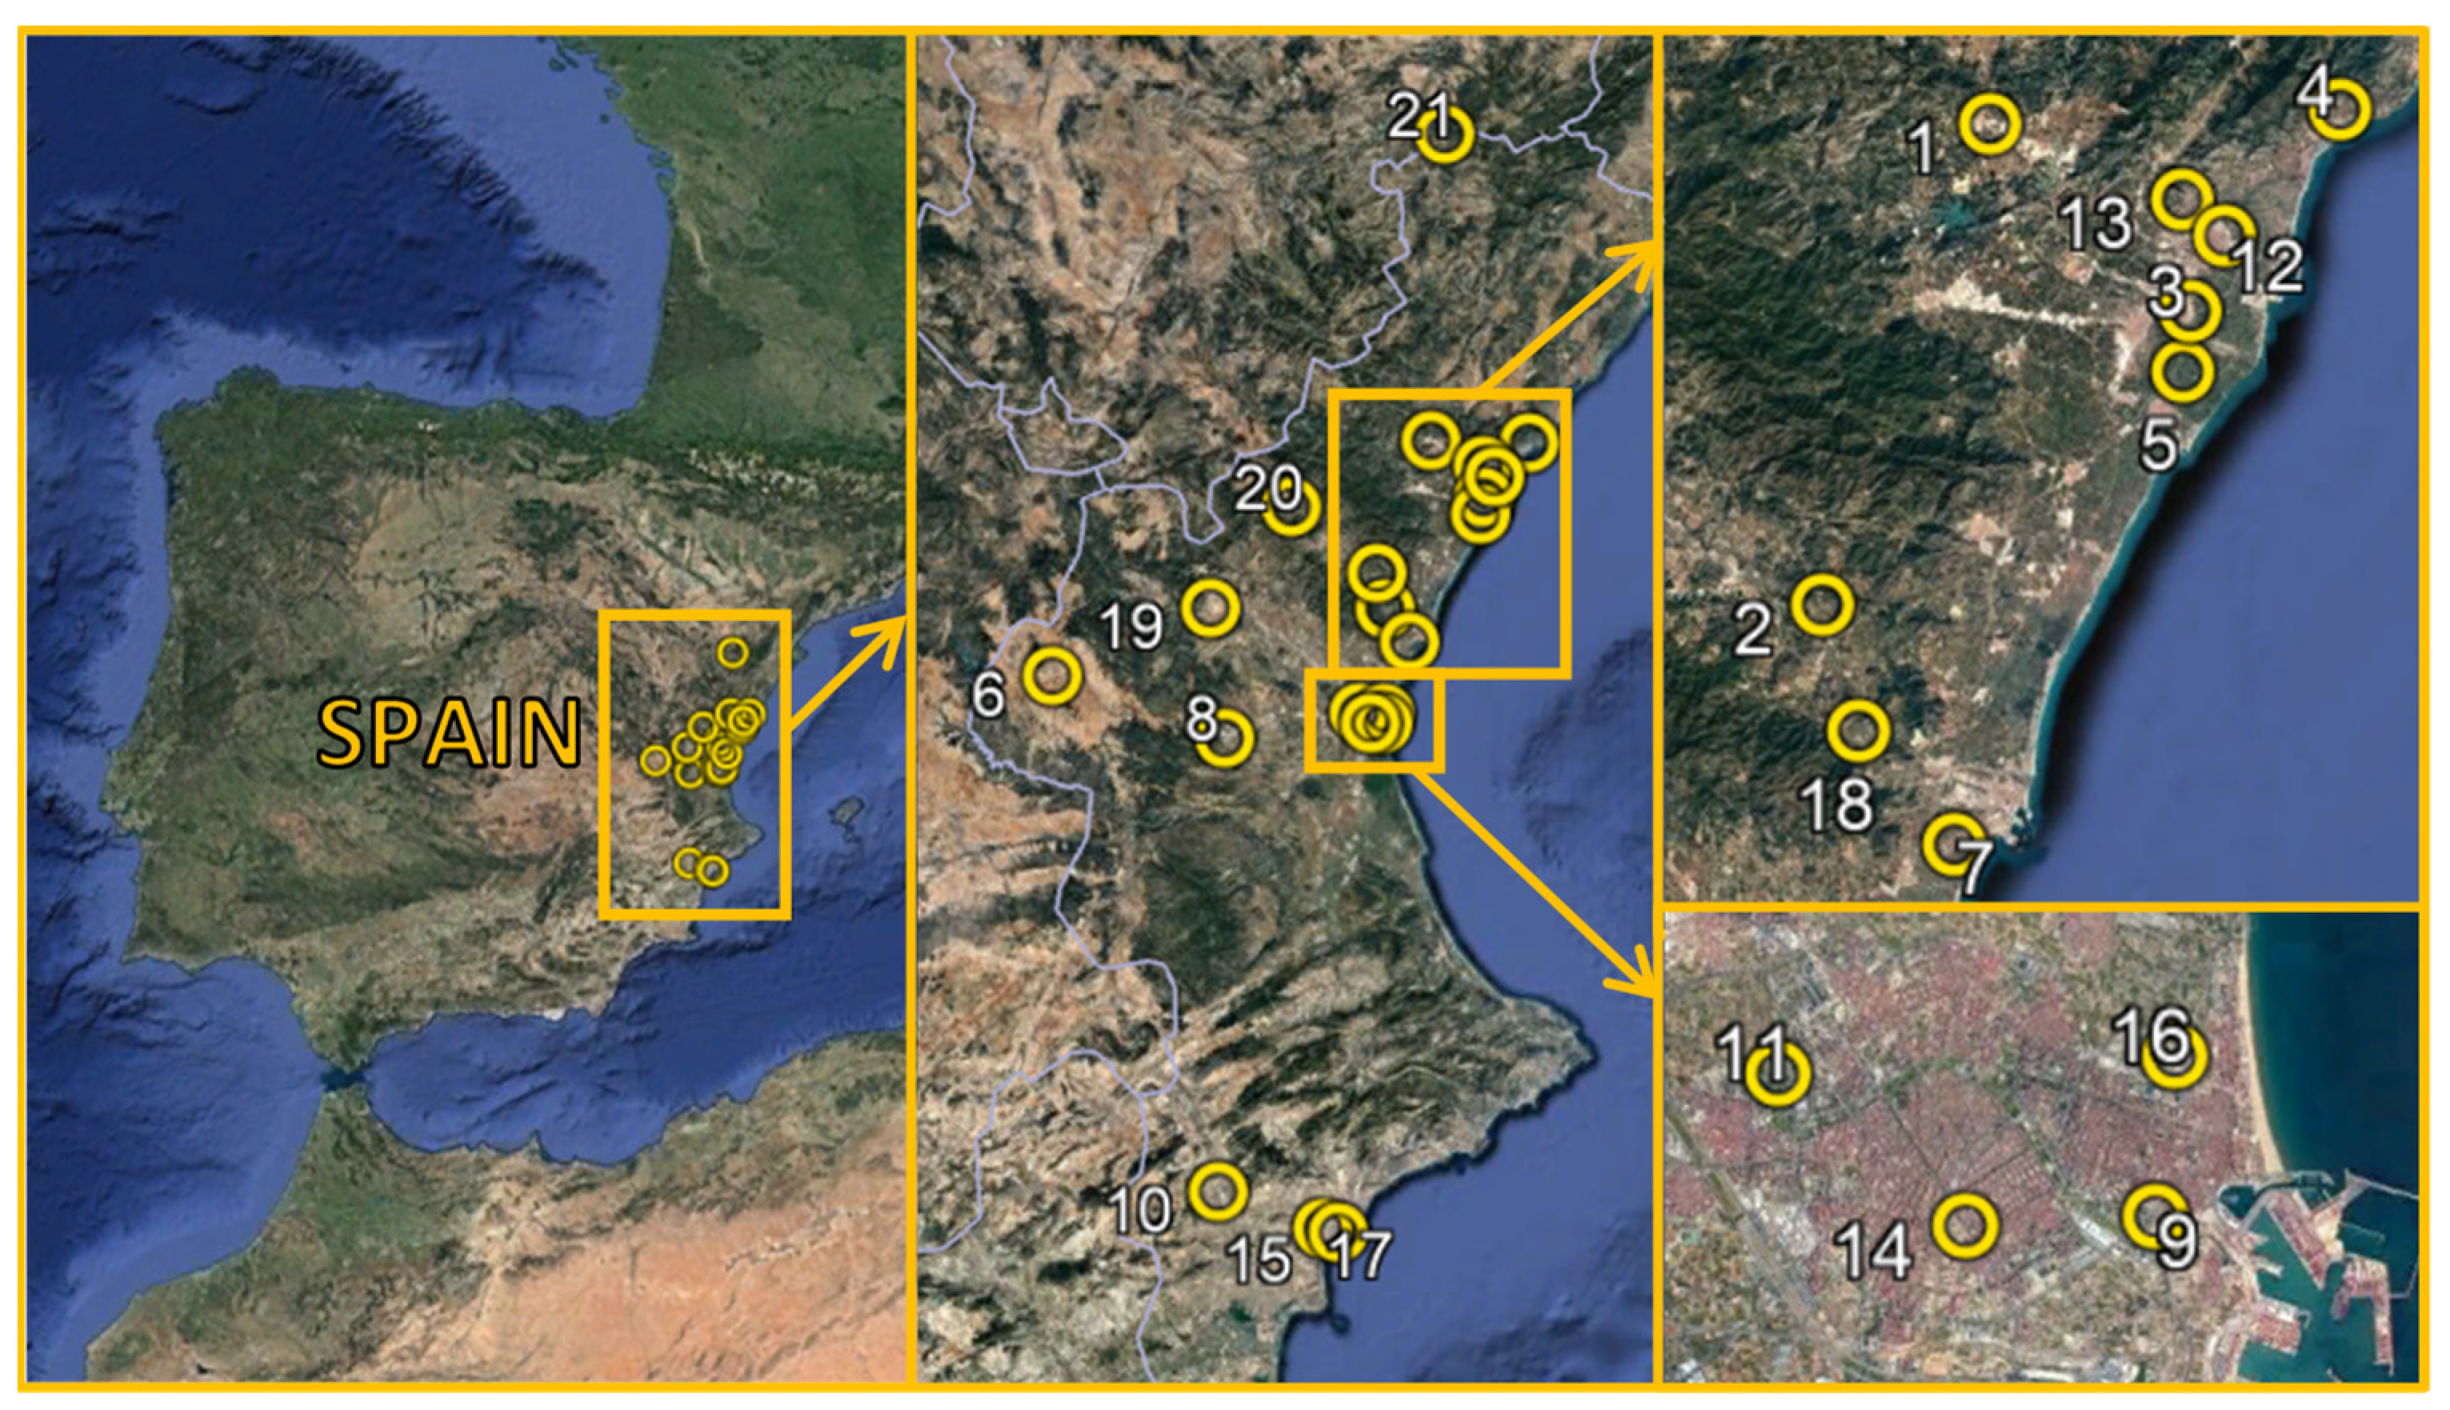
2.1. Data Sources and Study Area

The Valencia region is the fourth most populous autonomous community in Spain with more than 5 million inhabitants and a surface of nearly 25,000 km2, consisting of 3 provinces: Alicante, Castellón and Valencia. Valencia is the homonymous capital of the region and the third largest metropolitan area in the country, with 1,392,000 inhabitants and an area of nearly 400 km2. It is also the third largest city in Spain with more than 800,000 inhabitants over an area of nearly 135 km2. The region is at the east of the country by the Mediterranean coast, where there is very dense residential housing. Agriculture plays an important role in the economy of the region, but in recent decades there has been growth in the secondary sector with a strong industry, especially in Castellón, and in the tertiary sector; tourism is the region’s major industry.
The regional air quality network of the Valencia region comprises 60 air quality stations distributed through the territory of the aforementioned three provinces, with 47 of them measuring PM10 particles and 38 measuring PM2.5. In this study, the effect of lockdown due to COVID-19 on the air quality of the Valencia region was investigated by analyzing fine particulate matter (PM2.5), coarse particulate matter (PM10) and BTX. Since meteorological conditions affect the dispersion of contaminants and therefore their chemistry and removal [26,31], our study involved comparing data from the lockdown period with the same period in the years 2015–2019. The same season is compared to avoid large meteorological variability of winter to spring. Therefore, hourly and daily data from the lockdown period, i.e., from 15 March 2020 to 17 May 2020, were compared against the reference period, consisting of the same period in the years 2015 to 2019, representing the baseline conditions.
Hourly concentrations with >75% of validated data were used to calculate aggregated daily values according to legislation. For statistical purposes, 21 AQCs were selected that fulfilled the following criteria: (1) availability of spatial coverage to cover different types of emission sources, location, etc.; (2) at least four years of available data reporting, including 2020; and (3) representativeness of an area and known not to be affected by artificial external sources (e.g., installed in school yards and subject to resuspension of particles). Figure 1 shows the geographical location of the different sampling sites in the western Mediterranean area and Table S1 in the supplementary material summarizes the selected air quality stations used in this study indicating the type of environment (URB = urban, SUB = suburban and RUR = rural), type of emissions (TRA = traffic, IND = industrial, BK = background) and site (INN = inner, COA = coast). Together with particulate matter, meteorological parameters also collected by the air quality network were used in this study: temperature (TEMP), relative humidity (RH), radiation (RAD), rainfall (PLU), wind speed (WS) and wind direction (WD). Due to their role as precursors of particles, volatile organic compounds (BTX: benzene = C6H6, toluene = C7H8 and xylene = C8H10) were also considered.

2.2. Saharan Dust Outbreaks Identification

In order to isolate the effect of the reduction in anthropogenic activity during the lockdown period on aerosol concentrations, days with Saharan dust outbreaks (SDO) during the considered period (2015 to 2020) were removed from the database. The assessment of Saharan dust events that passed through the Mediterranean area during the study period was retrieved from a Spanish governmental database [32]. In this database, the identification of SDOs is carried out using dust forecast models (NAAPS, DREAM and SKIRON). Moreover, a back-trajectory analysis by HYSPLIT model [33,34] is used to confirm the north African origin of the air masses during the SDOs identified. Five-day back-trajectories ending at different points of the study region at 750, 1500 and 2500 m above ground level (a.g.l.) at 12:00 UTC are also provided for these days. This procedure is based on a methodology for the identification and quantification of the contribution of SDOs in Spain and Portugal [35].

2.3. Statistical Analysis

Different approaches were used to evaluate the effects of lockdown on airborne PM. An estimation of the changes between the two sets of series considered, the lockdown period in 2020 and the equivalent time period over the 5 previous years, was conducted, comparing the averages of PM concentrations. In addition, the variation of daily mean concentrations expressed as percentages [24,26] was calculated for each day of the year (DoY) according to Equation (1)
% V a r i a t i o n   = P M l o c k d o w n   P M r e f e r e n c e   P M r e f e r e n c e   · 100
where PMlockdown is the particle concentration in 2020 and PMreference is the particle concentration in the reference period (2015–2019). The deviation of daily mean concentrations expressed as percentages was also calculated for each day of the year (DoY) within the period under consideration. In order to ensure coherence when comparing both sets of data, given the fact that human activity is generally lower on weekends than on working days, the minimally required shift in days was introduced in the years 2015 to 2019 when comparing baseline data to the days of the same period in 2020. By using this approach, hourly data were also computed to assess the change of pattern between working days and weekends due to the effect of the lockdown.
Box plots were computed to graphically compare the variability of distributions for previous years with that for 2020. These box plots show a median of concentrations as central markers and the edges of the boxes correspond to the 25th and 75th percentiles, also called first quartile (Q1) and third quartile (Q3), respectively, being the interquartile range, IQR = Q3 − Q1, the length of the box. The lockdown effect was assessed by aggregating data from AQCs according to their typologies, i.e., considering the type of emissions they are exposed to and the type of environment in which they are installed. The latter was assessed by applying agglomerative hierarchical clustering analysis to the concentration data using the Pearson correlation coefficient (R) distance [36]. For a better classification and to consider all the variability among the AQCs, both PM2.5 and PM10 concentrations were used. The average was applied to compute the distance between clusters. The dendrogram, which graphically represents the cluster tree, is shown for easier interpretation [37]. Both box plots and clusters were computed using MATLAB® version 2019a [38,39].
Another question raised in this study is whether meteorological parameters affect PM concentrations. This was examined by calculating the corresponding Pearson’s correlation coefficient, R, between the PM concentration profiles and the HR, PLU, RAD, WIND and TEMP patterns. R varies between −1 < R < +1, with the signs + and − indicating positive and negative correlations, respectively. The associated p-values were also calculated to test the null hypothesis, when there is no relationship between the observed phenomena. P-values range from 0 to 1, where those close to 0 correspond to a significant correlation in R and a low probability of observing the null hypothesis. To test for statistical significance between groups, we used the same approach as in ref. [24], and we used the non-parametric Kruskal–Wallis test followed by a post hoc test using Fisher’s least significant difference and p-values adjusted with the Holm correction. A p-value < 0.05 was considered statistically significant and therefore as indicative of significant correlation.

3. Results and Discussion

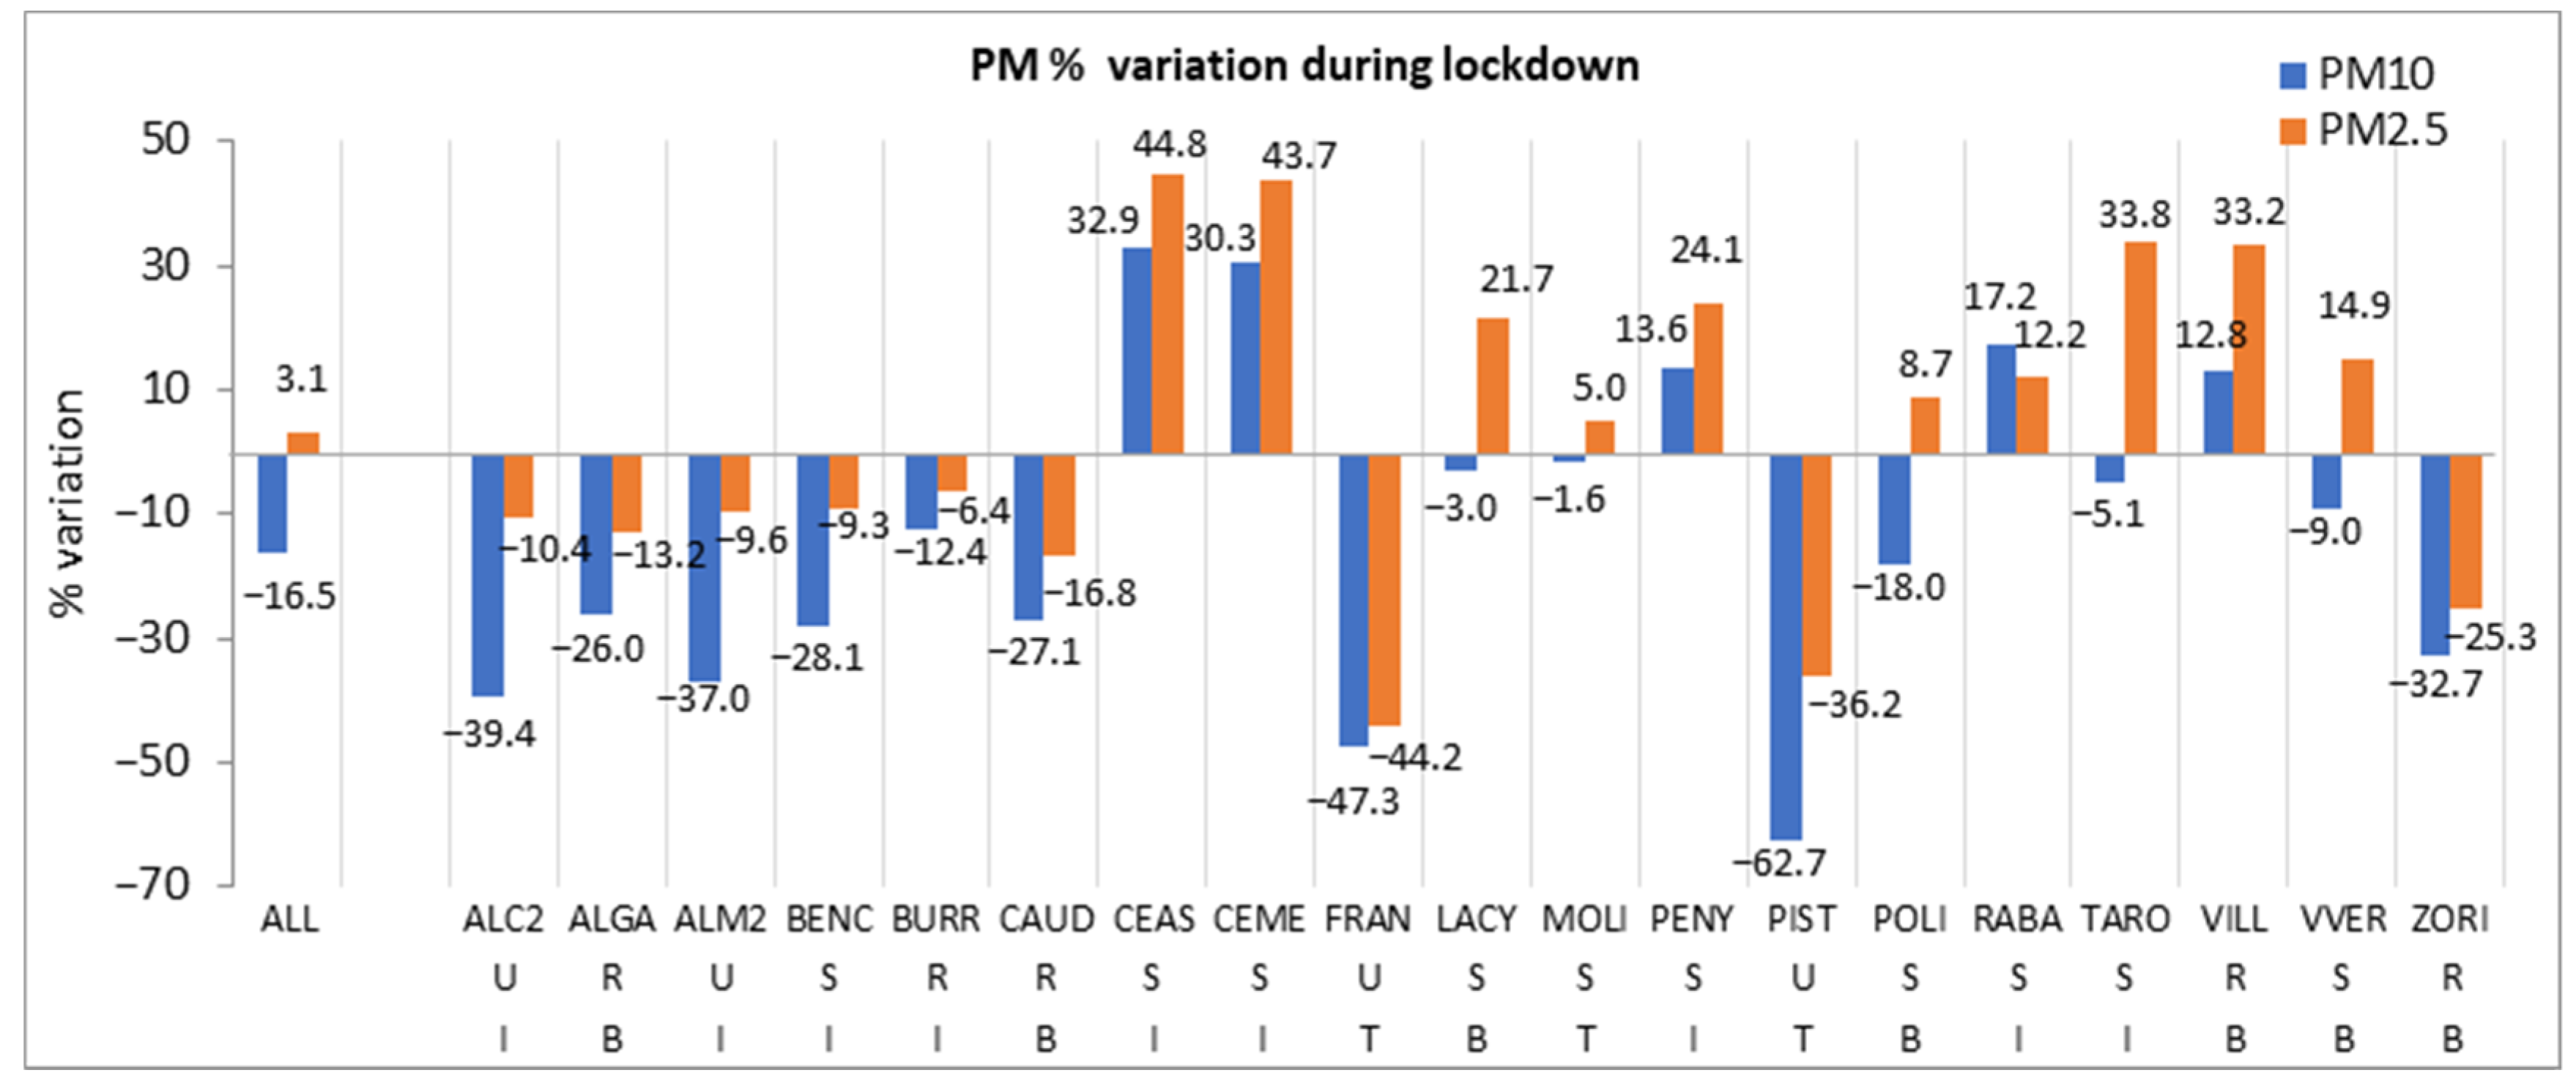
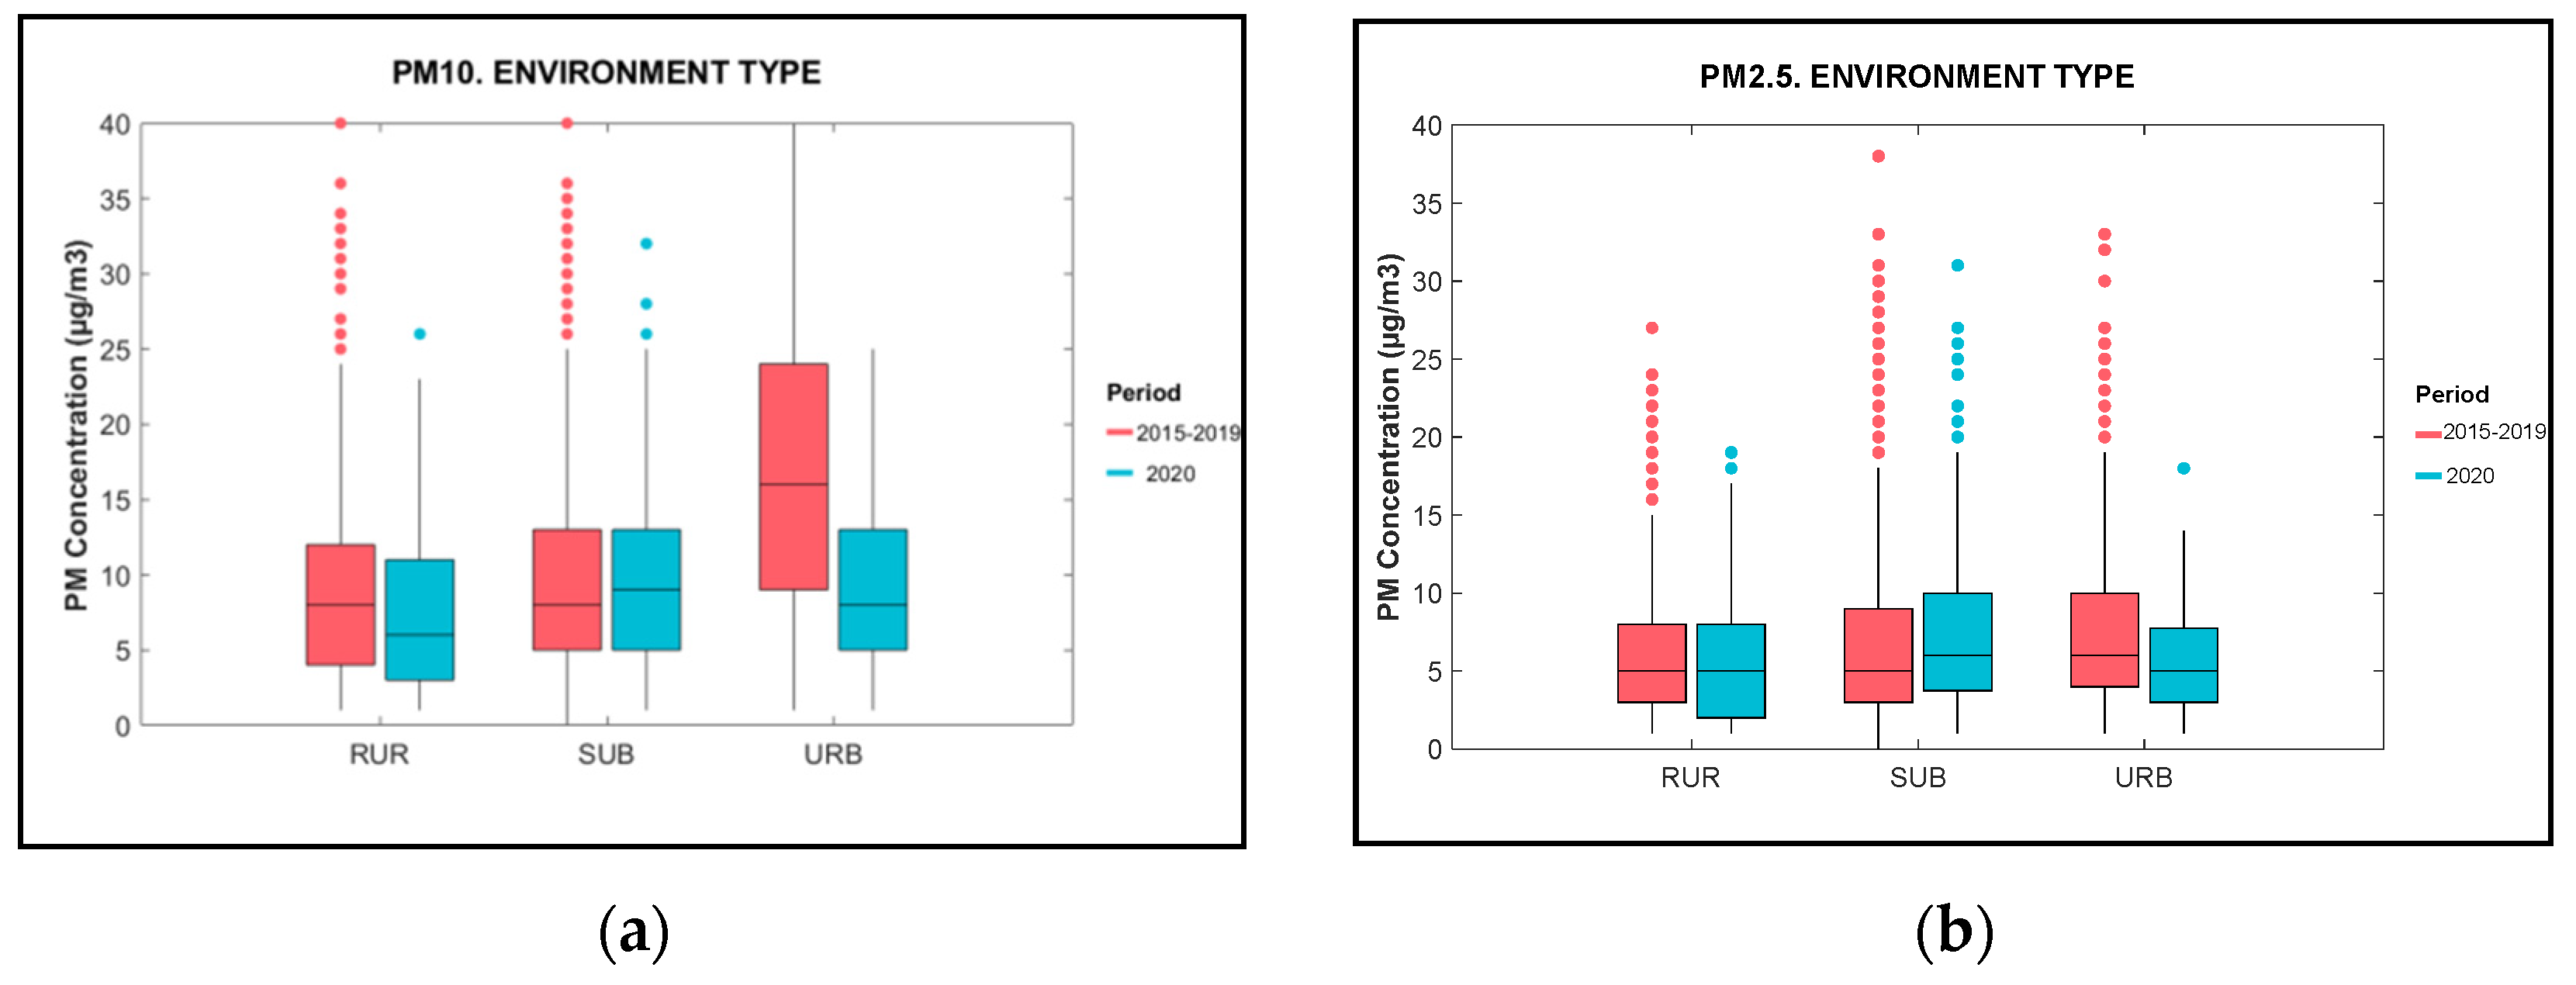
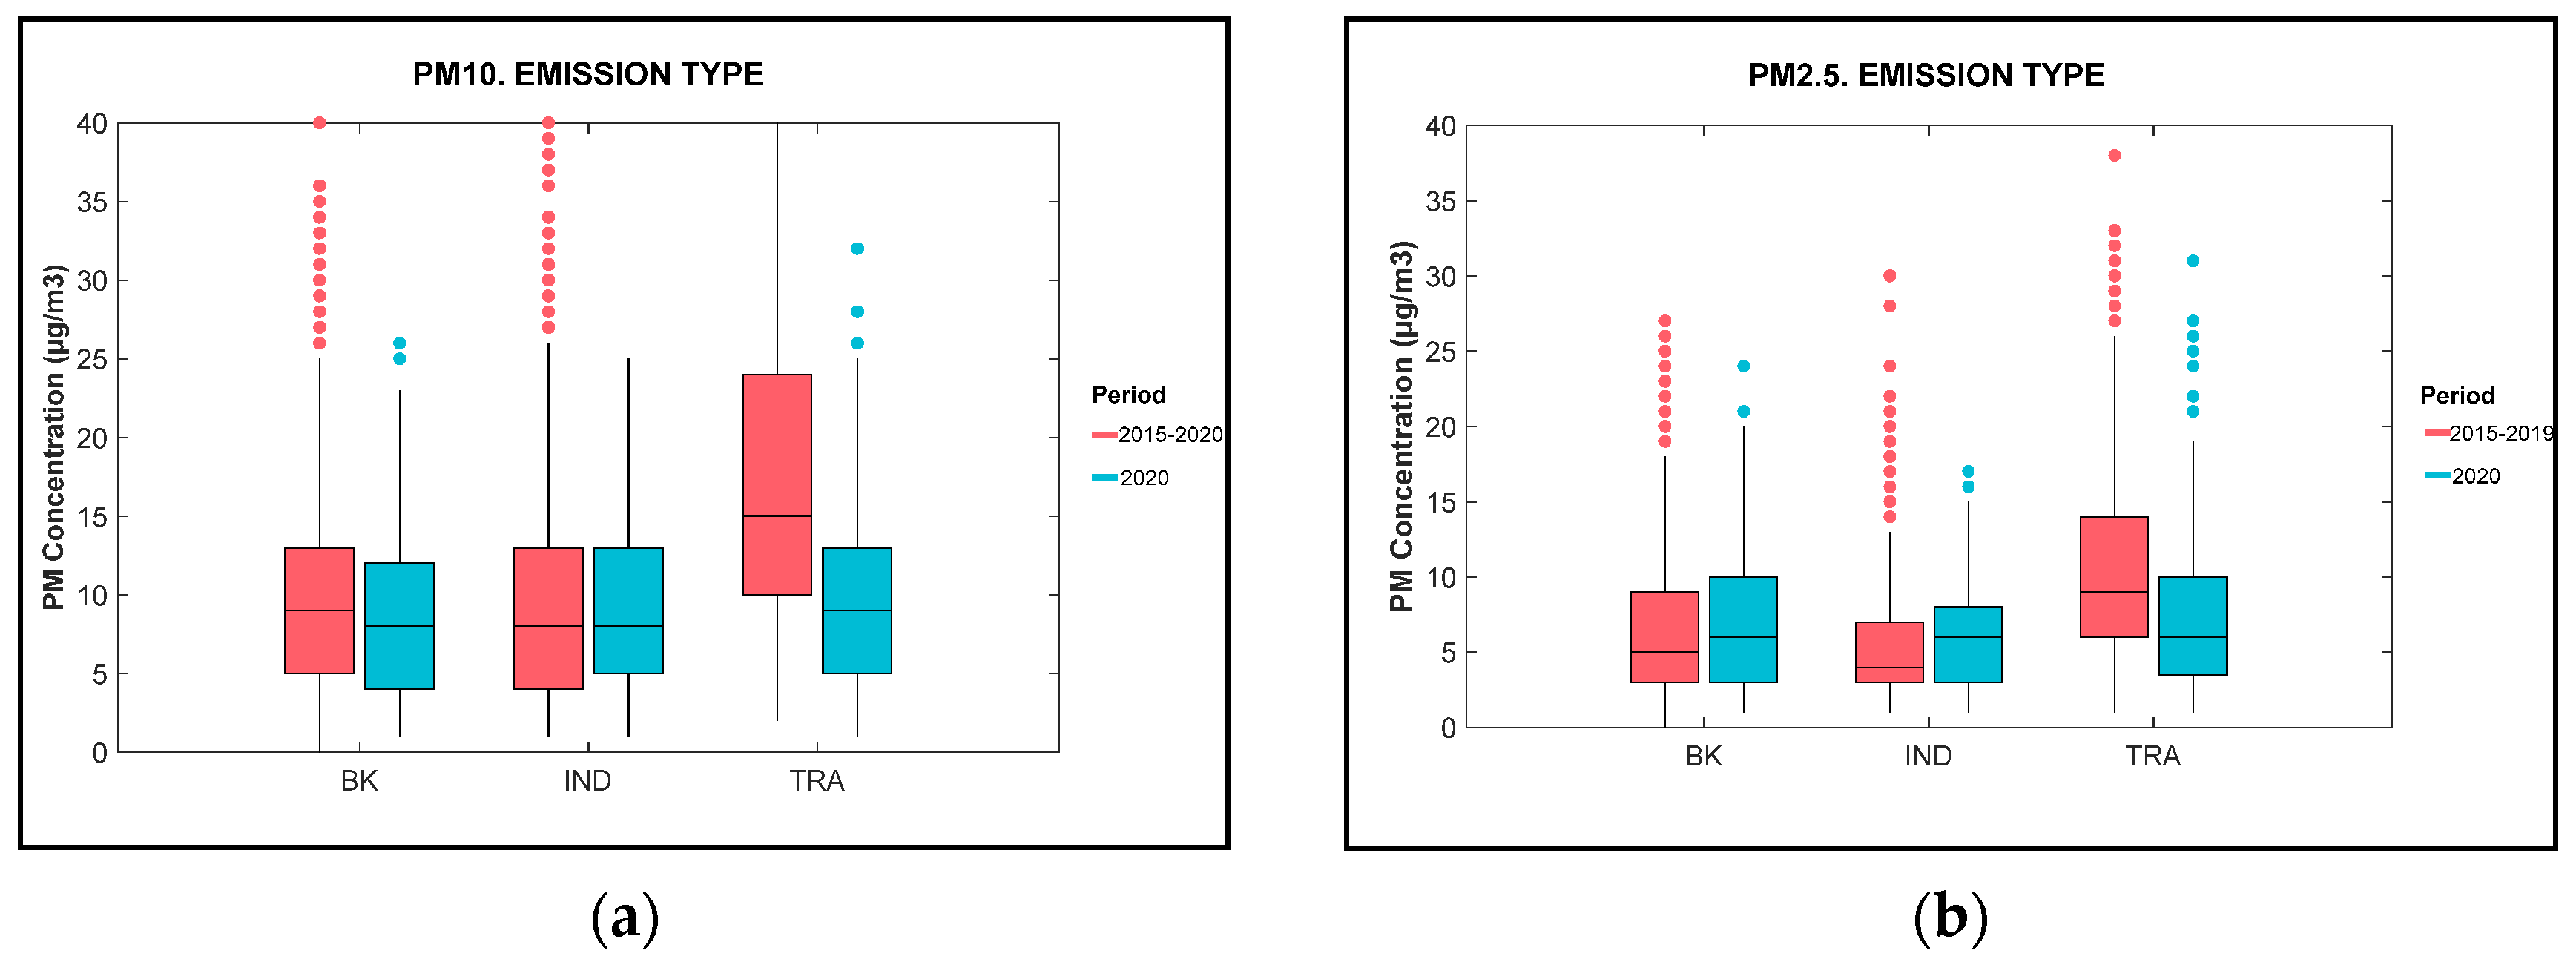
3.1. Particulate Concentration Variation

Average concentrations of particulate matter were calculated as a first step to compare concentrations during the lockdown with those of previous years. The results showed that mean PM10 concentration was lower during the lockdown (9.1 µg·m−3) than in the reference period (10.9 µg·m−3). Conversely, mean PM2.5 levels were slightly higher during lockdown (6.7 µg·m−3) compared to the lockdown reference period (6.5 µg·m−3). Figure 2 presents percentage variations of PM10 and PM2.5 for each station. A summary of statistics of PM10 and PM2.5 for each cabin for both reference and lockdown periods can be found in Tables S2 and S3 in the supplementary material. A general characterization of PM10, PM2.5 and BTX data sets, grouping all stations in this study, is shown in Table S4 in the supplementary material.
An overall relative decrease in PM concentration was observed during the lockdown period in 2020. In total, 14 of the 19 AQCs in this study recorded a reduction in PM10, ranging from 1.6 to 62.7%, with an overall reduction of 16.5%. Despite the fact the 9 AQCs experienced reductions varying from 6.4 to 44.2%, an overall increase in PM2.5 of 3.1% was found. A study limited to several environments in the city of Valencia [40] obtained similar results in two traffic stations common to this work (reductions of 56–53% and 60–41% in PM10–PM2.5 in the FRA and PIST stations, respectively). However, in comparison to our data, different PM percentage variations were found at other two common stations (reductions of 33–30% and 37–13% in PM10–PM2.5 at MOLI and POLI stations, respectively). A detailed review of the data explains that this difference is due to the fact that, unlike our study, Donzelli et al. [40] considered a reference period based only on 2019 data.
Similar values for PM10 (14% decrease) and PM2.5 (6% increase) were found in the United Kingdom [41]. The large fluctuation in PM2.5 variations in some European cities during lockdown has been reported in [17]. The largest reductions were found in cabins in urban sites and affected by traffic; in Valencia, reductions of 62.7% in PIST and 47.3% in FRAN for PM10 and 36.2% and 44.2% for PM2.5 were recorded. Urban AQCs exposed to industrial emissions reported deductions varying from 37.0% to 39.4% in PM10, although reductions in PM2.5 were less significant (10%). This is also observed in the box plots (Figure S1 in the supplementary material), where there is a notable variability in 2015–2019, but not in 2020. Conversely, CEAS and CEME, categorized as SUB and exposed to industrial emissions, presented increases of 32.9% and 30.3% for PM10 and 44.8% and 43.7% in PM2.5, showing higher ranges of variability and higher medians in 2020.
The variability of the particulate concentrations in the considered time periods along with the median is shown in the box plot in Figure S1a,b. The percentage reductions in PM10 and PM2.5 are supported by Figure S1, where the PM concentrations are presented in box plots, showing a general higher variability in PM10 for the reference than for the lockdown period. Nevertheless, the difference in the median values, 9.0 µg·m−3 for the reference and 8.0 µg·m−3 for the lockdown period, shows a smaller difference than the % of variation. Regarding PM2.5, less variability was found in PM2.5 concentrations between both sets of data, being the global median 5.0 µg·m−3 in the years 2015 to 2019 and 6.0 µg·m−3 in 2020. In general, suburban AQCs recorded an increase in PM2.5 and those which are both suburban and industrial recorded an increase in PM10.
Figure 3 shows PM percentage variations during lockdown compared to the reference period calculated for the whole study network and the different cabin groups considered using average observed PM concentrations (Table S5 in the supplementary material). According to the classification by type of environment, urban cabins showed the largest decrease in concentrations of both PM10 and PM2.5 during the lockdown period; their average concentrations decreased by 49.0% and 27.3%, respectively. Taking into account that SDO was removed from the database, these notable decreases in PM concentrations can be explained by the drastic reduction in anthropogenic activity resulting from lockdown. A smaller but equally consistent PM10 concentration reduction (31%) was found in Barcelona [26].
PM10 or PM2.5 levels in rural and suburban areas were not as impacted by the COVID-19 lockdown period. Whereas rural stations showed a similar pattern of larger percentage reductions in PM10 concentrations than PM2.5 reductions, with more moderate reductions in average concentration of 13.6% and 3.5%, respectively, suburban environments experienced the opposite behavior, recording overall percentage increases of 3.6% and 20.2% in average PM10 and PM2.5 concentrations during lockdown.
According to the emission type classification (TRA/IND/BK), all cabin groups experienced a decrease in PM10 levels during lockdown. In Figure 3 it can be seen that the traffic stations experienced the steepest decrease in the average concentration of both PM10 and PM2.5, with drops of 42.4% and 24.3%, respectively. As for urban cabins, these decreases in traffic PM concentrations were due to the limited anthropogenic activities (traffic, works, etc.). A work in 11 metropolises in Spain with a different analysis approach found slightly lower PM10 percentage reductions (−32% and −38% in the metropolitan and traffic environments, respectively) and similar PM2.5 percentage decreases (−22% and −27% for the same environments) in Valencia [42]. In ref. [24], very similar percentage decreases in PM10 and PM2.5 results for traffic environments in European cities including Valencia (52.3% and 29.3% respectively) during lockdown were recorded. A PM2.5 decrease of 29% associated with reduced road traffic during lockdown in South Carolina was reported [27]. Accordingly, Figure 4 shows box plots with medians of 16.4 µg·m−3 of PM10 in the reference period versus 8.0 µg·m−3 in 2020 in urban AQCs. This is also observed in cabins labelled as traffic (Figure 5), with decreases of 14.0 µg·m−3 and 8.0 µg·m−3, respectively. To avoid smoothing as a result of calculating averages over the previous years, variability of individual year distributions was plotted, showing that concentration variability of PM10 and PM2.5 for the urban and traffic stations during the lockdown was lower than each reference year (Figures S2 and S3 in the supplementary material), which is more significant in PM10.
In contrast to the traffic stations, for those classified as IND and BK, PM10 concentration decreased moderately and PM2.5 levels increased during lockdown, with PM2.5 medians of 4.0 µg·m−3 and 5.0 µg·m−3 for IND and BK sites, respectively, for PM2.5 in the reference period and 6.0 µg·m−3 during the lockdown for both AQC types. Regarding PM10, industrial cabins registered medians of 8.0 µg·m−3 in both periods and BK reduced from 9.0 µg·m−3 in the reference period to 8.0 µg·m−3 in the lockdown, with similar variability in each individual year. PM10 levels at BK stations were reduced by 11.9%, while, contrary to expectations, levels at industrial stations decreased by only 7.5%. PM2.5 at IND and BK stations experienced overall increases of 14.3% and 6.4%, respectively, with small variability and similar medians (Figure 5), and with particle concentrations of industrial stations during lockdown were higher than averages recorded between 2016 and 2018. The lower reduction and even increase of PM in nonurban stations during the lockdown, might be partly due to the formation of particles resulting from the start of agricultural activity at the end of the winter and coinciding with the initiation of the lockdown. The spreading of fertilizers is known to be an important source of ammonium nitrate in European countries, which together with NOx emitted by agriculture and industry, contributes to the formation of secondary PM2.5 [43]. Another reason that might have influenced the moderate variations of particles is the simultaneous action of activities and sources that did not completely diminish during the lockdown, such as biomass burning and industry, which did not experience a total or synchronized halt in activity. The lack of data on the chemical composition of PM did not allow us to determine the evolution and the actual contribution of PM from each source. Despite the similar medians found and box sizes delimited by percentiles 25th and 75th, concentrations beyond the latter percentile, represented by dots, can be observed in all the subgroups of AQCs in the reference period. This confirms its generally higher variability compared to the lockdown. Box plots of individual years show similar sizes throughout the period 2015–2020, although AQCs grouped as URB and TRA clearly confirm the reduction of PM10 during the lockdown, which is not as significant for PM2.5.

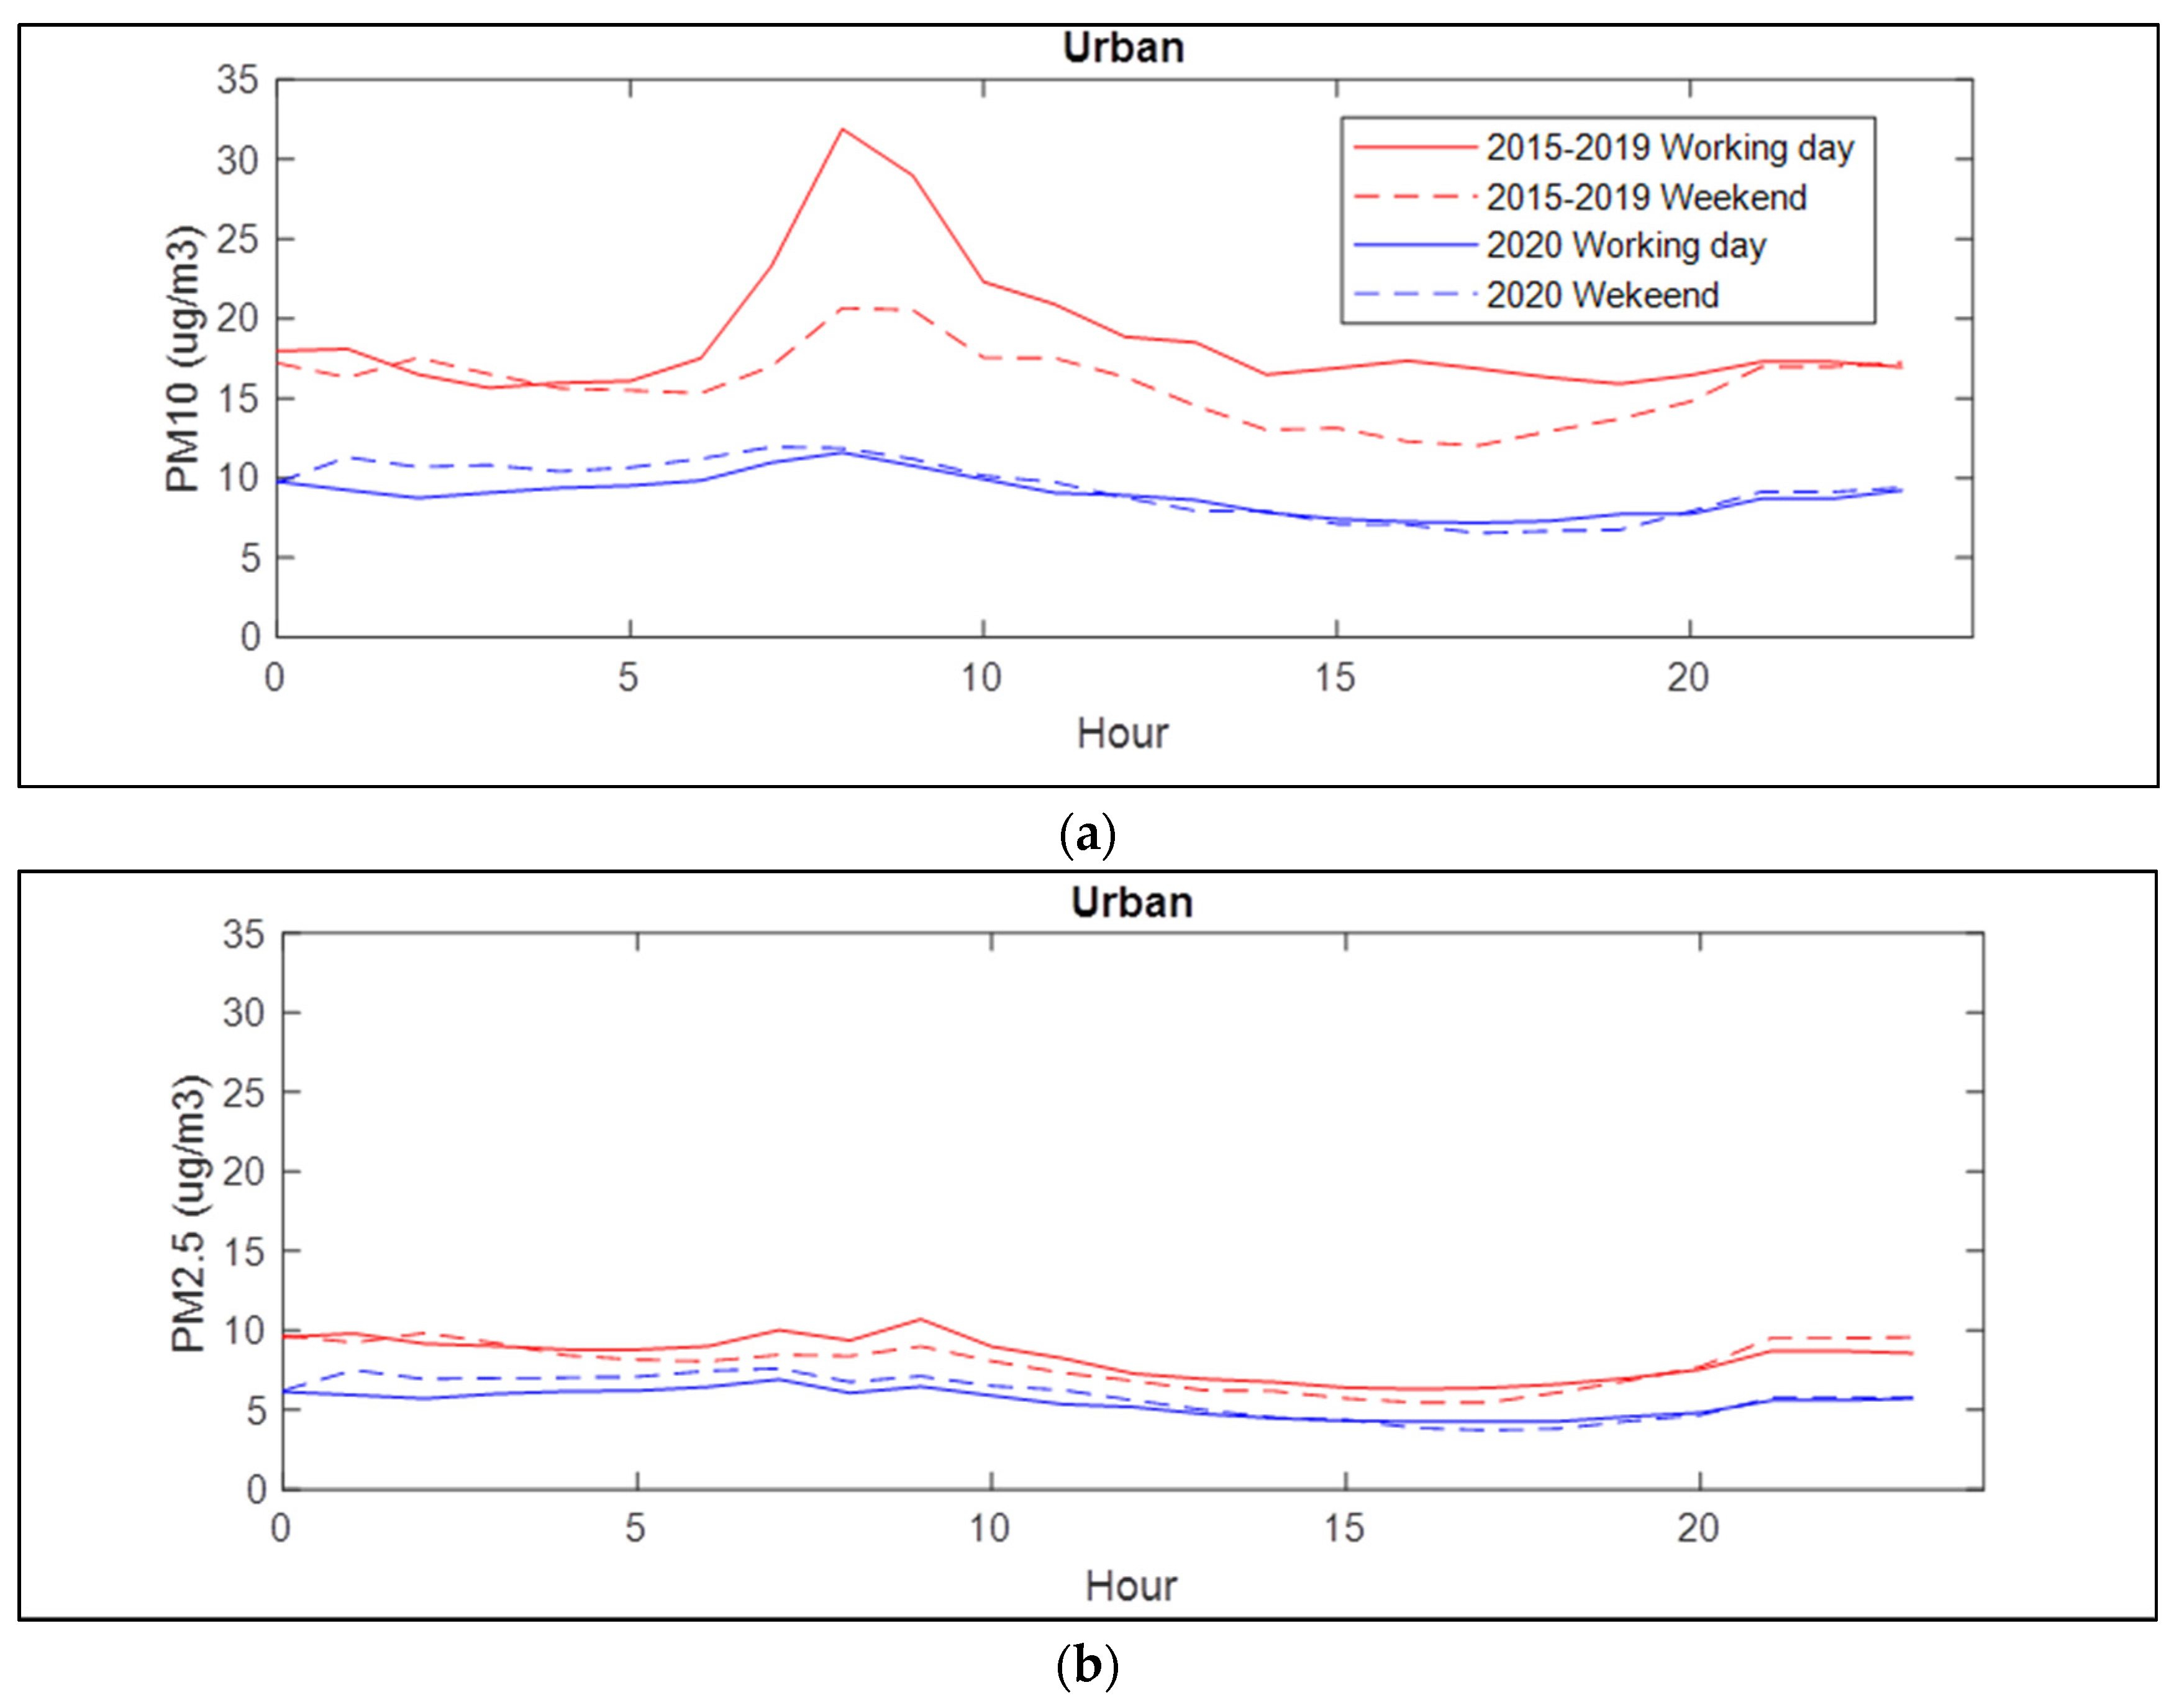
3.2. Hourly PM Pattern

Taking into account that the hourly pattern of particles is affected by activities carried out by citizens, the hourly PM profiles have been calculated to observe whether the halt of activity during the lockdown affected such PM patterns. Figure 6 shows an example of urban AQCs, the most prone to be affected by changes in human activity, and distinguishes between working days and weekends. Individual hourly patterns of each of the AQCs are shown in the supplementary material (Figures S4–S7).
There was a reduction in particle concentrations during working days in 2020 compared to the reference period, being more noticeable for PM10. Average concentrations of 18.7 µg·m−3 and 8.3 µg·m−3 were found for PM10 and PM2.5, respectively, in 2020 and 8.9 µg·m−3 and 5.5 µg·m−3 during the reference period. A clear pattern in the working days of the reference period with an increase of PM10 was observed at 8:00AM, reaching 31.9 µg·m−3, coinciding with citizens commuting to work. This is also slightly reflected in PM2.5 levels; hourly concentrations reached the highest values of 10.70 µg·m−3 and 6.47 µg·m−3 in the reference and lockdown periods, respectively. On weekends, the PM10 curve flattened and this peak dropped to 20.6 µg·m−3. Nevertheless, during the lockdown, there was almost no distinction between the profiles of working days and weekends, explained by the stoppage of human activities and reduction of traffic. Although this effect was lower for PM2.5 at traffic stations, a reduction in hourly values and a smoothing of the profile with respect to the reference period were still observed but with insignificant differences between weekdays and weekend profiles. Ref. [44] identified numerous sources of PM in traffic-influenced urban environments, many of them non-vehicular and with different contribution of PM10 and PM2.5. This supports the observed differences between the reference and lockdown periods and the persistence of considerable levels of PM during lockdown despite drastically reduced activity of the main emission sources in this environment.
A moderate increase was also evident in the afternoon; the profile shows that the return from work is steeper and starts at 7:00 p.m. The augmentation of particle concentrations at the end of the day may be attributed to the traffic flows, emissions of the heating systems and a descent in the planetary boundary layer height, as observed in other studies [45], the latter being responsible for the levels observed during the first hours of the night. In 2020, a reduction of concentration was maintained during the whole day, although the first peak in the morning was lower and PM10 varied from 21.7 µg·m−3 to 14.0 µg·m−3, which is in agreement with a reduction in traffic intensity.
Regarding rural and suburban sites (Figures S6 and S7), PM10 concentrations on working days and weekends in 2020 were similar to the weekend profile and values during the reference period. Concentration peaks at the same time as occurred in urban cabins, although they were less perceptible, indicating that traffic emissions contributed to PM10 concentration for these AQCs. The hourly trends for rural and suburban sites showed similar PM2.5 concentrations and hourly patterns to urban cabins in 2020 for both working days and weekends, with negligible differences when comparing the reference and the lockdown periods. This is because the contribution of PM2.5 in these environments mainly occurs on a regional scale. Although anthropogenic mobility was drastically reduced, there were still emissions of secondary aerosol precursors from activities such as agriculture, farming, domestic heating and industry, which led to the formation and transport of PM2.5.

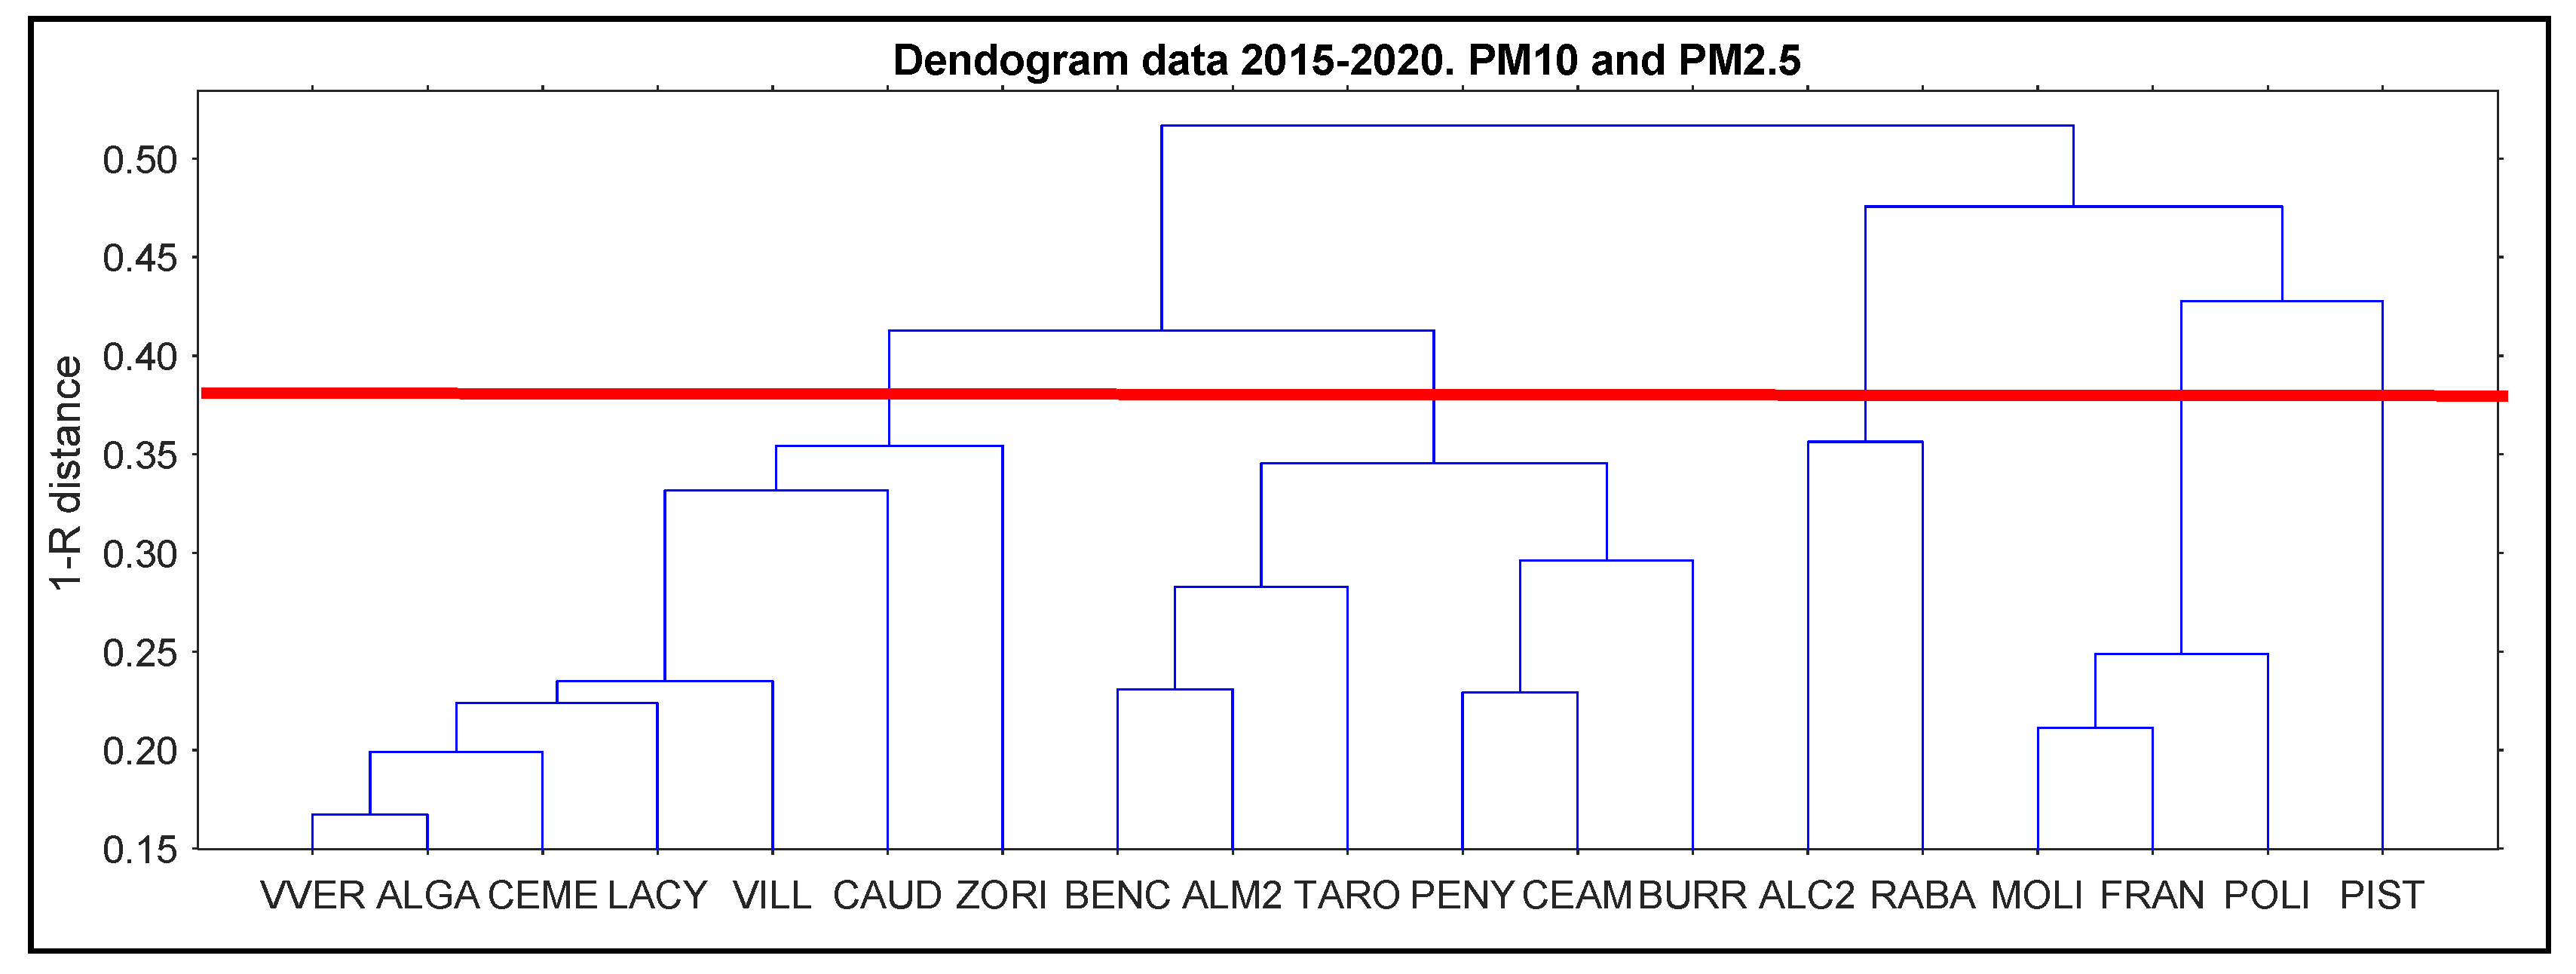
3.3. Cluster Analysis

The dendrogram combining the set of PM10 and PM2.5 concentrations of each AQC considering the whole period of study (2015 to 2020) and using as distance 1 minus the Pearson correlation coefficient resulted in clustering, as shown in Figure 7. To better explain the agglomerations of AQCs, we introduced the COA/INN attribute, which denotes its location in the coast or inland.
The first cluster includes most of the stations that were both BK and IND, even though there were cabins that pertain to all three provinces. A central cluster enclosing most of the AQCs that were both IND and COA is observed. It also includes ALM2 and BURR, which are URB/IND/COA and RUR/IND/COA, respectively. RABA and ALC2 are not in this cluster, but together in the third one. This may be because the first cluster is in Alicante, where industrial activity is not as intense as in Castellón, which is the province where most of the cabins in this cluster are located. Nevertheless, the reason why ALC2, which fulfills the characteristics of this cluster, has not been included here is unclear. The fourth cluster includes two out of the three traffic cabins, where traffic dominates the patterns of the PM data. POLI is included here as well and, although classified as SUB due to its location, is exposed to heavy traffic as it is on the way to the main university nuclei in Valencia and on the way to the beach zone. Further, the chosen separation of clusters excludes PIST from this cluster and gives rise to a new one consisting only of this station, which shares similarities with the aforementioned cluster.
The application of non-supervised cluster analysis confirmed similarities between groups of AQCs according to the emissions to which they are exposed rather than to the environment type classification.

3.4. Impact of Meteorological Parameters on PM

Meteorological parameters govern the main natural sources of PM, with sinks being a key driving factor. For this reason, together with the effect of the intensity reduction of anthropogenic sources, an assessment of the relationship between meteorology and PM concentration evolution during the study period was completed. In the supplementary material, Table S6 provides summary statistics on the meteorological parameters of the 11 AQCs that reported data for both the reference and lockdown periods. Mean temperature and standard deviation values were very similar for all seasons in both periods. However, compared to the reference period, the study region was characterized by less radiation and higher values of precipitation and relative humidity during lockdown.
To assess the dependency of the PM concentration patterns with environmental parameters during the lockdown period and their possible role in the unexpected increase of PM observed in some AQCs, the correlation of PM with TEMP, RH, RF, RAD and WS was calculated along with the p-values (Tables S7 and S8). Although meteorological data were not collected for all the cabins, these are available for 11 out of the total of 19 AQCs considered in this study, including those cabins reporting a relative increase of particulate matter during the COVID-19 period. Radiation is a key factor in the formation of PM2.5. However, as mentioned above, there was, in general, less intense radiation in the study area during the lockdown compared to the reference period, leading to a nonsignificant correlation between RAD and PM2.5 at all of the stations analyzed. Nevertheless, a notable dependence between RH and WS for some of the cabins was found. As expected [30,46], there was a positive correlation between RH and PM concentration, explained by RH facilitating multiphase reactions that resulted in aerosol formation and growth [47]. In CEME, which showed increases of 30.3% and 44.8% in PM10 and PM2.5, respectively, R values of 0.59 and 0.50 were found in the regression of PM10 and PM2.5 concentrations, respectively, versus RH. The same behavior was observed in CEAS, which experienced similar variations, with R values of 0.41 and 0.48 for PM10 and PM2.5, respectively. Conversely, there was an anticorrelation with the wind speed, indicating that wind affects the cleanliness of the environment, as reported in other studies [30,46,48,49,50]. The higher the wind speed, the lower the concentration; therefore, PM levels were affected by the wind speed conditions, which could explain the increase of particulate matter during the lockdown period. In CEME, negative R values of 0.66 and 0.68 were found for PM10 and PM2.5, respectively. The same behavior was observed in CEAS, with negative values of 0.58 and 0.63, and in VILL, where the values were 0.65 and 0.66. In addition, the same pattern was observed in PENY, though with more moderated correlation coefficients. Nevertheless, the observed correlation with WS did not produce a rise in PM in ALM2. The combined effect of WS and RH may partly explain the unexpected PM increases found in some cabins. Regarding TARO, wind speed data were not collected, although an anticorrelation was found with PLU, which may partly explain its increase of 33.8% in PM2.5. Therefore, these calculations might explain the dependency of PM on environmental parameters, suggesting that the main factor was the meteorological dependence rather than the source type. A characterization of the particle composition would be needed to further explain the PM patterns found and elucidate to which extent meteorology played a role. In all the cases above mentioned, p-values were found to be below the threshold 0.05, being therefore relevant for the correlations.
Figure S8a–c in the supplementary material illustrates anticorrelation of the PM concentrations with the wind speed, as well as pluviometry (Figure S8a,b, respectively) and correlation with RH (Figure S8c) during the lockdown. As can be clearly seen in Figure S8a, at the ALM station the concentration levels of PM10 and PM2.5 decreased as daily wind speed increased, reflecting efficient air renewal at wind speeds above 1 m·s−1. Figure S8b shows how effective wet deposition is as a sink for suspended particulate matter. It can be seen that on several occasions during the study period, precipitation led to a drastic decrease in the levels of PM10 and PM2.5 particles at TARO station. In Figure S8c, the correlation between PM and RH is easily observable at CEME station, reflecting a very similar evolution over the whole measurement period.

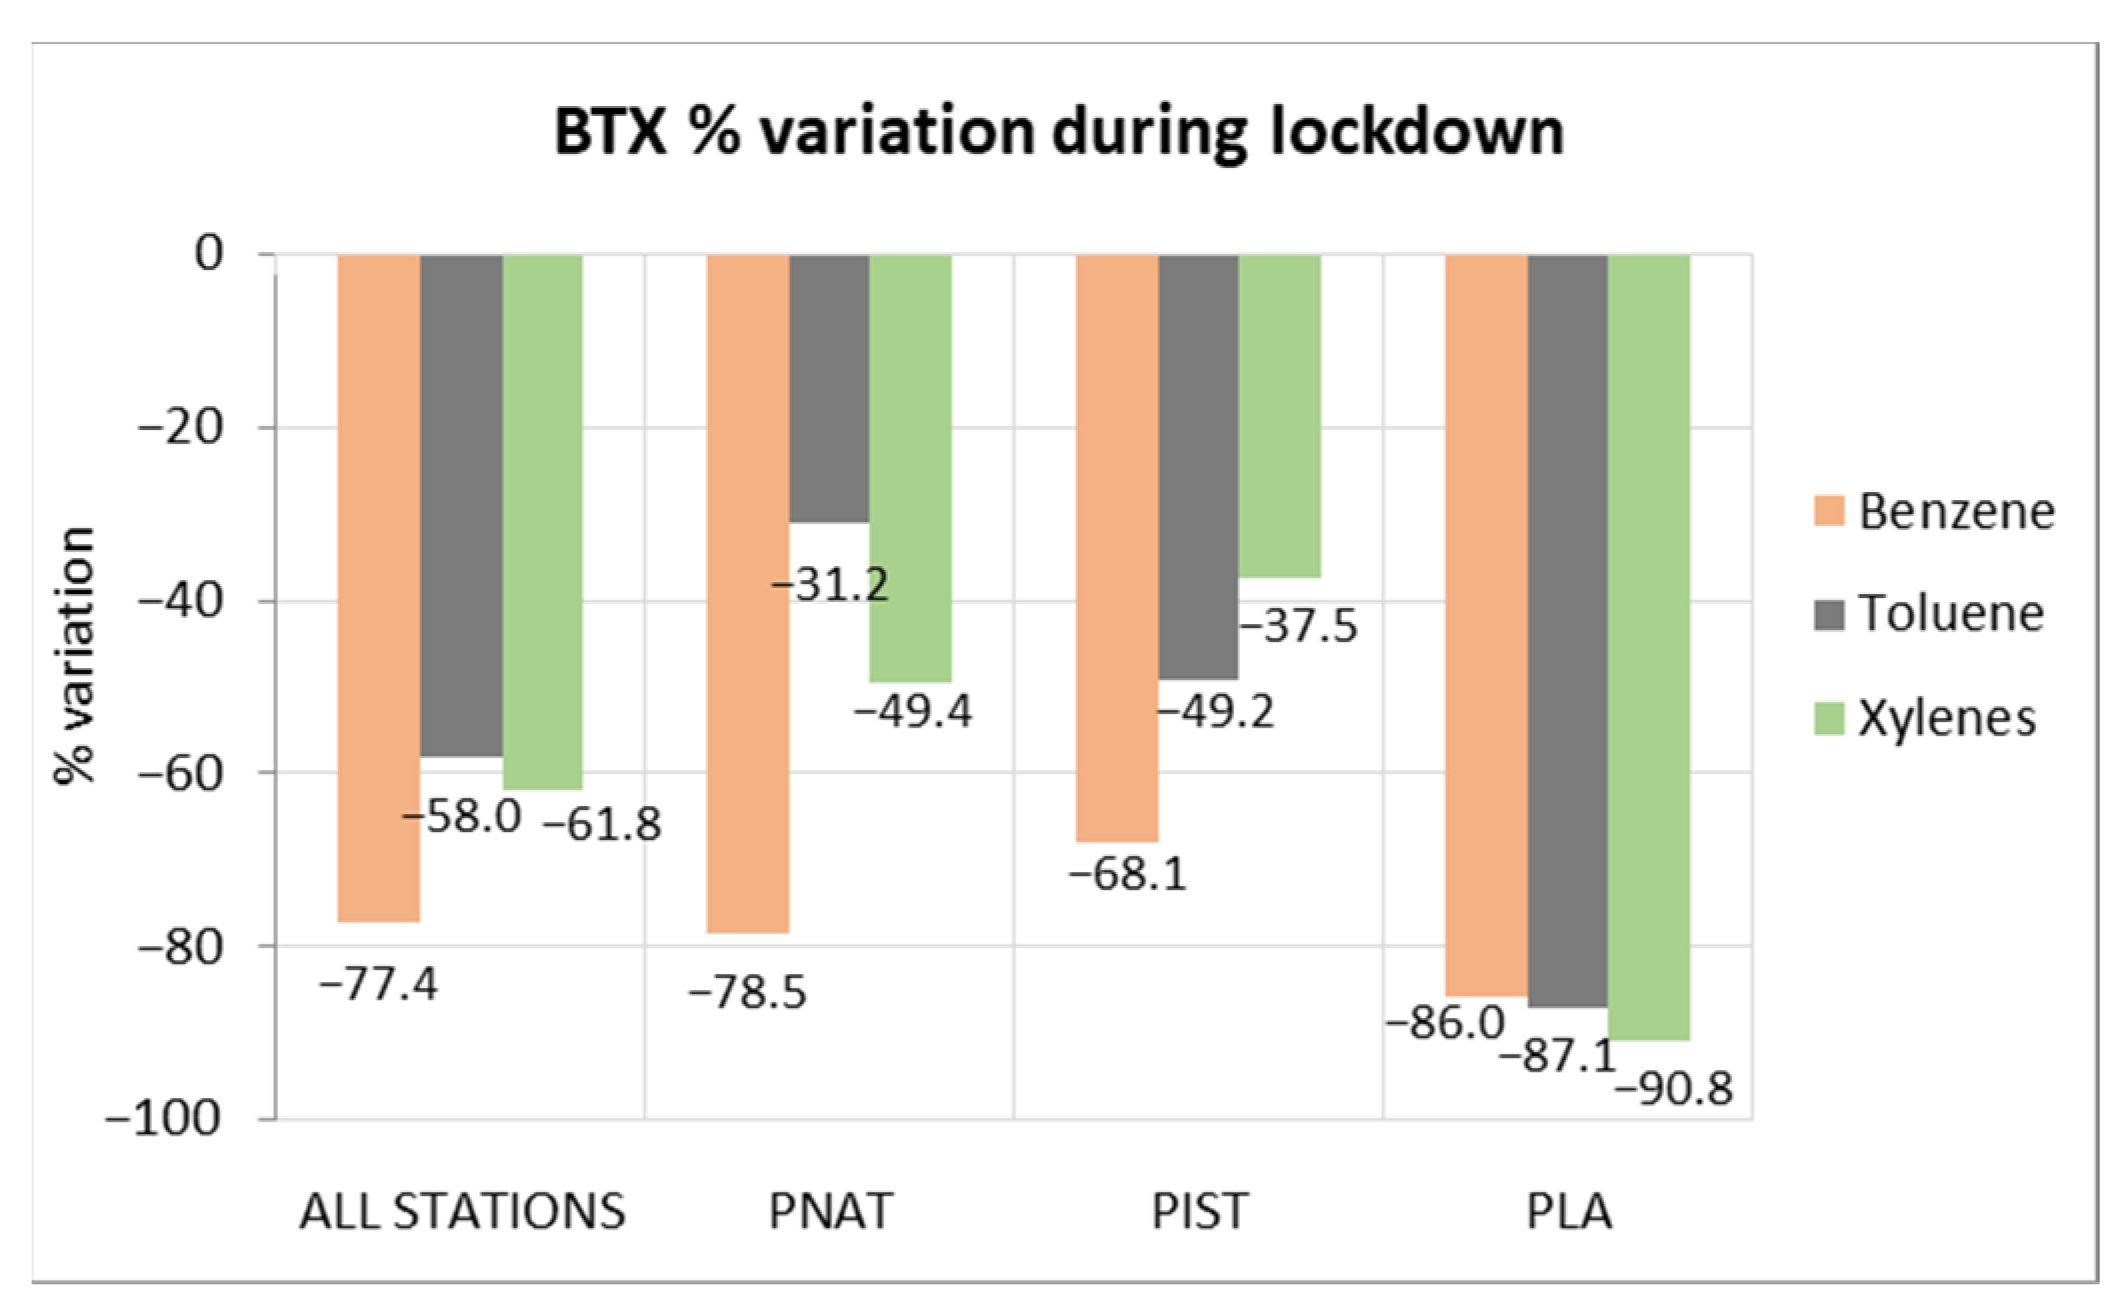
3.5. VOCs Concentration Variation

This section aims to analyze the overall variation and daily evolution of BTXs in the three urban traffic stations (PNAT, PIST and PLA) reporting these data during the lockdown. Average concentrations of benzene, toluene and xylene were lower during lockdown than in the 2015–2019 period. The lockdown period was characterized by a less dispersed database and by considerably lower hourly percentile 95 and absolute maximum values for every pollutant considered. As can be seen in Figure 8, for the set of stations, the general variation in BTX levels was notable; levels of benzene, toluene and xylene decreased by 77.4%, 58.0% and 61.8%, respectively, in 2015–2019. Ref. [50] reported a similar percentage drop (67%) in VOC levels from traffic during lockdown in China. Analyzing the stations individually, the greatest reduction in BTX levels was recorded at the PLA station (Alicante), accounting for a percentage concentration reduction of 86.0%, 87.1% and 90.8% in benzene, toluene and xylene, respectively, in the lockdown period compared to the reference period. However, there were also strong variations in each VOC measured for the other stations. Benzene and xylene concentrations recorded average decreases of up to 78.5% and 49.4% in PNAT (Castellón), while toluene recorded an average decrease of up to 49.2% at PIST station (Valencia). The latter figure is in agreement with PM10 and PM2.5 reductions found in this site as a result of the mobility restrictions that resulted in a traffic drop. Therefore, apart from a decrease in primary particle emissions due to lower traffic flow, it is expected that this reduction in BTX levels has contributed to the decline found in PM2.5 levels by limiting the further photooxidative production of SOA.
Figure 9a–c shows the daily evolution of VOCs at the different stations. Benzene showed a clear decrease in its daily concentrations in all stations throughout the period, only showing slight increases at the end of the lockdown period with respect to the reference period at the PNAT station. Although the same trend can be observed at the PLA station for toluene and xylene, leading to the large overall percentage decreases previously highlighted, it can also be seen that there have been non-negligible emissions at the other stations (PIST and PNAT), resulting in similar and even higher daily concentrations than in the reference period for some days. While particles can be both primary and secondary pollutants, at these stations, BTXs are mainly primary, being largely contributed by vehicle exhaust. This explains the higher variations in BTX than in PM, the latter being softened by other emission sources and processes, as stated above.

4. Conclusions

The COVID-19 pandemic led to an unprecedented reduction of anthropogenic activity. This work evaluated the variation of PM10, PM2.5 and BTX concentrations due to the COVID-19 lockdown. Unlike most of the studies in which AQCs in cities have been considered, this work presents a study of the behavior of PM concentrations considering a network of AQCs within a whole region, i.e., enclosing cabins exposed to different emissions (traffic, industrial, background), in different environments (urban, suburban, rural) and locations (coast, inner). A thorough statistical analysis of PM was carried out.
Despite a halt in human activity, PM concentrations did not follow the expected behavior in this lockdown. PM10 concentrations showed an overall percentage reduction of 16.5% in 2020 while PM2.5 levels increased by 3.1%. This period also showed lower variability of concentrations than the reference as observed in the box plots. Nonsupervised cluster analysis confirmed that the main similarities in concentration trends in different AQCs respond to the type of emissions they are exposed to. Urban and rural areas recorded a reduction in PM10 and PM2.5 levels, while suburban areas experienced an increase in both PM fractions. As expected, AQCs labelled as urban and exposed to traffic emissions experienced the most drastic reductions, while in industrial areas the reductions were more moderate for PM10, and an increase for PM2.5 was observed. The increase of the PM concentration in some AQCs during the period studied in 2020 may, in part, be explained by meteorological parameters, as a dependency has been found between PM and wind speed, relative humidity and rainfall. Exhaustive statistical analysis has been carried out by applying blind clusters to explore the behavior of the AQC network, confirming similar performance in groups of cabins classified by their features.
Our study confirms that the stoppage of anthropogenic activities during the lockdown has also affected the hourly pattern of particle concentration. In general, it has flattened the profile and reduced the average values, especially in rural and traffic AQCs.
Reduction of the activity during the COVID-19 lockdown resulted in a diminution of contaminants as observed in many observational and model studies worldwide. In this study, we have found substantial drops in benzene, toluene and xylene by 77.4%, 58.0% and 61.8%, respectively. As stated above, for emission sources other than traffic, particles can be both primary and secondary pollutants, e.g., heating systems and dispersed emissions from surrounding industrial or farming areas. The chemistry of PM is non-linear and complex, and the oxidative capacity of the atmosphere might have increased due to enhanced ozone concentration resulting from less NO titration, leading to an increase of secondary aerosols. This, together with meteorological aspects, might have compensated for and lessened the overall reduction of aerosols.
Even though this lockdown allowed us to analyze a unique scenario, the brevity of this period of study calls for the further characterization of the worldwide impact of the reduction in anthropogenic activity on PM and other pollutants’ concentrations. Accordingly, more research on PM chemical composition and emission sources is needed to fully understand and explain the impact of lockdown on PM concentration and size distribution. Our study supports the idea that the control of the air quality, especially of particulate pollution, has to be evaluated considering different factors: emission sources, secondary formation, effective oxidizing capacity of the atmosphere and meteorology.
The evaluation period has been a unique opportunity, and our study, by including coverage of different scenarios and a thorough statistical analysis, presents valuable information on the effect of the reduction and halt of anthropogenic activities over a network of AQCs comprising different environments and affected by different types of emission sources. Our findings may help to establish a basis for future scientific air pollution control strategies and for improving air quality policies to counteract air pollution and to place human health at the center of urban planning.

Supplementary Materials

The following supporting information can be downloaded at: https://0-www-mdpi-com.brum.beds.ac.uk/article/10.3390/atmos13010097/s1, Table S1. Summary of AQCs considered in this work and environmental and pollutant data reported; Table S2: Statistics of PM10 data set of each air quality cabin during reference and lockdown periods and their percentage variation; Table S3: Statistics of PM2.5 data set of each air quality cabin during reference and lockdown periods and their percentage variation; Table S4: Overall mean, standard deviation (Sd), median, 5th and 95th percentiles (P05 and P95), minimum (Min) and maximum (Max) values for PM10, PM2.5 and BTX for reference and lockdown periods considering all AQCs in this study; Table S5: Mean PM concentrations and standard deviations for all air quality cabins grouped by type of environment and emission for both periods of study and PM percentage variation during lockdown compared to the reference period; Table S6: Statistical summary of environmental parameters of each air quality cabin during reference and lockdown periods; Table S7: Pearson’s correlation coefficient, R, between PM10 and PM2.5 and meteorological variables; Table S8: p-values between PM10 and PM2.5 and meteorological variables; Figure S1. Box plot of (a) PM10 and (b) PM2.5 concentration in the AQCs for reference and lockdown periods; Figure S2. (a,b) Box plots by environment type. (a,b) represent PM10 and PM2.5 respectively in the reference, sorted by year, and the lockdown periods; Figure S3. (a,b) Box plots by emission type. (a,b) represent PM10 and PM2.5 respectively in the reference, sorted by year, and the lockdown periods. Figure S4: Hourly PM2.5 profile comparing reference and lockdown periods; Figure S5: Hourly PM10 profile comparing reference and lockdown periods; Figure S6: Hourly PM10 concentration profile by environment type for reference and lockdown periods; Figure S7: Hourly PM2.5 concentration profile by environment type for reference and lockdown periods; Figure S8. PM and meteorological variables time series to illustrate anticorrelation in (a) ALM and (b) TARO and correlation in (c) CEME stations during lockdown.

Author Contributions

Conceptualization, M.R., R.S., E.B., T.V., J.J.D. and A.M.; Methodology, M.R., R.S., E.B., T.V., J.J.D. and A.M.; Data curation, M.R. and R.S.; Formal analysis, M.R. and R.S.; Data resources: J.J.D.; Investigation, M.R. and R.S.; Writing—original draft, M.R. and R.S.; Validation, E.B.; Writing—review & editing, M.R., R.S., E.B., T.V. and A.M.; Supervision, A.M. All authors have read and agreed to the published version of the manuscript.

Funding

This work was supported by the projects CAPOX (RTI2018-097768-B-C21, Spanish Ministry of Science, Innovation and Universities) and IMAGINA_PROMETEO (PROMETEO/2019/110, Generalitat Valenciana).

Data Availability Statement

Data presented in this study are available at the webpage of the AQ Network of the Generalitat Valenciana. (http://agroambient.gva.es/es/web/calidad-ambiental/datos-historicos). Last access date: 29 December 2021.

Acknowledgments

Fundación CEAM is partly supported by the Generalitat Valenciana, by the IMAGINA_PROMETEO (PROMETEO/2019/110) project and by the CAPOX project (RTI2018-097768-B-C21).

Conflicts of Interest

The authors declare no conflict of interest.

References

  1. Chen, R.; Kan, H.; Chen, B.; Huang, W.; Bai, Z.; Song, G.; Pan, G. Association of Particulate Air Pollution with Daily Mortality. Am. J. Epidemiol. 2012, 175, 1173–1181. [Google Scholar] [CrossRef] [PubMed]
  2. Chen, C.-H.; Wu, C.-D.; Chiang, H.-C.; Chu, D.; Lee, K.-Y.; Lin, W.-Y.; Yeh, J.-I.; Tsai, K.-W.; Guo, Y.L. The effects of fine and coarse particulate matter on lung function among the elderly. Sci. Rep. 2019, 9, 14790. [Google Scholar] [CrossRef]
  3. Dockery, D.W.; Stone, P.H. Cardiovascular Risks from Fine Particulate Air Pollution. N. Engl. J. Med. 2007, 356, 511–513. [Google Scholar] [CrossRef] [Green Version]
  4. Miller, K.A.; Siscovick, D.S.; Sheppard, L.; Shepherd, K.; Sullivan, J.H.; Anderson, G.L.; Kaufman, J.D. Long-Term Exposure to Air Pollution and Incidence of Cardiovascular Events in Women. N. Engl. J. Med. 2007, 356, 447–458. [Google Scholar] [CrossRef]
  5. World Health Organization. Ambient (Outdoor) Air Pollution. 2018. Available online: https://www.who.int/news-room/fact-sheets/detail/ambient-(outdoor)-air-quality-and-health (accessed on 4 December 2021).
  6. European Environment Agency. Excedance Of Air Quality Standards in Europe. 2021. Available online: https://www.eea.europa.eu/ims/exceedance-of-air-quality-standards (accessed on 4 December 2021).
  7. Querol, X.; Alastuey, A.; Rodriguez, S.; Plana, F.; Ruiz, C.; Cots, N.; Massagué, G.; Puig, O. PM10 and PM2.5 source apportionment in the Barcelona Metropolitan Area, Catalonia, Spain. Atmos. Environ. 2001, 35, 6407–6419. [Google Scholar] [CrossRef]
  8. Viana, M.; Kuhlbusch, T.A.J.; Querol, X.; Alastuey, A.; Harrison, R.M.; Hopke, P.K.; Winiwarter, W.; Vallius, M.; Szidat, S.; Prévôt, A.S.H.; et al. Source apportionment of particulate matter in Europe: A review of methods and results. J. Aerosol Sci. 2008, 39, 827–849. [Google Scholar] [CrossRef]
  9. Schnatter, A.R.; Glass, D.; Tang, G.; Irons, R.D.; Rushton, L. Myelodysplastic Syndrome and Benzene Exposure Among Petroleum Workers: An International Pooled Analysis. J. Natl. Cancer Inst. 2012, 104, 1724–1737. [Google Scholar] [CrossRef] [Green Version]
  10. Masih, A.; Anurag, L.; Taneja, A.; Singhvi, R. Inhalation exposure and related health risks of BTEX in ambient air at different microenvironments of a terai zone in north India. Atmos. Environ. 2016, 147, 55–66. [Google Scholar] [CrossRef]
  11. Carter, W.P.L. Development of Ozone Reactivity Scales for Volatile Organic Compounds. Air Waste 1994, 44, 881–899. [Google Scholar] [CrossRef] [Green Version]
  12. Seinfeld, J.H.; Pandis, S.N. Atmospheric Chemistry and Physics: From Air Pollution to Climate Change; John Wiley & Sons: Hoboken, NJ, USA, 2006. [Google Scholar]
  13. Henze, D.K.; Seinfeld, J.H.; Ng, N.L.; Kroll, J.H.; Fu, T.-M.; Jacob, D.J.; Heald, C.L. Global modeling of secondary organic aerosol formation from aromatic hydrocarbons: High- vs. low-yield pathways. Atmos. Chem. Phys. Discuss. 2008, 8, 2405–2420. [Google Scholar] [CrossRef] [Green Version]
  14. Kerchich, Y.; Kerbachi, R. Measurement of BTEX (benzene, toluene, ethybenzene, and xylene) levels at urban and semirural areas of Algiers City using passive air samplers. J. Air Waste Manag. Assoc. 2012, 62, 1370–1379. [Google Scholar] [CrossRef] [PubMed] [Green Version]
  15. Buczynska, A.J.; Krata, A.; Stranger, M.; Godoi, A.F.L.; Kontozova-Deutsch, V.; Bencs, L.; Naveau, I.; Roekens, E.; Van Grieken, R. Atmospheric BTEX-concentrations in an area with intensive street traffic. Atmos. Environ. 2009, 43, 311–318. [Google Scholar] [CrossRef]
  16. Our World in Data. Coronavirus Disease (COVID-19)—Statistics and Research. Oxford Martin School. Oxon. Global Change Data Lab. 2021. Available online: https://ourworldindata.org/coronavirus/ (accessed on 31 November 2021).
  17. Rodríguez-Urrego, D.; Rodríguez-Urrego, L. Air quality during the COVID-19: PM2.5 analysis in the 50 most polluted capital cities in the world. Environ. Pollut. 2020, 266, 115042. [Google Scholar] [CrossRef] [PubMed]
  18. Yin, Z.; Zhang, Y.; Wang, H.; Li, Y. Evident PM2.5 drops in the east of China due to the COVID-19 quarantine measures in February. Atmos. Chem. Phys. Discuss. 2021, 21, 1581–1592. [Google Scholar] [CrossRef]
  19. Le, T.; Wang, Y.; Liu, L.; Yang, J.; Yung, Y.L.; Li, G.; Seinfeld, J.H. Unexpected air pollution with marked emission reductions during the COVID-19 outbreak in China. Science 2020, 369, 702–706. [Google Scholar] [CrossRef] [PubMed]
  20. Zhang, F.; Wang, Y.; Peng, J.; Chen, L.; Sun, Y.; Duan, L.; Ge, X.; Li, Y.; Zhao, J.; Liu, C.; et al. An unexpected catalyst dominates formation and radiative forcing of regional haze. Proc. Natl. Acad. Sci. USA 2020, 117, 3960–3966. [Google Scholar] [CrossRef] [PubMed] [Green Version]
  21. Mao, L.; Liu, R.; Liao, W.; Wang, X.; Shao, M.; Liu, S.C.; Zhang, Y. An observation-based perspective of winter haze days in four major polluted regions of China. Natl. Sci. Rev. 2019, 6, 515–523. [Google Scholar] [CrossRef] [PubMed] [Green Version]
  22. Shen, J.; Bigi, A.; Marinoni, A.; Lampilahti, J.; Kontkanen, J.; Ciarelli, G.; Putaud, J.P.; Nieminen, T.; Kulmala, M.; Lehtipalo, K.; et al. Emerging Investigator Series: COVID-19 lockdown effects on aerosol particle size distributions in northern Italy. Environ. Sci. Atmos. 2021, 1, 214–227. [Google Scholar] [CrossRef] [PubMed]
  23. Ciarelli, G.; Jiang, J.; El Haddad, I.; Bigi, A.; Aksoyoglu, S.; Prévôt, A.S.H.; Marinoni, A.; Shen, J.; Yan, C.; Bianchi, F. Modeling the effect of reduced traffic due to COVID-19 measures on air quality using a chemical transport model: Impacts on the Po Valley and the Swiss Plateau regions. Environ. Sci. Atmos. 2021, 1, 228–240. [Google Scholar] [CrossRef] [PubMed]
  24. Sicard, P.; De Marco, A.; Agathokleous, E.; Feng, Z.; Xu, X.; Paoletti, E.; Rodriguez, J.J.D.; Calatayud, V. Amplified ozone pollution in cities during the COVID-19 lockdown. Sci. Total Environ. 2020, 735, 139542. [Google Scholar] [CrossRef] [PubMed]
  25. Briz-Redón, Á.; Belenguer-Sapiña, C.; Serrano-Aroca, Á. Changes in air pollution during COVID-19 lockdown in Spain: A multi-city study. J. Environ. Sci. 2021, 101, 16–26. [Google Scholar] [CrossRef]
  26. Tobías, A.; Carnerero, C.; Reche, C.; Massagué, J.; Via, M.; Minguillón, M.C.; Alastuey, A.; Querol, X. Changes in air quality during the lockdown in Barcelona (Spain) one month into the SARS-CoV-2 epidemic. Sci. Total Environ. 2020, 726, 138540. [Google Scholar] [CrossRef] [PubMed]
  27. Parker, H.A.; Hasheminassab, S.; Crounse, J.D.; Roehl, C.M.; Wennberg, P.O. Impacts of Traffic Reductions Associated With COVID-19 on Southern California Air Quality. Geophys. Res. Lett. 2020, 47, e2020GL090164. [Google Scholar] [CrossRef]
  28. Ogen, Y. Assessing nitrogen dioxide (NO2) levels as a contributing factor to the coronavirus (COVID-19) fatality rate. Sci. Total. Environ. 2020, 726, 138605. [Google Scholar] [CrossRef]
  29. Fuzzi, S.; Baltensperger, U.; Carslaw, K.; Decesari, S.; Van Der Gon, H.D.; Facchini, M.C.; Fowler, D.; Koren, I.; Langford, B.; Lohmann, U.; et al. Particulate matter, air quality and climate: Lessons learned and future needs. Atmos. Chem. Phys. Discuss. 2015, 15, 8217–8299. [Google Scholar] [CrossRef] [Green Version]
  30. Jacob, D.J.; Winner, D.A. Effect of climate change on air quality. Atmos. Environ. 2009, 43, 51–63. [Google Scholar] [CrossRef] [Green Version]
  31. Petetin, H.; Bowdalo, D.; Soret, A.; Guevara, M.; Jorba, O.; Serradell, K.; García-Pando, C.P. Meteorology-normalized impact of the COVID-19 lockdown upon NO2 pollution in Spain. Atmos. Chem. Phys. Discuss. 2020, 20, 11119–11141. [Google Scholar] [CrossRef]
  32. Spanish Ministry Miteco Website. 2021. Available online: https://www.miteco.gob.es/ (accessed on 4 December 2021).
  33. Draxler, R.R.; Rolph, G.D. HYSPLIT., Model Access Via NOAA ARL READY Website. 2015. Available online: http://ready.arl.noaa.gov/HYSPLIT.php (accessed on 30 October 2012).
  34. Stein, A.F.; Draxler, R.R.; Rolph, G.D.; Stunder, B.J.B.; Cohen, M.D.; Ngan, F. NOAA’s HYSPLIT Atmospheric Transport and Dispersion Modeling System. Bull. Am. Meteorol. Soc. 2015, 96, 2059–2077. [Google Scholar] [CrossRef]
  35. Querol, X.; Alastuey, A.; Pey, J.; Escudero, M.; Castillo, S.; Gonzalez, A.; Pallares, M.; Jiménez, S.; Cristobal, A.; Ferreira, F.; et al. Spain and Portugal Methodology for the identification of natural African dust episodes in PM10 and PM2.5, and justification with regards to the exceedances of the PM10 daily limit value. Environ. Sci. Pollut. Res. 2006, 35, 1151–1172. [Google Scholar]
  36. Sarkar, M.; Das, A.; Mukhopadhyay, S. Assessing the immediate impact of COVID-19 lockdown on the air quality of Kolkata and Howrah, West Bengal, India. Environ. Dev. Sustain. 2021, 23, 8613–8642. [Google Scholar] [CrossRef]
  37. Núñez, D.; Pérez, L.V.; Manzoor, S.; Cáceres, J.O. Statistical Tools for Air Pollution Assessment: Multivariate and Spatial Analysis Studies in the Madrid Region. J. Anal. Methods Chem. 2019, 2019, 975392. [Google Scholar]
  38. Matlab. Statistics and Machine Learning Toolbox™, Version 2019a; The MathWorks, Inc.: Natick, MA, USA, 2019.
  39. Morel, P. Gramm: Grammar of graphics plotting in Matlab. J. Open Source Softw. 2018, 3, 23–568. [Google Scholar] [CrossRef]
  40. Donzelli, G.; Cioni, L.; Cancellieri, M.; Llopis-Morales, A.; Morales-Suárez-Varela, M. Relations between Air Quality and COVID-19 Lockdown Measures in Valencia, Spain. Int. J. Environ. Res. Public Health 2021, 18, 2296. [Google Scholar] [CrossRef]
  41. Wyche, K.; Nichols, M.; Parfitt, H.; Beckett, P.; Gregg, D.; Smallbone, K.; Monks, P. Changes in ambient air quality and atmospheric composition and reactivity in the South East of the UK as a result of the COVID-19 lockdown. Sci. Total Environ. 2021, 755, 142526. [Google Scholar] [CrossRef] [PubMed]
  42. Querol, X.; Massagué, J.; Alastuey, A.; Moreno, T.; Gangoiti, G.; Mantilla, E.; Diéguez, J.J.; Escudero, M.; Monfort, E.; Pérez García-Pando, C.; et al. Lessons from the COVID-19 air pollution decrease in Spain: Now what? Sci. Total Environ. 2021, 779, 146380. [Google Scholar] [CrossRef]
  43. Menut, L.; Bessagnet, B.; Siour, G.; Mailler, S.; Pennel, R.; Cholakian, A. Impact of lockdown measures to combat COVID-19 on air quality over western Europe. Sci. Total Environ. 2020, 741, 140426. [Google Scholar] [CrossRef]
  44. Pio, C.; Alves, C.; Nunes, T.; Cerqueira, M.; Lucarelli, F.; Nava, S.; Calzolai, G.; Gianelle, V.; Colombi, C.; Amato, F.; et al. Source apportionment of PM2.5 and PM10 by Ionic and Mass Balance (IMB) in a traffic-influenced urban atmosphere, in Portugal. Atmos. Environ. 2020, 223, 117217. [Google Scholar] [CrossRef]
  45. Salvador, P.; Pandolfi, M.; Tobías, A.; Gómez-Moreno, F.J.; Molero, F.; Barreiro, M.; Pérez, N.; Revuelta, M.A.; Marco, I.M.; Querol, X.; et al. Impact of mixing layer height variations on air pollutant concentrations and health in a European urban area: Madrid (Spain), a case study. Environ. Sci. Pollut. Res. 2020, 27, 41702–41716. [Google Scholar] [CrossRef]
  46. Xu, Y.; Xue, W.; Lei, Y.; Zhao, Y.; Cheng, S.; Ren, Z.; Huang, Q. Impact of Meteorological Conditions on PM2.5 Pollution in China during Winter. Atmosphere 2018, 9, 429. [Google Scholar] [CrossRef] [Green Version]
  47. Tie, X.; Huang, R.-J.; Cao, J.; Zhang, Q.; Cheng, Y.; Su, H.; Chang, D.; Pöschl, U.; Hoffmann, T.; Dusek, U.; et al. Severe Pollution in China Amplified by Atmospheric Moisture. Sci. Rep. 2017, 7, 15760. [Google Scholar] [CrossRef] [PubMed]
  48. Keary, J.; Jennings, S.G.; O’Connor, T.C.; McManus, B.; Lee, M. PM10 Concentration Measurements in Dublin City. Environ. Monit. Assess. 1998, 52, 3–18. [Google Scholar] [CrossRef]
  49. Galindo, N.; Varea, M.; Gil-Moltó, J.; Yubero, E.; Nicolás, J. The Influence of Meteorology on Particulate Matter Concentrations at an Urban Mediterranean Location. Water Air Soil Pollut. 2010, 215, 365–372. [Google Scholar] [CrossRef]
  50. Wang, J. Impact of COVID-19 lockdown on ambient levels and sources of volatile organic compounds (VOCs) in Nanjing, China. Sci. Total Environ. 2021, 757, 143823. [Google Scholar] [CrossRef] [PubMed]
Figure 1. Location of the monitoring air quality stations on the Spanish Mediterranean coast. Map data: © 2022 Google. Image Landsat/Copernicus.
Atmosphere 13 00097 g001
Figure 2. Percentage variation of PM10 and PM2.5 for each station. Codes below ACQ names refer to their type of environment, U: urban, S: suburban, R: rural; and type of environment, T: traffic, I: industrial, B: background.
Atmosphere 13 00097 g002
Figure 3. Variation of PM for all the stations and stations grouped according to different characteristics.
Atmosphere 13 00097 g003
Figure 4. (a,b) Box plots by environment type. (a,b) represent PM10 and PM2.5 respectively in the reference and the lockdown periods. The marker inside the boxplot is the median, and lower and upper box boundaries are the 25th (Q1) and 75th (Q3) percentiles, respectively. Lower and upper whiskers represent Q1 − 1.5·IQR and Q3 + 1.5·IQR, respectively. Dots are outliers.
Atmosphere 13 00097 g004
Figure 5. (a,b) Box plots by emission type. (a,b) represent PM10 and PM2.5 respectively in the reference and the lockdown periods. The marker inside the boxplot is the median, and lower and upper box boundaries are the 25th (Q1) and 75th (Q3) percentiles, respectively. Lower and upper whiskers represent Q1 − 1.5·IQR and Q3 + 1.5·IQR, respectively. Dots are outliers.
Atmosphere 13 00097 g005
Figure 6. Hourly PM10 (a) and PM2.5 (b) concentration profile of working days and weekends for the reference and lockdown periods.
Atmosphere 13 00097 g006
Figure 7. Dendrogram using 1-R (Pearson coefficient) as distance using PM10 and PM2.5 concentration data.
Atmosphere 13 00097 g007
Figure 8. % Variation of BTX for all stations considered.
Atmosphere 13 00097 g008
Figure 9. (a) Benzene (b) toluene and (c) xylene daily evolution at different stations during lockdown and reference period. Values expressed in µg·m−3.
Atmosphere 13 00097 g009
Publisher’s Note: MDPI stays neutral with regard to jurisdictional claims in published maps and institutional affiliations.

