
Two Large Earthquakes Registered by the CSES Satellite during Its Earthquake Prediction Practice in China


1
China Earthquake Networks Center, China Earthquake Administration, Beijing 100045, China
2
National Institute of Natural Hazards, Ministry of Emergency Management of China, Beijing 100085, China
*
Author to whom correspondence should be addressed.
Atmosphere 2022, 13(5), 751; https://0-doi-org.brum.beds.ac.uk/10.3390/atmos13050751
Submission received: 17 March 2022
/
Revised: 1 May 2022
/
Accepted: 4 May 2022
/
Published: 6 May 2022
(This article belongs to the Special Issue Lithosphere–Atmosphere–Ionosphere Coupling Processes for Pre-, Co-, and Post-earthquakes)
Abstract
:Two large earthquakes, the Maduo MS 7.4 earthquake and the Menyuan MS 6.9 earthquake, have been successfully recorded on the Chinese mainland, since the data of the CSES satellite were put into service for earthquake prediction work on the Chinese mainland at the end of April 2020. Obvious variations in O+ density and electron density were found during our weekly data processing work during 5–11 May 2021 and 28 December 2021–2 January 2022, respectively. Two warnings of impending events around the anomalous areas within two weeks had been reported immediately after the anomaly appearance. The Maduo MS 7.4 earthquake occurred on 22 May 2021 and the Menyuan MS 6.9 earthquake on 8 January 2022, during these two warning periods. More details were revealed after these two large shocks occurred. Ionospheric enhancement took place on 8 May 2021, with a magnitude of 41.6% for O+ density and 22.2% for electron density, a distance of 680 km from the Maduo epicenter, 14 days prior to the event. Before the Menyuan earthquake, ionospheric enhancement took place on 28 December 2021, as well as during its revisiting orbit on 2 January 2022, with a magnitude of 47.3% for O+ density and 38.4% for electron density, an epicentral distance of 120 km, 11 and 6 days prior to this event. The Kp index was also examined to avoid the influence from solar activities. Despite this, accurate earthquake prediction is not possible due to much uncertainty, such as the correct location and magnitude of an impending event. Thus, long-term practice and comprehensive investigation of the seismo-ionospheric influence are necessary in the future.
1. Introduction
Earth observation from satellites has rapidly developed due to its advantages of fast-speed, large-scale, and high-resolution results, especially for areas with harsh natural conditions. More and more attention has been paid to ionospheric precursors associated with strong seismic activities since the modern satellite-borne receivers were developed, especially after the launch of the DEMETER satellite in 2004 in France, although a record of ionospheric irregularities prior to the 1964 Alaskan earthquake (EQ) was reported as early as 1965 [1]. Akhoondzadeh et al. [2] investigated the seismo-ionospheric influence during three strong EQs: 29 September 2009 in the Samoa islands, an Mw 8.1 EQ; 6 April 2009 in L’Aquila, an Mw 6.3 EQ; and 12 May 2008 in Sichuan, an Mw 7.9 EQ. Their results showed that positive and negative anomalies of the DEMETER ion density and electron density appeared 1 to 5 days before the studied events during quiet geomagnetic conditions, which indicates that these anomalous behaviors were highly regarded as seismo-ionospheric precursors. Stangl and Boudjada [3] reported that ionospheric variations on DEMETER VLF (very low frequency) occurred two weeks before the L’Aquila event. Li et al. [4] summarized ionospheric fluctuations reported in 23 published papers written by 21 authors worldwide on the 2008 Sichuan EQ. They found the anomalous starting time varied from 2 to 30 days prior to the main event, but most of the anomalies (22 among 23 publications) appeared two weeks before, with a magnitude from 20% to 123%.
At the same time, satellite observation has also been characterized by the disadvantages of discontinuous measurement and a measurement depending on local time (LT) in a fixed area. For this reason, it is possible to miss some EQs or catch an incomplete ionospheric temporal-spatial evolution before some events. There has been much statistical work on ionospheric variations associated with strong seismic events using satellite measurements. Pulinets [5] presented obvious seismo-ionospheric disturbances that occurred within a few days in 73% of EQs with M > 5.0 and in 100% with M > 6.0. Statistical analyses have also been performed using DEMETER datasets. A statistically significant decrease in the electrical field during nighttime four hours before the occurrence of EQs has been reported by Němec et al. [6,7] and Píša et al. [8,9]. Zhang et al. [10] found that there were increases in the number of electron bursts prior to strong EQs with a magnitude over 7.0 during the entire operation period of the DEMETER satellite. Statistical analyses were also performed using a total ion density dataset during the DEMETER lifetime (6.5 years) in the epicenter areas of EQs as well as in their magnetically conjugate point areas [11,12,13,14,15,16,17]. These results demonstrated a significant statistical correlation between ionospheric anomalies and large events: I. the detection rate of EQs involved increased as magnitudes increased and hypercentral depths decreased; II. the number of perturbations was higher the day of the EQ and gradually decreased for the days before, and the appearance probability of ionospheric perturbations within one week in the northern hemisphere can be up to 80%; III. on average, the amplitude of the perturbations was related to the magnitude of the EQs, etc. As an attempt at EQ prediction, a positive result was attained by comparing the real position of the epicenter of an impending event with one determined by ionospheric perturbations searched automatically by software. Perrone et al. [18] conducted statistical work on 10 crustal EQs with a magnitude 5.5 ≤ M <6.0 that occurred in Italy during 1979–2009 and reported that the ionospheric precursors spread from the epicenter towards the periphery during the EQ preparation process. They constructed an empirical formula for the seismo-ionospheric disturbances relating the EQ magnitude and the epicenter distance to discuss the probability of EQ prediction but with much uncertainty. So far, it is well established that an ionospheric anomaly tends to appear about two weeks before an EQ but with no specified magnitude and distance.
However, short-term EQ prediction is still one of the most challenging targets in earth science today [19]. There are only a few countries where EQ prediction, especially in the short-term, has really been put into practice. China is one of the most seismically active countries in the world. Destructive EQs pose a major threat to lives and property in almost all Chinese territory. There have been several large EQs on the Chinese mainland in the past 50 years, including the 1975 Haicheng MS 7.3 EQ, the 1976 Tangshan MS 7.8 EQ, the 2001 Kunlun Mountain MS 8.1 EQ, and the 2008 Wenchuan MS 8.0 EQ, which caused extensive damage, and 69,000 people lost their lives. Organized efforts of EQ prediction started immediately after the 1966 Xingtai MS 6.6 EQ in Hebei Province, about 300 km southwest to Beijing. Since then, China has carried out extensive research programs on EQ prediction and application to prevent and mitigate EQ disasters [20].
The CSES satellite has been launched for more than four years, and effective payload data have been primarily put into EQ prediction service in China. So, in this paper, an introduction to the CSES satellite and its daily application are provided in Section 2. The records of the two examples of the 2021 Maduo MS 7.4 EQ and the 2022 Menyuan MS 6.9 EQ that occurred in Qinghai province will be described in detail, respectively, in Section 3 and Section 4. The discussion and conclusions are provided in Section 5 and Section 6, respectively.
2. The CSES Satellite and Its Primary Application in EQ Prediction Practice
2.1. CSES Satellite
The China Seismo-Electromagnetic Satellite (CSES, also called ZH-1) was launched successfully on 2 February 2018. It is the first satellite dedicated to geophysics and is also the first component of the space-borne EQ stereoscopic monitoring system in China [21]. It aims to preliminarily explore the characteristics and mechanisms of ionospheric responses before and after seismic activities, based on real-time monitoring of changes in the state of the space electromagnetic environment [22]. The CSES is a sun-synchronous satellite orbiting at a height of 500 km with a descending node of 14:00 local time (LT), and its revisiting period is 5 days. Eight scientific payloads are onboard the CSES, an electric field detector (EFD), a search-coil magnetometer (SCM), a high precision magnetometer (HPM), a plasma analyzer package (PAP), a Langmuir probe (LAP), an energetic particle detector (HEPP), a GNSS occupation receiver (GNSS), and a three-band beacon (TBB). More details on these payloads can be found in their corresponding literature [23].
The LAP and the PAP are the space plasma in situ detection payloads. The operational modes of the LAP include survey mode and burst mode. The survey mode is used mainly to detect global electron density (Ne) and electron temperature with a sweeping period of 3 s (second), while the burst mode primarily allows detection of key areas over China and within the global main seismic belts with sweeping period of 1.5 s. The PAP measures ion density (Ni), composition, temperature, and flow velocity. PAP has also the same operational modes as that of LAP but with a higher resolution of 1 s for survey mode and 0.5 s for burst [23,24].
Since the CSES satellite was launched, an increasing amount of literature has been published on the achievement of data availability [25,26,27], EQ case studies [23,28], seismo-ionospheric statistics [24,26,29], a global geomagnetic field model [30], ionospheric events, such as magnetic storms [31,32] and so on. It has been reported that the ion density measures reduced absolute values due to the contaminated sensors on PAP payload one month after the CSES launch [33]. However, the relative variations of the O+ data have been investigated, and positive results have been obtained [24,26,30].
2.2. Application of CSES Data
The CSES ion (O+) density and electron density data were put into service as candidates for EQ precursory searching work in China at the end of April 2020, after a series of running tests and data calibrations. Data utilized here are available online: https://www.leos.ac.cn/ accessed on 1 March 2022 with the time resolution of 1 s for O+ density and 3 s for electron density. We know there are some disadvantageous factors during seismo-ionospheric response discrimination, such as the ionospheric anomaly surrounding the equator and the South Atlantic Magnetic Anomaly (SAMA). Fortunately, the Chinese mainland is located within the low-mid latitude in the northern hemisphere, an advantageous area to detect EQs, and the appearance probability of ionospheric perturbations within one week could up to be 80%, although with a lower detection rate [14,15].
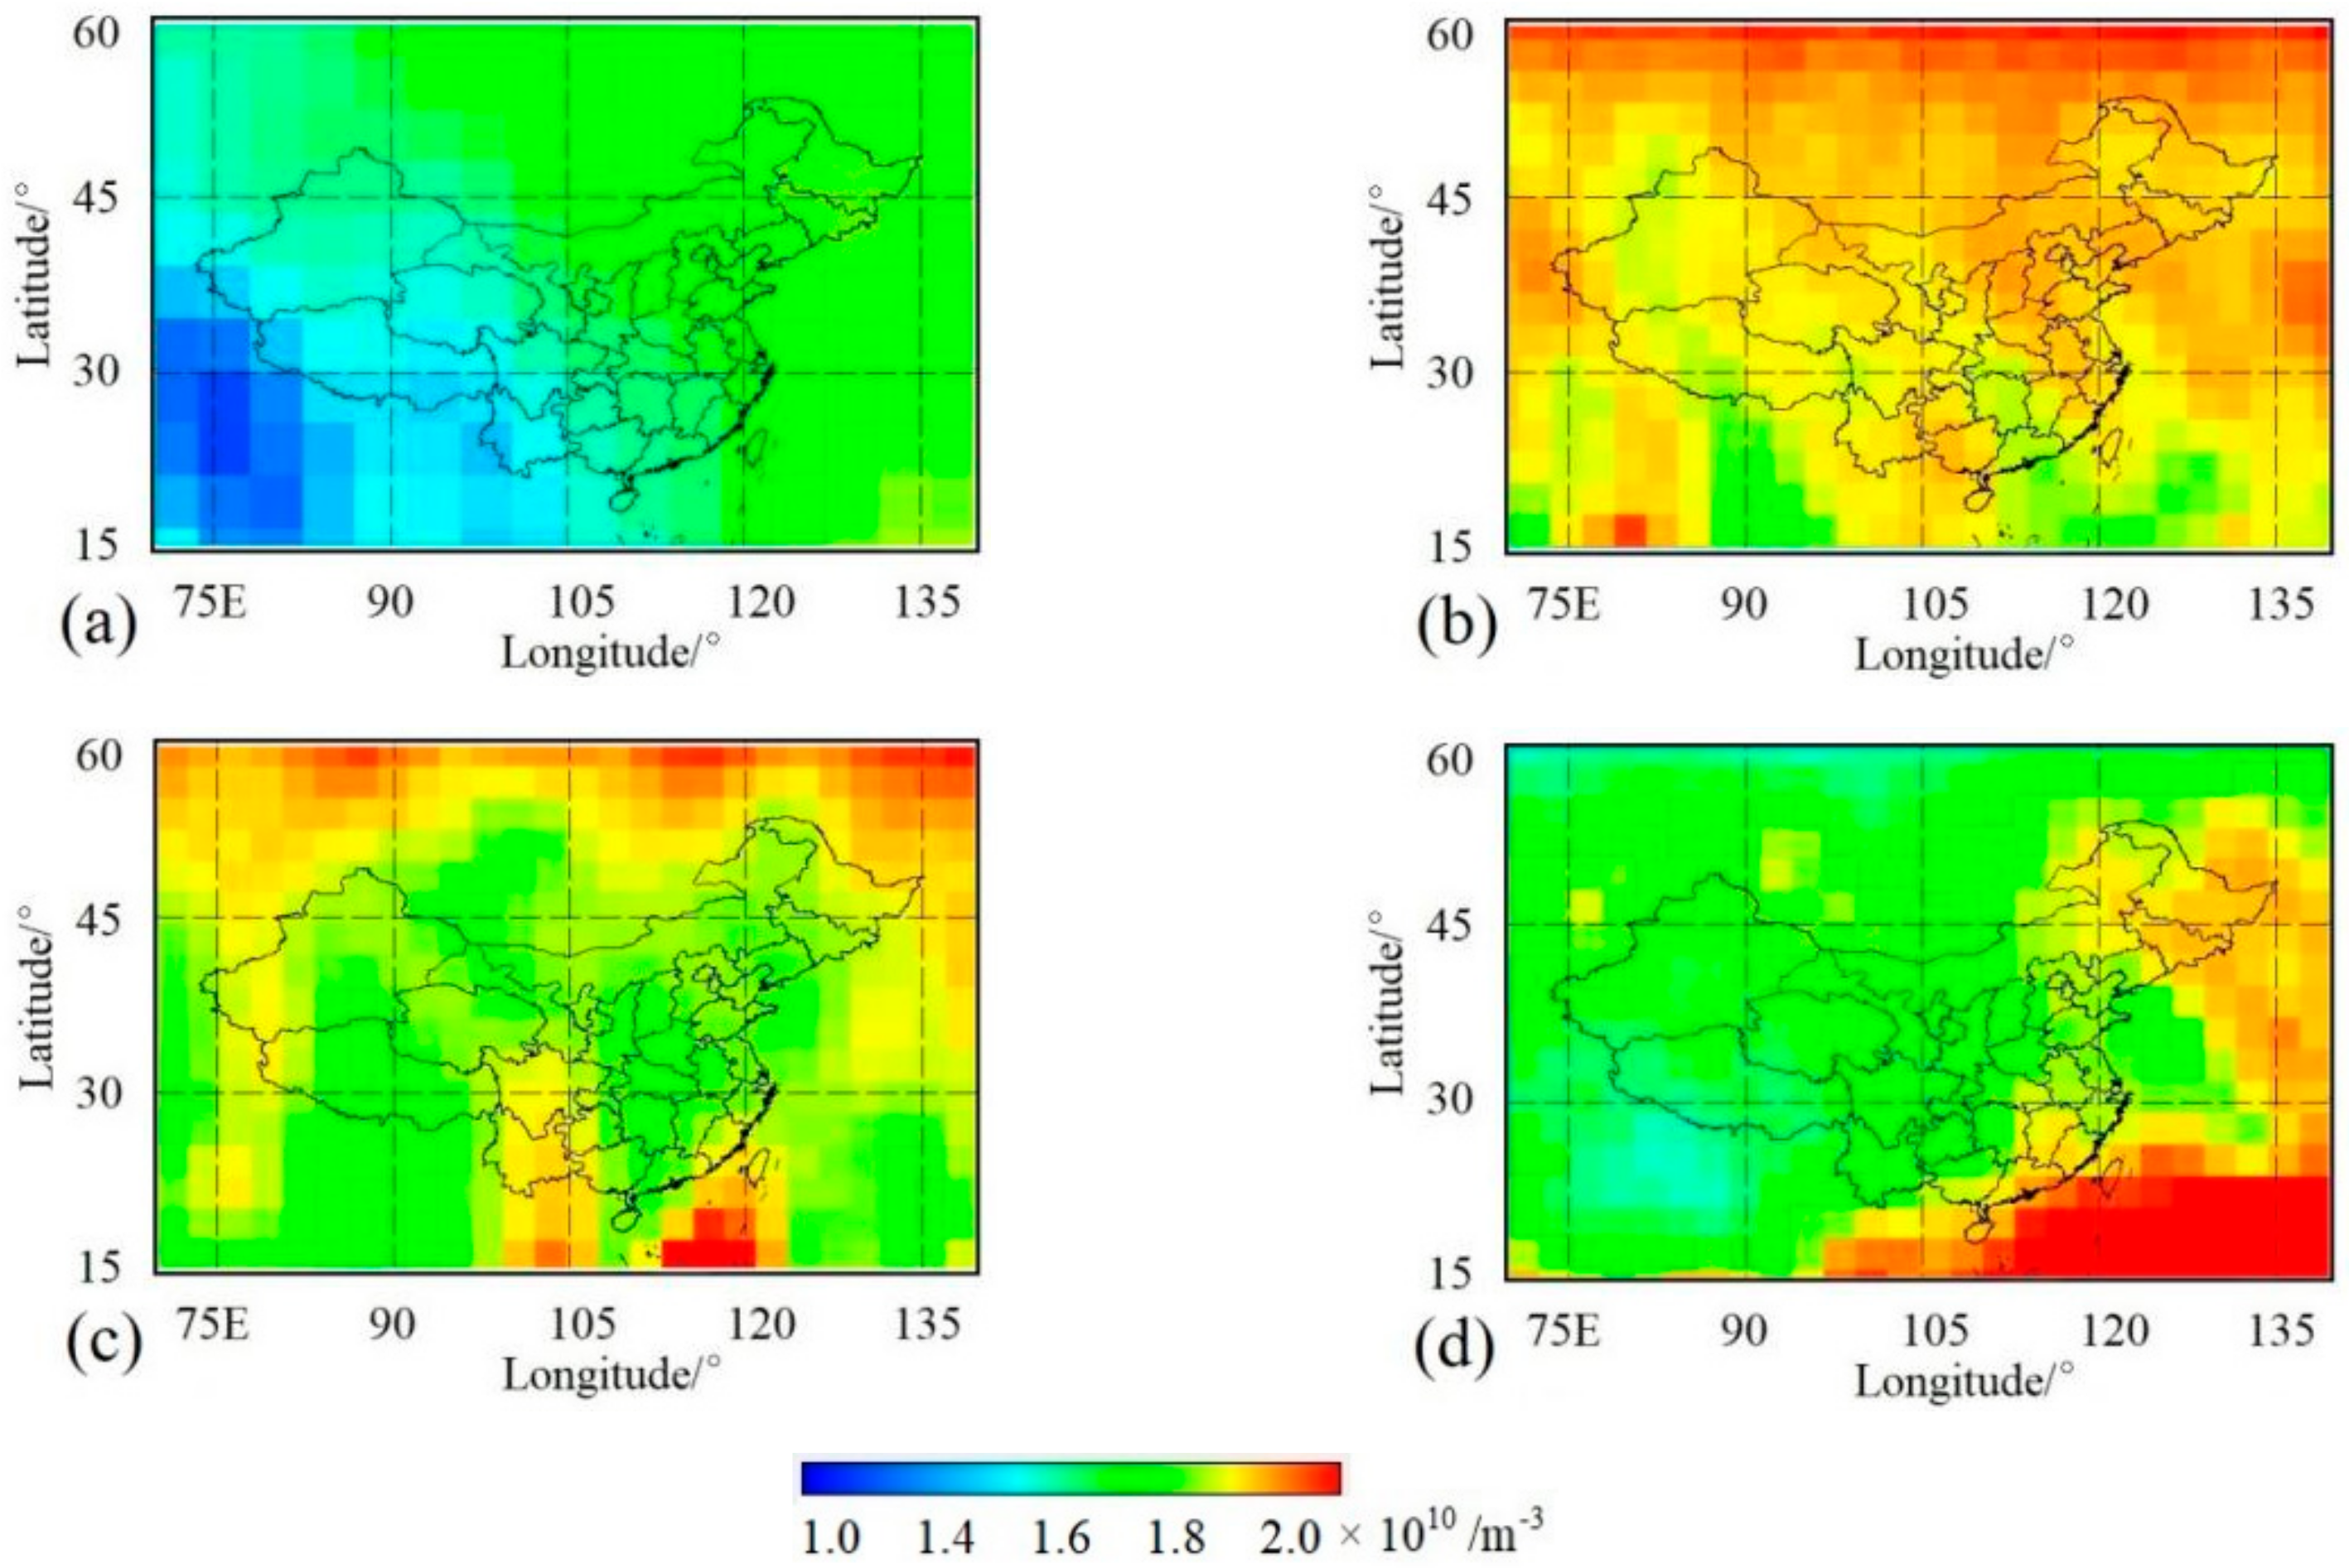
We also examined the seasonal background variations in ionospheric parameters, such as O+ density. Figure 1 shows the averaged seasonal ionic changes at night on the Chinese mainland with a 2° × 4° grid in latitude and longitude, and the daily Kp index available online: http://isgi.unistra.fr/data_download.php accessed on 1 March 2022 remained below three during 2020. It is well known that China is located at the middle latitudes of the northern hemisphere, where with a low ionospheric background, the total fluctuation of the ionosphere is relatively stable. The strengthening of the sun in the summer can induce corresponding ionospheric perturbations compared with the spring, which leads to a higher background value in the summer as shown in Figure 1a,b. In addition, there is a relatively high ionospheric area in northern China corresponding to a geomagnetic anomaly [34].
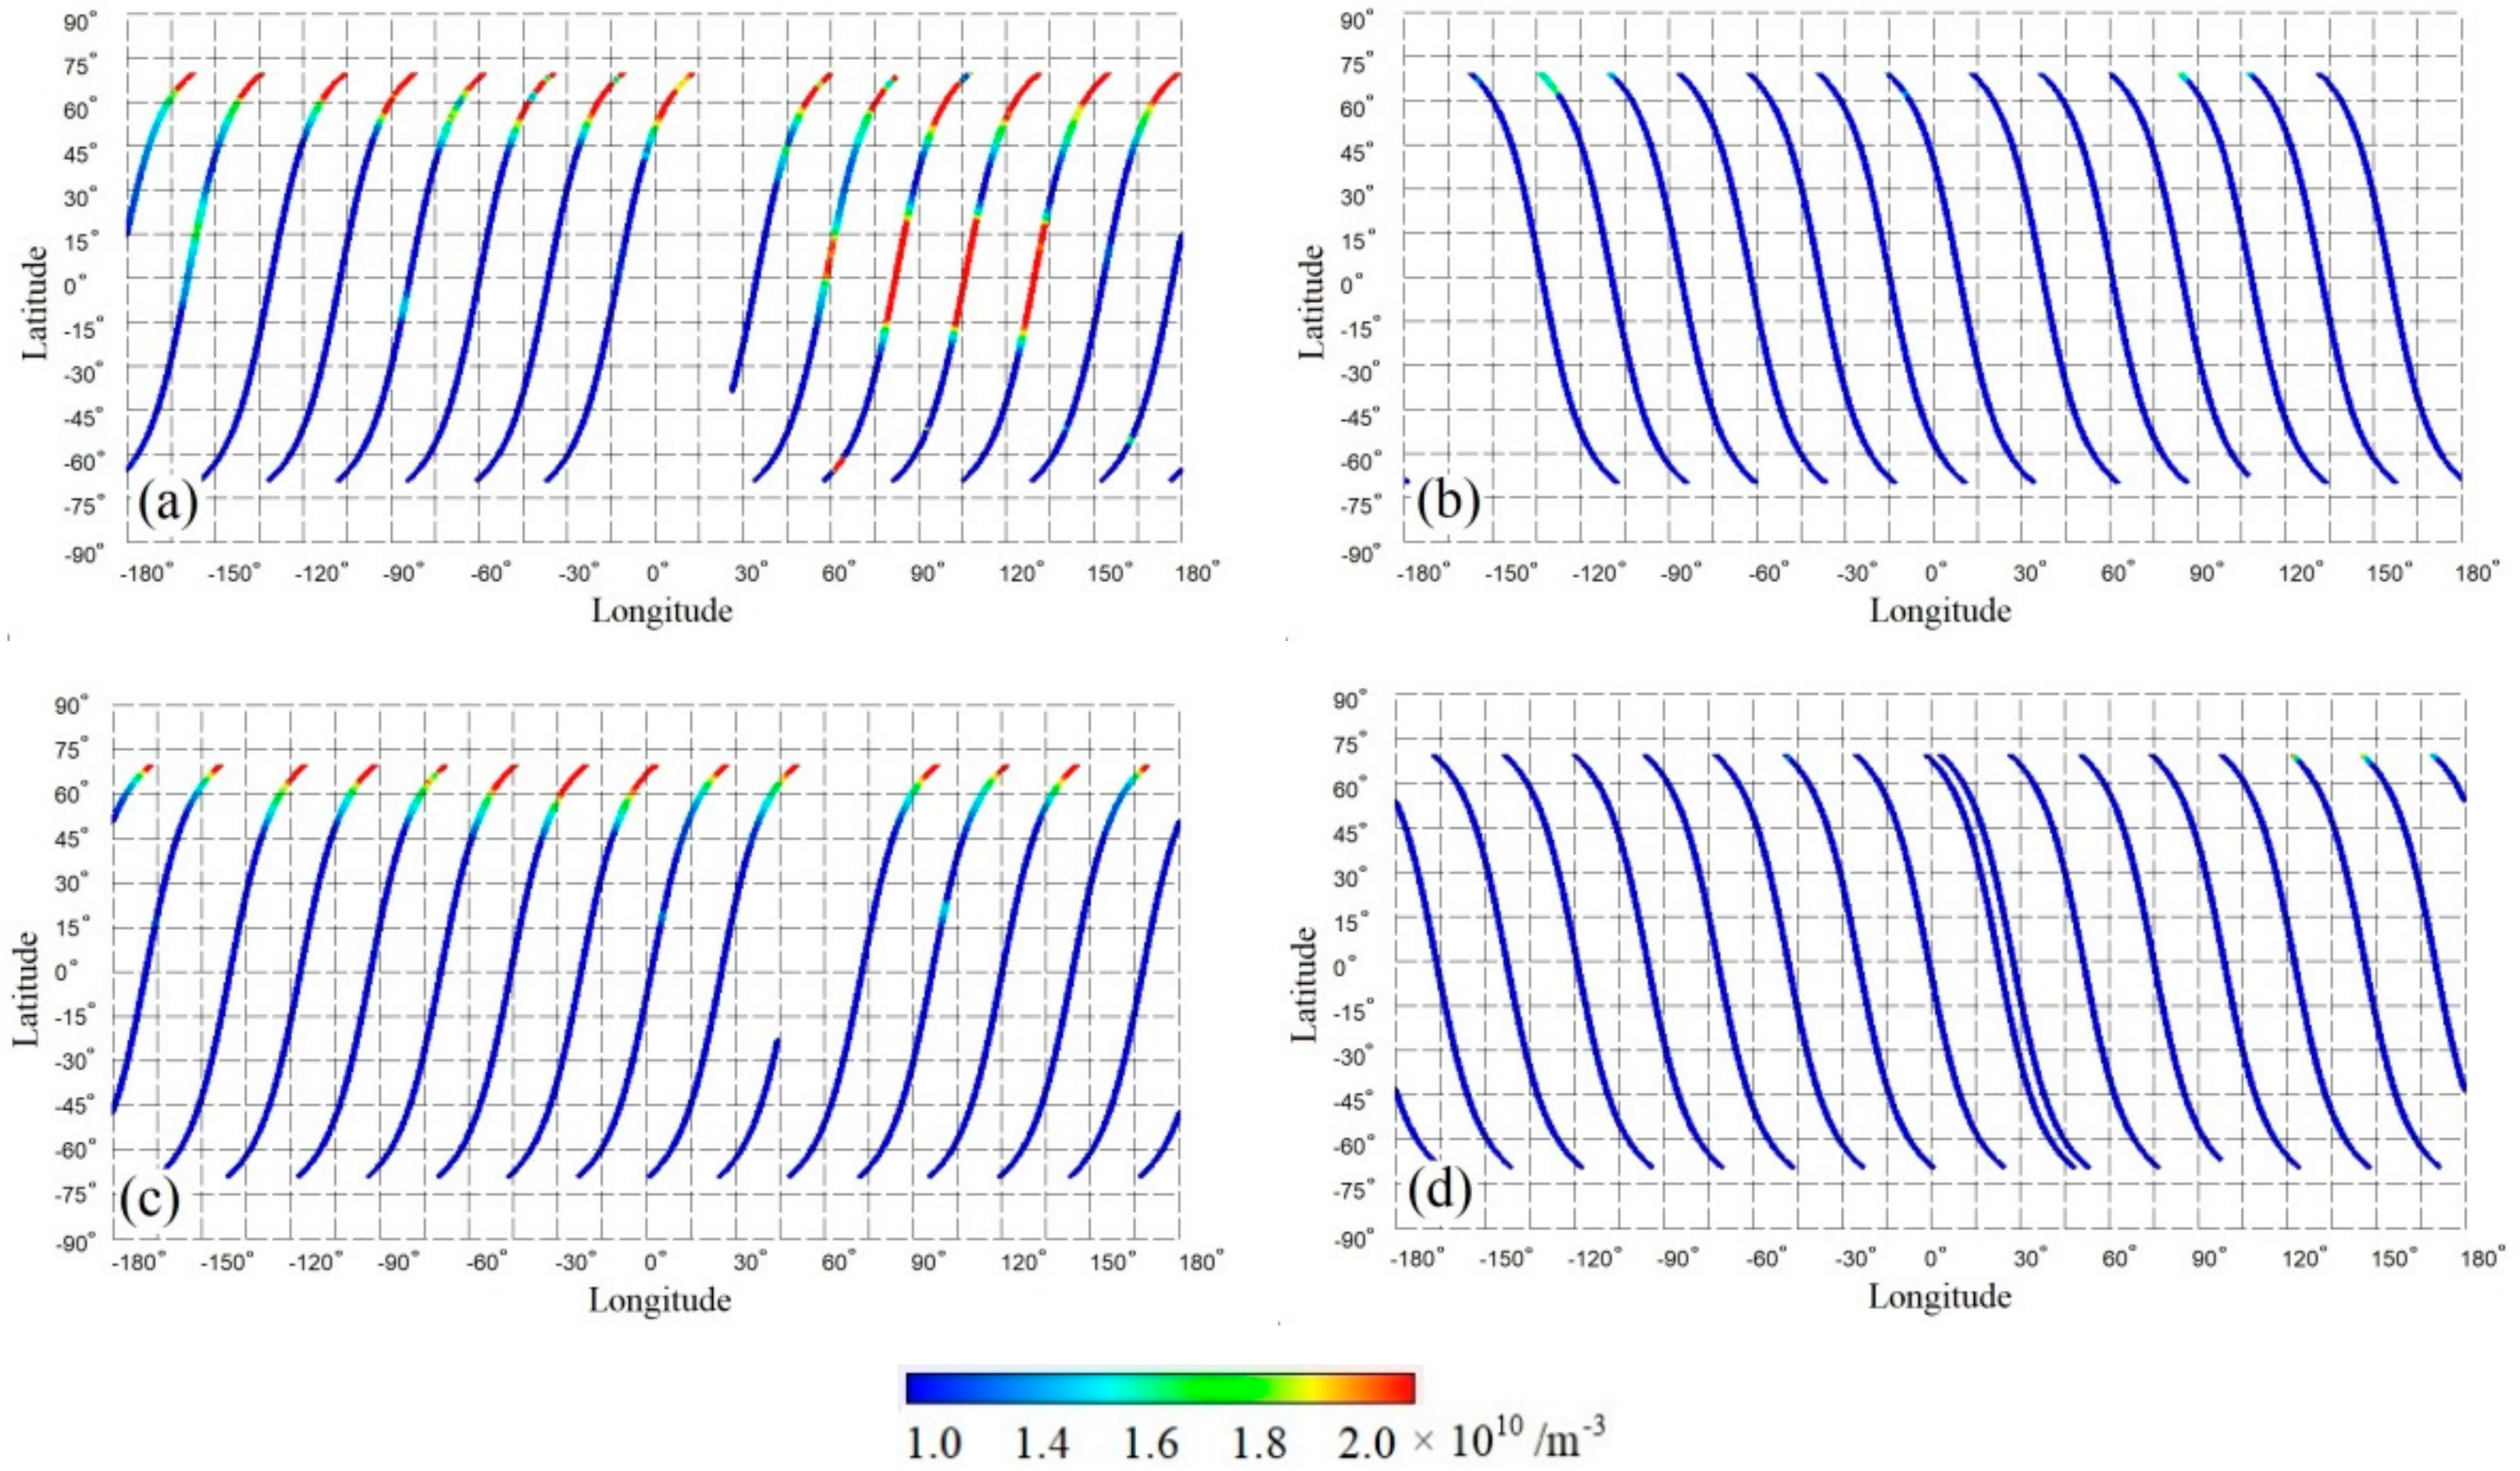
However, the Kp index is an important parameter we have to consider, aiming to avoid the global effect on the ionosphere from solar activities. A strong magnetic storm occurred on 26 August 2018, an example that illustrates this issue. The CSES recorded this event comprehensively. Figure 2 exhibits the fluctuations in the Kp index from 20 to 31 August 2018. One can see clearly from Figure 2 that a strong magnetic storm occurred on 26 August 2018, and its Kp index was up to seven. This enhanced event had a strong influence on the ionospheric densities. Figure 3 comparatively displays the variations in the ion density recorded on 26 and on 24 August 2018. Figure 3 shows that the ionosphere can register more effect from solar activities during the daytime than the nighttime (see Figure 3a,b). Compared with the magnetic quiet period, ionospheric irregularities can gain strength when a strong magnetic storm occurs (See Figure 3). Thus, only nighttime data were utilized during our daily use in order to avoid the influence from solar activities. If the daily averaged Kp index was equal to or more than 3 and the 3-hourly averaged Kp index was more than 4, the corresponding data were usually eliminated. However, we usually accepted all data if the number of days with Kp ≥ 3 was more than 2 in order to keep the completeness of the data (considering the 5-day revisiting period of the CSES satellite). Of course, an ionospheric anomaly appearing during this time is less reliable.
We process the data week by week in order to keep the rhythm of a weekly consultation of the EQ prediction work. Four pictures (one month’s data) are usually exhibited once a week; however, an ionospheric anomaly is valid only within the next two weeks once an anomaly is presented, referring to the seismo-ionospheric results obtained by previous work [6,7,8,9,11,12,13,14,15,24]. The relative variations in ionospheric parameters are generally checked. It is usually considered to be an anomaly if the observed value is higher than 3.0 × 10¹⁰ m–3 for ion density and 2.0 × 10¹⁰ m–3 for electron density, with a little variation sometimes.
At the same time, if the two parameters of ion density and electron density record abnormities simultaneously, we consider these varieties are more available. However, variations in southern China usually gain less attention due to their locations near the equator, where ionospheric parameters vary strongly, and where there are magnetically conjugated areas of the Sumatra, where strong seismic activities occur frequently. At the same time, transformations in the magnetically conjugated areas of the Chinese mainland are usually also paid less attention due to the different seasonal ionospheric various backgrounds of the two opposite hemispheres.
Complying with these rules, two strong events occurred during the CSES data application in searching for EQ precursors, as presented in the following parts.
3. The 22 May 2021 Maduo MS 7.4 EQ
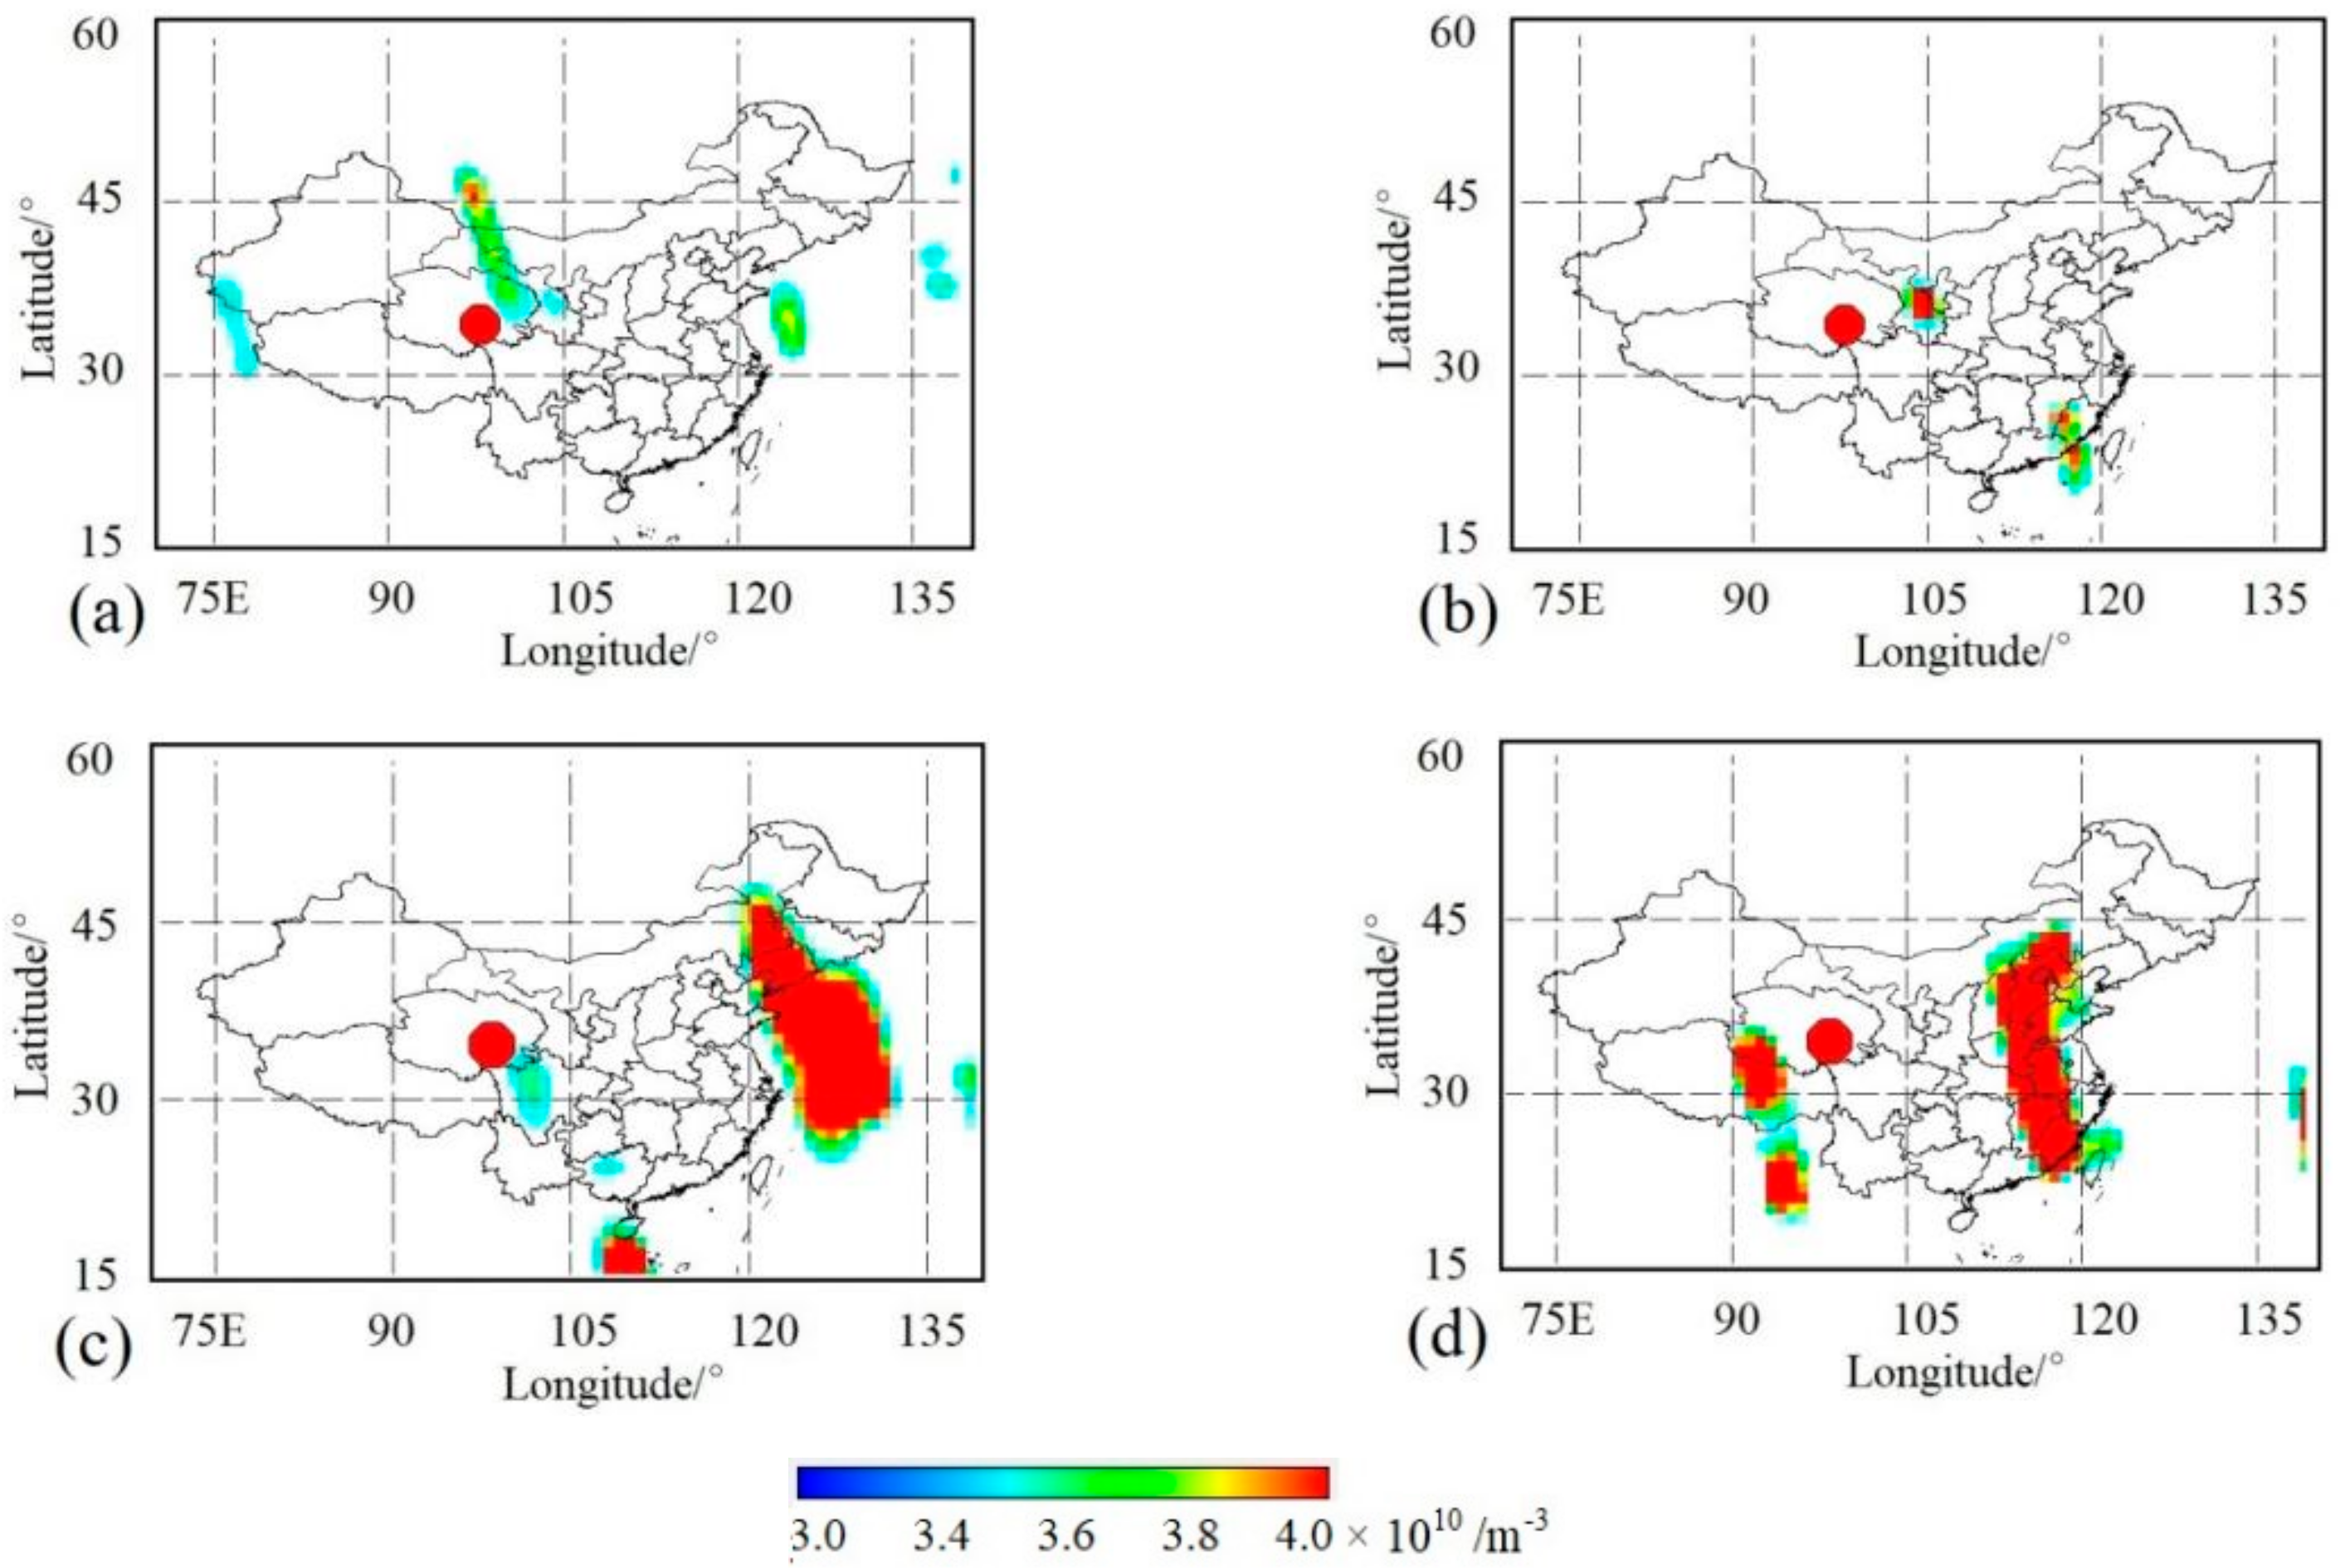
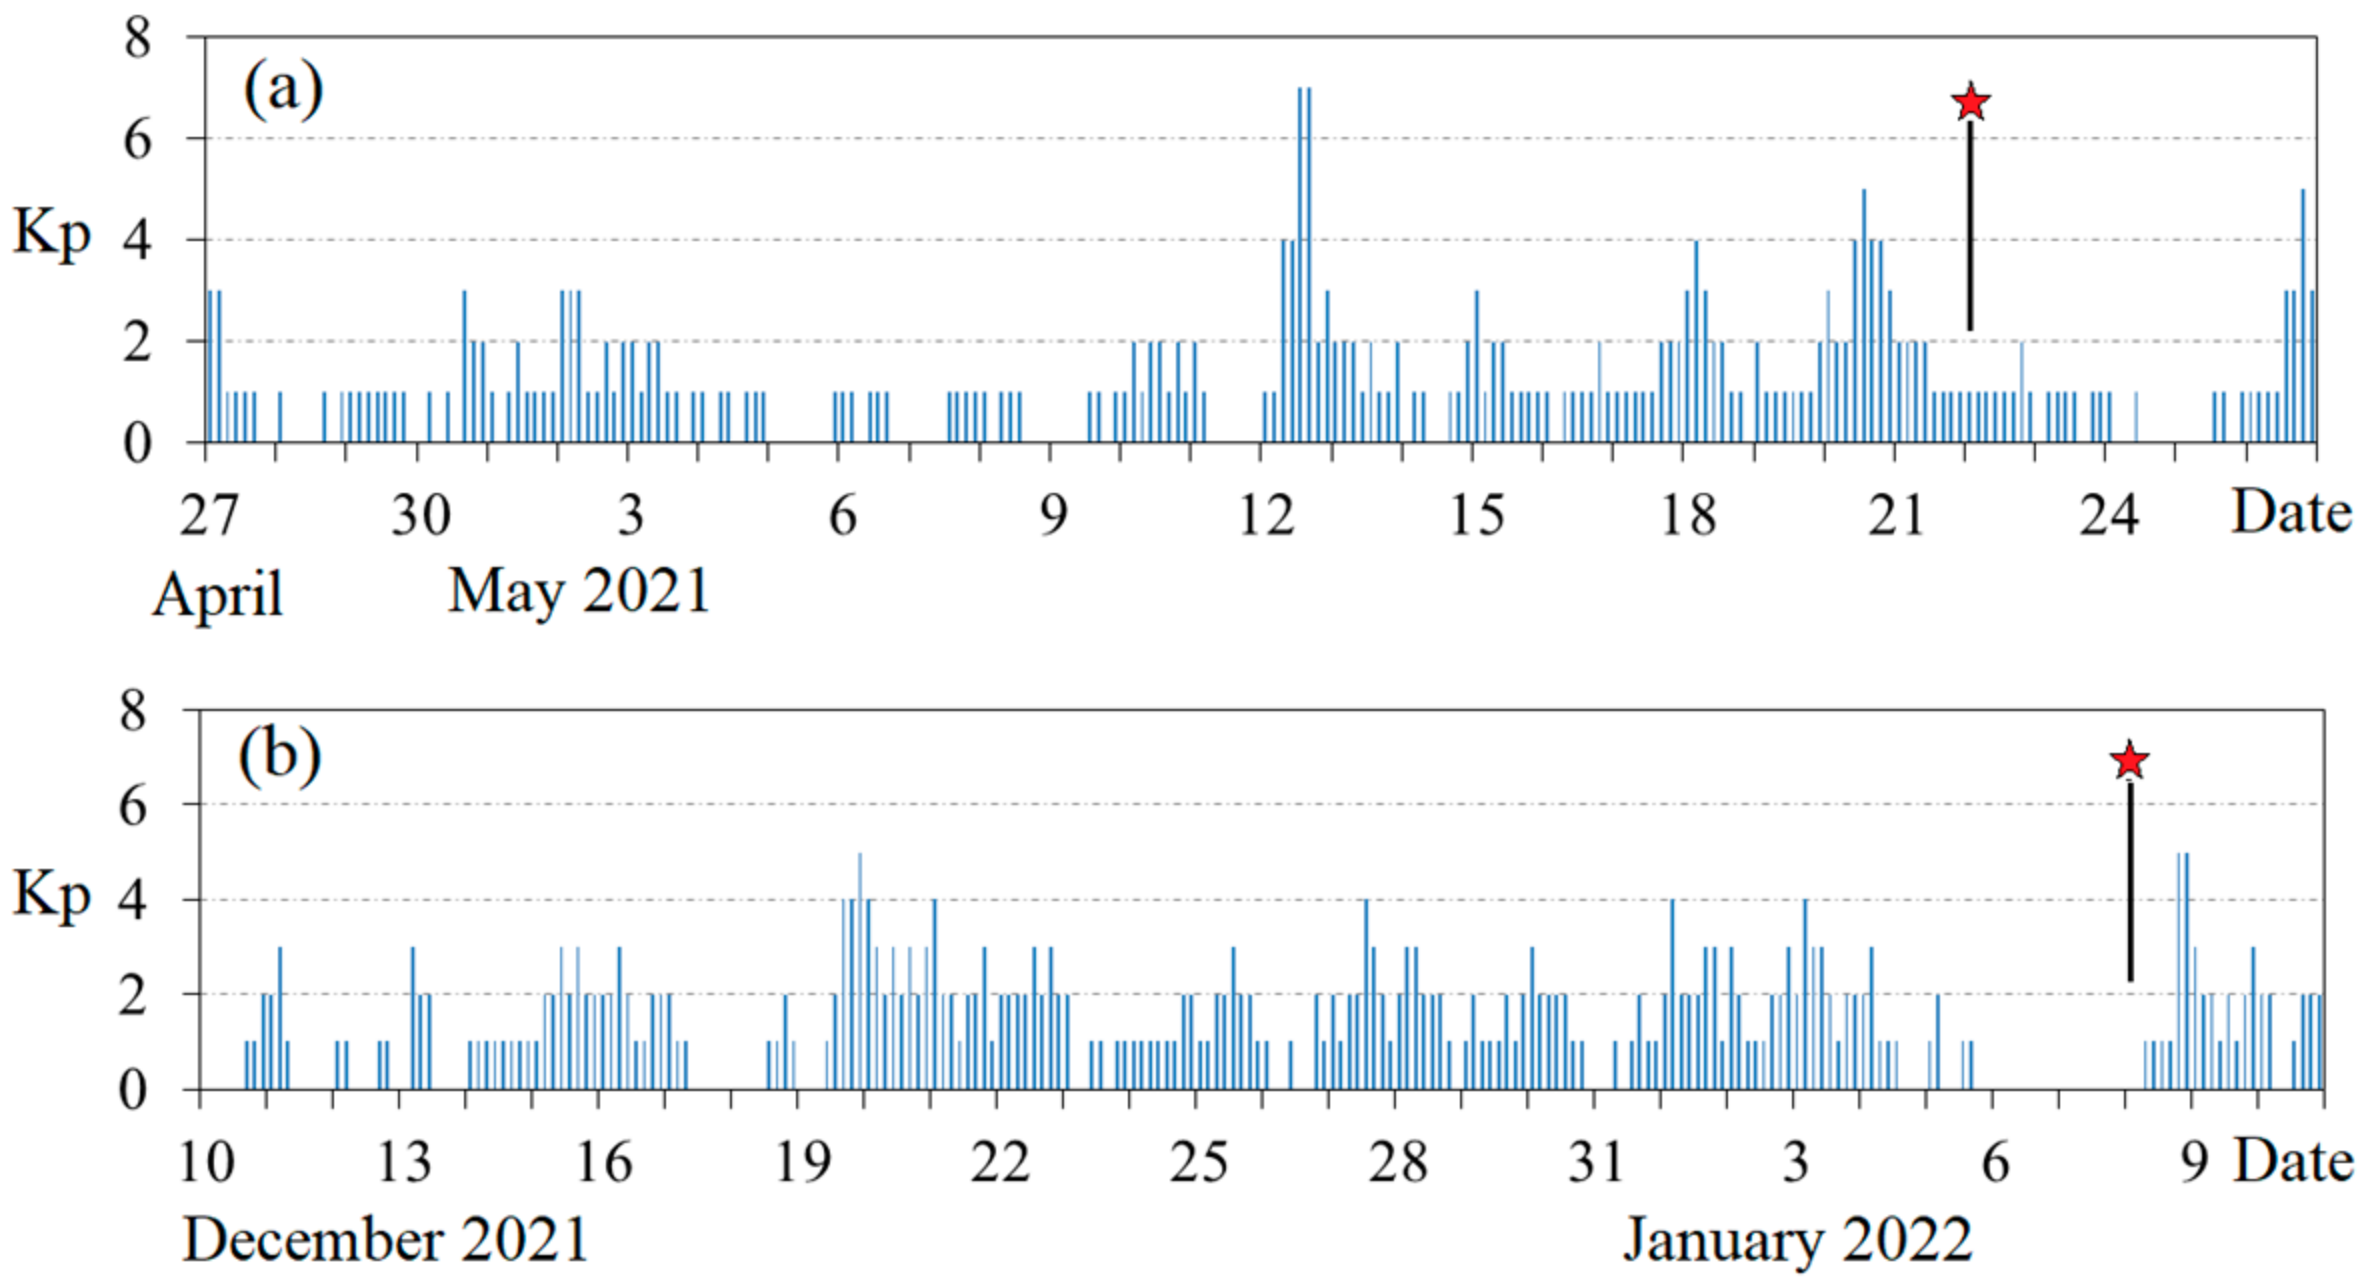
In order to illustrate clearly, Figure 4 and Figure 5 display, respectively, the weekly ionic and electronic variations at nighttime on the Chinese mainland thoroughly covering the period of the Maduo event on 22 May 2021. The related data of 12 May 0:00–6:00 AM, 18 May, and 20 May were eliminated during data processing due to a Kp index equal to or more than 3 in these periods, referring to Figure 6a.
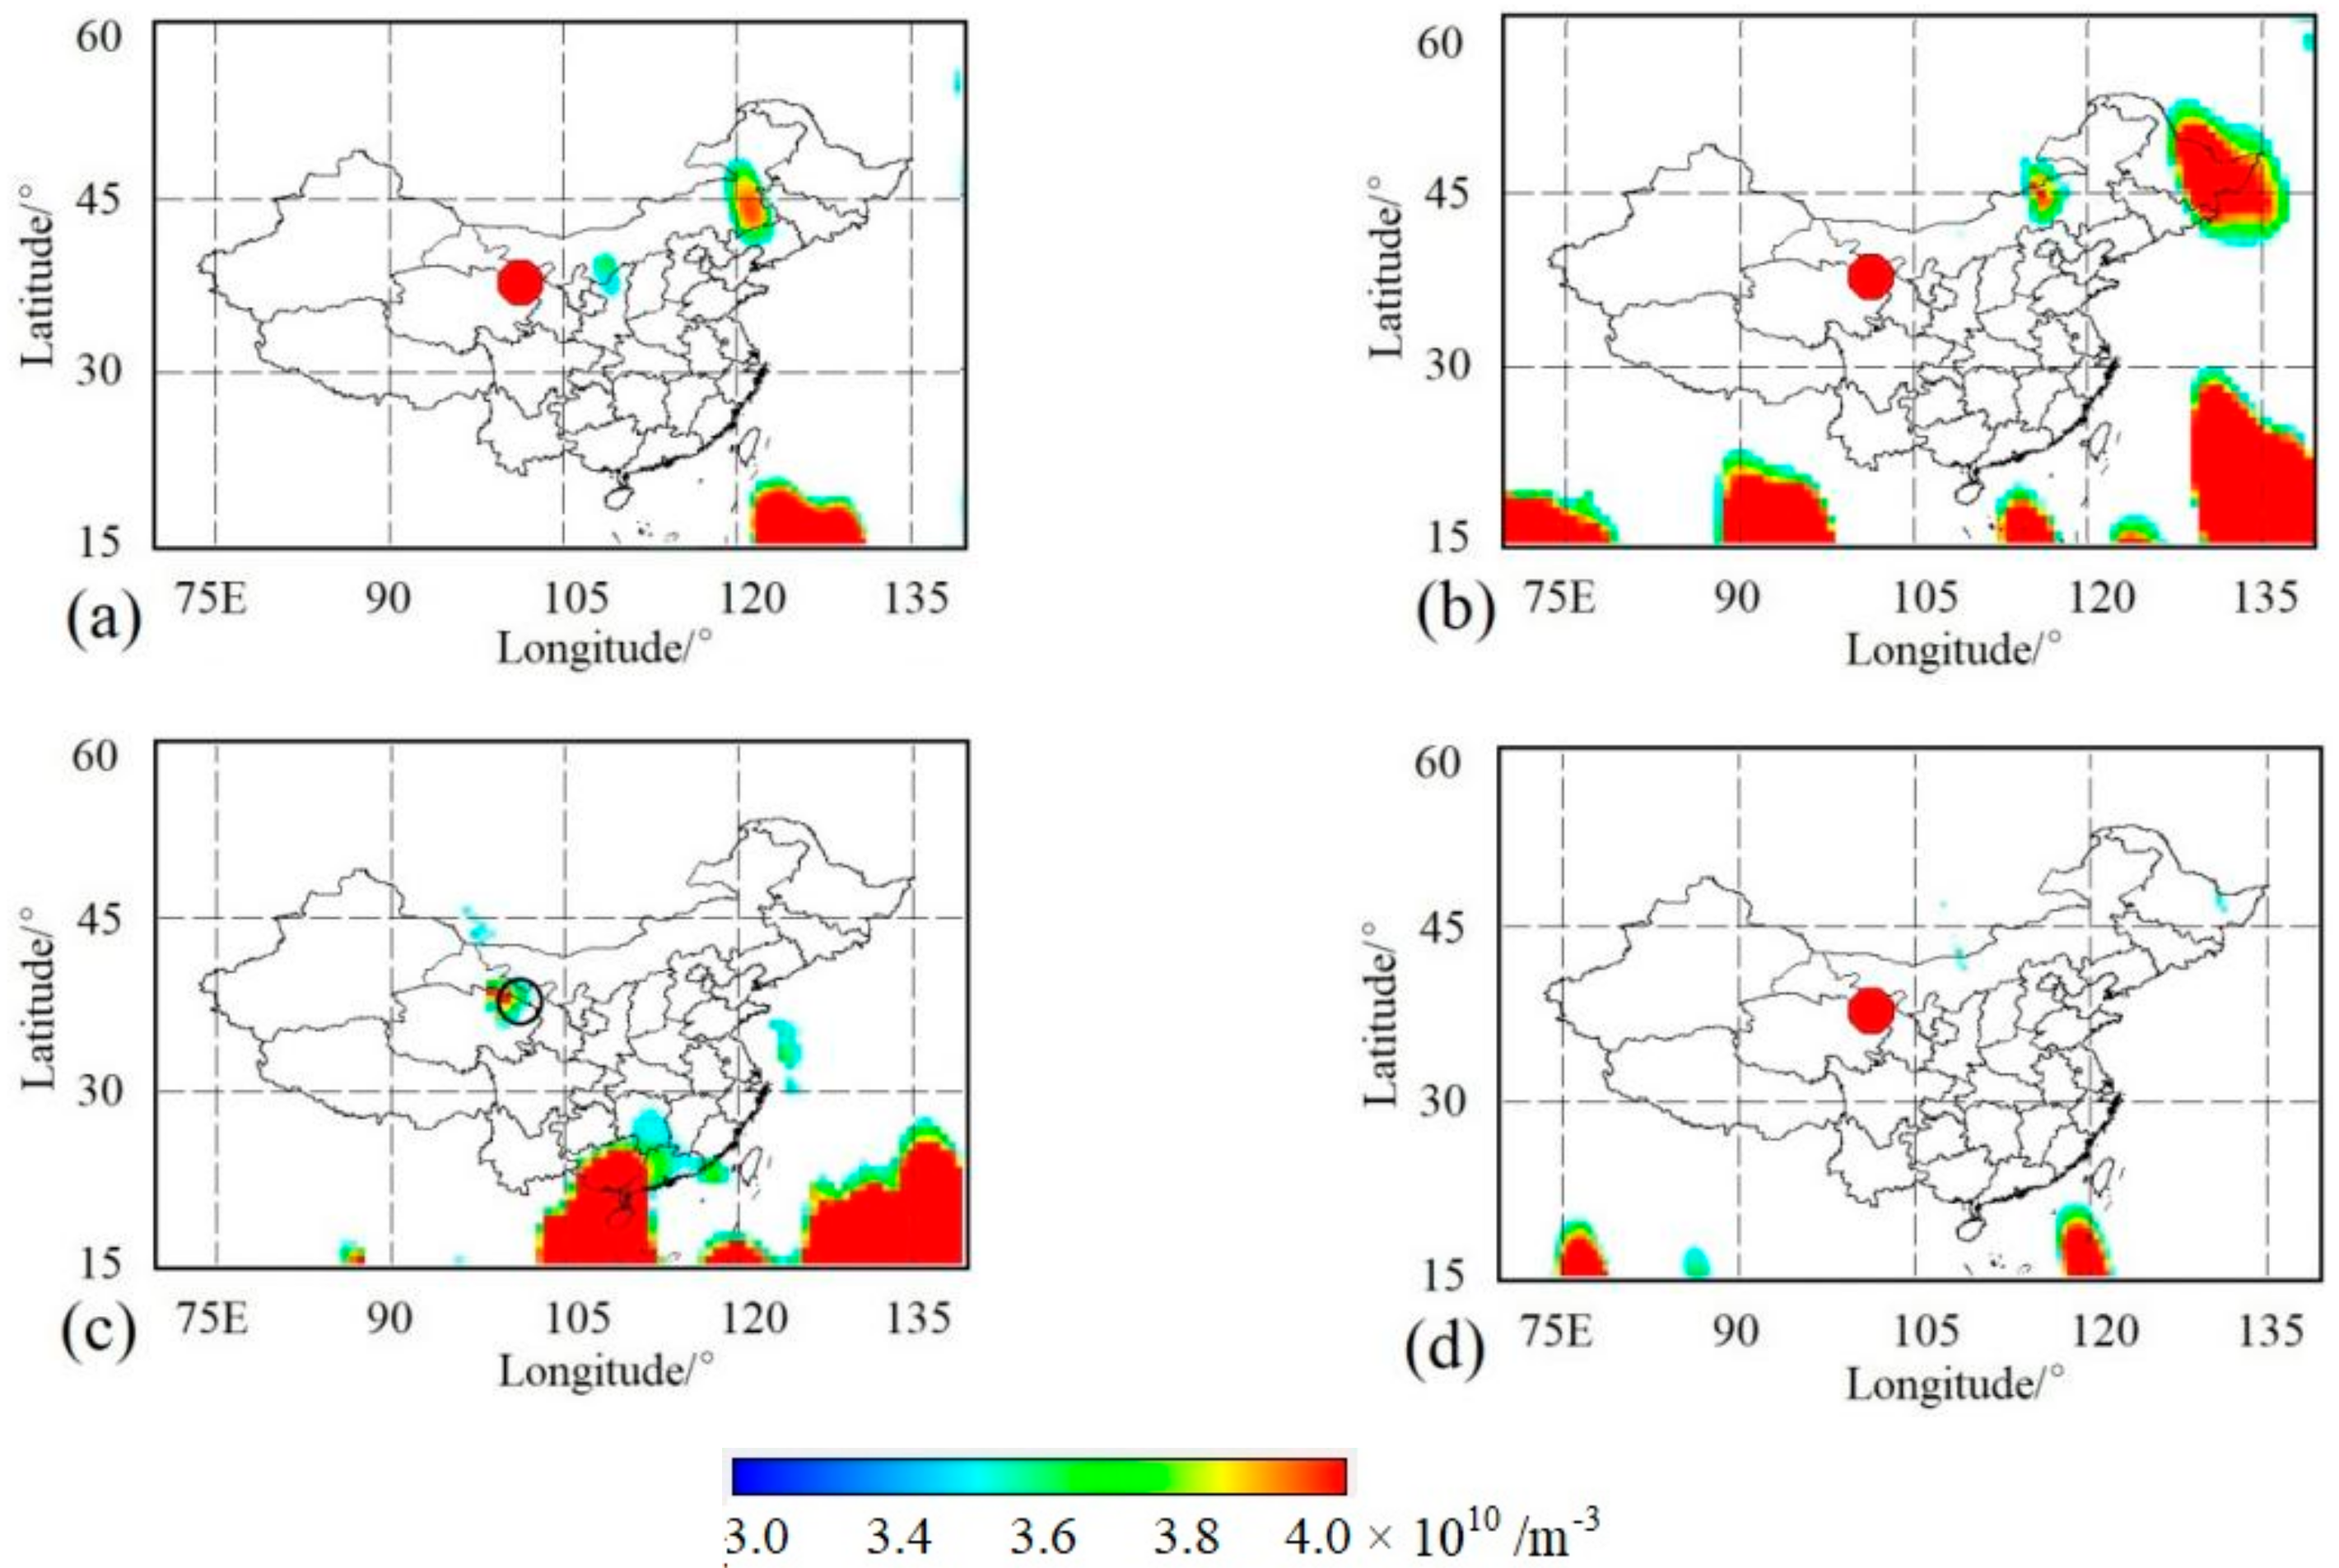
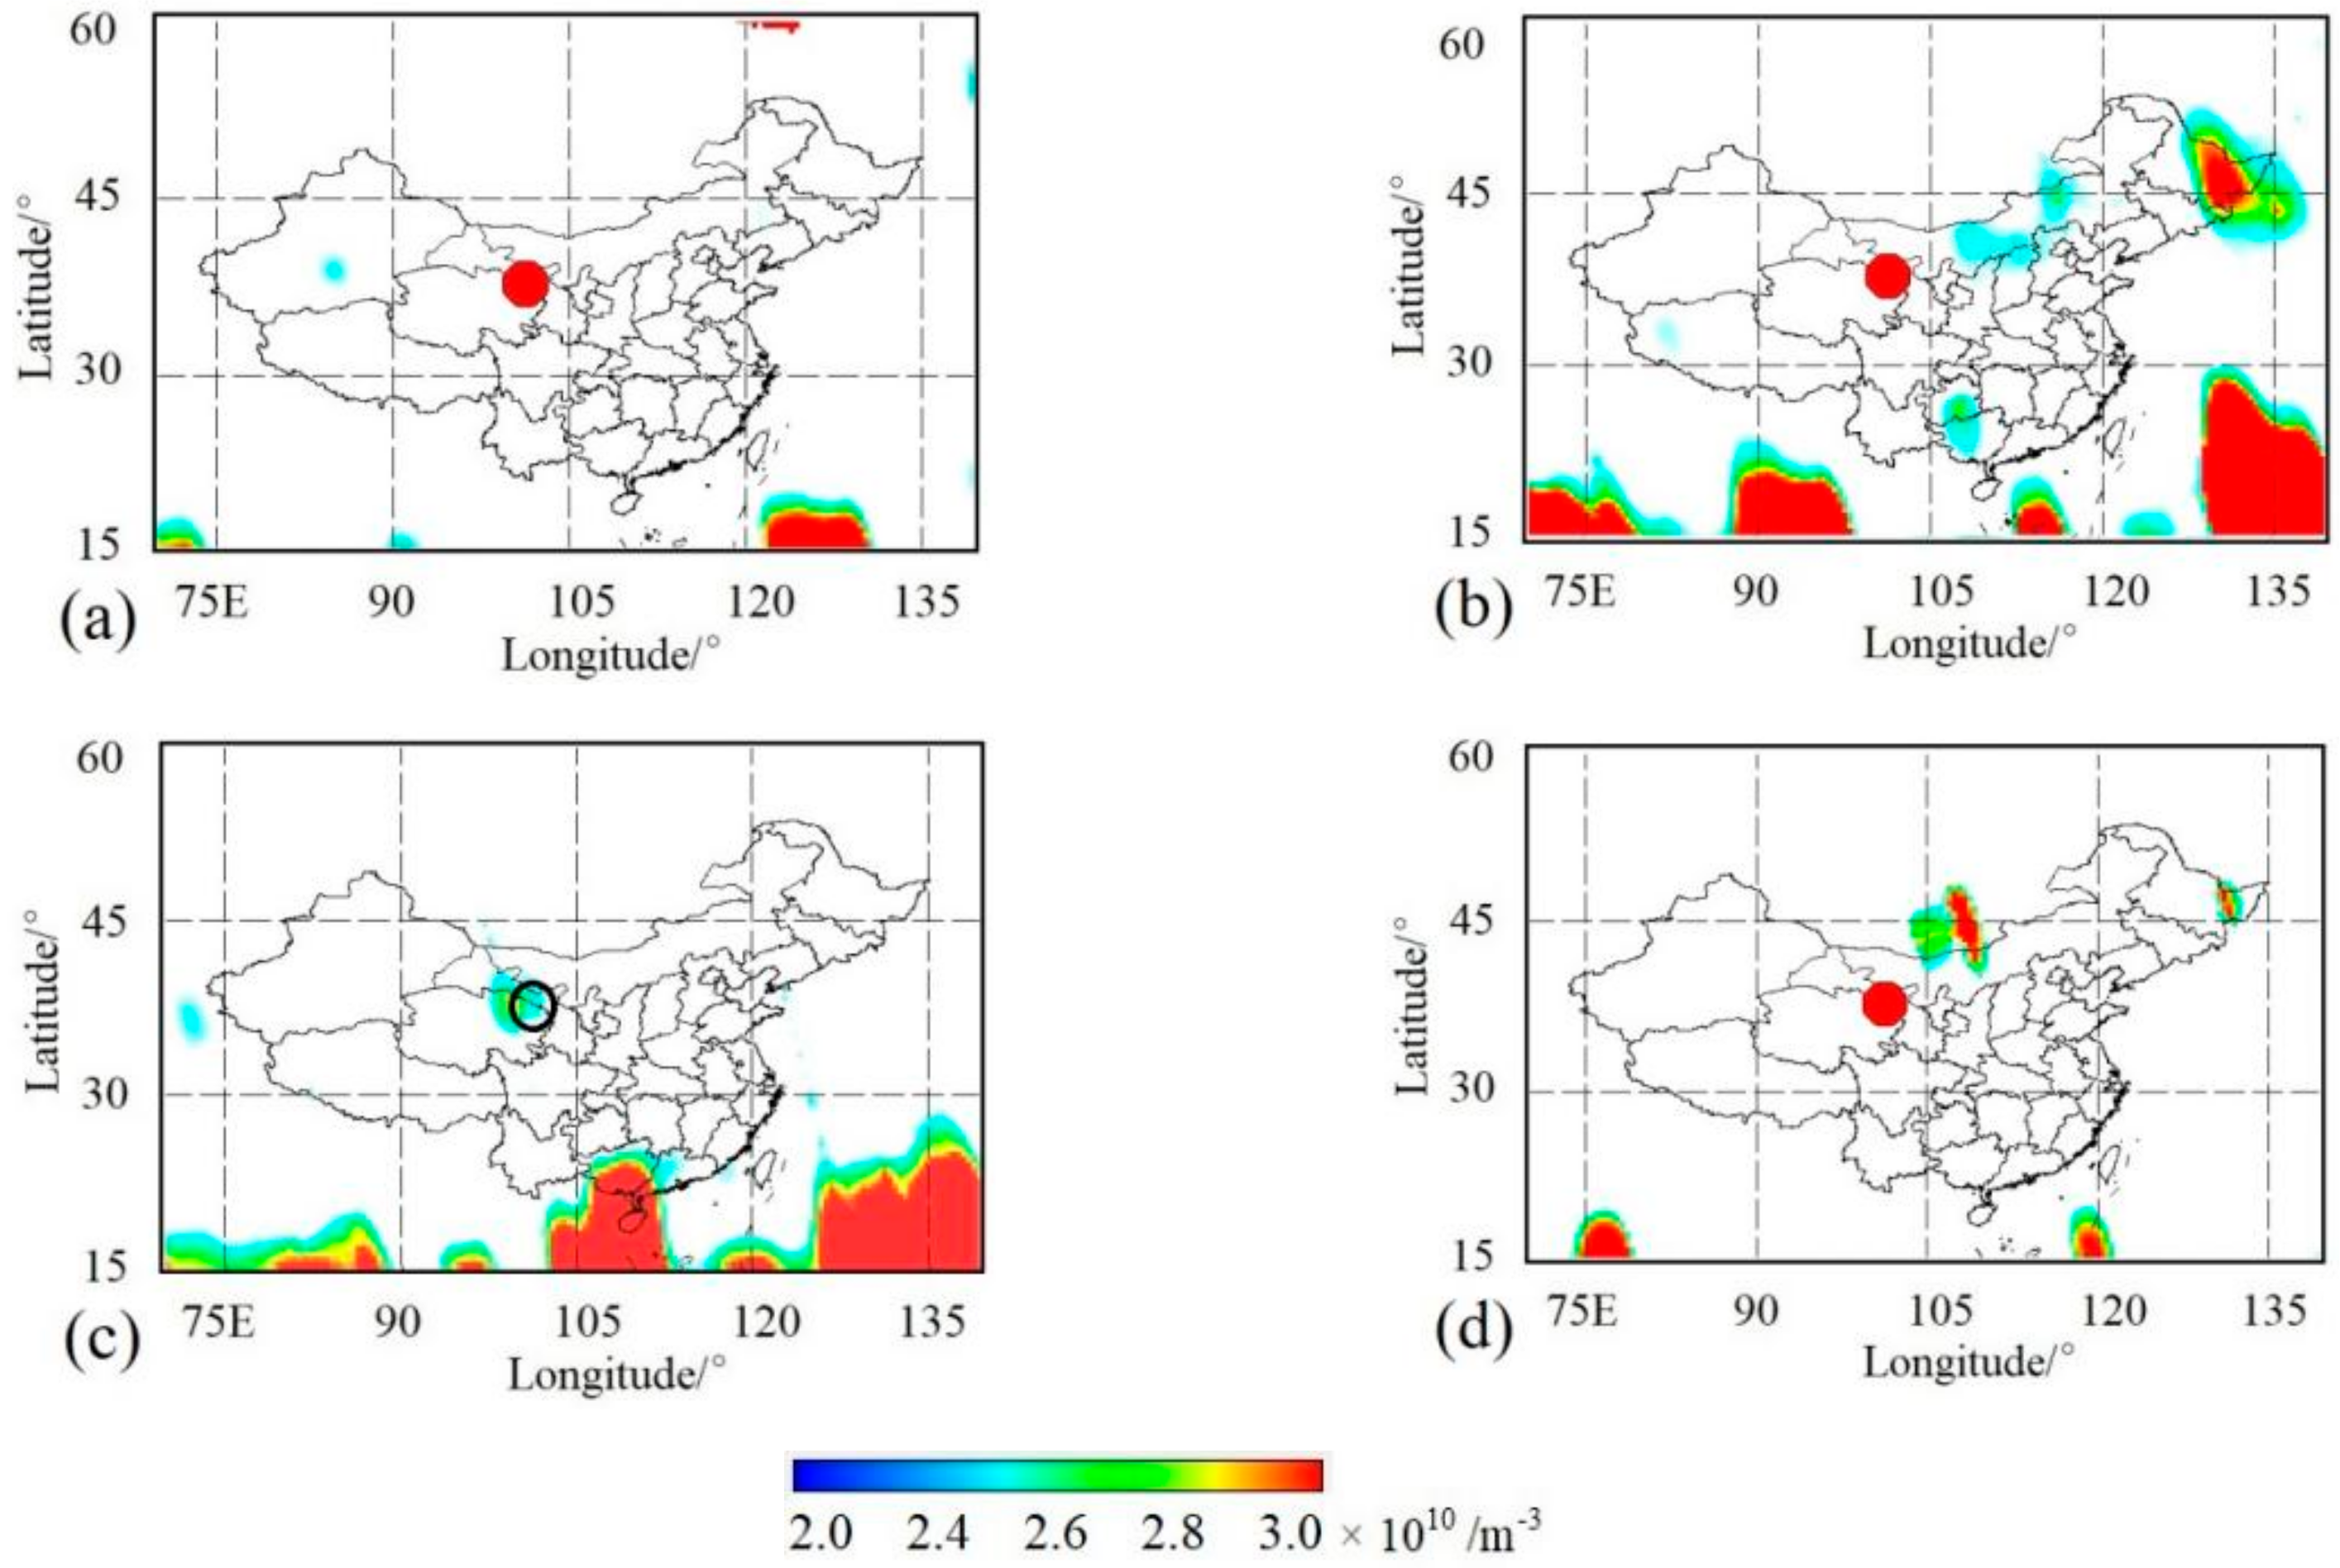
Figure 4a and Figure 5a present the changes in these two parameters of all orbits covering the Chinese mainland from 28 April to 4 May 2021, three weeks before the Maduo EQ. It is clear that there was an enhancement either on the ion density or on the electron density near the epicenter of the impending event (see Figure 4a and Figure 5a). However, we did not pay attention to these variations at that time, because similar variations also occurred in other broad areas with similar latitudes (see Figure 4a and Figure 5a). We usually treat these kinds of changes as less important in our daily data processing work. The fluctuations we noted were the ones that appeared 5–11 May 2021, and they are presented in Figure 4b and Figure 5b for ion density and electron density, respectively. These two obvious anomalies were of typical character. They were collective and obvious in our focus area. In addition, the ionic abnormity and the electronic abnormity occurred simultaneously in the same area in a solar quiet period, but there were none in other areas (see Figure 4b and Figure 5b), which gained more probability as EQ precursors. So, we suggested that there would be strong seismic activities in the surrounding area of the anomaly within two weeks, but we could not specify a magnitude and a location for the impending event. However, we could not find continuous abnormities appearing in this area over the next two weeks, although there were also simultaneous variations in these two parameters on the Chinese mainland due to the same reason shown in Figure 4a and Figure 5a (see also Figure 4c,d and Figure 5c,d). One difference is that the obvious wide anomalies in the north of China shown in Figure 4c,d and Figure 5d were possibly associated with the high background ionospheric variations described in Figure 1.
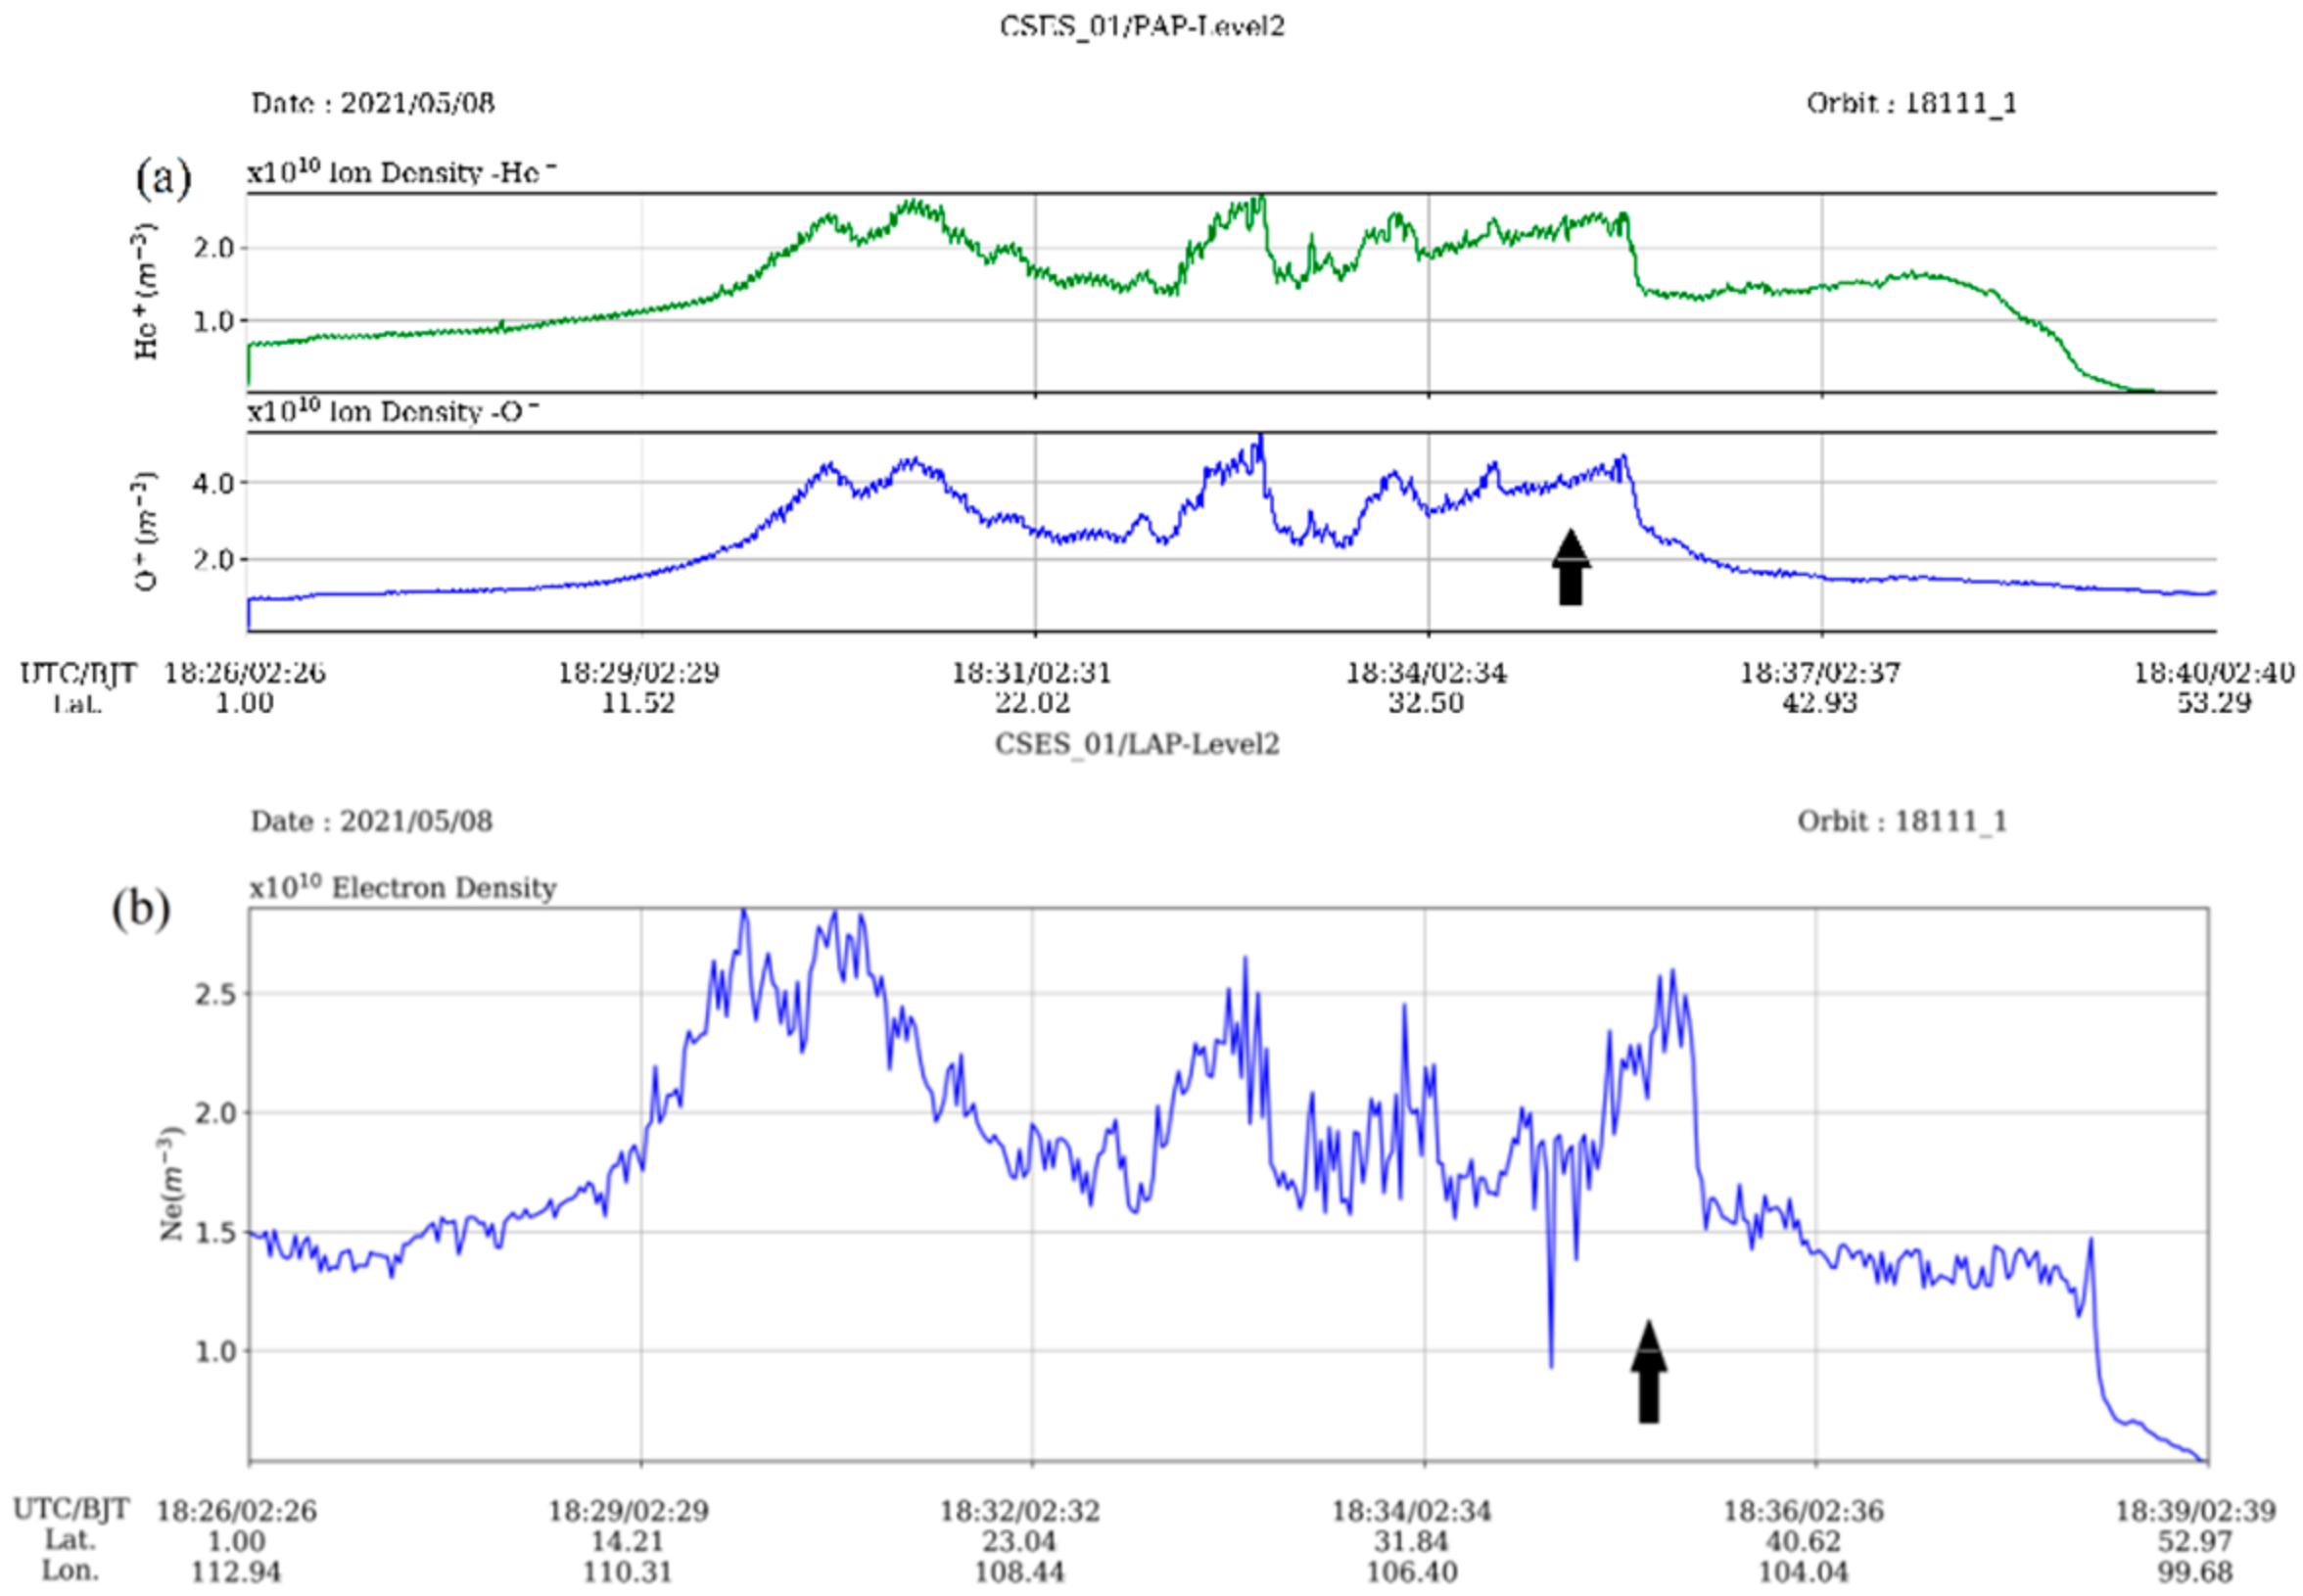
A large EQ with a magnitude MS 7.4 occurred on 22 May 2021 in the Maduo area, Qinghai province, with an epicenter located at 34.59° N and 98.34° E and a depth of 17 km, within two weeks after the obvious ionic and electronic variations recorded by the CSES satellite occurred during 5–11 May 2021. After the event, we retroactively investigated and revealed more details about this EQ and related ionospheric information to confirm their relationship. On the one hand, the right orbit where the anomaly occurred was specified as 18111_1 (orbit_suborbit), and it was formed on 8 May 2021, 14 days prior to the Maduo event. Figure 7 displays the corresponding variations of (a) the He+ and O+ densities and (b) the electron density automatically recorded by the system software. An automatic search method utilized by Li and Parrot [13] was also performed on these perturbations, and the corresponding peak occurred at 37.5° N and 104.8° E with an enhancement of 41.6% for O+ density and 22.2% for electron density, and a persistent distance of 322 km and 525 km, respectively. The changed percentage of an ionospheric parameter can be calculated by using the value corresponding to the peak time, subtracting the background value, and then dividing the background value. This peak was 680 km away from the epicenter of the Maduo event. We also examined its revisiting orbits 18187_1 and 18263_1 near the Maduo EQ and found no obvious disturbances of related ionospheric parameters as shown in Figure 4c and Figure 5c.
4. The 8 January 2022 Menyuan MS 6.9 EQ
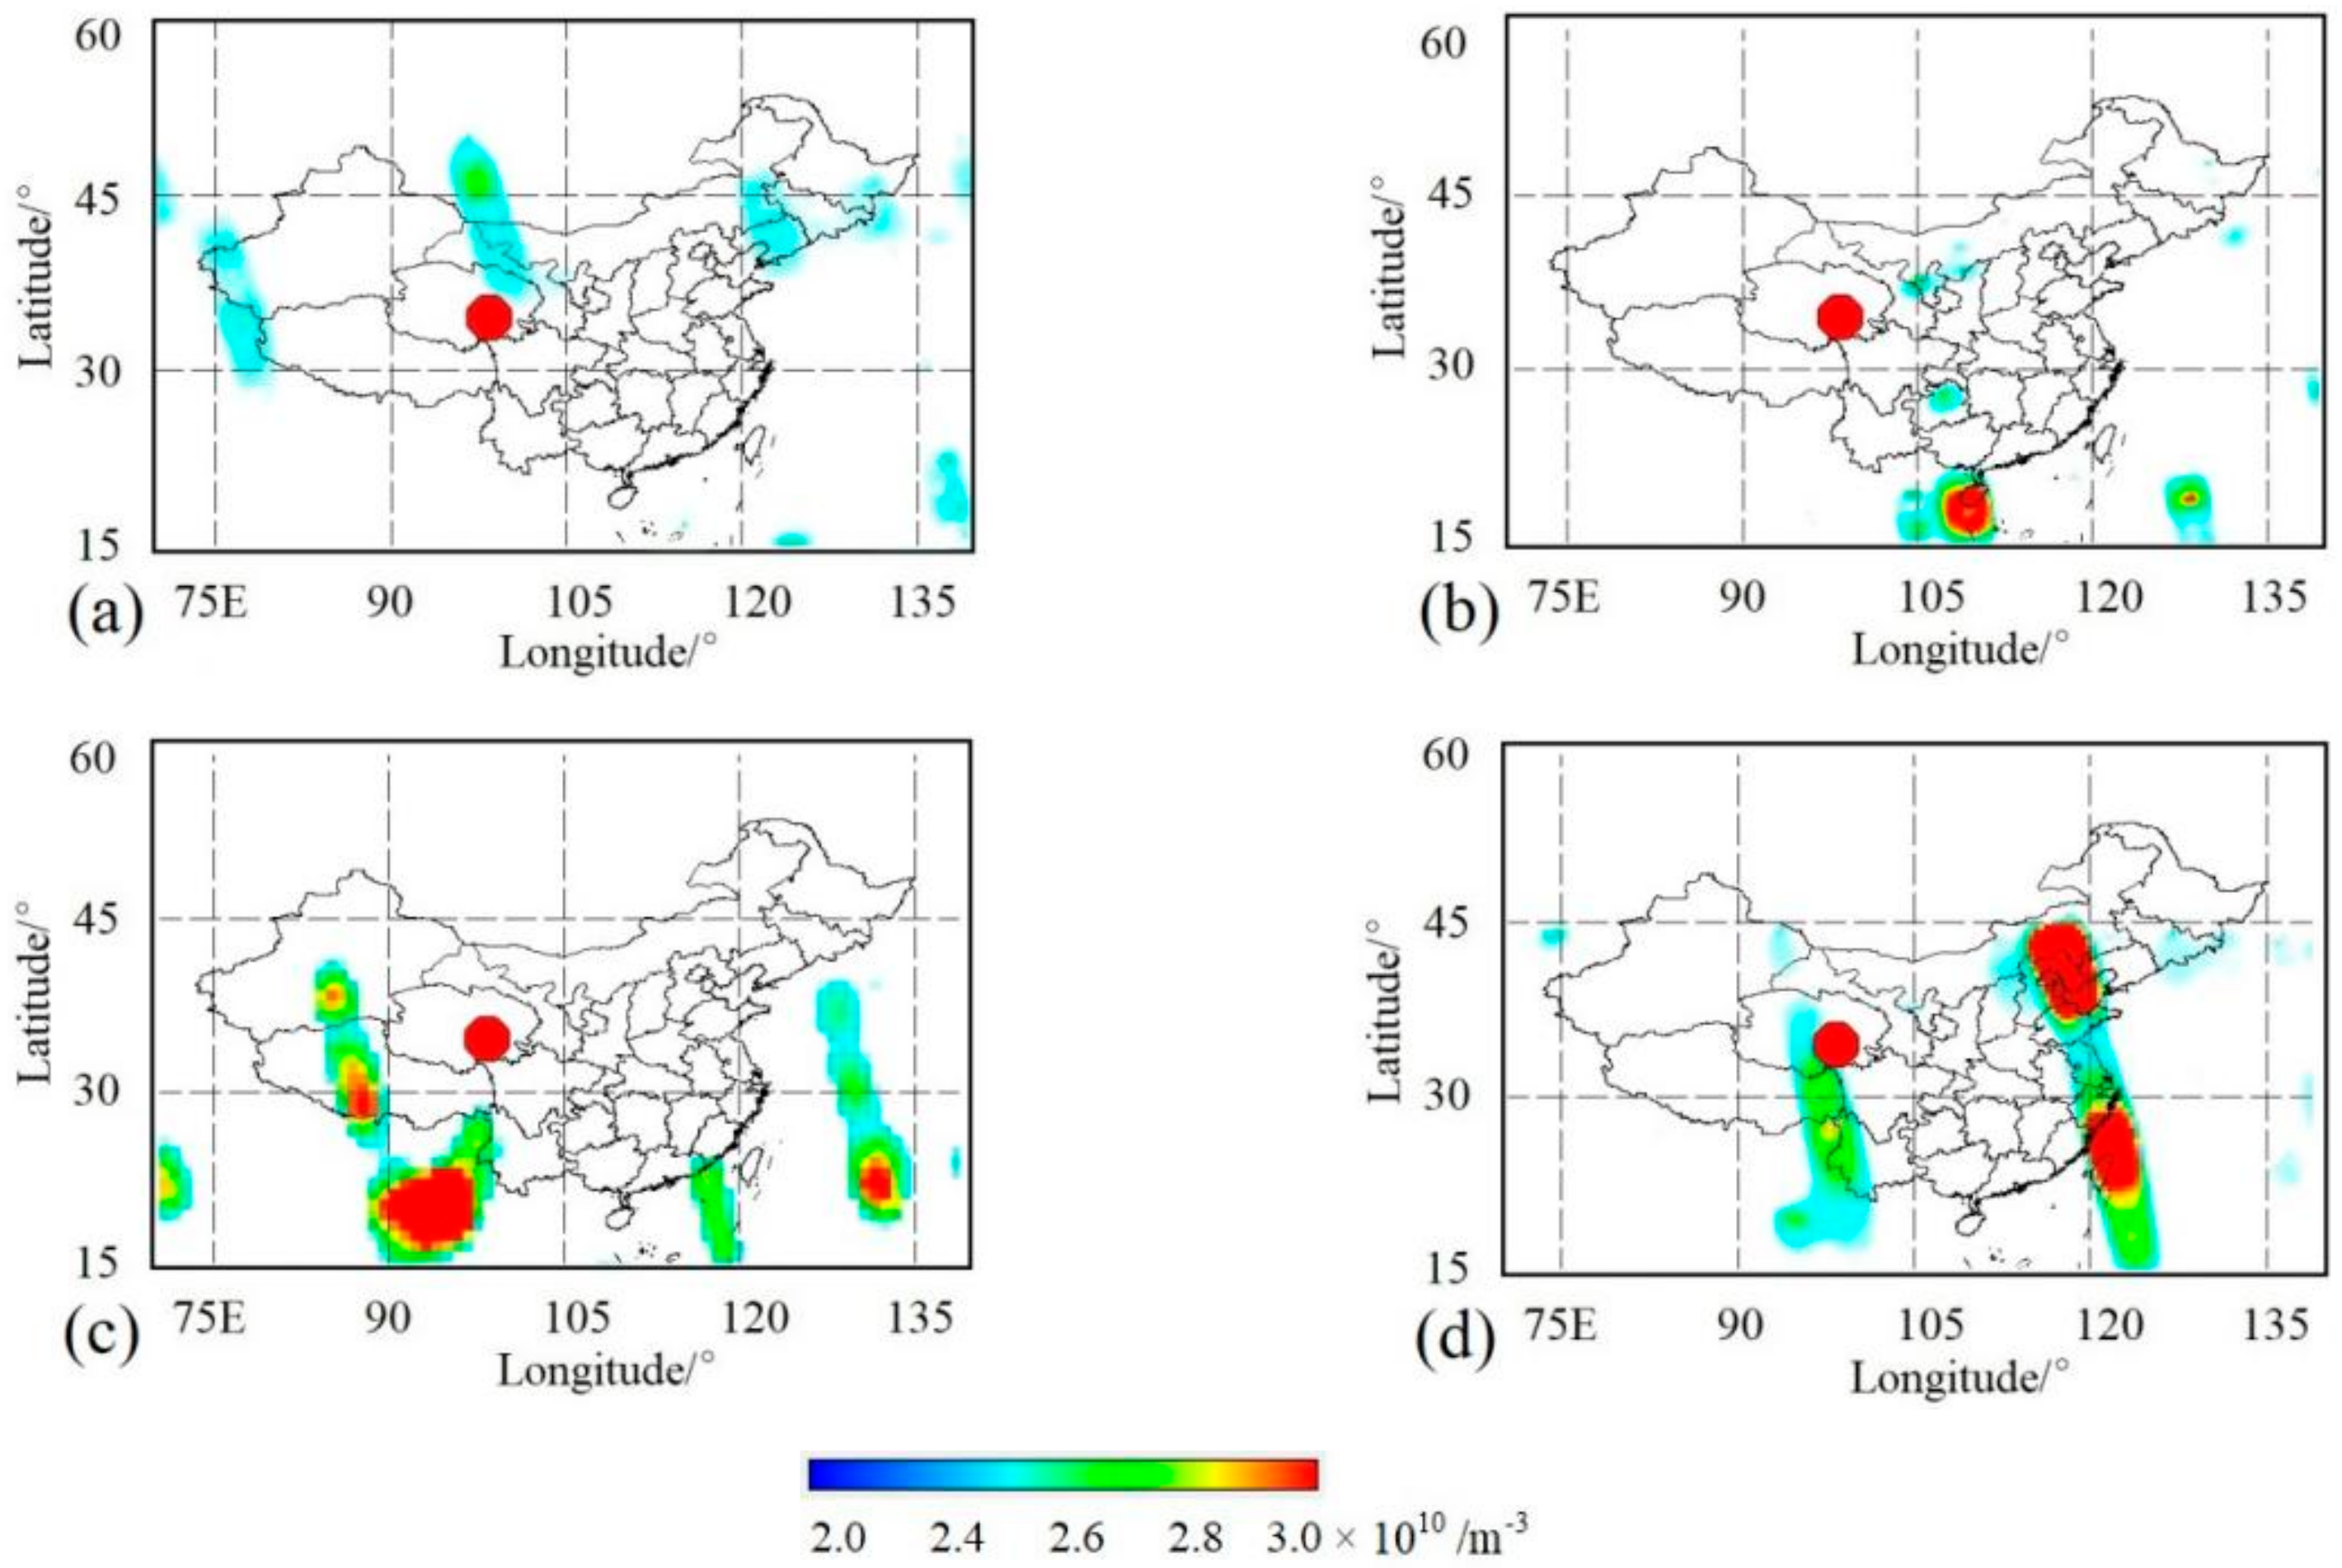
Figure 8 and Figure 9 display, respectively, the weekly ionic and electronic variations at nighttime on the Chinese mainland during the Menyuan MS 6.9 EQ on 8 January 2022. Parts of the data on 20–21, 27 December 2021, 1, 3 and 9 January 2022 were eliminated when the data were processed weekly at that time, due to a daily Kp index above 3 or an hourly Kp index 4, as noted in Figure 6b. In northern China, variations in ion density on 14–20 December 2021, shown in Figure 8a, and variations in ion density and electron density, shown in Figure 8b and Figure 9b, during the next week were obvious. However, there were no corresponding changes for electron density during 14–20 December, and these fluctuations were located in the northeast of China, where there are relatively high background values for these two parameters, as mentioned above. Thus, these irregularities were thought to be less reliable when the data were processed at that time. Additionally, there were no obvious variations in the range of the Chinese mainland during 4–10 January 2002, when the Menyuan MS 6.9 EQ took place.
The ionospheric variations, which attracted our attention, were those that occurred during 28 December 2021–3 January 2022, when the related data were processed on 5 January 2022 (the real data have a two-day delay). Figure 8b and Figure 9b show this anomalous condition occurred in ion density and electron density, respectively.
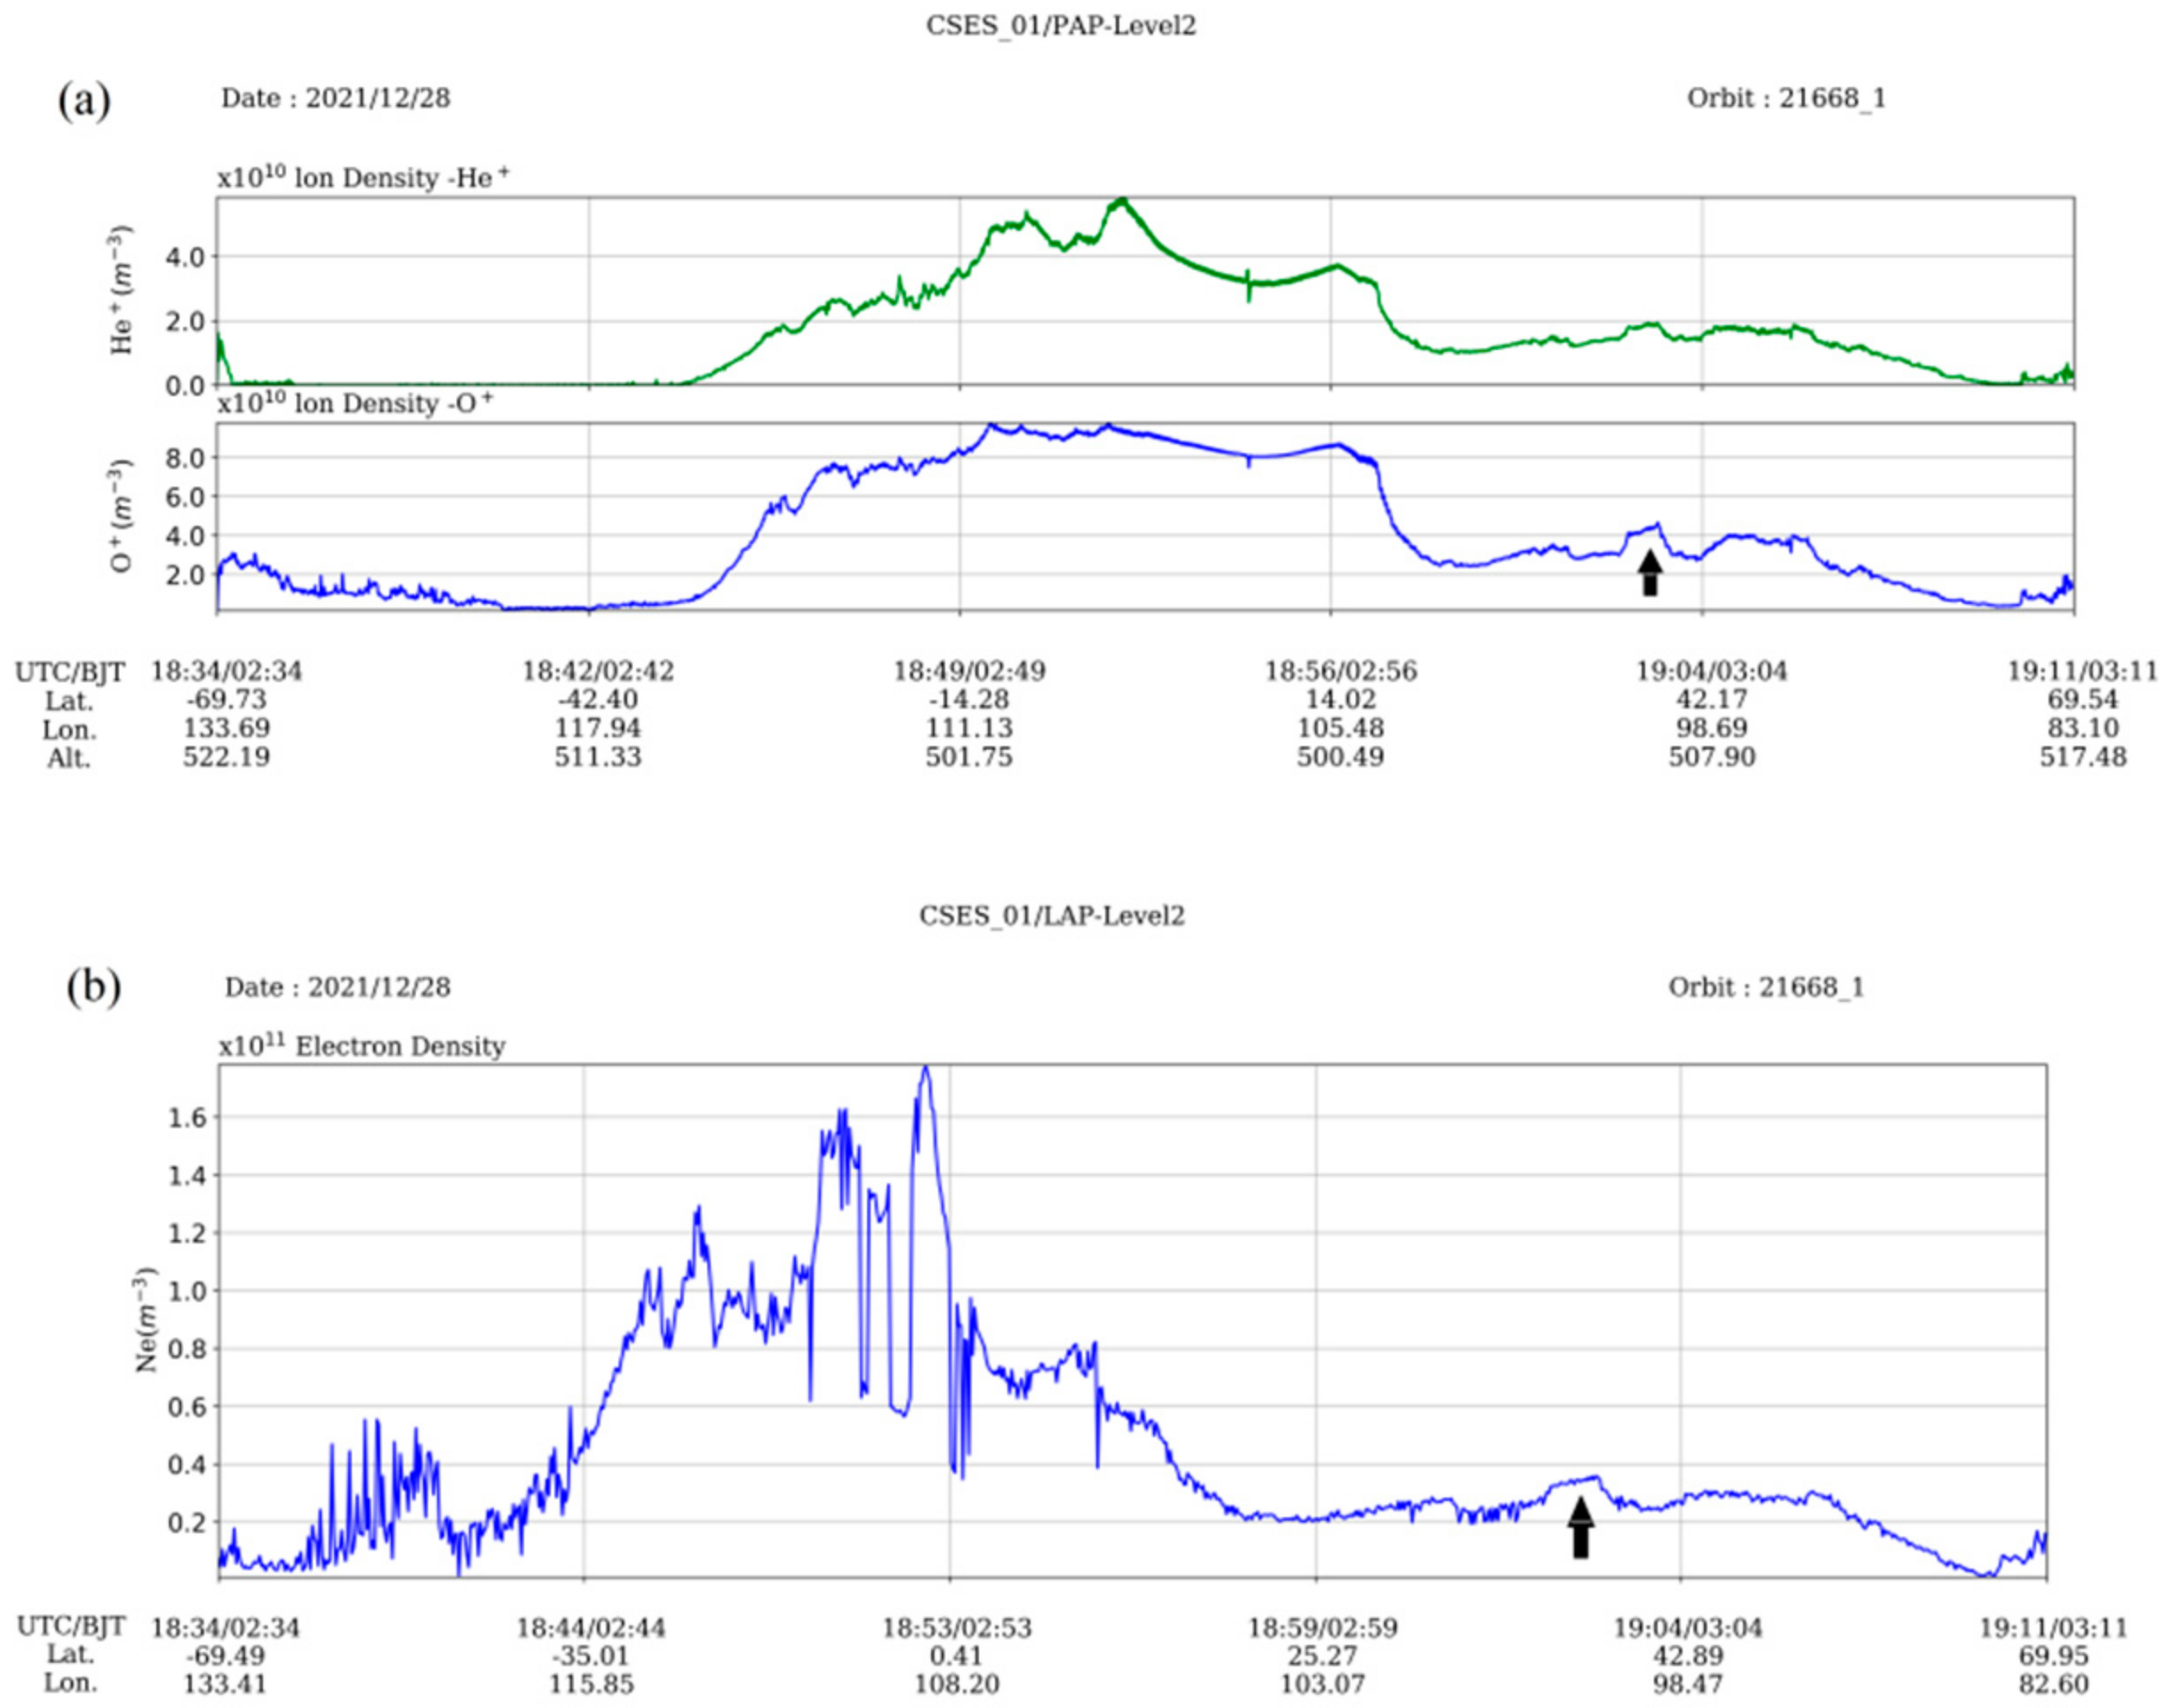
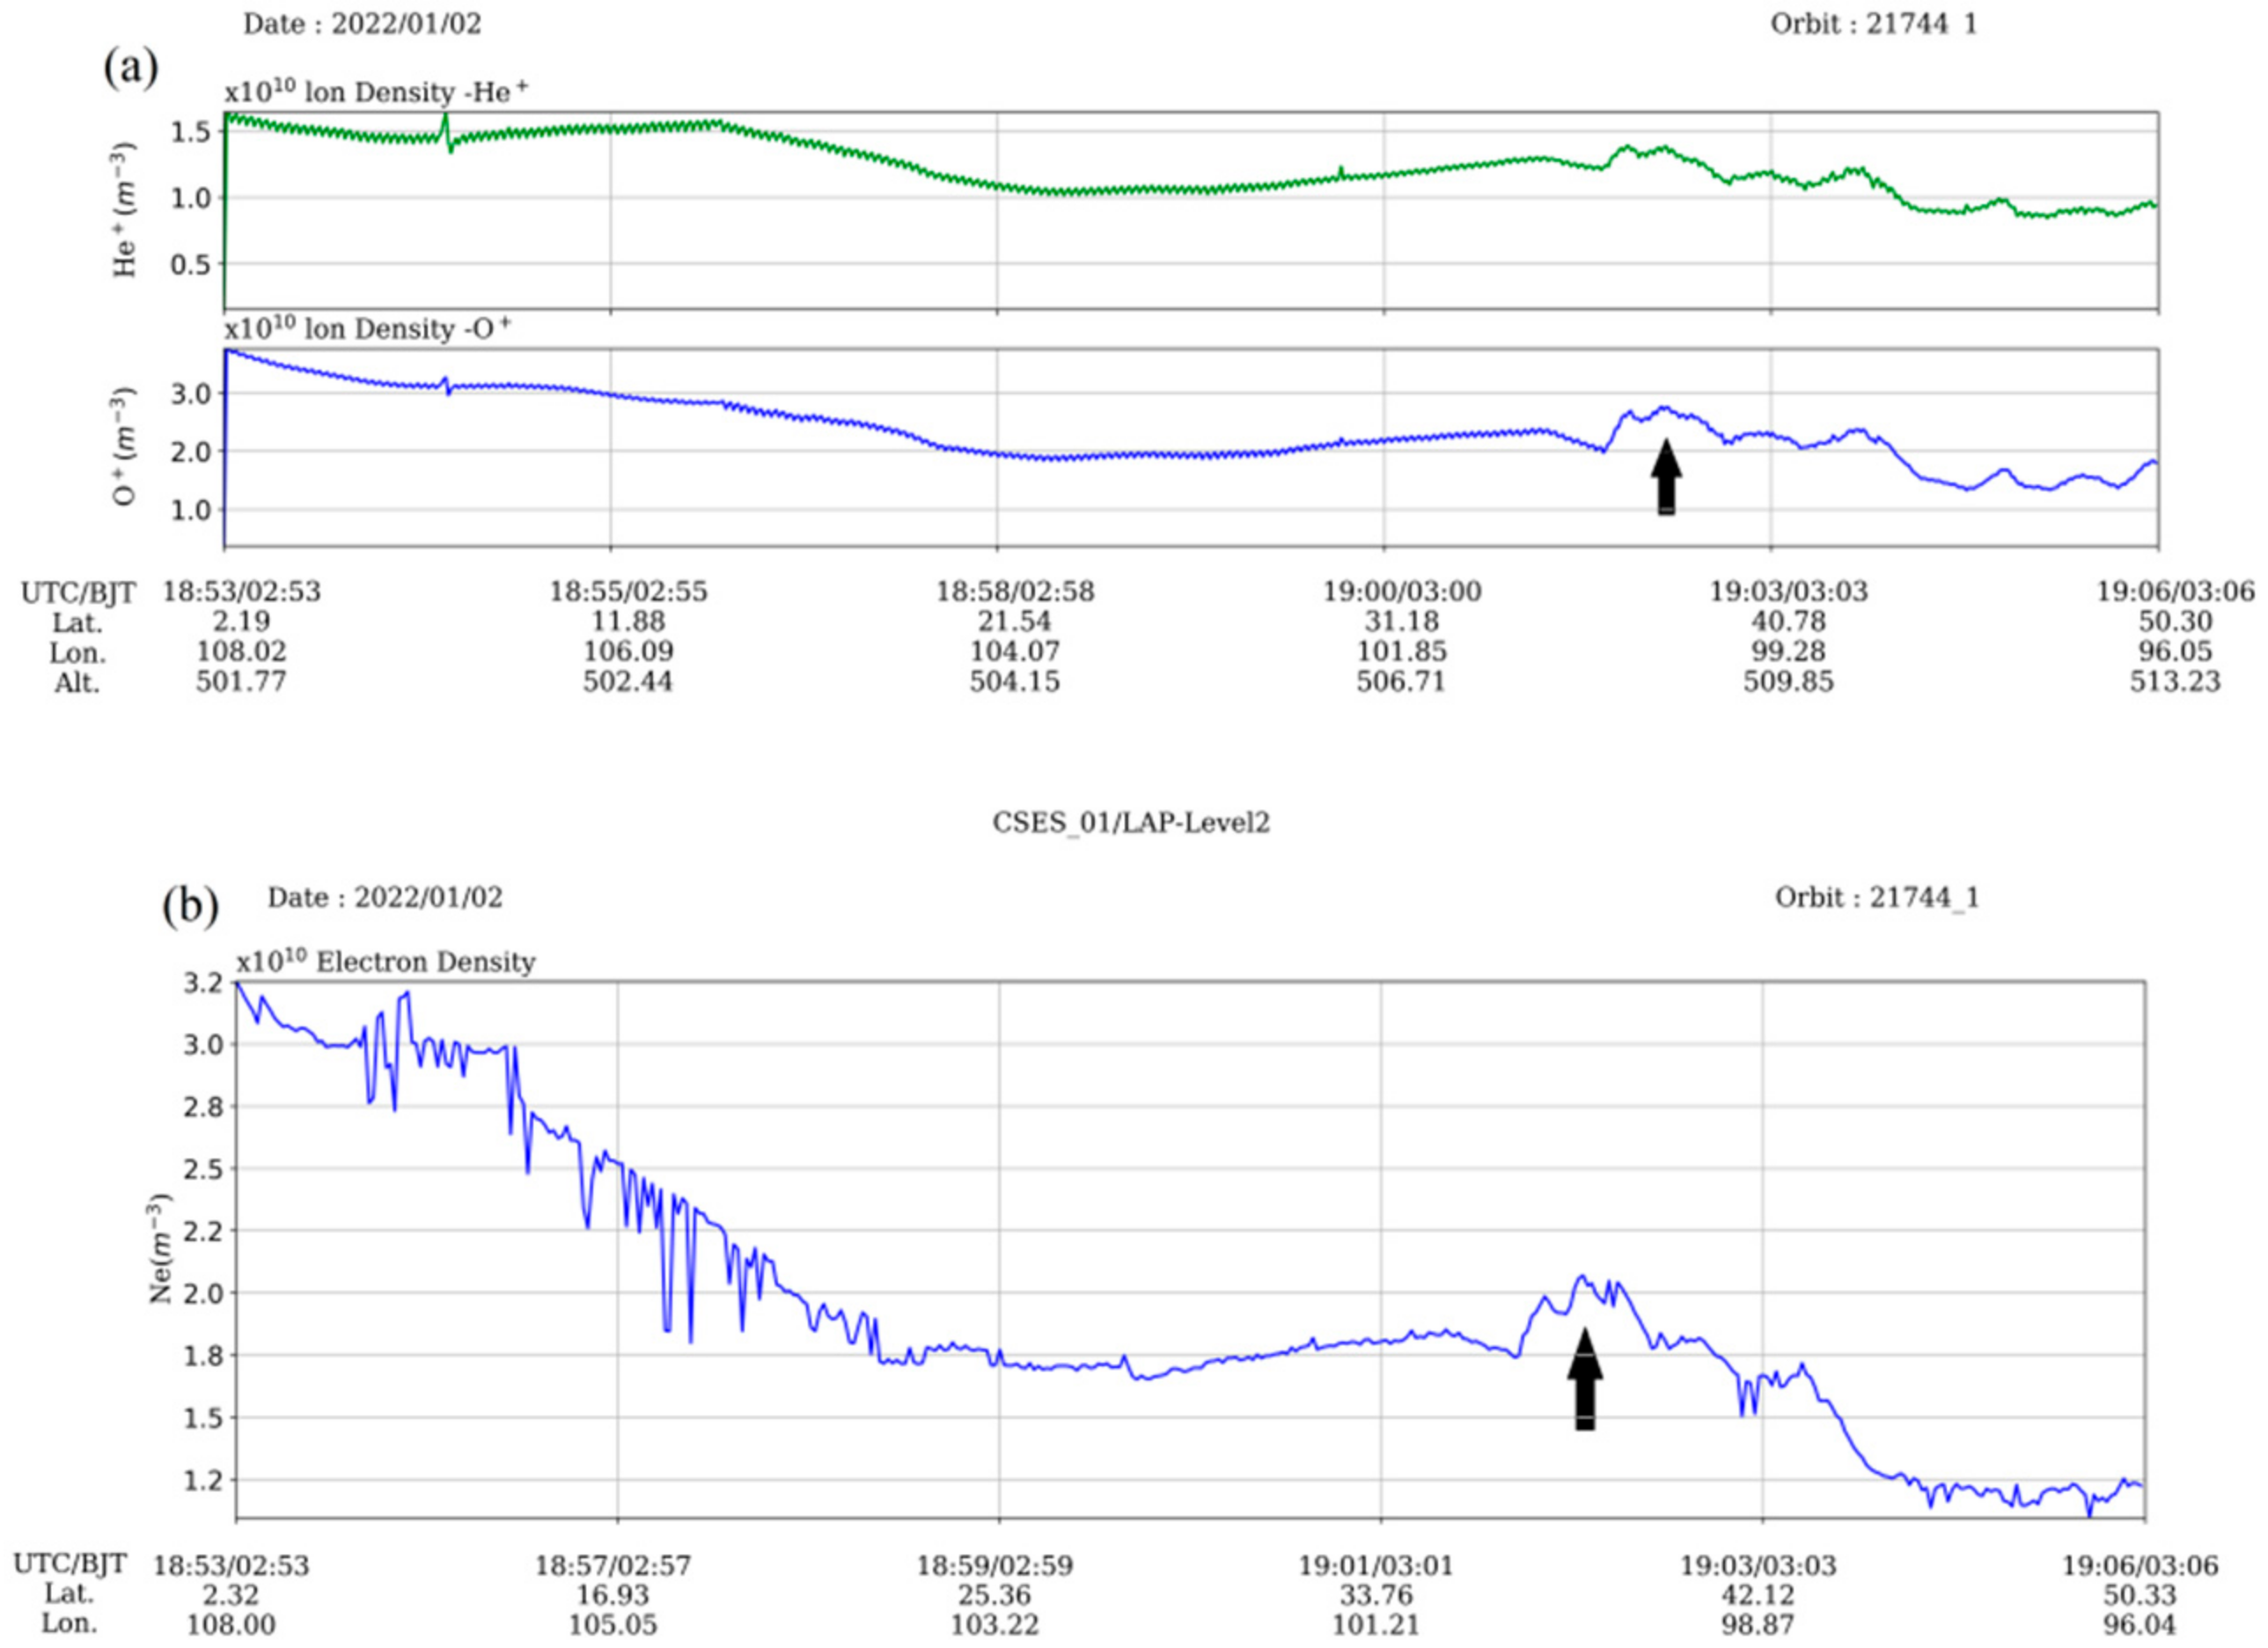
In order to confirm the reliability of these anomalies, we firstly examined the related orbits passing through the anomalous area and then specified the right orbit where the anomaly appeared. Figure 10 and Figure 11 show, respectively, the variations in the ionospheric parameters of (a) He+ and O+ and (b) Ne in the specified orbit of 21668_1 on 28 December 2021 and its revisiting orbit 21744_1 on 2 January 2022. The ionospheric anomaly took place at about 19:00 in these two days. Secondly, we also reexamined the corresponding Kp index on 28 December and found that the hourly Kp values at 18:00 and 21:00 were 1 and 0, and the Kp values of the same time period on 2 January 2022 were 2 and 3. In view of this, the variations recorded this time, within the Chinese mainland were of high reliability as EQ precursors. So, we reported this anomaly and gave a warning of an impending EQ around the ionospheric anomalous area within two weeks, when a usual weekly meeting was held on 7 January 2022. The second day after the warning was given, a large EQ with a magnitude MS 6.9 occurred on 8 January 2022 in Menyuan area, Qinghai province, with an epicenter located at 37.77° N and 101.26° E and a depth of 10 km. This event occurred 11 days and 6 days after the appearance of the corresponding abnormities, and it was located almost at the area where the obvious ionospheric disturbances occurred (see Figure 8b and Figure 9b).
After the Menyuan event, the variations in both ionospheric parameters that occurred during 28 December 2021–3 January 2022 were also been detected automatically by the software developed by Li and Parrot [13], and some parameters of the large ionospheric perturbations on 28 December were specified: the peaks occurred at 38.0° N and 99.9° E with an increase of 47.3% and a persistence distance of 560 km for O+ density and 38.4% and 693 km for electron density, respectively. This peak was only 120 km away from the Menyuan epicenter. The same software also detected that a small electronic perturbation occurred on 2 January but none for the ionic parameter.
5. Discussion
Two large EQs, the Maduo MS 7.4 EQ on 22 May 2021 and the Menyuan MS 6.9 EQ on 8 January 2022, were successfully recorded since the data of the CSES satellite were put into service for EQ prediction work on the Chinese mainland at the end of April 2020. Some useful information was found when we looked back at these processes. Obvious ionic variations, as well as electronic anomalies were found two weeks and one week prior to both events, which is highly coincident with the conclusion attained by previous investigations. In addition, the distance between the epicenter of the EQ and the ionospheric anomaly was about 600 km for the Maduo event and 120 km for the Menyuan event, which was well within the distance estimated using the Dobrovolsky formula R = 100.43M, where R is the radius of the EQ preparation zone, and M is the EQ magnitude [35].
The fact that electromagnetic (EM) emissions accompany every stage of some large earthquake preparations seems undebatable, although short-term earthquake prediction is still one of the most challenging targets in earth science today [19]. As the development of satellite Earth observation (EO) continues, there is an increasing amount of evidence that during some of the last stages in the long-term process of preparation, there could be a transfer of energy between lithosphere, atmosphere, and ionosphere, so as to introduce the concept of a lithosphere–atmosphere–ionosphere coupling (LAIC) among the three involved layers of the Earth [36,37,38,39,40]. However, the producing and propagating mechanism of seismo-electromagnetic signals, also as an energy origin of LAIC, has always been a controversial issue since seismic-related electromagnetic emissions have been reported. It basically includes a chemical channel [41,42,43], acoustic channel [44,45,46], electromagnetic channel [4,38], etc. Li et al. [4] qualitatively specified an LAIC model before the Wenchuan event by analyzing parameters from ground-based observations to space-born observations: electromagnetic energy propagated from the epicentral area, via the atmosphere and ionosphere, to the equatorial plane, and through this plane, finally, to its magnetically conjugated area in the opposite hemisphere.
However, this evidence remains far from a correct prediction for an impending EQ. Firstly, we cannot specify the right location where a forthcoming event will happen in light of the anomalous area. The Maduo EQ this time, for example, was 600 km away from the ionospheric anomaly. It has been reported that the GPS TEC (total electron content) abnormity lay in the southeast 15–20° away from the epicenter of the Wenchuan MS 8.0 EQ on 12 May 2008 [47]. At the same time, a large EQ can induce ionospheric influence around its epicentral area, as well as in its magnetically conjugated point area, which also leads to much difficulty in confirming the correct location of a forthcoming event.
Concerning the spatial distribution of ionospheric variations, various amplitudes of the ionospheric parameters are usually considered. Previous studies have shown that the maximum affected area in the ionosphere does not well coincide with the vertical projection of the epicenter of an impending EQ [5] and is shifted towards the equator in high and middle latitudes [48]. This feature can be thought as enhancements of the EIA (Equatorial Ionization Anomaly) strength as reported by Ryu et al. [49]. These results seem in agreement with the observations performed by Ruzhin et al. [50] before the Wenchuan MS 8.0 EQ with TEC data. They showed that the TEC anomalies in the two hemispheres were on different sides of the magnetic meridian that passes through the earthquake epicenter (to the east on the north and to the west on the south). They proposed that the extra electric field due to charged aerosols was transferred to the magnetically conjugate hemisphere and induced a plasma drift, which led to the observed plasma redistribution in both hemispheres.
Secondly, it is also difficult to determine the magnitude of the impending event just according to an appeared anomaly. So far, there has not been a well-established relationship between an ionospheric variation and a magnitude of an EQ, although statistically an ionospheric anomaly increases as the magnitude of the EQ involved increases [14]. The increased magnitudes of O+ density and electron density were of 41.6% and 22.2% for the Maduo shock and 47.3% and 38.4% for the Menyuan one. This information displays a contrary relationship between the varied amplitudes of ionospheric parameters and the magnitudes of EQs, if the Maduo and Menyuan events considered. Additionally, we also found that there was some useless or uncertain information occurring far from the impending EQ, for instance, variations in orbit 18111_1. From Figure 7 and Figure 5b, it is clear that there were three peaks that occurred in the same orbit from left to right in Figure 7 and from bottom to top in Figure 5b. We have confirmed the one near the Maduo MS 7.4 EQ was the precursory anomaly of the Maduo event. In addition, it was also easy to decide that one near the equator belonged to the anomalous belt around the equator. The middle one was about 1000 km from the Maduo epicenter, well within its effective anomalous range attained by the Dobrovolsky formula [35]; however, we cannot determine this intuitively due to its long distance from the epicenter.
So far, only two ionospheric parameters of O+ density and electron density have been used to support daily EQ prediction work on the Chinese mainland. We also found synchronous variations in other parameters, such as the He+ density in Figure 7, Figure 10, and Figure 11, which means matched variations of more related parameters can achieve more reliability of effective anomalies than one, especially ones from other observation styles, such as ground-based observations. This can also help us to deal with the difficulty of confirming the correct location of the impending event. It is also necessary to develop more data processing methods to distinguish EQ precursors comprehensively.
6. Conclusions
In summary, two large EQs, the Maduo MS 7.4 EQ on 21 May 2021 and the Menyuan MS 6.9 EQ on 8 January 2022, were successfully recorded on the Chinese mainland, after the data of the CSES satellite were put into service for EQ prediction work on the Chinese mainland. Effective ionospheric perturbations were reported immediately after they were found, respectively, two weeks and one week prior to these two events, which reconfirms that ionospheric information can be utilized for short-term EQ prediction. However, this work limited due to some uncertainty, including the correct location and the magnitude of the impending event. So, more EQ prediction practice and deeper investigations will be needed in the future.
Author Contributions
Data collection, writing, and investigation, M.L.; review and editing, H.W., J.L., and X.S. All authors have read and agreed to the published version of the manuscript.
Funding
This work was funded by the National Natural Science Foundation of China (NSFC) under Grant Agreement No. 41774084 and the National Key R&D Program of China under Grant No. 2018YFC1503506.
Institutional Review Board Statement
Institutional review board approval of our center was obtained for this study.
Informed Consent Statement
Informed consent was obtained from all subjects involved in the study.
Data Availability Statement
All data used in this paper can be available at the website https://www.leos.ac.cn/.
Acknowledgments
This work used data from the CSES mission, a project funded by the China National Space Administration (CNSA) and the China Earthquake Administration (CEA). This work was supported by the National Natural Science Foundation of China (NSFC) under Grant Agreement No. 41774084 and the National Key R&D Program of China under Grant No. 2018YFC1503506.
Conflicts of Interest
The authors declare no conflict of interest. The funders had no role in the design of the study; in the collection, analyses, or interpretation of data; in the writing of the manuscript, or in the decision to publish the results.
References
- Davies, K.; Baker, D.M. Ionospheric effects observed around the time of the Alaskan earthquake of March 28, 1964. J. Geophys. Res. 1965, 70, 2251–2253. [Google Scholar] [CrossRef]
- Akhoondzadeh, M.M.; Parrot, M.; Saradjian, M.R. Electron and ion density variations before strong earthquakes (M > 6.0) using DEMETER and GPS data. Nat. Hazards Earth Syst. Sci. 2010, 10, 7–18. [Google Scholar] [CrossRef] [Green Version]
- Stangl, G.; Boudjada, M.Y. Investigation of TEC and VLF space measurements associated to L’Aquila (Italy) earthquakes. Nat. Hazards Earth Syst. Sci. 2011, 11, 1019–1024. [Google Scholar] [CrossRef] [Green Version]
- Li, M.; Lu, J.; Zhang, X.; Shen, X. Indications of Ground-based Electromagnetic Observations to A Possible Lithosphere-Atmosphere-Ionosphere Electromagnetic Coupling before the 12 May 2008 Wenchuan MS 8.0 Earthquake. Atmosphere 2019, 10, 355. [Google Scholar] [CrossRef] [Green Version]
- Pulinets, S.A.; Legen, A.D.; Gaivoronskaya, T.V.; Depuev, V.K. Main phenomenological features of ionospheric precursors of strong earthquakes. J. Atmos. Sol. Terr. Phys. 2003, 65, 1337–1347. [Google Scholar] [CrossRef]
- Němec, F.; Santolík, O.; Parrot, M. Decrease of intensity of ELF/VLF waves observed in the upper ionosphere close to earthquakes: A statistical study. J. Geophys. Res. 2009, 114, A04303. [Google Scholar] [CrossRef]
- Němec, F.; Santolík, O.; Parrot, M.; Berthelier, J.J. Spacecraft observations of electromagnetic perturbations connected with seismic activity. Geophys. Res. Lett. 2008, 35, L05109. [Google Scholar] [CrossRef] [Green Version]
- Píša, D.; Němec, F.; Parrot, M.; Santolík, O. Attenuation of electromagnetic waves at the frequency ~1.7 kHz in the upper ionosphere observed by the DEMETER satellite in the vicinity of earthquakes. Ann. Geophys. 2012, 55, 157–163. [Google Scholar] [CrossRef]
- Píša, D.; Němec, F.; Santolík, O.; Parrot, M.; Rycroft, M. Additional attenuation of natural VLF electromagnetic waves observed by the DEMETER spacecraft resulting from preseismic activity. J. Geophys. Res. 2013, 118, 5286–5295. [Google Scholar] [CrossRef] [Green Version]
- Zhang, X.; Fidani, C.; Huang, J.; Shen, X.; Zeren, Z.; Qian, J. Burst increases of precipitating electrons recorded by the DEMETER satellite before strong earthquakes. Nat. Hazards Earth Syst. Sci. 2013, 13, 197–209. [Google Scholar] [CrossRef] [Green Version]
- Parrot, M. Statistical analysis of the ion density measured by the satellite DEMETER in relation with the seismic activity. Earthq. Sci. 2011, 24, 513–521. [Google Scholar] [CrossRef] [Green Version]
- Parrot, M. Statistical analysis of automatically detected ion density variations recorded by DEMETER and their relation to seismic activity. Ann. Geophys. 2012, 55, 149–155. [Google Scholar] [CrossRef]
- Li, M.; Parrot, M. “Real time analysis” of the ion density measured by the satellite DEMETER in relation with the seismic activity. Nat. Hazards Earth Syst. Sci. 2012, 12, 2957–2963. [Google Scholar] [CrossRef] [Green Version]
- Li, M.; Parrot, M. Statistical analysis of an ionospheric parameter as a base for earthquake prediction. J. Geophys. Res. Space Phys. 2013, 118, 3731–3739. [Google Scholar] [CrossRef] [Green Version]
- Li, M.; Parrot, M. Statistical analysis of the ionospheric ion density recorded by DEMETER in the epicenter areas of earthquakes as well as in their magnetically conjugate point areas. Adv. Space Res. 2018, 61, 974–984. [Google Scholar] [CrossRef]
- Parrot, M.; Li, M. DEMETER results related to seismic activity. Ursi Radio Science Bulletin 2017, 88, 18–25. [Google Scholar]
- Yan, R.; Parrot, M.; Pinçon, J.L. Statistical study on variations of the ionospheric ion density observed by DEMETER and related to seismic activities. J. Geophys. Res. Space Phys. 2017, 122, 12421–12429. [Google Scholar] [CrossRef] [Green Version]
- Perrone, L.; Korsunova, L.P.; Mikhailov, A.V. Ionospheric precursors for crustal earthquakes in Italy. Ann. Geophys. 2010, 28, 941–950. [Google Scholar] [CrossRef] [Green Version]
- Eftaxias, K.; Kapiris, P.; Polygiannakis, J.; Peratzakis, A.; Kopanas, J.; Antonopoulos, G.; Rigas, D. Experience of short term earthquake precursors with VLF–VHF electromagnetic emissions. Nat. Hazards Earth Syst. Sci. 2003, 3, 217–228. [Google Scholar] [CrossRef]
- Huang, F.; Li, M.; Ma, Y.; Han, Y.; Tian, L.; Yan, W.; Li, X. Studies on earthquake precursors in China: A review for recent 50 years. Geod. Geodyn. 2017, 8, 1–12. [Google Scholar] [CrossRef]
- Shen, X.; Zhang, X.; Yuan, S.; Wang, L.; Cao, J.; Huang, J.; Zhu, X.; Piergiorgio, P.; Dai, J.P. The state-of-the-art of the China Seismo-Electromagnetic Satellite mission. Sci. China Technol. Sci. 2018, 61, 634–642. [Google Scholar] [CrossRef]
- Huang, J.P.; Lei, J.G.; Li, S.X.; Zeren, Z.M.; Li, C.; Zhu, X.H.; Yu, W.H. The Electric Field Detector (EFD) onboard the ZH-1 satellite and first observational results. Earth Planet. Phys. 2018, 2, 469–478. [Google Scholar] [CrossRef]
- Yan, R.; Shen, X.H.; Huang, J.P.; Wang, Q.; Chu, W.; Liu, D.P.; Yang, Y.Y.; Lu, H.X.; Xu, S. Examples of unusual ionospheric observations by the CSES prior to earthquakes. Earth Planet. Phys. 2018, 2, 515–526. [Google Scholar] [CrossRef]
- Li, M.; Shen, X.; Parrot, M.; Zhang, X.; Zhang, Y.; Yu, C.; Yan, R.; Liu, D.; Lu, H.; Guo, F.; et al. Primary joint statistical seismic influence on ionospheric parameters recorded by the CSES and DEMETER satellites. J. Geophys. Res. Space Phys. 2020, 125, e2020JA028116. [Google Scholar] [CrossRef]
- Yan, R.; Zhima, Z.; Xiong, C.; Shen, X.; Huang, J.; Guan, Y.; Zhu, X.; Liu, C. Comparison of Electron Density and Temperature from the CSES Satellite with other Space-Borne and Ground-Based Observations. J. Geophys. Res. Space Phys. 2019, 125, e2019JA027747. [Google Scholar] [CrossRef]
- Liu, J.; Guan, Y.; Zhang, X.; Shen, X. The data comparison of electron density between CSES and DEMETER satellite, Swarm constellation and IRI model. Earth Space Sci. 2021, 8, e2020EA001475. [Google Scholar] [CrossRef]
- Zhima, Z.; Hu, Y.; Shen, X.; Chu, W.; Guo, F. Storm-time features of the ionospheric ELF/VLF waves and energetic electron fluxes revealed by the China Seismo-Electromagnetic Satellite. Appl. Sci. 2021, 11, 2617. [Google Scholar] [CrossRef]
- Zhang, X.; Wang, Y.; Boudjada, M.Y.; Liu, J.; Magnes, W.; Zhou, Y.; Du, X. Multi-experiment observations of ionospheric disturbances as precursory effects of the Indonesian MS6.9 earthquake on August 05, 2018. Remote Sens. 2020, 12, 4050. [Google Scholar] [CrossRef]
- De Santis, A.; Marchetti, D.; Perrone, L.; Campuzano, S.A.; Cianchini, G.; Cesaroni, C.; DiMauro, D.; Orlando, M.; Piscini, A.; Sabbagh, D.; et al. Statistical correlation analysis of strong earthquakes and ionospheric electron density anomalies as observed by CSES-01. IL Nuovo Cimento 44 C 2021, 119, 1–4. [Google Scholar] [CrossRef]
- Yang, Y.; Hulot, G.; Vigneron, P.; Shen, X.; Zhima, Z.; Zhou, B.; Magnes, W.; Olsen, N.; Toffner-Clausen, L.; Huang, J.; et al. The CSES global geomagnetic field model (CGGM): An IGRF-type global geomagnetic field model based on data from the China Seismo-Electromagnetic Satellite. Earth Planets Space 2021, 73, 45. [Google Scholar] [CrossRef]
- Spogli, L.; Sabbagh, D.; Regi, M.; Cesaroni, C.; Perrone, L.; Alfonsi, L.; Mauro, D.D.; Lepidi, S.; Campuzano, S.A.; Marchetti, D.; et al. Ionospheric response over Brazil to the August 2018 geomagnetic storm as probed by CSES-01 and Swarm satellites and by local groundbased observations. J. Geophys. Res. Space Phys. 2021, 126, e2020JA028368. [Google Scholar] [CrossRef]
- Gou, X.; Li, L.; Zhang, Y.; Zhou, B.; Feng, Y.; Cheng, B.; Raita, T.; Liu, J.; Zhima, Z.; Shen, X. Ionospheric Pc1 waves during a storm recovery phase observed by the China Seismo-Electromagnetic Satellite. Ann. Geophys. 2020, 38, 775–787. [Google Scholar] [CrossRef]
- Liu, D.; Zeren, Z.; Shen, X.; Zhao, S.; Yan, R.; Wang, X.; Liu, C.; Guan, Y.; Zhu, X.; Miao, Y.; et al. Typical ionospheric disturbances revealed by the plasma analyzer package onboard the China Seismo-Electromagnetic Satellite. Adv. Space Res. 2021, 68, 3796–3805. [Google Scholar] [CrossRef]
- Wang, Y.; Wu, Y.; Lu, J.; Yu, S.; Li, M. Spatial distribution characteristics of geomagnetic Z component phase variation in Chinese mainland. Chin. J. Geophys. 2009, 52, 1033–1040. [Google Scholar] [CrossRef]
- Dobrovolsky, I.P.; Zubkov, S.I.; Miachkin, V.I. Estimation of the size of earthquake preparation zones. Pure Appl. Geophys. 1979, 117, 1025–1044. [Google Scholar] [CrossRef]
- Pulinets, S.A.; Legen’ka, A.D.; Alekseev, V.A. Preearthquakes effects and their possible mechanisms. In Dusty and Dirty Plasmas, Noise and Chaos in Space and in the Laboratory; Plenum Publishing: New York, NY, USA, 1994; pp. 545–557. [Google Scholar]
- Pulinets, S.A.; Boyarchuk, K.A.; Hegai, V.V.; Kim, V.P.; Lomonosov, A.M. Quasielectrostatical model of atmosphere-thermosphere-ionosphere coupling. Adv. Space Res. 2000, 26, 1209–1218. [Google Scholar] [CrossRef]
- Hayakawa, M.; Molchanov, O.A. (Eds.) Seismo–Electromagnetics: Lithosphere-Atmosphere-Ionosphere Coupling; TERRAPUB: Tokyo, Japan, 2002. [Google Scholar]
- Molchanov, O.; Fedorov, E.; Schekotov, A.; Gordeev, E.; Chebrov, V.; Surkov, V.; Rozhnoi, A.; Andreevsky, S.; Iudin, D.; Yunga, S.; et al. Lithosphere-atmosphere-ionosphere coupling as governing mechanism for preseismic short-term events in atmosphere and ionosphere. Nat. Hazards Earth Syst. Sci. 2004, 4, 757–767. [Google Scholar] [CrossRef] [Green Version]
- Kamogawa, M. Pre-seismic lithosphere-atmosphere-ionosphere coupling. Eos 2006, 87, 417–424. [Google Scholar] [CrossRef] [Green Version]
- Parrot, M.; Li, M. Statistical analysis of the ionospheric density recorded by the satellite during seismic activity. In Pre-Earthquake Processes: A Multidisciplinary Approach to Earthquake Prediction Studies; Ouzounov, D., Pulinets, S., Kafatos, M.C., Taylor, P., Eds.; Wiley: New York, NY, USA, 2018; pp. 319–328. [Google Scholar]
- Sorokin, V.M.; Chmyrev, V.M.; Hayakawa, M. A review on electrodynamic influence of atmospheric processes to the ionosphere. Open J. Earthq. Res. 2020, 9, 113–141. [Google Scholar] [CrossRef] [Green Version]
- Liperovsky, V.A.; Meister, C.V.; Liperovskaya, E.V.; Bogdanov, V.V. On the generation of electric field and infrared radiation in aerosol clouds due to radon emanation in the atmosphere before earthquakes. Nat. Hazards Earth Syst. Sci. 2008, 8, 1199–1205. [Google Scholar] [CrossRef]
- Hayakawa, M.; Kasahara, Y.; Nakamura, T.; Hobara, Y.; Rozhnoi, A.; Solovieva, M.; Molchanov, O.A.; Korepanov, K. Atmospheric gravity waves as a possible candidate for seismo-ionospheric perturbations. J. Atmos. Electr. 2011, 31, 129–140. [Google Scholar] [CrossRef] [Green Version]
- Korepanov, V.; Hayakawa, M.; Yampolski, Y.; Lizunov, G. AGW as a seismo-ionospheric coupling responsible agent. Phys. Chem. Earth 2009, 34, 485–495. [Google Scholar] [CrossRef]
- Yang, S.S.; Asano, T.; Hayakawa, M. Abnomal gravity wave activity in the stratosphere prior to the 2016 Kumamoto earthquakes. J. Geophys. Res. Space Phys. 2019, 124, 1410–1425. [Google Scholar] [CrossRef]
- Yu, T.; Mao, T.; Wang, Y.; Wang, J. Study of the ionospheric anomaly before the Wenchuan earthquake. China Sci. Bull. 2009, 54, 1086–1092. [Google Scholar] [CrossRef] [Green Version]
- Pulinets, S.A.; Liu, J.Y.; Safronova, I.A. Interpretation of a statistical analysis of variation in the foF2 critical frequency before earthquake based on data from Chung-Li ionospheric station (Taiwan). Geomag. Aeron. 2004, 44, 102–106. [Google Scholar]
- Ryu, K.; Parrot, M.; Kim, S.G.; Jeong, K.S.; Chae, J.S.; Pulinets, S.; Oyama, K.-I. Suspected seismo-ionospheric coupling observed by satellite measurements and GPS TEC related to the M 7.9 Wenchuan earthquake of 12 May 2008. J. Geophys. Res. Space. Phys. 2014, 119, 305–323. [Google Scholar] [CrossRef] [Green Version]
- Ruzhin, Y.; Sorokin, V.M.; Yashchenko, A.K. Physical mechanism of ionospheric total electron content perturbations over a seismoactive region. Geomag. Aeron. 2014, 54, 337–346. [Google Scholar] [CrossRef]
Figure 1.
Averaged seasonal variations of O+ density for the periods of (a) January–March, (b) April–June, (c) July–September, and (d) October–December 2020.
Figure 1.
Averaged seasonal variations of O+ density for the periods of (a) January–March, (b) April–June, (c) July–September, and (d) October–December 2020.

Figure 2.
Variations in the Kp index from the middle to the end of August 2018.

Figure 3.
Variations in Ni (O+) on (a) 26 August 2018 daytime, (b) 26 August 2018 nighttime, (c) 24 August 2018 daytime, and (d) 24 August 2018 nighttime.
Figure 3.
Variations in Ni (O+) on (a) 26 August 2018 daytime, (b) 26 August 2018 nighttime, (c) 24 August 2018 daytime, and (d) 24 August 2018 nighttime.

Figure 4.
Variations in O+ density during the periods of (a) April 28–May 4, (b) 5–11 May, (c) 12–18 May, and (d) 19–25 May 2021. The Maduo MS 7.4 EQ is labeled with a red dot.
Figure 4.
Variations in O+ density during the periods of (a) April 28–May 4, (b) 5–11 May, (c) 12–18 May, and (d) 19–25 May 2021. The Maduo MS 7.4 EQ is labeled with a red dot.

Figure 5.
Variations in electron density during the periods of (a) April 28–May 4, (b) 5–11 May, (c) 12–18 May, and (d) 19–25 May 2021. The Maduo MS 7.4 EQ is labeled with a red dot.
Figure 5.
Variations in electron density during the periods of (a) April 28–May 4, (b) 5–11 May, (c) 12–18 May, and (d) 19–25 May 2021. The Maduo MS 7.4 EQ is labeled with a red dot.

Figure 6.
Variations in the Kp index (a) from 27 April to 26 May 2021 and (b) from 10 December 2021 to 10 January 2022. The red star stands for the earthquake occurring time.
Figure 6.
Variations in the Kp index (a) from 27 April to 26 May 2021 and (b) from 10 December 2021 to 10 January 2022. The red star stands for the earthquake occurring time.

Figure 7.
Fluctuations of (a) He+ and O+ densities and (b) electron density registered by the CSES satellite on 8 May 2021, 14 days before the Maduo MS 7.4 EQ. Obvious variations associated with this Maduo event are labeled with black arrows.
Figure 7.
Fluctuations of (a) He+ and O+ densities and (b) electron density registered by the CSES satellite on 8 May 2021, 14 days before the Maduo MS 7.4 EQ. Obvious variations associated with this Maduo event are labeled with black arrows.

Figure 8.
Variations in O+ density during the periods of (a) 14–20 December 2021 (b) 21–27 December 2021, (c) 28 December 2021–3 January 2022, and (d) 4–10 January 2022. The Menyuan MS 6.9 EQ is labeled with a red dot (and with a black circle in the third panel).
Figure 8.
Variations in O+ density during the periods of (a) 14–20 December 2021 (b) 21–27 December 2021, (c) 28 December 2021–3 January 2022, and (d) 4–10 January 2022. The Menyuan MS 6.9 EQ is labeled with a red dot (and with a black circle in the third panel).

Figure 9.
Variations in electron density during the periods of (a) 14–20 December 2021 (b) 21–27 December 2021, (c) 28 December 2021–3 January 2022, and (d) 4–10 January 2022. The Menyuan MS 6.9 EQ is labeled with a red dot (and with a black circle in the third panel).
Figure 9.
Variations in electron density during the periods of (a) 14–20 December 2021 (b) 21–27 December 2021, (c) 28 December 2021–3 January 2022, and (d) 4–10 January 2022. The Menyuan MS 6.9 EQ is labeled with a red dot (and with a black circle in the third panel).

Figure 10.
Fluctuations in (a) He+ and O+ densities and (b) electron density registered by the CSES satellite on 28 December 2021, 11 days before the Menyuan MS 6.9 EQ. Obvious perturbations related to this Menyuan event are labeled with black arrows.
Figure 10.
Fluctuations in (a) He+ and O+ densities and (b) electron density registered by the CSES satellite on 28 December 2021, 11 days before the Menyuan MS 6.9 EQ. Obvious perturbations related to this Menyuan event are labeled with black arrows.

Figure 11.
Fluctuations in (a) He+ and O+ densities and (b) electron density registered by the CSES satellite on 2 January 2022, 6 days before the Menyuan MS 6.9 EQ. Obvious variations related to this Menyuan event are labeled with black arrows.
Figure 11.
Fluctuations in (a) He+ and O+ densities and (b) electron density registered by the CSES satellite on 2 January 2022, 6 days before the Menyuan MS 6.9 EQ. Obvious variations related to this Menyuan event are labeled with black arrows.

Publisher’s Note: MDPI stays neutral with regard to jurisdictional claims in published maps and institutional affiliations. |
© 2022 by the authors. Licensee MDPI, Basel, Switzerland. This article is an open access article distributed under the terms and conditions of the Creative Commons Attribution (CC BY) license (https://creativecommons.org/licenses/by/4.0/).
Share and Cite
MDPI and ACS Style
Li, M.; Wang, H.; Liu, J.; Shen, X. Two Large Earthquakes Registered by the CSES Satellite during Its Earthquake Prediction Practice in China. Atmosphere 2022, 13, 751. https://0-doi-org.brum.beds.ac.uk/10.3390/atmos13050751
AMA Style
Li M, Wang H, Liu J, Shen X. Two Large Earthquakes Registered by the CSES Satellite during Its Earthquake Prediction Practice in China. Atmosphere. 2022; 13(5):751. https://0-doi-org.brum.beds.ac.uk/10.3390/atmos13050751
Chicago/Turabian StyleLi, Mei, Haitao Wang, Jie Liu, and Xuhui Shen. 2022. "Two Large Earthquakes Registered by the CSES Satellite during Its Earthquake Prediction Practice in China" Atmosphere 13, no. 5: 751. https://0-doi-org.brum.beds.ac.uk/10.3390/atmos13050751
Note that from the first issue of 2016, this journal uses article numbers instead of page numbers. See further details here.