Article

The Umbrella Type Canopy Increases Tolerance to Abiotic Stress-Leaf Microenvironment Temperature and Tropospheric Ozone in ‘Chambourcin’

1
State Key Laboratory of Crop Biology, College of Horticulture Science and Engineering, Shandong Agricultural University, Tai’an 271018, China
2
Qingdao Dahao Heshan Co., Ltd., Qingdao 266000, China
*
Authors to whom correspondence should be addressed.
Submission received: 12 March 2022 / Revised: 8 May 2022 / Accepted: 13 May 2022 / Published: 18 May 2022

Abstract

:
This study reports on the effect of the vertical shoot type canopy (VST) and umbrella type canopy (UT) on the fruit region microenvironment, light interception, tropospheric ozone, and berry quality of vertical trellis ‘Chambourcin’. The real-time temperature and humidity fluctuation and the daily average temperature of the UT canopy were lower than that of the VST canopy. An extremely high temperature was recorded around the fruit region of the VST canopy. Notably, the UT canopy significantly increased light interception and leaf area index and reduced the damage of atmospheric ozone to the leaves. These phenomena increased the content of soluble solids, anthocyanins, total phenols, flavonoids, and flavanols in the mature fruits of the UT canopy more than in the VST canopy. In conclusion, the UT canopy saves shoot management labor and improves the fruit region’s microenvironment and the content of anthocyanins, total phenols, flavonoids, and flavanols.

1. Introduction

‘Chambourcin’ (Seyve-Villard 12-417×Seibel 7053) is an interspecific hybrid red wine grape characterized by a higher disease and winter resistance than the V. vinifera cultivars. It can consistently produce high-quality wine in many humid climate New World grape growing regions, including New Jersey and the mid-Atlantic region of the United States [1], and critical areas of soil cover for cold protection in China [2]. Most of these producing areas are characterized by hot-rainy summers and cold-dry winters. Considering climate change, the areas suitable for wine production are such as to move south and north [3]. Thus, the cultivation of resistant varieties will be paid more attention. Though ‘Chambourcin’ has a high disease and cold resistance, it is susceptible to atmospheric ozone and begins to show strong light intensified ozone injury symptoms in early June [4,5]. A five-year experiment showed that ‘Chambourcin’ had a mean of 5.28% leaf tissue injury when exposed to an average of 34 ppb ambient O3 [6]. Blanco-Ward [7] reported that the traditionally cultivated grapevines are exposed to an average of 50 to 60 ppb O3, affecting both the grape’s yield and quality. Studies on how to alleviate O3 stress are thus of great significance to grape cultivation.
Reasonable canopy shapes can improve the light and temperature conditions in the cluster microenvironment of grape berries, regulate the vegetative and reproductive growth of trees, and influence the quality and yield of grape berries [8]. There are several canopy training systems, such as the Smart–Dyson, Scott Henry, Geneva double curtain (GDC), vertical shoot shape canopy (VST), and Lyre, among others. VST is the most popular [9] and is commonly used for European wine grape (Vitis vinifera) cultivars. It is convenient, conducive to mechanized operation, and allows for narrower row spacing for greater vine-planting densities. VST is thus a suitable training system for upright-growing cultivars with low to moderate vigor. However, it can increase vegetative vigor in hybrid grapes [10,11]. Divided canopy training systems, such as the Athena training system, retrofitted with several trellis cross arms reduce vegetative vigor and support a greater number of shoots for more yields in hybrid cultivars [12] because of a bigger leaf area and higher light interception and porosity.
However, berry sunburn [13,14,15] and ozone injury often occur on ‘Chambourcin’ in the VST canopy because of direct sunlight [16]. The Athena training system is limited by higher setup costs because of the division canopy [12]. It is thus important to develop a suitable training system to reduce ozone injury and the need for summer pruning to control vine growth. Developing such a system requires the wine industry to understand the impact of training options on leaf microenvironment temperature, light, ozone stress, and berry quality [17,18]. This study thus focused on studying different canopy types to select the canopy type that saves labor and contributes to healthy growth and fruit quality of ‘Chambourcin’ to provide a reliable basis for cultivation.

2. Materials and Methods

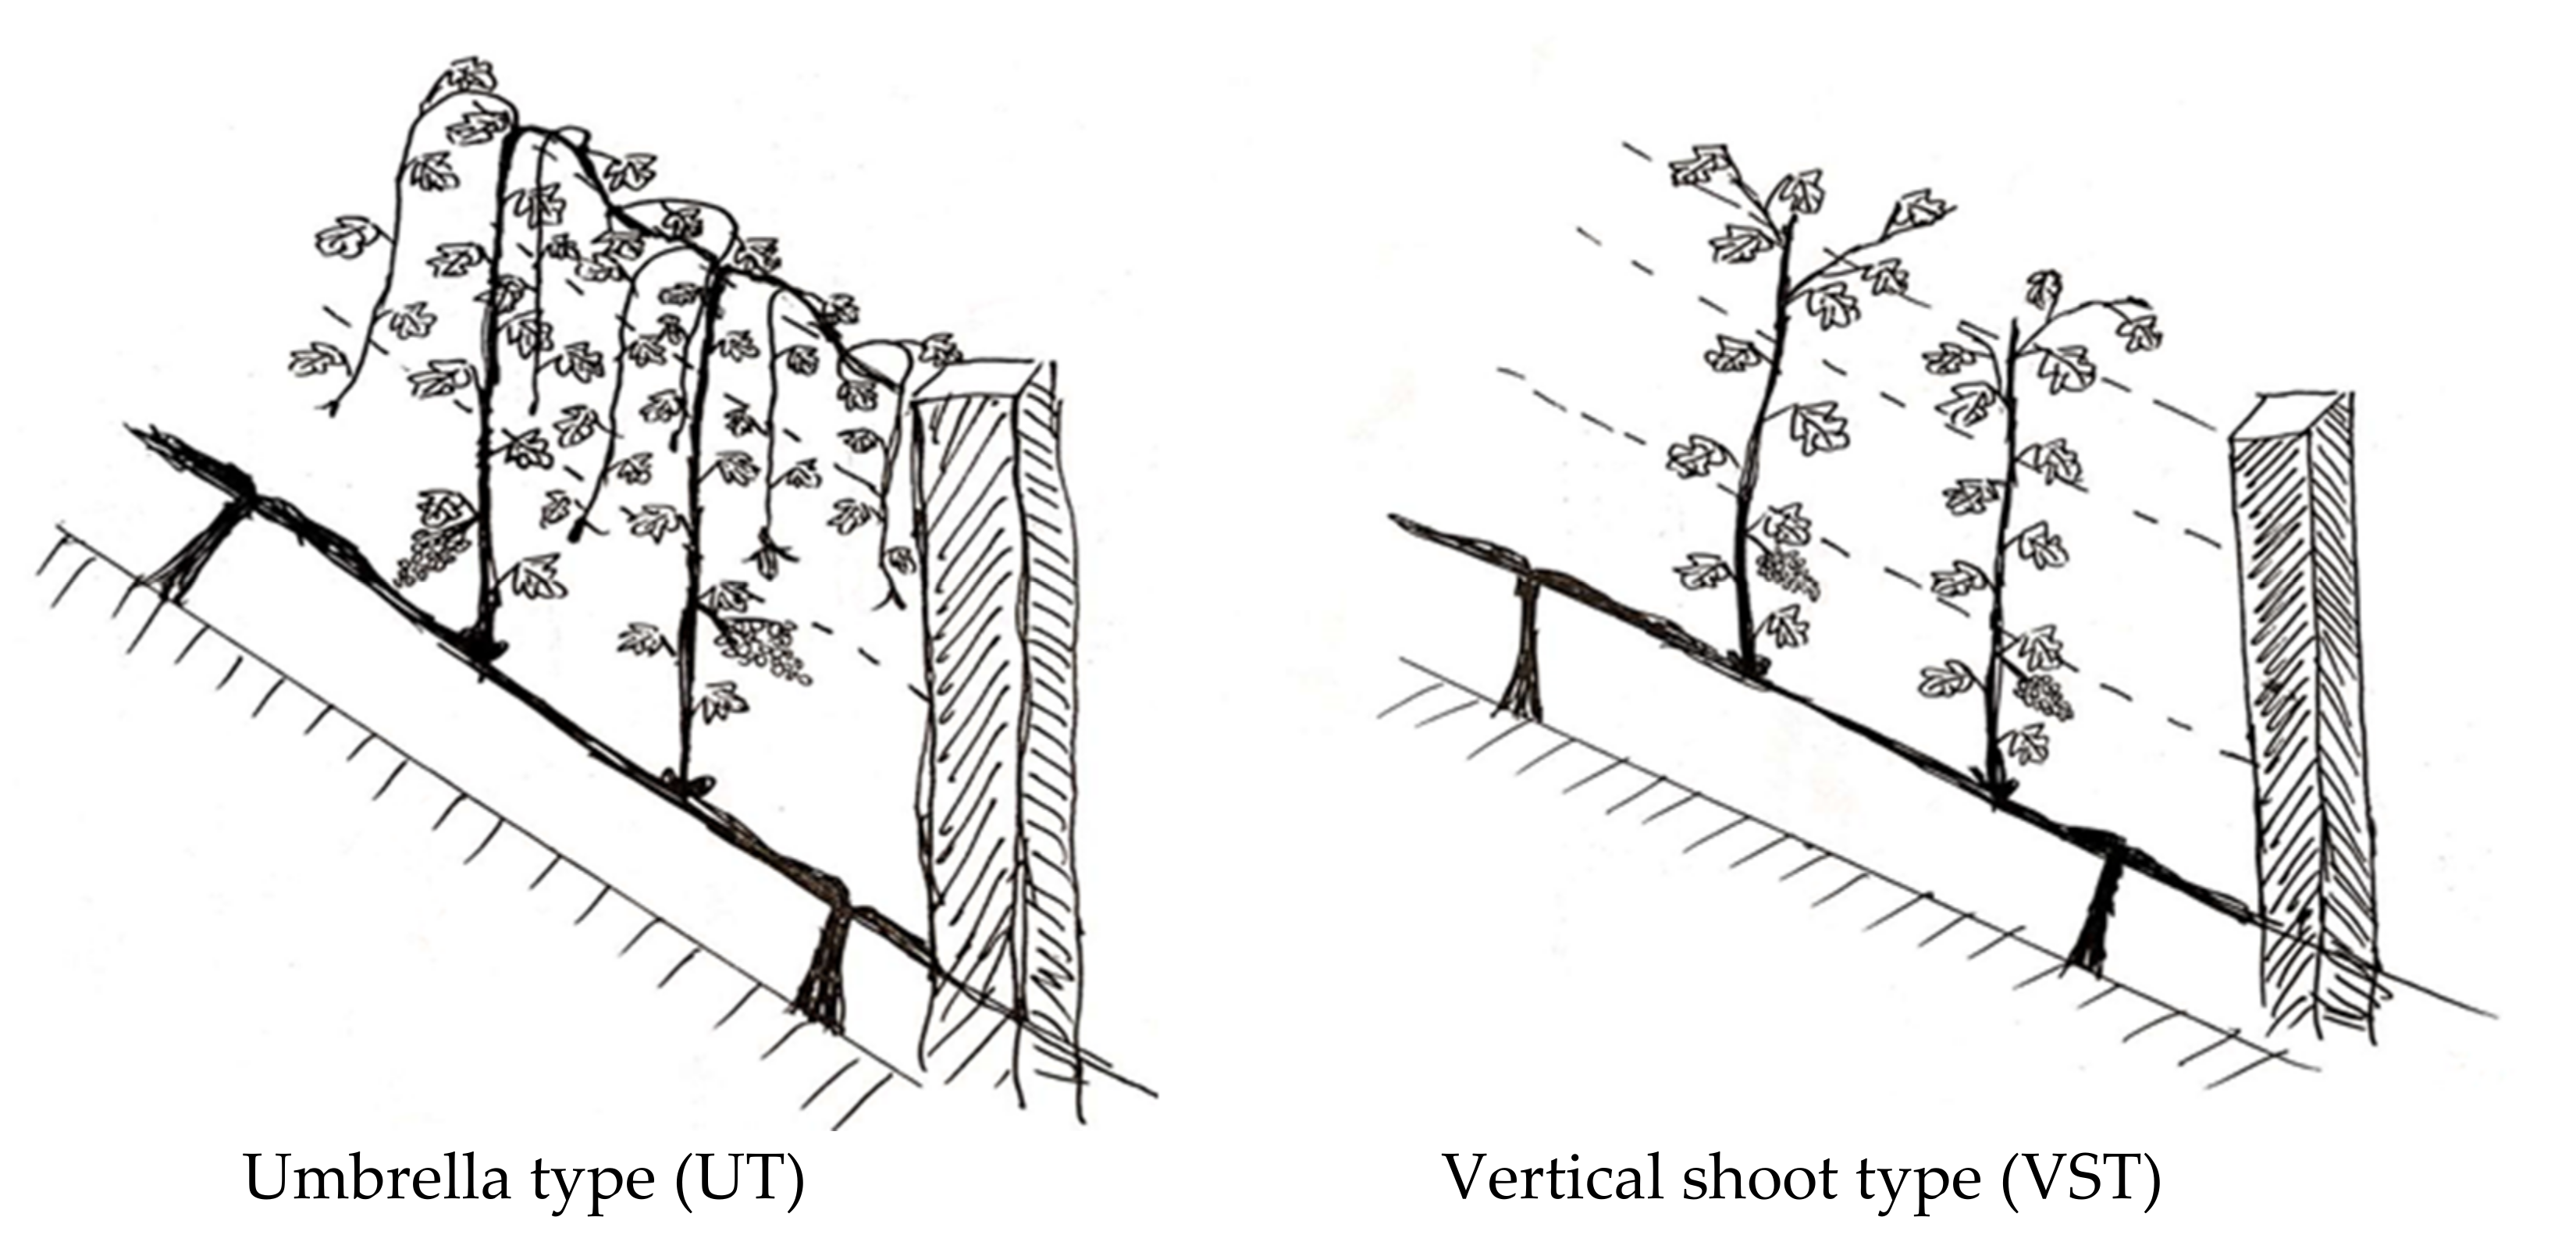
2.1. Materials and Canopy Management

This experiment was conducted between May 2020 and August 2021 at the experimental vineyard station of Shandong Agricultural University (GPS positioning is 36°17′17.98″ N and 117°16′85.64″ E). The area has a temperate monsoon climate, with an annual average rainfall and temperature of 697 mm and 13 °C, respectively. The daily maximum ozone value range from June to September was 14–56 nL·L−1, with an average value of 30.6 nL·L−1.
Two canopy types, the vertical shoot shape canopy (VST) and the umbrella type canopy (UT) (Figure 1), were developed using ‘Chambourcin’ (Seyve-Villard 12-417×Seibel 7053).
Vines in the VST system were trained to bilateral cordons 1m above ground. Shoots were tucked upward between horizontally distributed catch wire as needed throughout the summer. The vines were pruned four times: on 12 June, 4 July, 15 July, and 15 August, after the shoots reached the top wire. The lateral shoots were pruned to one leaf.
Vines in the UT system were trained to bilateral cordons 1m above ground. Shoots were tucked upward between horizontally distributed catch wire as needed. The top tips of the vines were picked on 12 June, when the shoots were 20 cm higher than the top wire and were twined around the top wire. The lateral shoots below the top wire were pruned to one leaf, whereas the lateral shoots above the top wire were maintained and let to droop naturally to form a uniform umbrella shape. The droopy lateral shoots were pruned on 15 August and maintained at 20 cm in length. There were three replicates per treatment, with two rows of 240 trees per replicate.

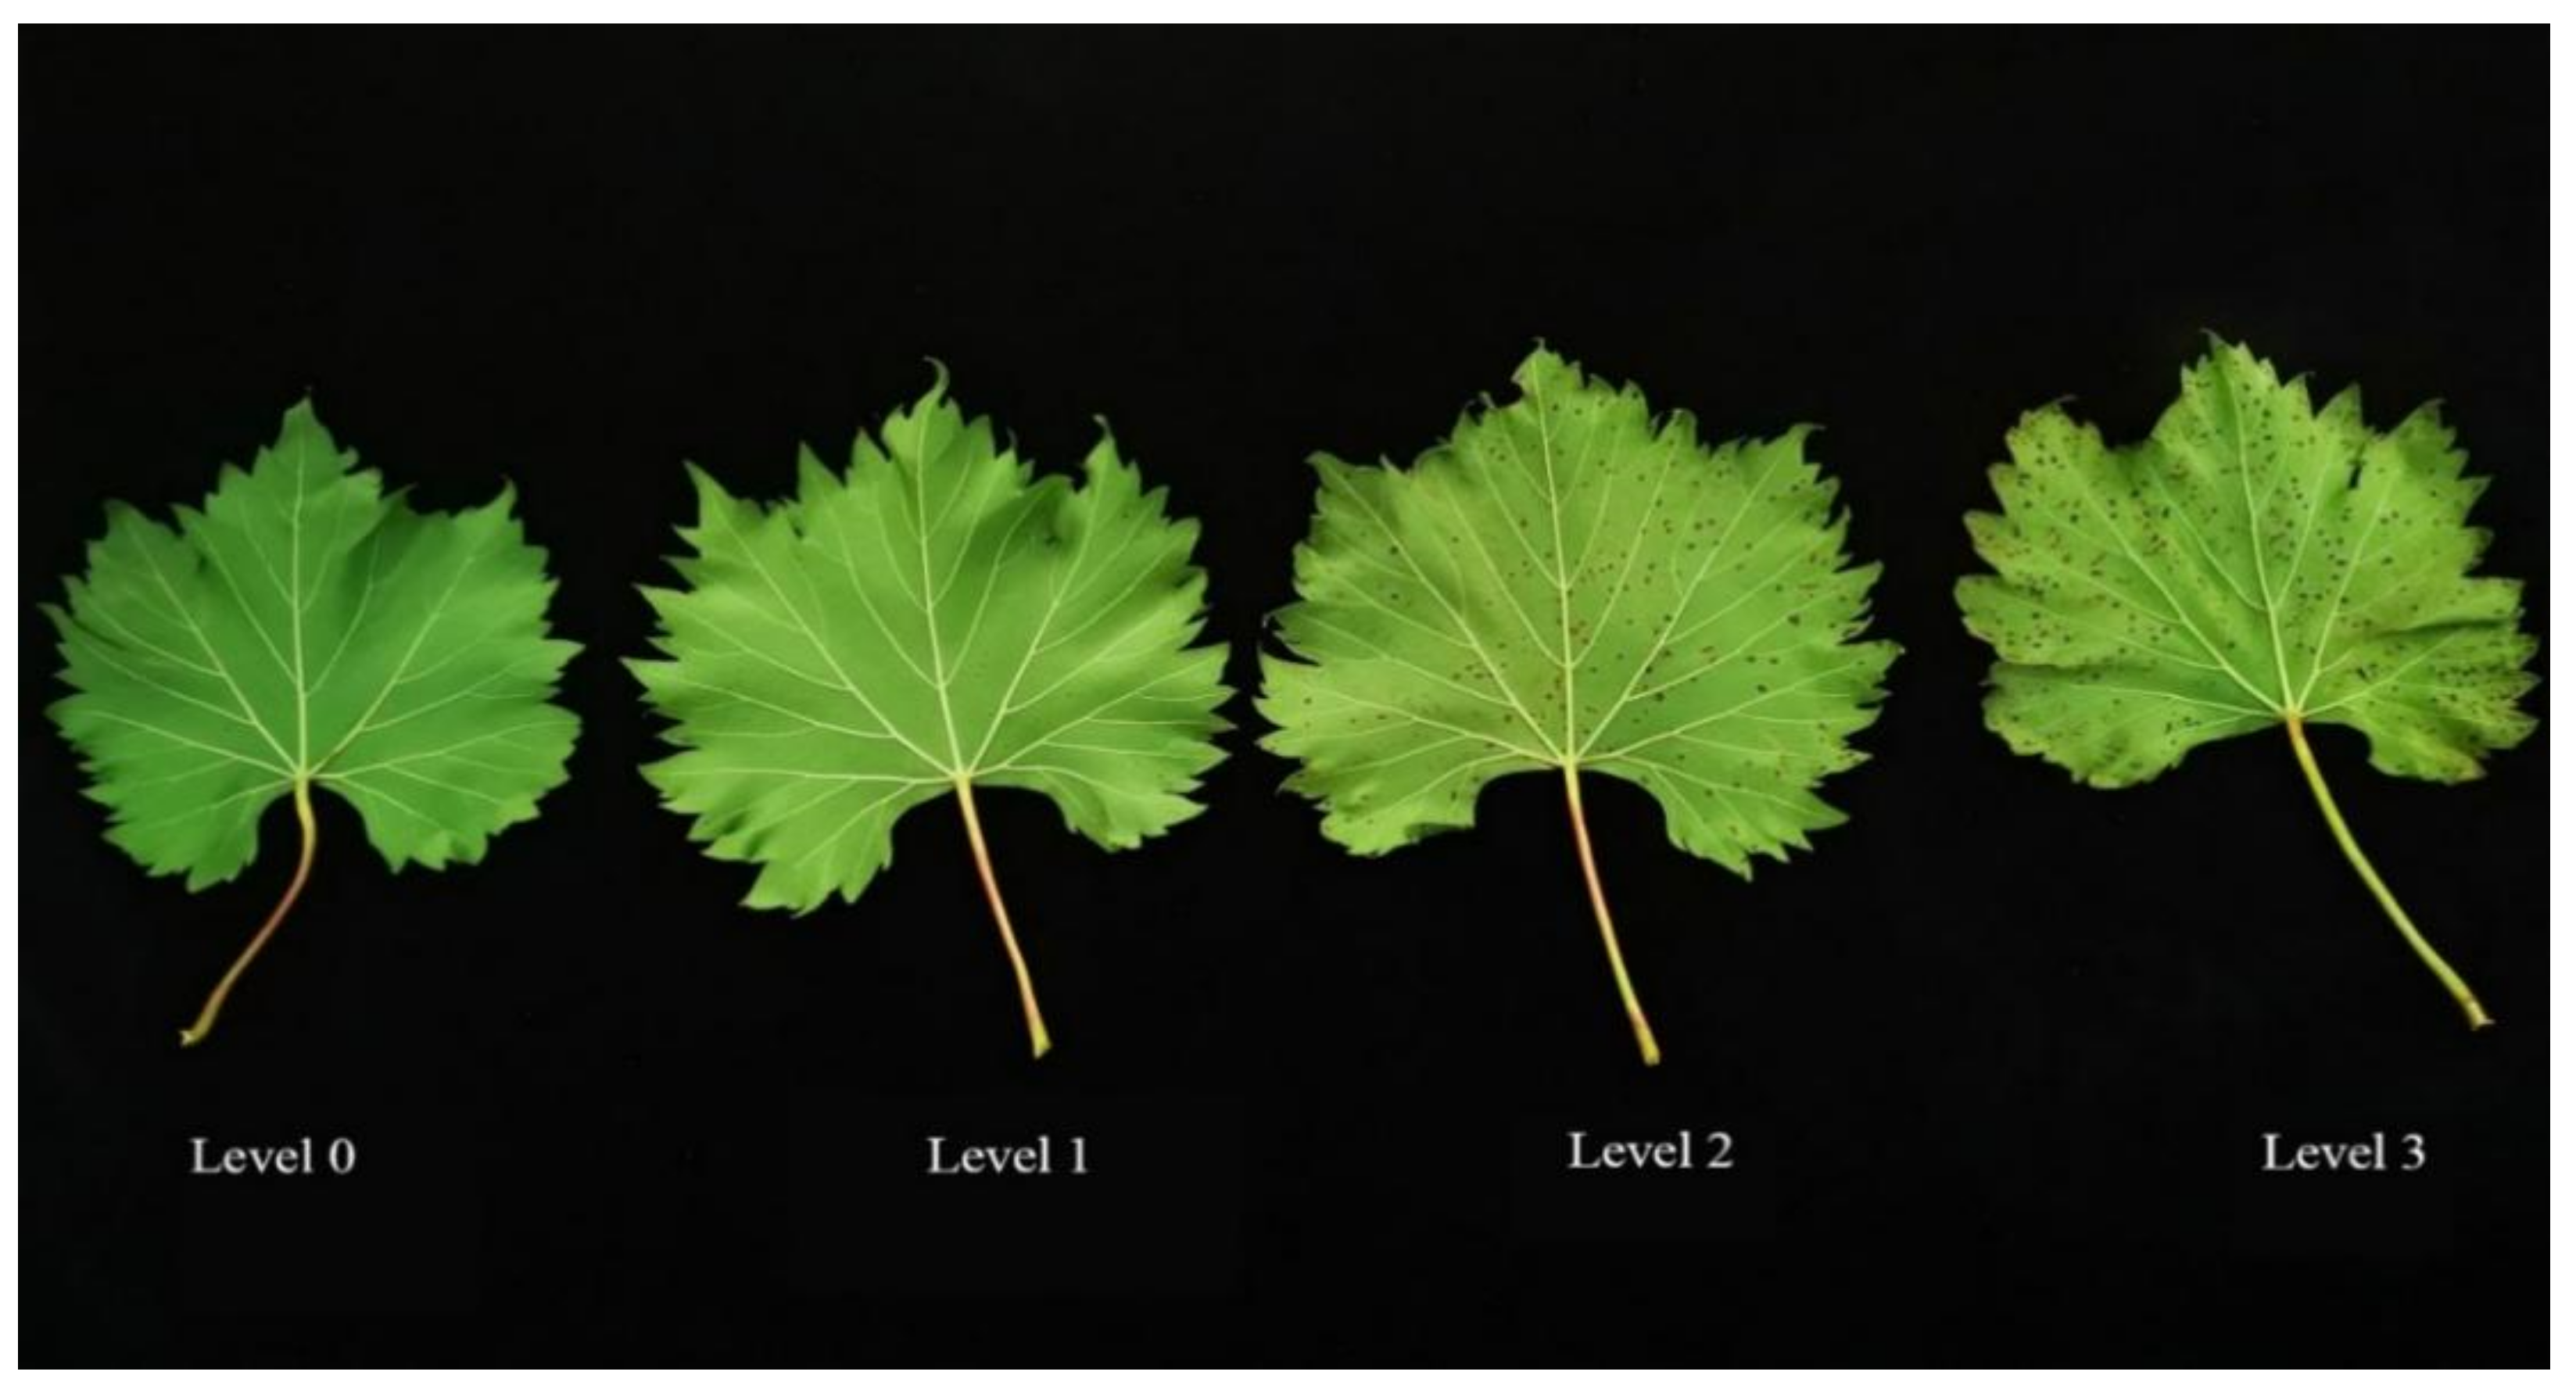
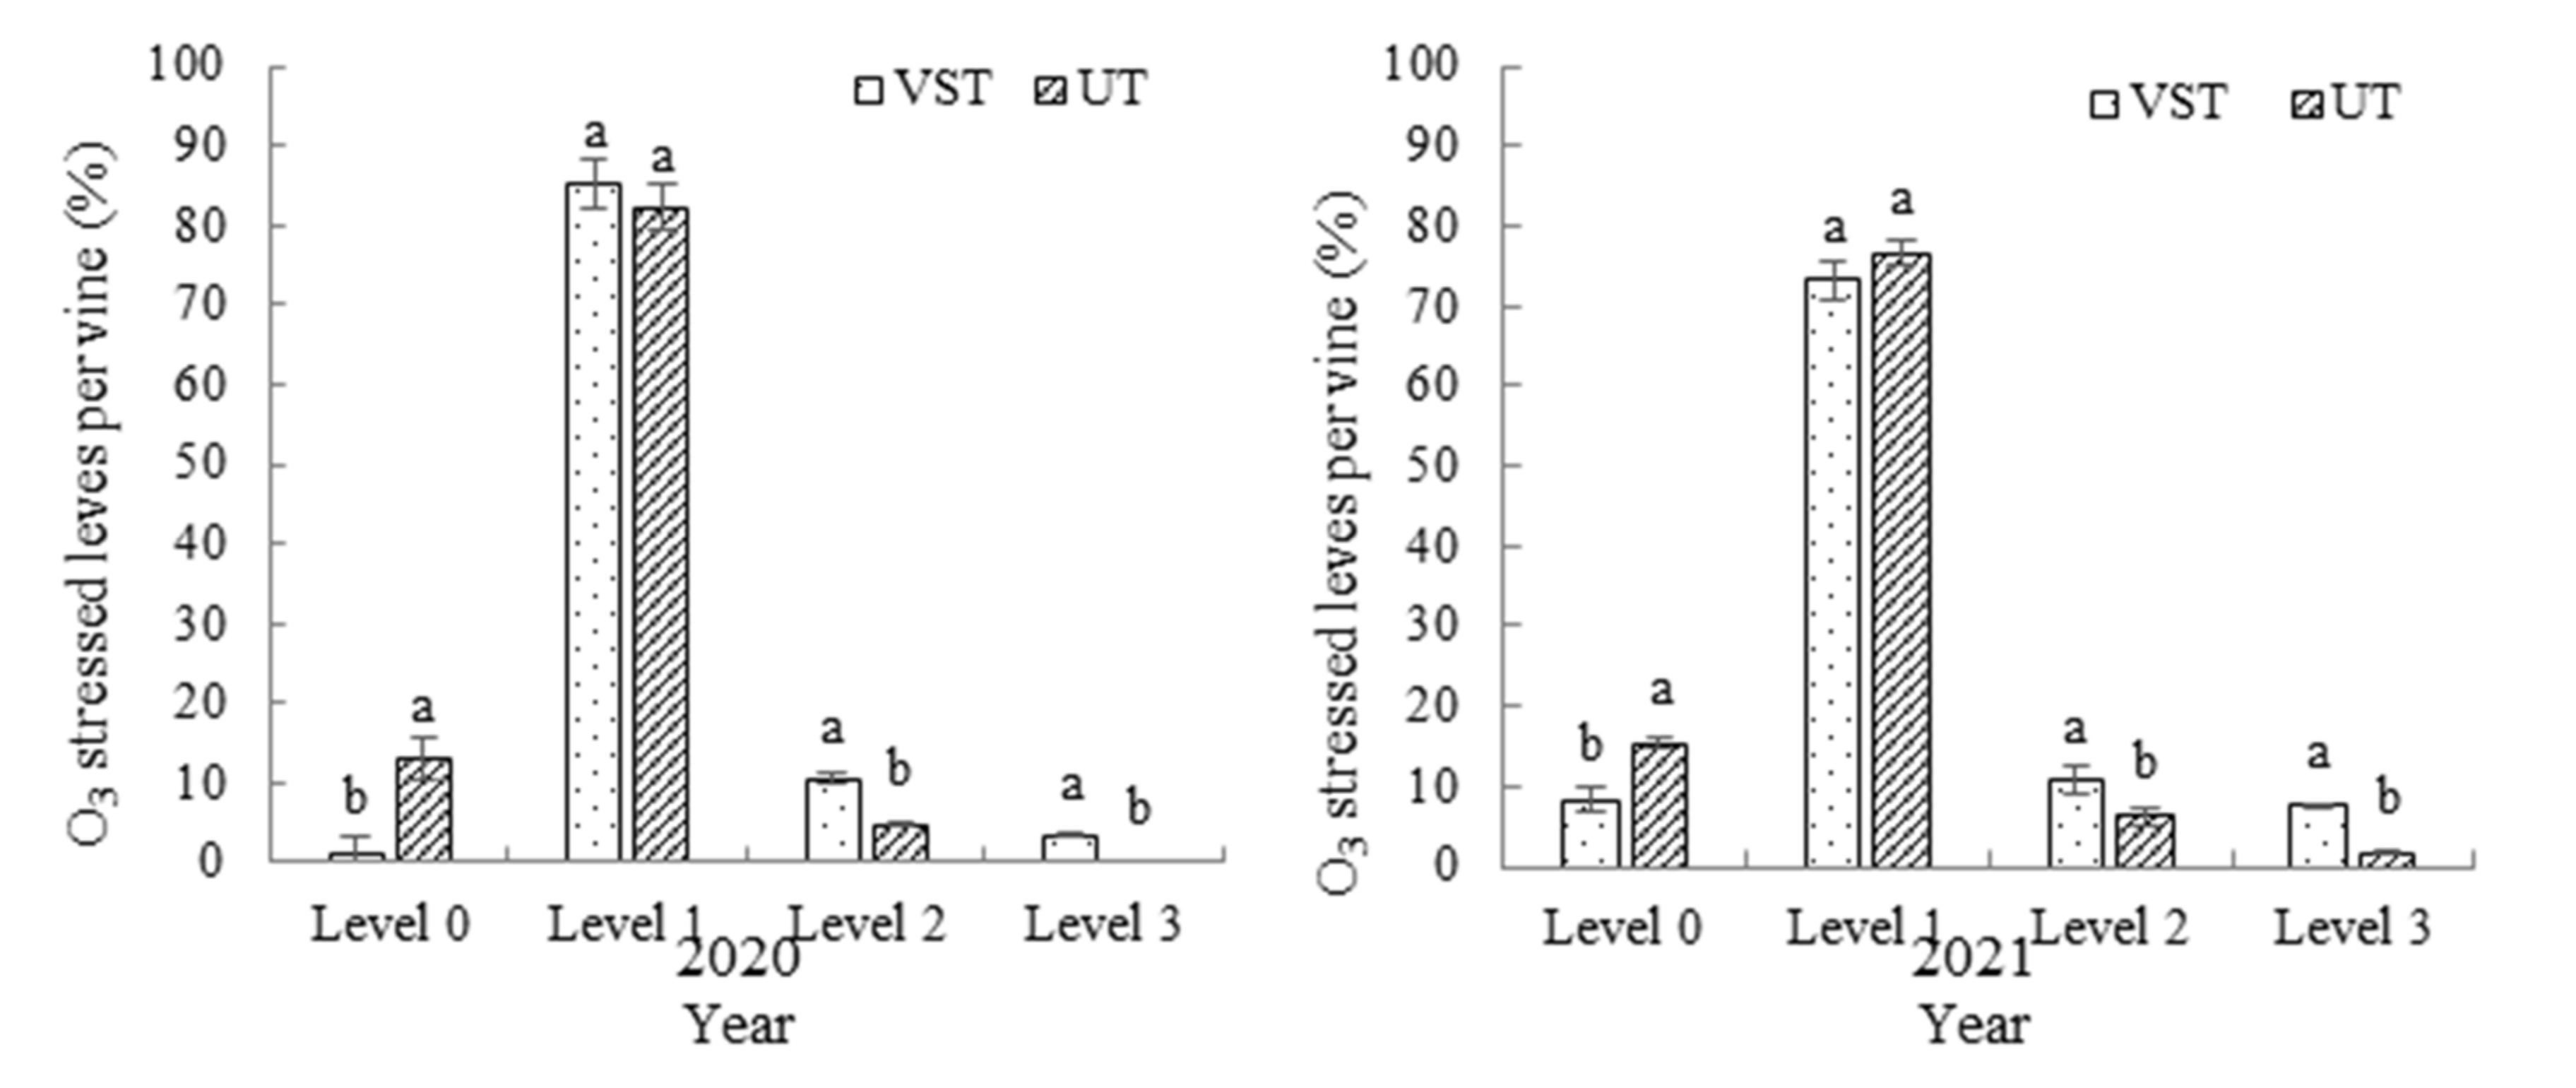
2.2. Ozone Injury Classification

The class of intensity of symptoms and the necrotic surface of leaves were examined by scorers. The classification of leaves with ozone damage shows in Figure 2. Level 0: less than 5% of leaf surface covered by necrotic lesions; level 1: 5–30% of leaf surface covered by necrotic lesions; level 2: 30–60% of leaf surface covered by necrotic lesions; level 3: more than 60% of leaf surface covered by necrotic lesions [19]. Ten plants were randomly selected from each treatment for the ozone injury classification, and there were three replicates per treatment.

2.3. Monitoring of Temperature

The temperature and humidity monitor (LUGE, L92-1, Hangzhou, China) was installed around the fruit region of both leaf canopy types.

2.4. Determination of the Leaf Area Index (LAI) and Diffuse Non-Interceptance (DIFN)

After the canopy was formed, without direct radiation (cloudy day, morning, and evening), the light intensity changes above and below the canopy (or inside and outside) were measured from the zenith angle directions of five different angles by using the LAI-2200C (LI-COR, Inc., Lincoln, NE, USA) canopy analyzer with a ‘fish-eye optical sensor’ (148° vertical field of view and 360° horizontal field of view), and the canopy structure parameters’ leaf area index (LAI) and the diffuse non-interceptance (DIFN) were calculated by a vegetation radiation transfer model [20,21]. Five plots were randomly selected and two quadrats with uniform growth were selected in each plot, for a total of 10 repetitions. During each repeated measurement, the top of the canopy was measured once, and the lower part was measured repeatedly on the same horizontal plane at the base of the grape stem 6–10 times.

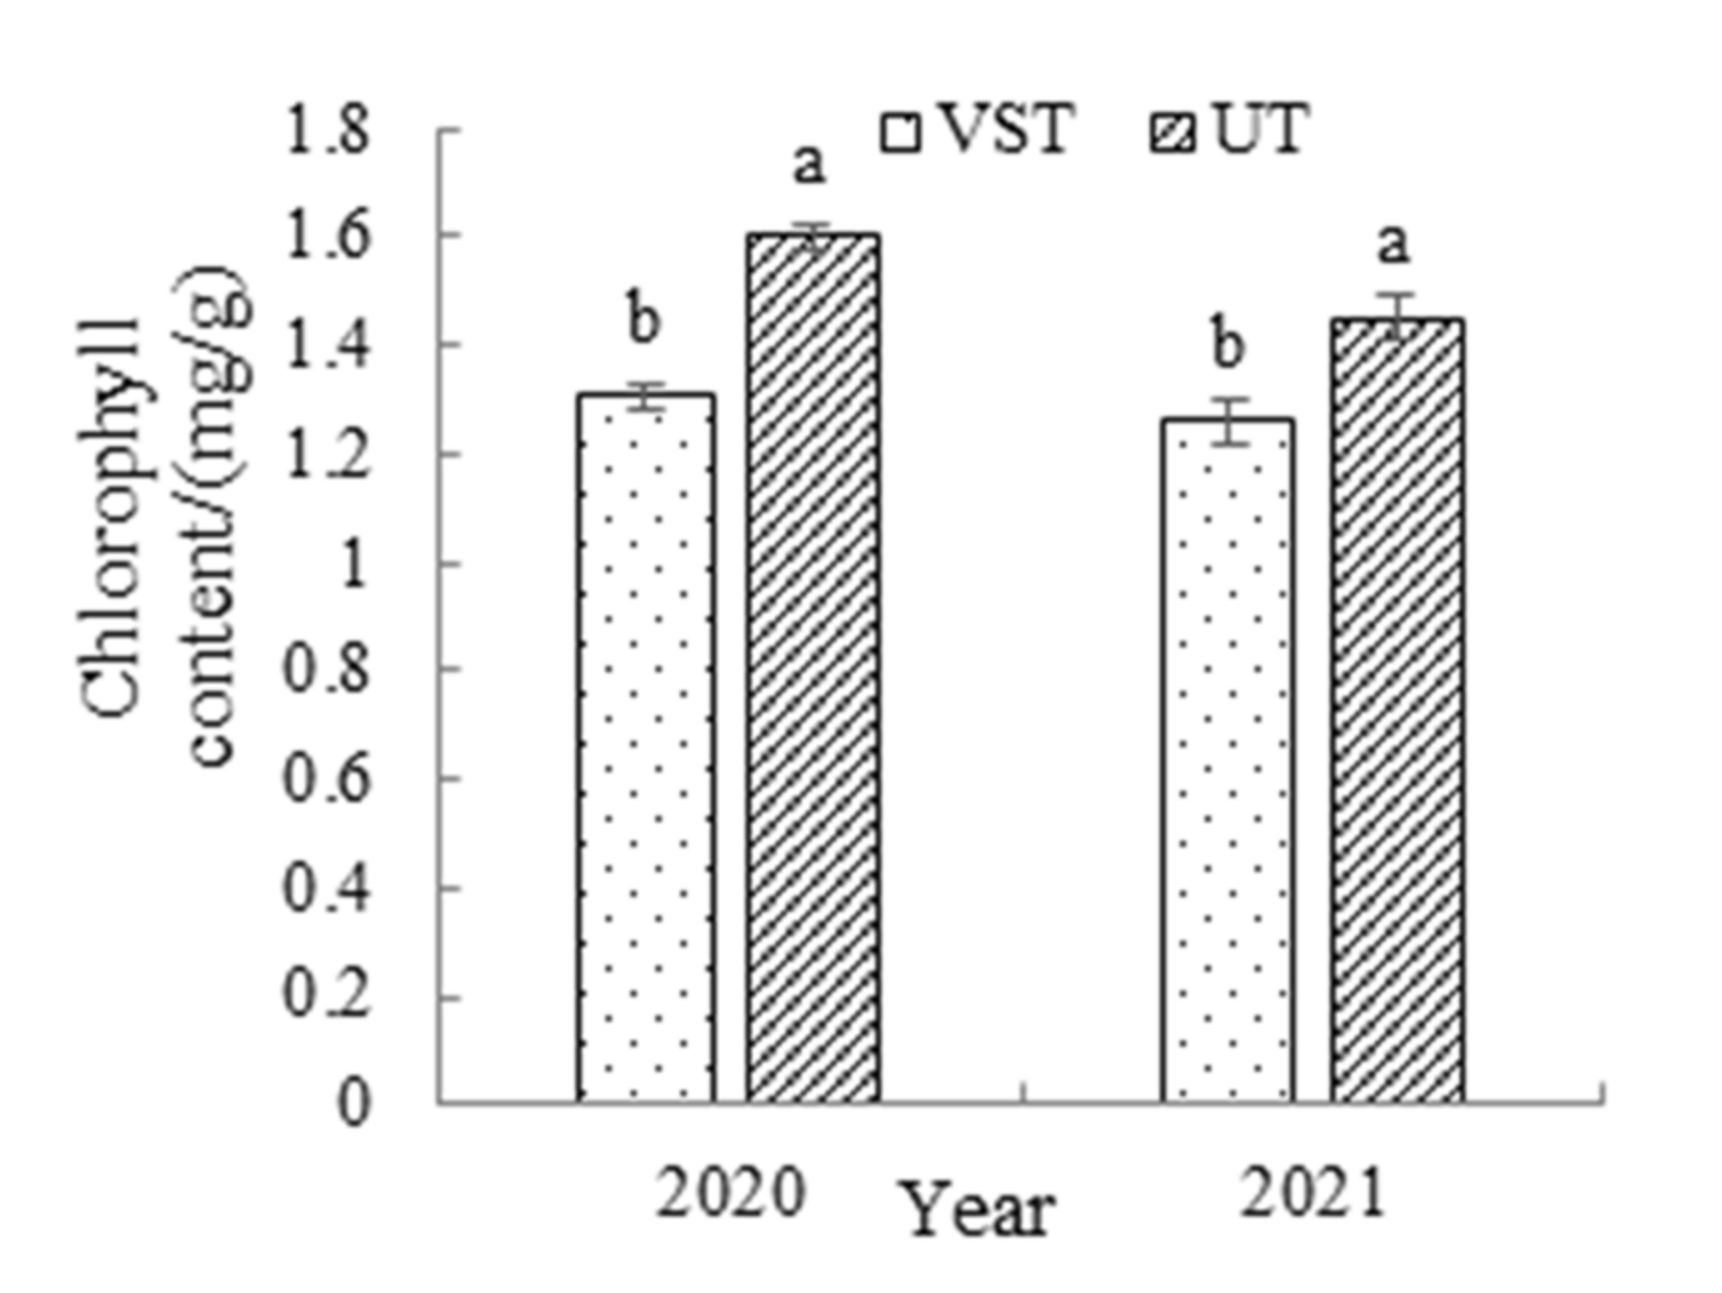
2.5. Determination of Chlorophyll Content in Grape Leaves

The fifth node leaves were collected during the color-changing period and the chlorophyll content was determined using the ethanol-acetone extraction colorimetric method [22], with slight modification. Fresh plant leaves (0.2 g) were washed, dried, chopped, and placed in a 25 mL glass test tube; 10 mL of 95% ethanol was added and extracted for 24 h without light. After 24 h, the volume was fixed to the 25 mL scale line and compared at the wavelengths of 649 nm, 665 nm, and 470 nm. The calculation formula of chlorophyll content in the sample was as follows:
Chl a (mg·g−1) = [(13.95 × A665) − (6.88 × A649)] × mL ethanol/mg leaf tissue.
Chl b (mg·g−1) = [(24.96 × A649) − (7.32 × A665)] × mL ethanol/mg leaf tissue.
Carotenoids (mg·g−1) = [(1000 × A470) − (2.05 × Chl a) − (114.8 × Chl b)]/245 × mL ethanol/mg leaf tissue.
Total Chl = Chl a + Chl b.

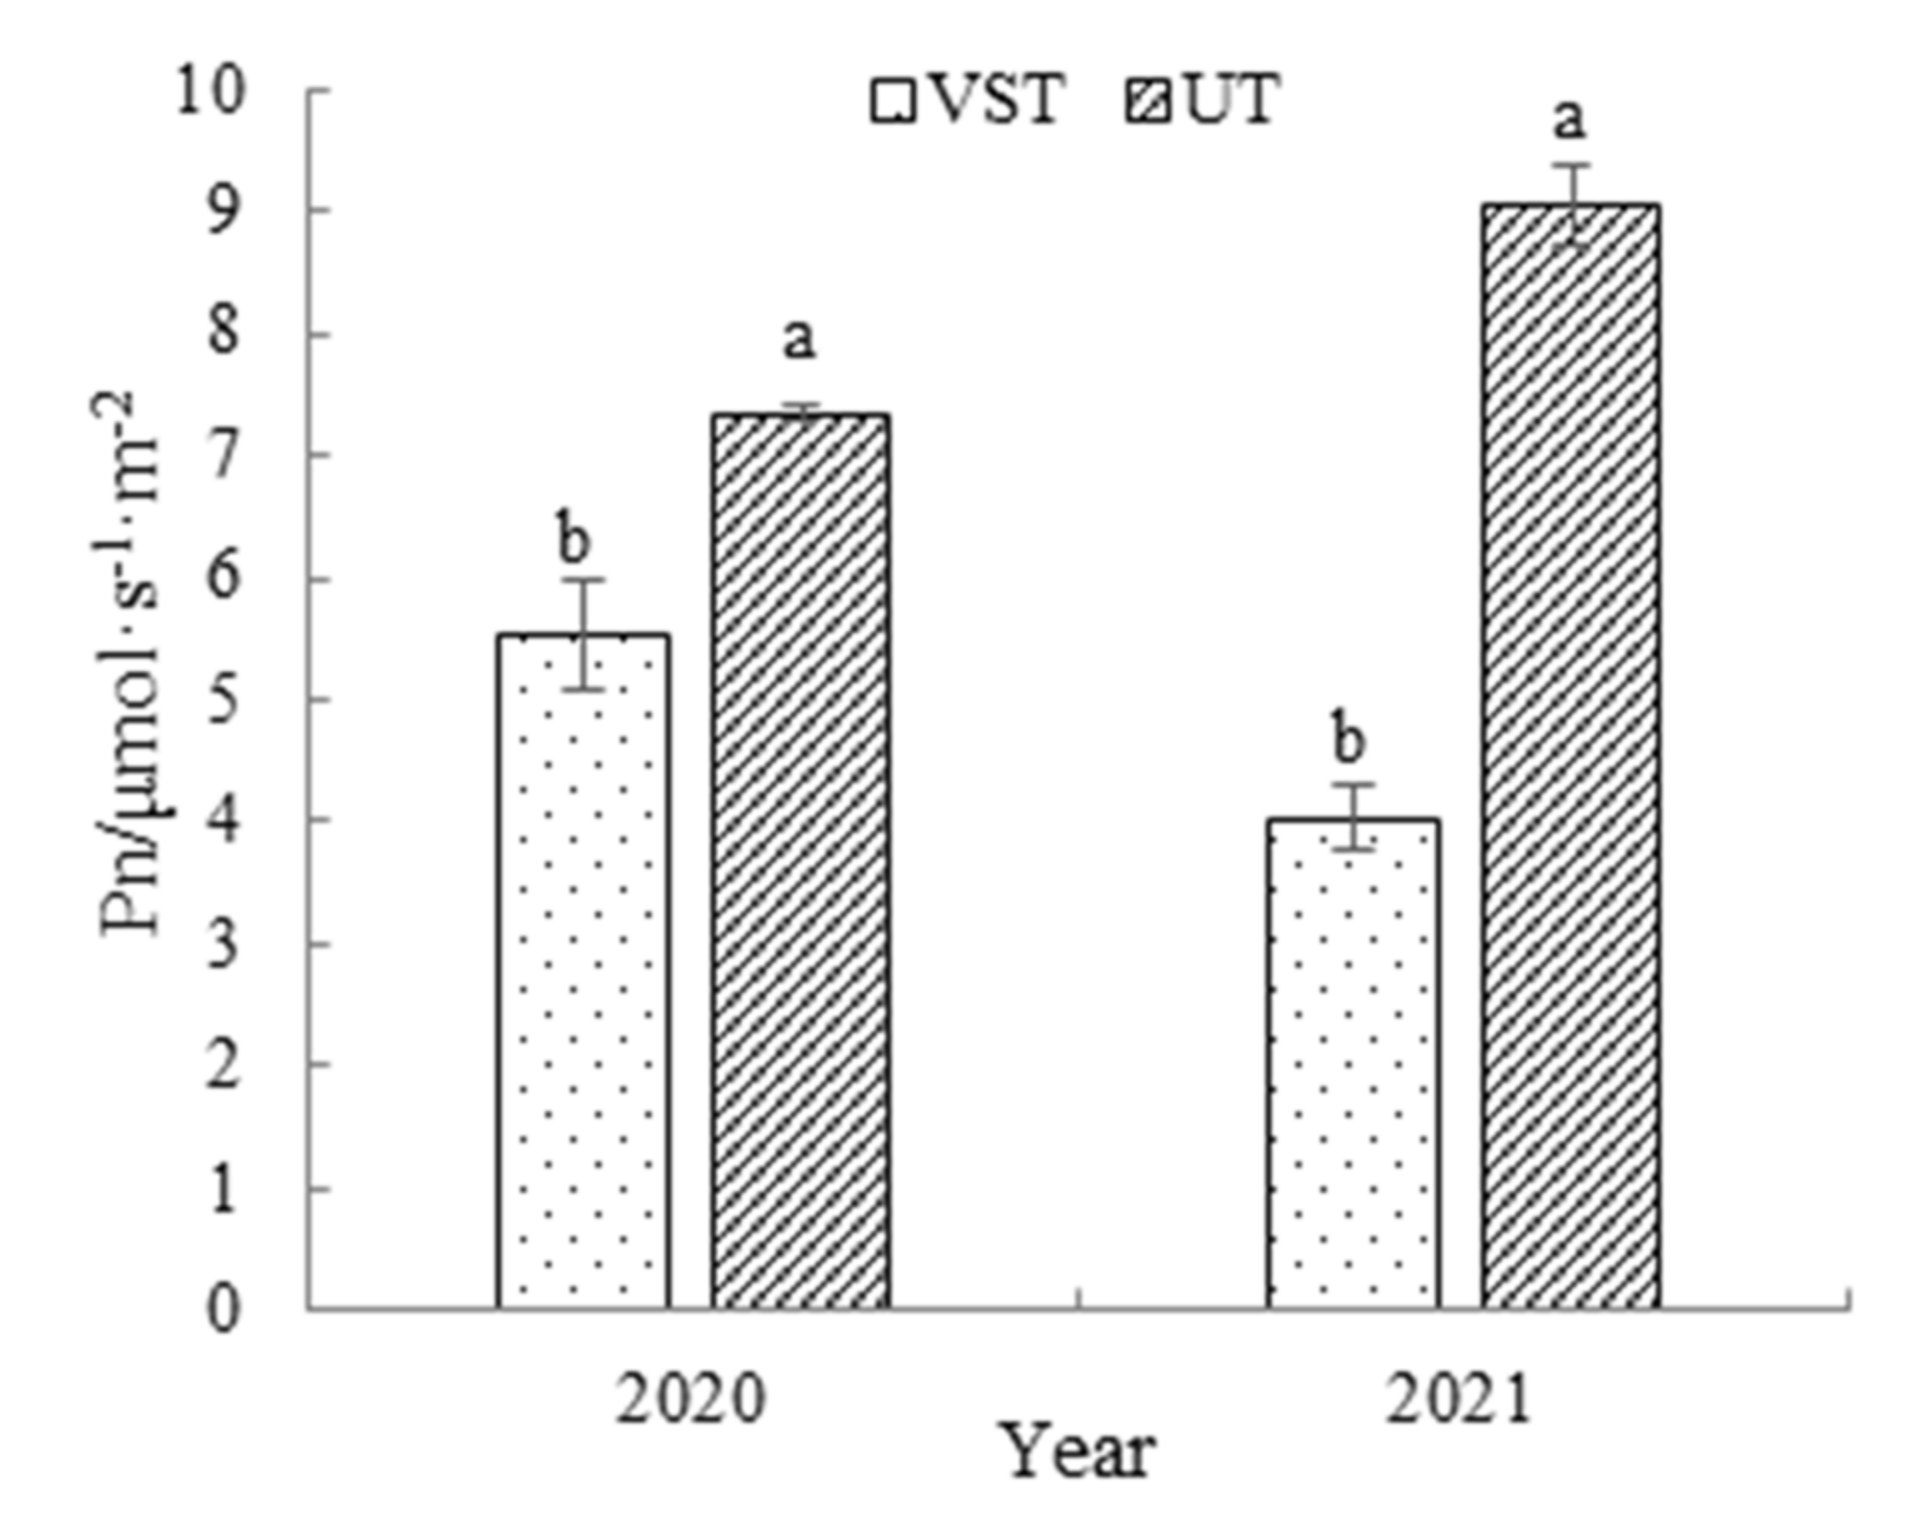
2.6. Determination of the Photosynthesis Rate

During the color-changing period, an estimate of bunch exposure was obtained by measuring the net photosynthetic rate of the sixth node leaves with the CIRAS-3 (PP SYSTEMS, Amesbury, MA, USA) portable photosynthesis meter (at least ten times) from 9:00 to 10:00 on a sunny day. Readings for each set of measures were averaged to calculate an estimate of vine exposure. The photosynthetic parameters of the photosynthesis meters were manual. Air with a known CO2 concentration (385 ± 5 ppm) and 70 ± 5% RH was supplied at a constant flow (200 cm3 min−1)) into the leaf chamber. Leaf temperature was 30 °C as monitored and photosynthetic photon flux density (PPFD) was 1200 µmol·m−2·s−1 as measured with a quantum sensor.

2.7. Determination of Light Transmittance and Space Photosynthetically Active Radiation

During the color-changing period, 3 plants were selected with the same growth trend, and the light quantum meter (3415F type, pulse photoelectric sensor; Spectrum Technologies, Inc., Plainfield, IL, USA) was used to measure the effective photosynthetic radiation of the leaf canopy at 11:00 during sunny and windless weather: this was performed using the grid method, where the central leading stem was taken as the starting point, posts were set up every 40 cm in and between rows, and a metering point was marked at a height of 0 m from the ground.
The light transmittance = the photosynthetic active radiation (PAR) of outer canopy/the photosynthetic active radiation (TPAR) of inner canopy.
The light energy interception rate (CaR) = (PAR-TPAR)/PAR × 100%.

2.8. Berry Quality Indexes Determination

At the maturity stage, twenty bunches were randomly collected from both east and west sides of each treatment. A total of 100 berries (0–1500 g, 0.01 g) were weighed 10 times. The soluble solids of 30 berries were measured using a WZB-45 digital refractometer (Shanghai Precision Scientific Instrument Co., Ltd., Shanghai, China). The berries were first squeezed and centrifuged. Determination of the titratable acid content was made through pH titration [23]. These assays were replicated thrice.

2.9. Determination of the Total Amount of Phenols, Flavonoids, Flavanols, and Anthocyanins

The total phenol content in the grape skin was determined using the Folin–Ciocâlteu method [24]. The contents of the flavonoids, flavanols in the peel, and total anthocyanins were determined using nitrite-aluminum chloride [25], vanillin hydrochloric acid, and pH differential methods [26], respectively.

2.10. Statistical Analyses

Statistical analysis was performed using the software SPSS (V20.0, IBM, Armonk, NY, USA). One-way analysis of variance was followed by Duncan’s multiple range test (p < 0.05).

3. Results

3.1. Effect of Canopy Types on the Temperature and Humidity around Grape Berries

There were significant differences in temperature and humidity around the grape berries between the two canopy types. An extremely high temperature of 40.8 °C was detected around the fruit region of the VST canopy in 2020. Notably, 3.94% of the VST canopy was more than 35 °C in August 2021, compared to 3.01% of the UT canopy. The temperature fluctuation of the UT canopy was less than that of the VST canopy, with the VST canopy having a 0.8 °C higher temperature difference range than that of the UT canopy in 2020. The humidity around the fruits in the UT canopy was relatively higher, causing significant cooling (Table 1).

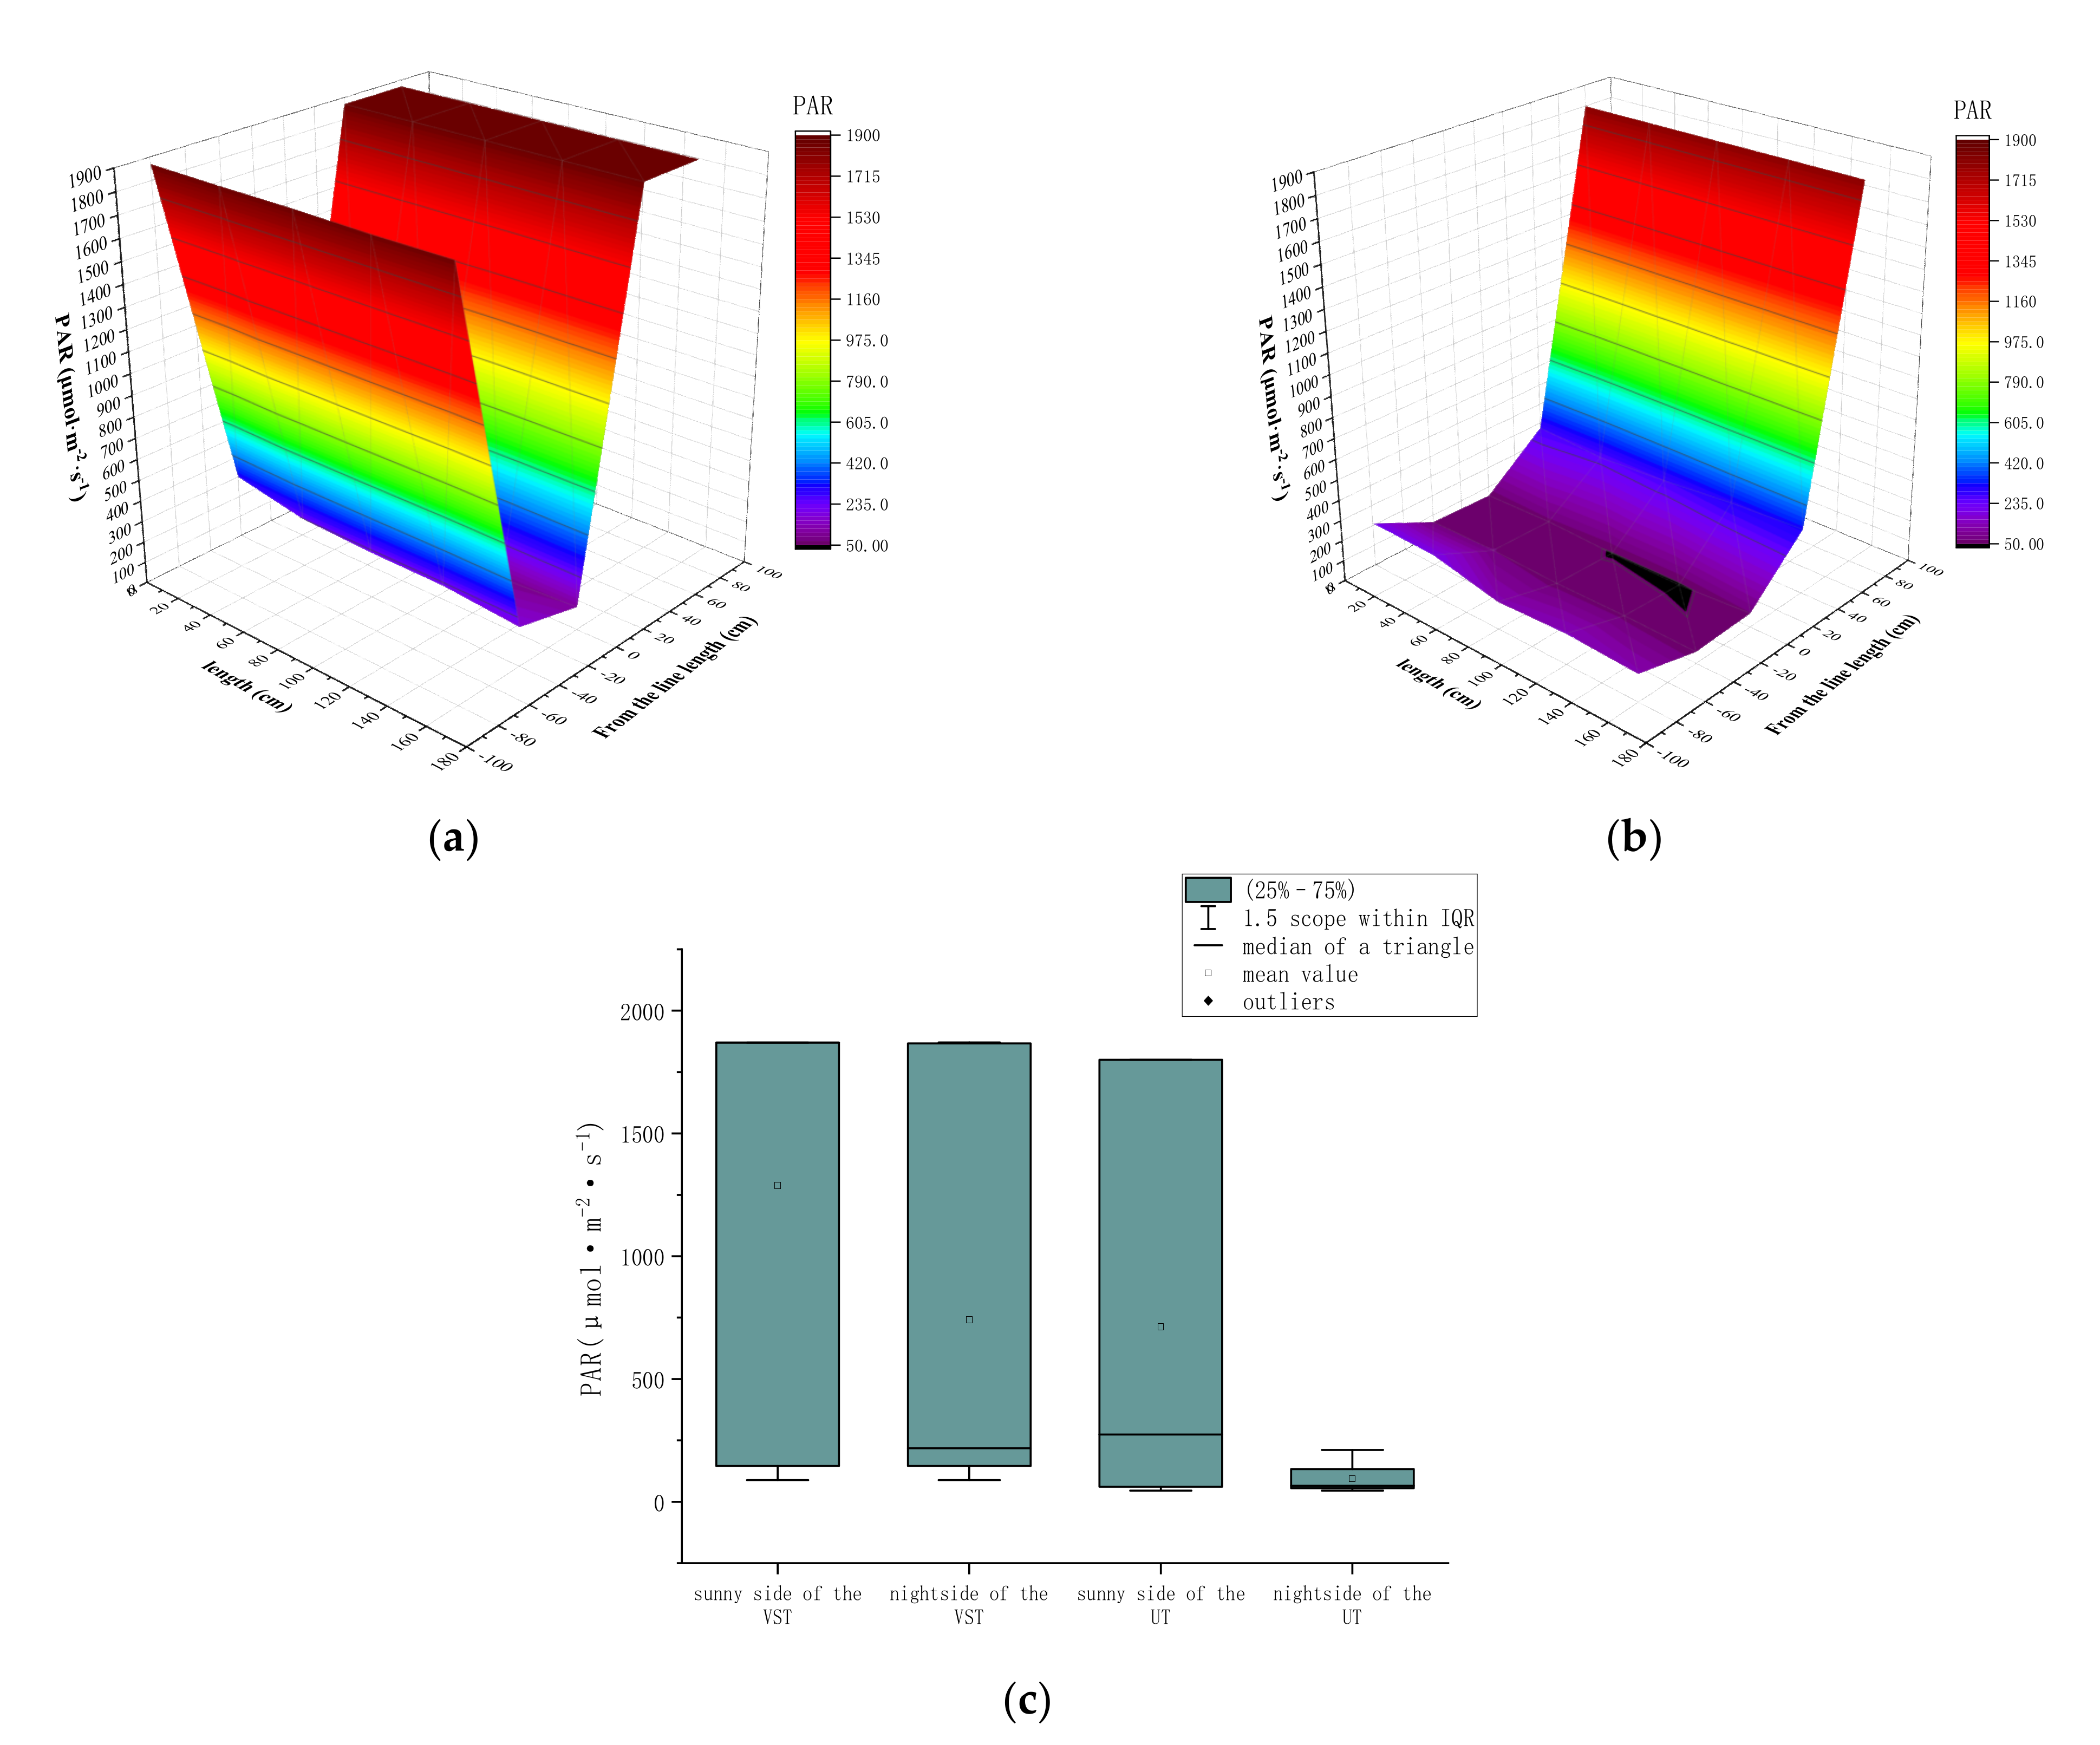
3.2. Effects of Canopy Types on the Spatial Distribution of Photosynthetic Active Radiation

The comparison of the photosynthetic active radiation (PAR) on the land surface of the VST canopy and UT canopy (Figure 3a,b) showed that the lowest point of surface photosynthetic active radiation in both canopy types was close to the row and the farther the distance, the greater the photosynthetic active radiation (Figure 3a,b). The average photosynthetic active radiation on the east and west sides in the rows of the VST canopy were 229.58 and 124 μmol·m−2·s−1, and interception rates were 87.23% and 93.12%, respectively. The corresponding photosynthetic active radiation of the UT canopy was 67.5 and 55 μmol·m−2·s−1, and the interception rates were 96.25% and 96.94%. These interception rates were 9.02% and 3.82% higher than those of the VST canopy. The average photosynthetic effective radiation rates 40 cm from the trunk on the east and west sides of the VST canopy were 1870 and 1868 μmol·m−2·s−1, respectively, and the light interception was about zero. The corresponding photosynthetic active radiation of the UT canopy was 67.5 and 55 μmol·m−2·s−1, and the light interception rates on the east and west sides were 90.65% and 96.58%, respectively. This suggested that the UT canopy had a higher light energy interception 80 cm from the trunk.
The comparison of photosynthetic active radiation (PAR) on the sunny and shaded sides of the VST canopy and UT canopy (Figure 3c) showed that the average photosynthetic active radiation (PAR) on the sunny side of the VST canopy was the highest, at 1287.93 μmol·m−2·s−1, followed by the sunny side of the UT canopy at 740.67 μmol·m−2·s−1 and the shaded side of the VST canopy at 712.20 μmol·m−2·s−1 (Figure 3c). The average PAR on the shaded side of the UT canopy was the lowest at 93.93 μmol·m−2·s−1. Notably, the 25–75% photosynthetic effective radiation range on the sunny side of the UT canopy was equivalent to that of VST on both sides. In contrast, that of the shaded side of the UT canopy was significantly decreased.
Collectively, the transmittance of the UT canopy was lower than that of the VST canopy, and with overall high effectiveness of light energy interception capacity.

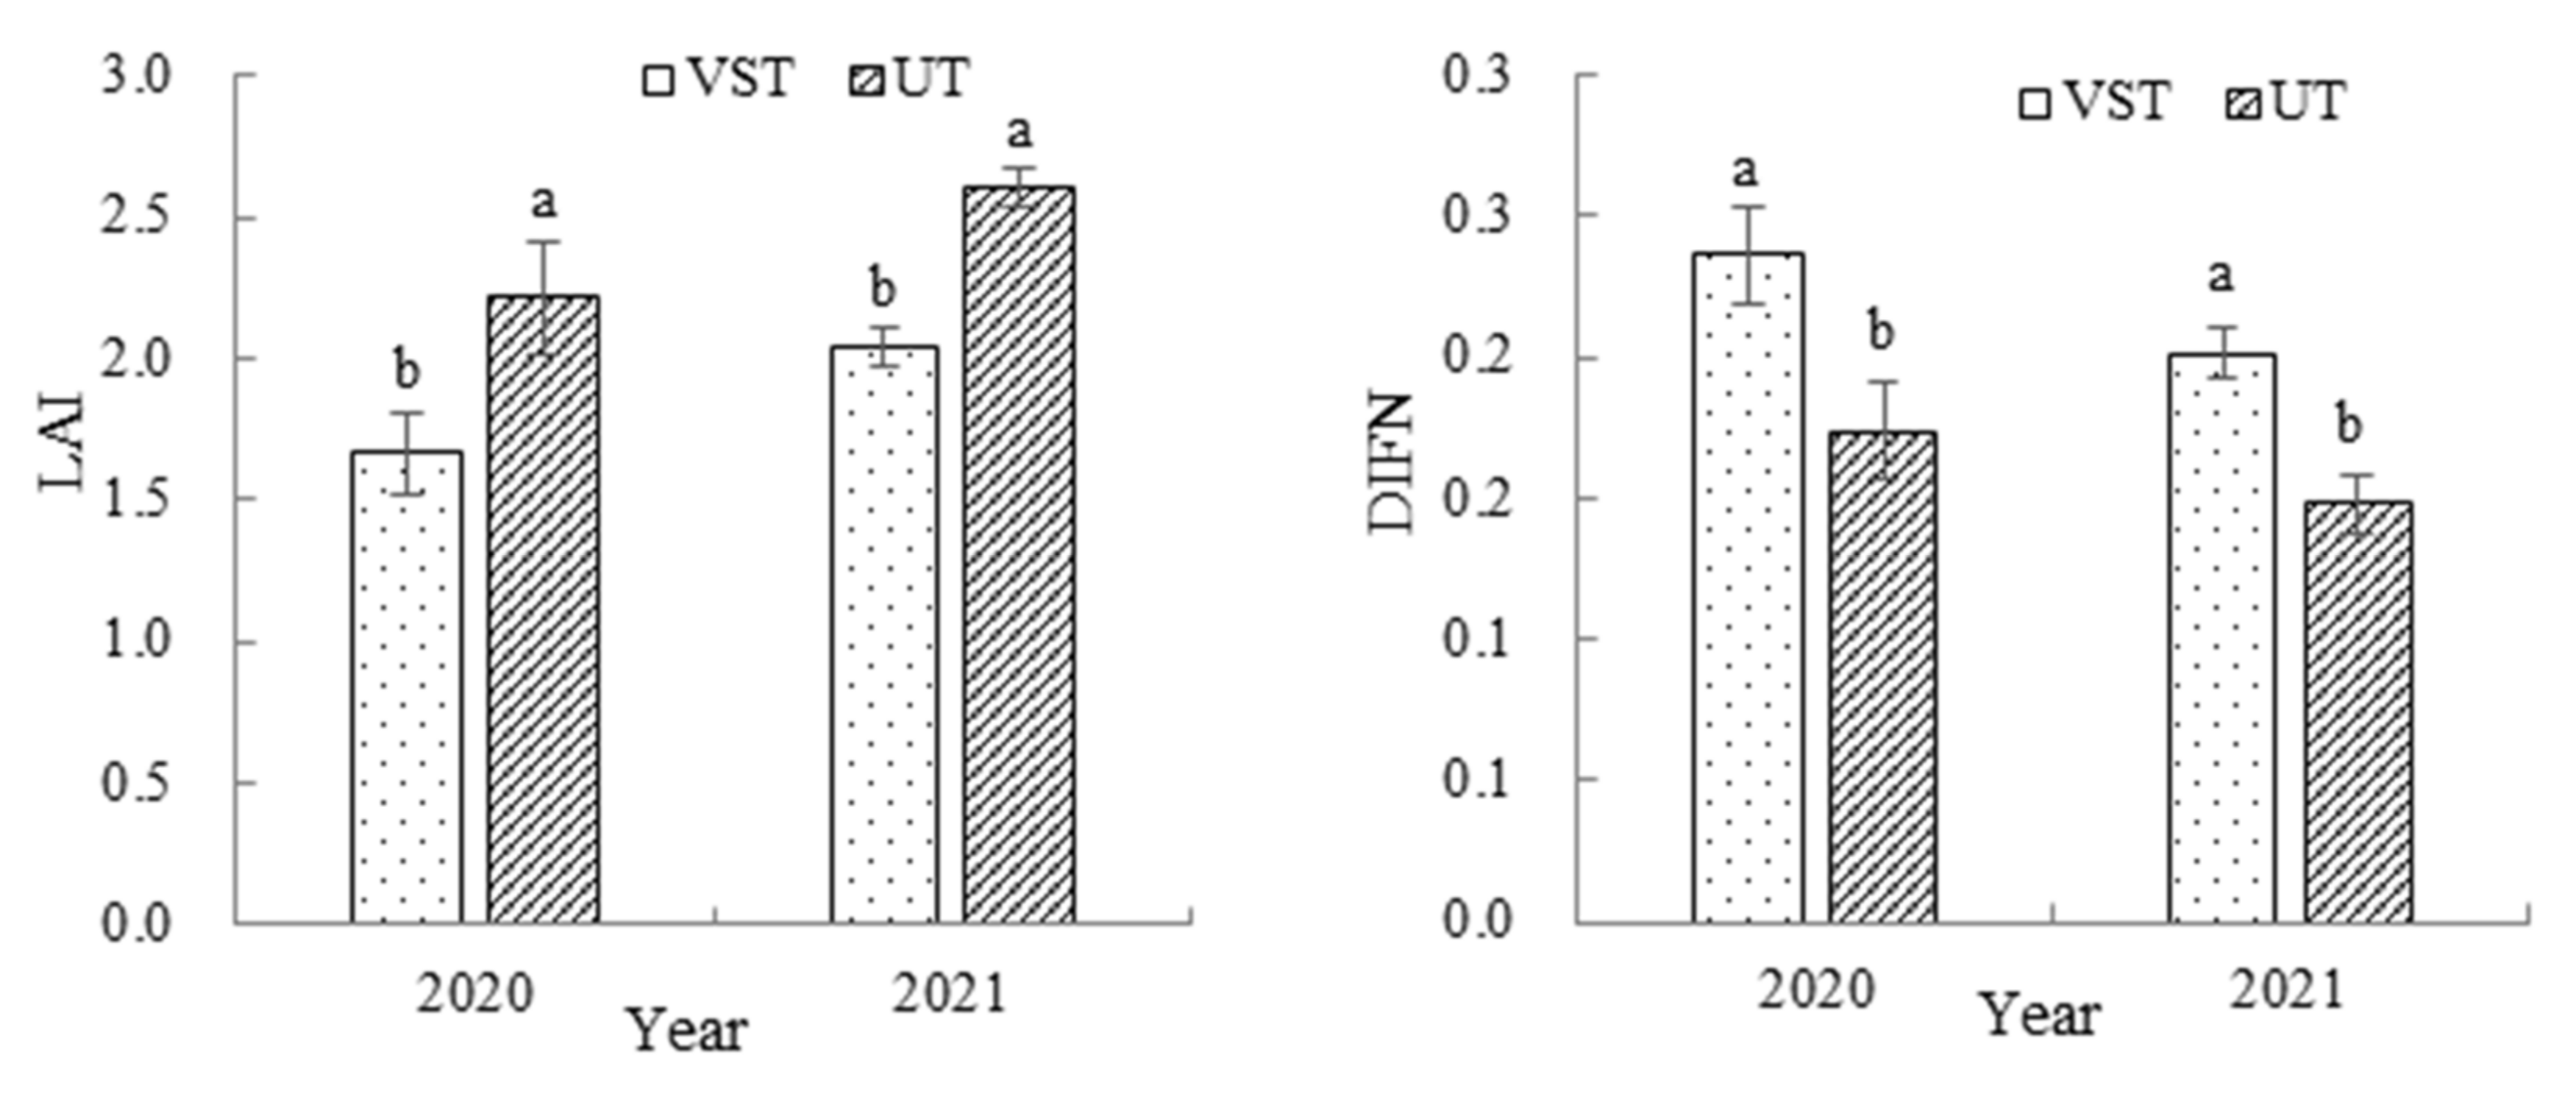
3.3. Effects of Canopy Types on the Leaf Area Index and Diffuse Non-Interceptance

The leaf area indexes (LAI) of the UT canopy in 2020 and 2021 were 2.21 and 2.61, which were 0.55 and 0.57 higher than those of the VST canopy (Figure 4). In the same line, the diffuse non-interceptances (DIFN) of the UT canopy in 2020 and 2021 were 0.17 and 0.15, which were 0.07 and 0.05 lower than those of the VST canopy. These results suggested that the UT canopy significantly increased the leaf area index and reduced the diffuse non-interceptance.

3.4. Effects of Different Canopy Types on Ozone Injury Symptoms in Grape Leaves

‘Chambourcin’ is very sensitive to ozone injury [6,27]. The incidence of ozone injury was different in the primary shoot leaves of different canopy types (Figure 5). The proportion of leaves without ozone stress under the UT canopy in 2020 and 2021 was 12.96% and 15.36%, and 1.23% and 8.36% under the VST canopy. The proportion of level 2 and level 3 ozone injury in the VST canopy was more than 10% and 5%, respectively. Of note, the proportion of level 2 and 3 ozone stress in the VST canopy was 2.12 and 1.74 times that of the UT canopy in 2020 and 3.39 and 4.39 times in 2021. The proportion of level 1 ozone stress between the two canopy types was more than 70%, but not significantly different.

3.5. Effects of Different Canopy Types on the Chlorophyll Content

The chlorophyll content of leaves was significantly different in the two canopy types in 2020 and 2021 (Figure 6). The primary shoot leaves in the UT canopy had a higher chlorophyll content at 1.60 and 1.45 mg/g in 2020 and 2021 than those in the VST canopy at 1.31 and 1.26 mg/g, respectively. Moreover, the chlorophyll content of leaves in the UT canopy increased by 22.14% and 15.08% in 2020 and 2021, more than that of the leaves in the VST canopy.

3.6. Effects of Canopy Types on the Net Leaf Photosynthetic Rate

The UT canopy increased the net photosynthetic rate of grape leaves (Figure 7). The net photosynthetic rates of primary leaves in the VST and UT canopies were 5.53 and 7.34 μmol·m−2·s−1 in 2020 and 4.03 and 9.03 μmol·m−2·s−1 in 2021. The net photosynthetic rate of the UT canopy increased by 32.73% and 124.07% in 2020 and 2021 compared to the corresponding rates in the VST canopy.

3.7. Effects of Canopy Types on the Growth and Development of Grape Berries

The hundred-grain weight of berries from the UT canopy was significantly heavier than that of the VST canopy, increasing by 4.95% and 1.90%, respectively (Table 2). Generally, the UT canopy increased the content of soluble solids and titratable acid. The content of the soluble solids of berries from the UT canopy in 2020 was 20.97%, which was a 12.14% increase compared to the corresponding contents in the VST canopy. The titratable acid of berries from the UT canopy increased by 8.98% in 2021 compared to the corresponding contents in the VST canopy. On all other indexes, there was no significant difference between treatments.

3.8. Effects of Canopy Types on the Anthocyanins, Total Phenols, Flavonoids, and Flavanols of Grape Berries

The contents of anthocyanins, total phenols, flavonoids, and flavanols were higher in 2020 than in 2021 (Table 3). The UT canopy significantly increased the contents of anthocyanins, total phenols, flavonoids, and flavanols by 32.53%, 60.70%, 71.15%, and 91.86%, respectively, in 2020. There was an increase in anthocyanins and total phenols by 52.12 and 7.6%, respectively, in 2021. There were no significant differences in the contents of flavonoids and flavanols between the two canopies.

4. Discussion

‘Chambourcin’ is highly sensitive to ozone stress. A notable ozone injury was noted in early July, and the leaf senescence aggravated with time, leading to less soluble solids and poor fruit quality [7,12]. Strong light stress and high temperature can aggravate ozone injury [7]. In this study, the UT canopy reduced the direct light irradiation and high-temperature ratio on the leaves, thus alleviating ozone stress. These phenomena induced higher net photosynthetic rates and chlorophyll content of grape leaves.
The canopy architecture has a potent impact on light interception [28] and is usually modified to optimize light interception [29]. An optimal canopy architecture is generally evaluated using parameters such as the leaf area index, light energy interception rate [30], and net photosynthetic rate (Pn). Light energy interception ability is one of the most direct reflections of light energy utilization efficiency [31]. The net photosynthetic rate (Pn) is also considered a major performance metric for evaluating the light interception ability of the canopy. In this study, the UT canopy increased the leaf area index, light interception, and leaf net photosynthetic rate, thus increasing carbon assimilation. The drooping shoots weakened the top advantage and balanced the vegetative and reproductive growth. The drooping was beneficial to the transportation and distribution of more nutrients to the fruit. The contents of the soluble solids and titratable acids in the UT canopy fruit were thus higher than those in the VST canopy.
Different canopy types determine the field’s microclimate. A good cluster microenvironment can improve fruit quality [32,33]. Fruit quality is affected by temperature, humidity, light, and other environmental factors. Strong light exposure in the VST canopy increased the respiration intensity, resulting in decreased malic acid content [34]. High temperature and other stresses can degrade ascorbic acid and tartaric acid content [35]. The lower titratable acid of ‘Chambourcin’ may be caused by strong light exposure and higher VST canopy temperatures [36]. Notably, phenolic compounds play an important role in determining the flavor and color of wine, which results in distinctive tastes of wine [32,37]. Some studies postulate that the content of phenolic substances in plants is different because of different climate characteristics, such as light radiation and temperature [33,34,38]. Light is important for anthocyanin synthesis. It induces chalcone synthase (CHS) and chalcone isomerase (CHI) in the grape peel, thus affecting the distribution and composition of anthocyanins [39]. A previous study demonstrated that light and temperature enhancements through technical operations, such as leaf picking and leaf moving in the veraison stage, increased the flavanols content, total phenolics content, and tannin content after the veraison period [40,41,42]. However, strong light and high temperatures above 35 °C accelerate the degradation of secondary metabolites [36]. In this study, the UT canopy was pruned before veraison and the rainy season, which increased the amount of light around the fruits. The higher carbon assimilation caused by a larger leaf area index, light interception, and leaf net photosynthetic rate provided a carbon source for secondary metabolism. Increased light exposure induced the formation of secondary metabolites in grape berries of the UT canopy.
Pruning of primary and lateral shoots controls the relationship between the source and sink. The angle of shoots affects auxin distribution, and the apical dominance is thus lost when the shoot tip growth position is changed [43]. In this study, the shoot tip of the UT canopy sagged after reaching the height of the fourth line. This phenomenon changed the source-sink relationship, weakened the apical dominance, and reduced the growth, thereby reducing the number of shoot pruning times. In contrast, the growth rate of the primary shoots in the VST canopy was fast. The growth of the primary shoots was inhibited after pruning, thus rapidly accelerating the growth of the lateral shoots, which necessitated pruning the lateral branches within 23 days. The growth rate was significantly affected because of the change in the growth state of shoots, which caused differences in the final pruning frequency: four times for VST and two times for UT [44]. The UT canopy type can thus increase the supply of source to sink, improve fruit quality, and save labor force when planting resistant varieties.
We suggest using a UT canopy in the continental monsoon climate zone, with pruning before the arrival of the rainy season, for resistant varieties of ‘Chambourcin’.

Author Contributions

Conceptualization, data curation, formal analysis, methodology, investigation, writing—original draft, writing—review, and editing, X.L.; conceptualization, data curation, investigation, writing—original draft, S.L.; conceptualization, investigation, Y.Z. and W.H.; resources, supervision, H.Z. (Huaping Zhu) and H.Z. (Heng Zhai); conceptualization, supervision, methodology, writing—review and editing, Y.D. and Z.G. All authors have read and agreed to the published version of the manuscript.

Funding

This research was funded by the National Key Research and Development Program of China (2019YFD1000101) and the China Agricultural Research System (CARS-29).

Institutional Review Board Statement

Not applicable.

Informed Consent Statement

Not applicable.

Data Availability Statement

Not applicable.

Conflicts of Interest

The authors declare no conflict of interest.

References

  1. Coia, L.R.; Ward, D.L. The hybrid grape Chambourcin has a role in quality red V. vinifera blends in a New World grape growing region. J. Wine Res. 2017, 28, 326–331. [Google Scholar] [CrossRef]
  2. Fan, D.; Wang, H.; Fu, C.; Zheng, Q.; Gao, Z.; Kang, H.; Du, Y. Comparison of leaf photosynthetic characteristics of pendulous canopy and horizontal canopy in Chambourcin grape. J. Fruit Sci. 2022, 39, 193–202. [Google Scholar]
  3. Antivilo, F.G.; Paz, R.C.; Keller, M.; Borgo, R.; Tognetti, J.; Juñent, F.R. Macro-and microclimate conditions may alter grapevine deacclimation: Variation in thermal amplitude in two contrasting wine regions from North and South America. Int. J. Biometeorol. 2017, 61, 2033–2045. [Google Scholar] [CrossRef] [PubMed]
  4. Conde, C.; Silva, P.; Fontes, N.; Dias, A.C.P.; Tavares, R.M.; Sousa, M.J.; Agasse, A.; Delrot, S.; Gerós, H. Biochemical changes throughout grape berry development and fruit and wine quality. Food 2007, 1, 1–22. [Google Scholar]
  5. Decoteau, D.R.; Marini, R.P.; Davis, D.D. Influence of ambient ozone on grape cultivars ‘Chambourcin’ and ‘Vidal’. J. Plant Sci. Res. 2019, 6, 1–5. [Google Scholar]
  6. Blanco-Ward, D.; Ribeiro, A.; Paoletti, E.; Miranda, A. Assessment of tropospheric ozone phytotoxic effects on the grapevine (Vitis vinifera L.): A review. Atmos. Environ. 2021, 244, 117924. [Google Scholar] [CrossRef]
  7. Geng, Q.-W.; Xing, H.; Sun, Y.-J.; Hao, G.-M.; Zhai, H.; Du, Y.-P. Analysis of the interaction effects of light and O3 on fluorescence properties of ‘Cabernet Sauvignon’grapes based on response surface methodology. Sci. Hortic. 2017, 225, 599–606. [Google Scholar] [CrossRef]
  8. Falcão, L.D.; Chaves, E.S.; Burin, V.M.; Falcão, A.P.; Gris, E.F.; Bonin, V.; Bordignon-Luiz, M.T. Maturity of Cabernet Sauvignon berries from grapevines grown with two different training systems in a new grape growing region in Brazil. Cienc. E Investig. Agrar. 2008, 35, 321–332. [Google Scholar] [CrossRef]
  9. White, R.; Vogel, A.; Scaduto, J.; Hickey, C. Evaluation of Canopy Division and Cane Pruning to Retrofit Spur-Pruned, Vertical Shoot-Positioned Petit Manseng. Catal. Discov. Into Pract. 2020, 4, 21–32. [Google Scholar] [CrossRef]
  10. Zoecklein, B.W.; Wolf, T.K.; Pélanne, L.; Miller, M.K.; Birkenmaier, S.S. Effect of vertical shoot-positioned, Smart-Dyson, and Geneva double-curtain training systems on Viognier grape and wine composition. Am. J. Enol. Vitic. 2008, 59, 11–21. [Google Scholar]
  11. Bavougian, C.M.; Read, P.E.; Walter-Shea, E. Training system effects on sunlight penetration, canopy structure, yield, and fruit characteristics of ‘Frontenac’grapevine (Vitis spp.). Int. J. Fruit Sci. 2012, 12, 402–409. [Google Scholar] [CrossRef]
  12. Reynolds, A.G.; Wardle, D.A.; Cliff, M.A.; King, M. Impact of training system and vine spacing on vine performance, berry composition, and wine sensory attributes of Seyval and Chancellor. Am. J. Enol. Vitic. 2004, 55, 84–95. [Google Scholar]
  13. Chevet, J.-M.; Lecocq, S.; Visser, M. Climate, grapevine phenology, wine production, and prices: Pauillac (1800–2009). Am. Econ. Rev. 2011, 101, 142–146. [Google Scholar] [CrossRef] [Green Version]
  14. Mosetti, D.; Herrera, J.; Sabbatini, P.; Green, A.; Alberti, G.; Peterlunger, E.; Lisjak, K.; Castellarin, S.D. Impact of leaf removal after berry set on fruit composition and bunch rot in’Sauvignon blanc’. VITIS-J. Grapevine Res. 2016, 55, 57–64. [Google Scholar]
  15. Rustioni, L.; Rocchi, L.; Guffanti, E.; Cola, G.; Failla, O. Characterization of grape (Vitis vinifera L.) berry sunburn symptoms by reflectance. J. Agric. Food Chem. 2014, 62, 3043–3046. [Google Scholar] [CrossRef] [PubMed] [Green Version]
  16. Chen, Z.; Gao, Z.; Sun, Y.; Wang, Y.; Yao, Y.; Zhai, H.; Du, Y. Analyzing the grape leaf proteome and photosynthetic process provides insights into the injury mechanisms of ozone stress. Plant Growth Regul. 2020, 91, 143–155. [Google Scholar] [CrossRef]
  17. Candar, S.; Korkutal, I.; Bahar, E. Effect of canopy microclimate on Merlot (Vitis vinifera L.) grape composition. Appl. Ecol. Environ. Res. 2019, 17, 15431–15446. [Google Scholar] [CrossRef]
  18. Liu, X.; Song, Y.; Liu, Z.; Zhai, H. Effect of vertical and horizontal canopy on the secondary metabolites in’Moldova’grape. J. Fruit Sci. 2019, 36, 308–317. [Google Scholar]
  19. Lorenzini, G.; Nali, C.; Dota, M.R.; Martorana, F. Visual assessment of foliar injury induced by ozone on indicator tobacco plants: A data quality evaluation. Environ. Monit. Assess. 2000, 62, 175–191. [Google Scholar] [CrossRef]
  20. Gordon, R.; Brown, D.; Dixon, M. Non-destructive estimation of potato leaf area index using a fish-eye radiometer. Potato Res. 1994, 37, 393–402. [Google Scholar] [CrossRef]
  21. Welles, J.M.; Cohen, S. Canopy structure measurement by gap fraction analysis using commercial instrumentation. J. Exp. Bot. 1996, 47, 1335–1342. [Google Scholar] [CrossRef]
  22. Ling, Q.; Huang, W.; Jarvis, P. Use of a SPAD-502 meter to measure leaf chlorophyll concentration in Arabidopsis thaliana. Photosynth. Res. 2011, 107, 209–214. [Google Scholar] [CrossRef] [PubMed] [Green Version]
  23. Li, X.-L.; Wang, C.-R.; Li, X.-Y.; Yao, Y.-X.; Hao, Y.-J. Modifications of Kyoho grape berry quality under long-term NaCl treatment. Food Chem. 2013, 139, 931–937. [Google Scholar] [CrossRef] [PubMed]
  24. Waterhouse, A.; Ignelzi, S.; Shirley, J. A comparison of methods for quantifying oligomeric proanthocyanidins from grape seed extracts. Am. J. Enol. Vitic. 2000, 51, 383–389. [Google Scholar]
  25. Orak, H.H. Total antioxidant activities, phenolics, anthocyanins, polyphenoloxidase activities of selected red grape cultivars and their correlations. Sci. Hortic. 2007, 3, 235–241. [Google Scholar] [CrossRef]
  26. Grappadelli, L.C. Early Season Patterns of Carbohydrate Partitioning in Exposed and Shaded Apple Branches. J. Amer. Soc. Hort. Sci 1994, 119, 596–603. [Google Scholar] [CrossRef] [Green Version]
  27. Booker, F.; Muntifering, R.; McGrath, M.; Burkey, K.; Decoteau, D.; Fiscus, E.; Manning, W.; Krupa, S.; Chappelka, A.; Grantz, D. The ozone component of global change: Potential effects on agricultural and horticultural plant yield, product quality and interactions with invasive species. J. Integr. Plant Biol. 2009, 51, 337–351. [Google Scholar] [CrossRef]
  28. Da Silva, D.; Han, L.; Faivre, R.; Costes, E. Influence of the variation of geometrical and topological traits on light interception efficiency of apple trees: Sensitivity analysis and metamodelling for ideotype definition. Ann. Bot. 2014, 114, 739–752. [Google Scholar] [CrossRef] [Green Version]
  29. Yang, W.; Ma, X.; Ma, D.; Shi, J.; Hussain, S.; Han, M.; Costes, E.; Zhang, D. Modeling canopy photosynthesis and light interception partitioning among shoots in bi-axis and single-axis apple trees (Malus domestica Borkh.). Trees 2021, 35, 845–861. [Google Scholar] [CrossRef]
  30. Tang, L.; Yin, D.; Chen, C.; Yu, D.; Han, W. Optimal design of plant canopy based on light interception: A case study with loquat. Front. Plant Sci. 2019, 10, 364. [Google Scholar] [CrossRef]
  31. Long, S.P.; ZHU, X.G.; Naidu, S.L.; Ort, D.R. Can improvement in photosynthesis increase crop yields? Plant Cell Environ. 2006, 29, 315–330. [Google Scholar] [CrossRef] [PubMed]
  32. Cominelli, E.; Gusmaroli, G.; Allegra, D.; Galbiati, M.; Wade, H.K.; Jenkins, G.I.; Tonelli, C. Expression analysis of anthocyanin regulatory genes in response to different light qualities in Arabidopsis thaliana. J. Plant Physiol. 2008, 165, 886–894. [Google Scholar] [CrossRef] [PubMed]
  33. Jaakola, L. New insights into the regulation of anthocyanin biosynthesis in fruits. Trends Plant Sci. 2013, 18, 477–483. [Google Scholar] [CrossRef] [PubMed] [Green Version]
  34. Cortell, J.M.; Kennedy, J.A. Effect of shading on accumulation of flavonoid compounds in (Vitis vinifera L.) pinot noir fruit and extraction in a model system. J. Agric. Food Chem. 2006, 54, 8510–8520. [Google Scholar] [CrossRef] [PubMed]
  35. Wagner, G.; Loewus, F.A. L-ascorbic acid metabolism in vitaceae: Conversion to (+)-tartaric acid and hexoses. Plant Physiol. 1974, 54, 784–787. [Google Scholar] [CrossRef] [PubMed] [Green Version]
  36. Bergqvist, J.; Dokoozlian, N.; Ebisuda, N. Sunlight exposure and temperature effects on berry growth and composition of Cabernet Sauvignon and Grenache in the Central San Joaquin Valley of California. Am. J. Enol. Vitic. 2001, 52, 1–7. [Google Scholar]
  37. Downey, M.O.; Harvey, J.S.; Robinson, S.P. The effect of bunch shading on berry development and flavonoid accumulation in Shiraz grapes. Aust. J. Grape Wine Res. 2004, 10, 55–73. [Google Scholar] [CrossRef]
  38. Fujita, A.; Soma, N.; Goto-Yamamoto, N.; Shindo, H.; Kakuta, T.; Koizumi, T.; Hashizume, K. Anthocyanidin reductase gene expression and accumulation of flavan-3-ols in grape berry. Am. J. Enol. Vitic. 2005, 56, 336–342. [Google Scholar]
  39. Spayd, S.E.; Tarara, J.M.; Mee, D.L.; Ferguson, J. Separation of sunlight and temperature effects on the composition of Vitis vinifera cv. Merlot berries. Am. J. Enol. Vitic. 2002, 53, 171–182. [Google Scholar]
  40. Azuma, A.; Yakushiji, H.; Koshita, Y.; Kobayashi, S. Flavonoid biosynthesis-related genes in grape skin are differentially regulated by temperature and light conditions. Planta 2012, 236, 1067–1080. [Google Scholar] [CrossRef]
  41. Koyama, K.; Ikeda, H.; Poudel, P.R.; Goto-Yamamoto, N. Light quality affects flavonoid biosynthesis in young berries of Cabernet Sauvignon grape. Phytochemistry 2012, 78, 54–64. [Google Scholar] [CrossRef] [PubMed]
  42. Matus, J.T.; Loyola, R.; Vega, A.; Peña-Neira, A.; Bordeu, E.; Arce-Johnson, P.; Alcalde, J.A. Post-veraison sunlight exposure induces MYB-mediated transcriptional regulation of anthocyanin and flavonol synthesis in berry skins of Vitis vinifera. J. Exp. Bot. 2009, 60, 853–867. [Google Scholar] [CrossRef] [PubMed] [Green Version]
  43. Li, Z.; Pan, Q.; Jin, Z.; Mu, L.; Duan, C. Comparison on phenolic compounds in Vitis vinifera cv. Cabernet Sauvignon wines from five wine-growing regions in China. Food Chem. 2011, 125, 77–83. [Google Scholar] [CrossRef]
  44. Reynolds, A.G.; Heuvel, J.E.V. Influence of grapevine training systems on vine growth and fruit composition: A review. Am. J. Enol. Vitic. 2009, 60, 251–268. [Google Scholar]
Figure 1. Diagram of different canopy types.
Atmosphere 13 00823 g001
Figure 2. Classification of ozone damage.
Atmosphere 13 00823 g002
Figure 3. Effects of canopy types on the spatial distribution of photosynthetic active radiation. Distribution of photosynthetic active radiation (PAR) on the surface of VST canopy (a) and UT canopy (b), and the distribution of PAR data (c). Values are the mean of three replicates and error bars denote the SD. Different lowercase letters indicate significant differences based on Duncan’s multiple range test (p < 0.05).
Atmosphere 13 00823 g003
Figure 4. Effects of canopy types on the leaf area index (LAI) and the diffuse non-interceptance (DIFN). Values are the mean of three replicates and error bars denote the SD. Different lowercase letters indicate significant differences based on Duncan’s multiple range test (p < 0.05).
Atmosphere 13 00823 g004
Figure 5. Effects of different canopy types on ozone injury symptoms in grape leaves. Values are the mean of three replicates and error bars denote the SD. Different lowercase letters indicate significant differences based on Duncan’s multiple range test (p < 0.05).
Atmosphere 13 00823 g005
Figure 6. Effects of different canopy types on chlorophyll content. Values are the mean of three replicates and error bars denote the SD. Different lowercase letters indicate significant differences based on Duncan’s multiple range test (p < 0.05).
Atmosphere 13 00823 g006
Figure 7. Effects of canopy types on the net leaf photosynthetic rate. Values are the mean of three replicates and error bars denote the SD. Different lowercase letters indicate significant differences based on Duncan’s multiple range test (p < 0.05).
Atmosphere 13 00823 g007
Table 1. Effect of canopy types on the temperature and humidity around grape berries.
PeriodCanopy ShapeHighest Temperature (°C)Minimum Temperature (°C)Day and Night Temperature Difference (°C)≥35 °C
(%)
Humidity
60–80% (%)
Humidity
>80% (%)
2020
August
VST40.8013.3027.501.9322.0448.58
UT39.9013.2026.701.8022.7351.37
2021
August
VST37.4015.3022.103.9415.5167.52
UT37.1015.0021.800.9312.1977.01
Table 2. Effect of canopy types on the fruit size, soluble solids, and titratable acid content.
Canopy ShapeHundred-Grain Weight (g)Soluble Solids (%)Titratable Acid
(g/L)
2020VST251.83 ± 5.35 b18.70 ± 1.33 b10.03 ± 0.64 a
UT264.29 ± 5.36 a20.97 ± 1.52 a10.05 ± 0.75 a
2021VST253.23 ± 2.49 b19.27 ± 0.23 a10.58 ± 0.68 b
UT258.04 ± 2.28 a19.77 ± 0.23 a11.53 ± 0.83 a
Note: Values are the means of three replicates and values of standard deviation denote the SD. Different lowercase letters indicate significant differences based on Duncan’s multiple range test (p < 0.05).
Table 3. Effect of canopy types on the secondary metabolite of grape berries.
Canopy ShapeAnthocyanin (mg/g)Total Phenol (mg/g)Flavonoids (mg/g)Flavanols (mg/g)
2020VST7.93 ± 0.04 b3.69 ± 0.12 b6.10 ± 0.49 b10.56 ± 0.72 b
UT10.51 ± 0.84 a5.93 ± 0.46 a10.44 ± 0.14 a20.26 ± 1.61 a
2021VST4.24 ± 0.22 b1.44 ± 0.03 b5.97 ± 0.28 a13.41 ± 0.54 a
UT6.45 ± 0.27 a1.55 ± 0.06 a6.25 ± 0.23 a14.85 ± 0.71 a
Note: Values are the means of three replicates and values of standard deviation denote the SD. Different lowercase letters indicate significant differences based on Duncan’s multiple range test (p < 0.05).
Publisher’s Note: MDPI stays neutral with regard to jurisdictional claims in published maps and institutional affiliations.

