Article

Effect of Catalyst Inlet Flow Field Distribution Characteristics on Outlet NO Concentration Distribution in SCR Denitration Reactor Based on Monte Carlo Method

1
School of Civil Engineering and Architecture, Anhui University of Technology, Ma’anshan 243032, China
2
School of Energy and Environment, Anhui University of Technology, Ma’anshan 243002, China
3
Anhui Weida Environment Protection Science &Technology Co., Ltd., Hefei 230041, China
*
Author to whom correspondence should be addressed.
Submission received: 28 April 2022 / Revised: 26 May 2022 / Accepted: 1 June 2022 / Published: 8 June 2022
(This article belongs to the Special Issue Flue Gases: Measurement and Treatment)

Abstract

:
Selective catalytic reduction (SCR) technology plays a crucial role in flue gas denitration. The nonuniform distribution of catalyst inlet parameters causes the nonuniform distribution of NO concentration at the outlet, thus affecting accuracy of ammonia injection. Regarding this issue, this paper describes the impacts of nonuniform velocity and temperature on both the confidence of NO concentration measured at a single measuring point at the outlet and the denitration efficiency, which can provide a basis for structural optimization of SCR denitration reactor and decrease in ammonia slip. The random distribution form of velocity and temperature above the catalyst layer are derived from the actual gas volume and the actual SCR reactor model, and then the catalyst inlet boundary conditions were generated with different relative standard deviation of velocity and temperature accordingly. The confidence of outlet NO concentration measurement results can be counted by means of Monte Carlo simulation. Finally, the relation model can be obtained to calculate the confidence of outlet NO concentration measurement results at different working conditions. The results show that within the gas volume range of this work, in order to ensure the confidence of the NO concentration measurement results, the relative standard deviation of temperature before the catalyst inlet must be within 0.005 and the relative standard deviation of velocity before the catalyst inlet must be within 0.1. With the increase in relative standard difference in temperature, there is a slight decrease in the efficiency of denitration. With the different mean value of temperature, the variation range of denitration efficiency is similar to that of temperature-relative standard difference. With the different mean value of velocity, the deviation range of corresponding efficiency is similar to that of the temperature-relative standard difference. When the relative standard difference in velocity increases, the denitration efficiency decreases slightly. The greater velocity value, the decreasing range of denitration efficiency is larger than the variation range of relative standard difference in velocity.

1. Introduction

The production processes of iron and steel industry may cause large amounts of pollutants. For example, coking, sintering (pelletizing), ironmaking, steelmaking generate abundant nitrogen oxides, sulfides, dust, etc. [1]. In the iron and steel industry, sintering is the main process. The emission load of NOx in the sintering flue gas accounts for 50–55% of the total emission from the iron and steel industry. Sintering flue gas is characterized by large amounts of flue gas, a large variation in temperature, and high moisture and oxygen contents [2]. Selective catalytic reduction (SCR) is a key means of controlling NOx emissions [3], which means that under the action of catalyst, the reductant in the mixed flue gas selectively undergoes a redox reaction with NOx in the flue gas, thereby generating clean N2 and H2O. SCR denitration technologies have become the first choice for the denitration of flue gas, due to its mature technology and high denitration efficiency [4,5,6], among which NH3 spray has become the most feasible and promising method [7,8,9].
The NOx conversion efficiency in SCR reactors is related to numerous factors such as the catalyst, flow field distribution, and NH3/NO molar ratio. Tan et al. [10] combined experiments and simulations to investigate the effects of catalyst state, velocity, and NH3/NO ratio on NOx conversion efficiency, without considering the interactions between the factors. Li et al. [11] proposed a soft sensor modeling method based on the moving-window partial least squares and locally weighted regression (VEW-MWPLS), which can correctly forecast NOx emissions from coal-fired boilers with strong variable correlation, nonlinearity, and time-varying features. Liu et al. [12] proposed an expected NH3 injection control strategy with predictive auxiliary feed-forward to improve the precision of outlet flow control. Yao et al. [13] studied the flow and chemical reaction process of honeycomb SCR denitration catalyst by numerical simulation, and developed the correction factor of chemical reaction rate to correct the porous media model, which could compensate for the deviation between the calculated reaction rate and the interface diffusion. Yang et al. [14] studied the effects of nitric oxide concentration and NH3/NO molar ratio on NO conversion by use of the CFD method, and obtained a simple first-order nitric oxide, zero-order power-law kinetic equation, which can be applied to coated honeycomb catalyst and used to determine kinetic parameters. The abovementioned scholars mainly studied SCR denitration efficiency through experiments, algorithm predictions, and numerical simulations. Among them, most the experimental studies are made on the preparation and properties of catalysts; the algorithm prediction research is mainly to probe deeply into field data and establish the outlet NOx emission prediction model; the numerical simulation is to establish an appropriate chemical reaction model to provide a more reasonable and accurate method for the subsequent numerical simulation of SCR denitration. However, the numerical simulation of SCR denitration efficiency is relatively lacking in these studies.
To ensure that denitration meets the emission standard, excess NH3 [15,16] is often injected into some SCR denitration reactors. This leads to overcorrection of denitration and neglect of harms caused by ammonia slip. Ammonia slip leads to the decline of catalyst activity and increase air pollution [17]. At present, the numerical simulation optimization research of SCR reactors seldom considers the chemical reaction. Instead of denitration efficiency, the relative standard deviation coefficient of flow rate and NH3/NO concentration distribution is adopted to assess the impact of denitration. Even if considering the chemical reaction, the nonuniformity of reactor inlet parameters is rarely considered in conjunction with the actual situation, thus leading to errors.
Sohn et al. [18] proposed the weight method of ammonia injection, which uses the velocity distribution characteristics to calculate the NO concentration distribution characteristics, realizing the uniform distribution of NH3/NO molar ratio. Compared with the adjustment of NH3/NO distribution [19,20], the adjustment of temperature distribution and velocity distribution is more difficult, because they are almost completely determined by the existing structure. Nonuniform velocity and temperature often cause extremely nonuniform outlet NO concentration. In practical engineering, when the NO concentration at the outlet is nonuniform and the NO measuring point is single, it is questionable whether the measured results can accurately reflect the mean NO concentration at the outlet. To solve this problem, the Monte Carlo method is used in this work to study the influence of catalyst inlet flow field distribution characteristics on outlet NO concentration distribution, specifically the influence of nonuniform inlet and temperature on the confidence of outlet NO concentration measurement results and denitration efficiency. The “outlet NO concentration measurement results” herein refers to the NO concentration results measured at the outlet central measurement point obtained by Monte Carlo simulation, and also refers to the NO concentration results measured at the outlet central measurement point in the actual project.

2. Research Method

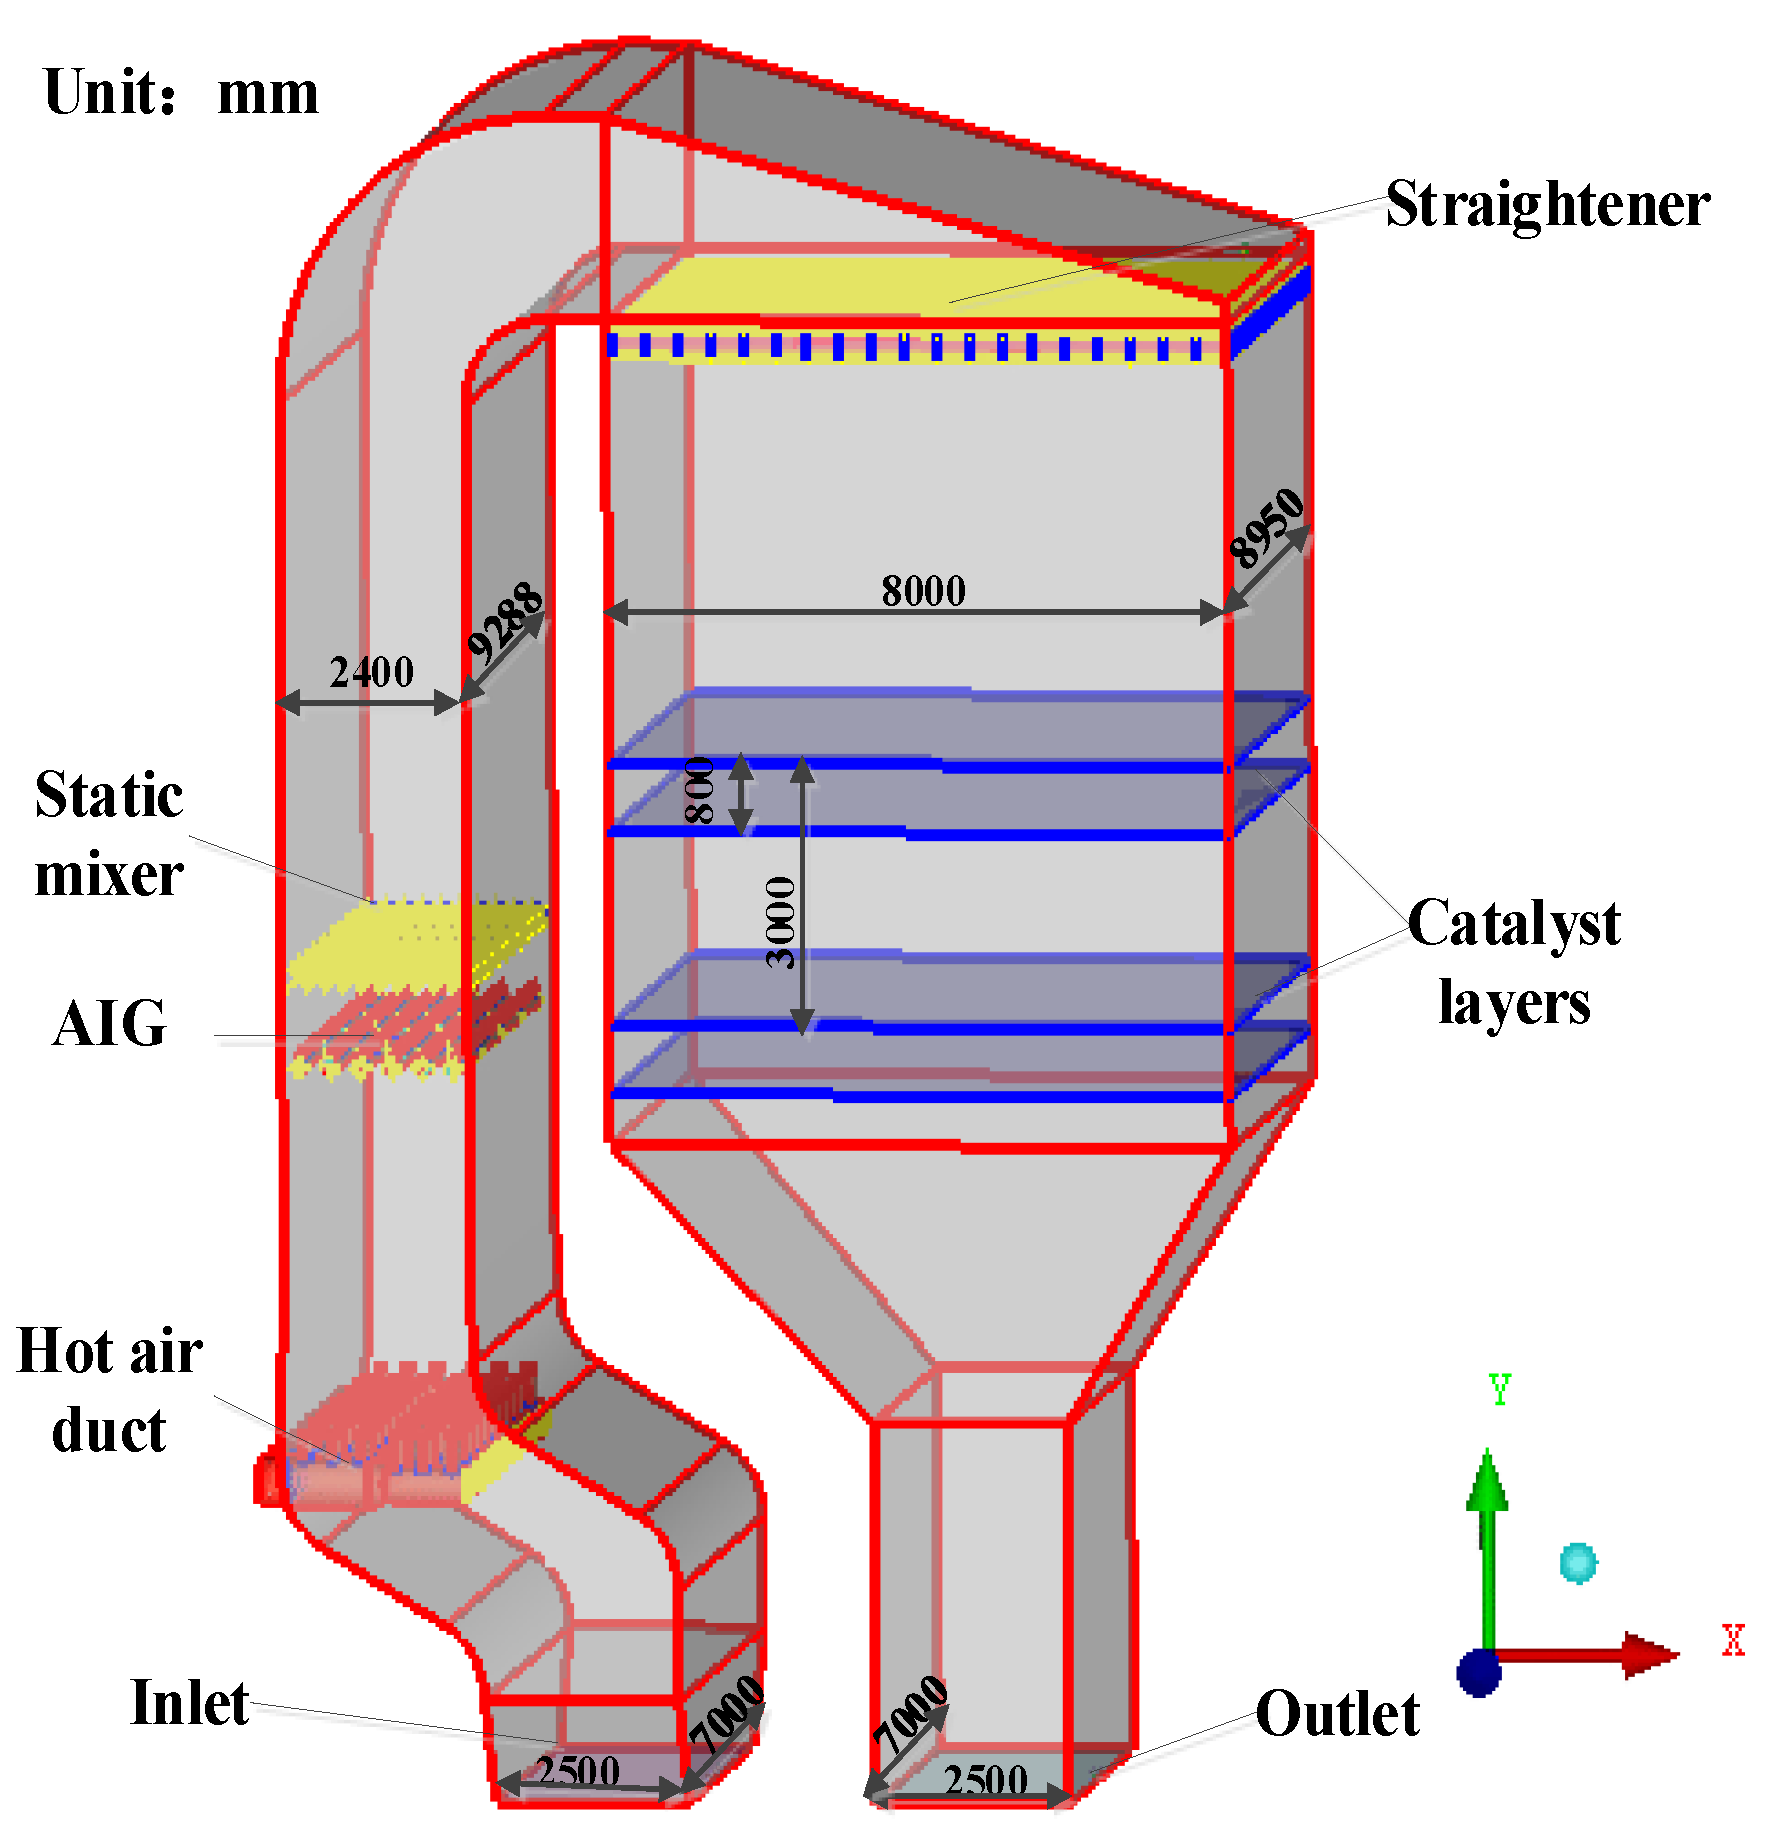
2.1. Numerical Calculation Model

In order to study the SCR denitration reaction system in a more simple way, the catalyst layer is set as a porous medium [21] (Supplementary Materials). According to the flow of flue gas in the catalyst, this paper establishes some simplifying assumptions for computational fluid dynamics simulation: the model is an adiabatic system; the influence of particles in flowing gas is ignored and only the gas phase is considered; the gas phase is assumed to be an ideal gas; the gas flow is steady; regardless of NO2, CO2, and SO2 components, SCR denitration reaction is only related to NO, NH3, O2, H2O, and N2; and internal fixings of the SCR denitration reaction system are not considered.
The geometric model of the SCR denitration reactor is shown in Figure 1, and its overall structural parameters are shown in Table 1. In the previous work of our research group, the numerical simulation of the SCR denitration reaction system was carried out. The grid independence verification and experimental verification of the SCR denitration reaction system were performed. A grid model of 5.48 million elements is adopted in this study, and the realizable k-ε turbulence equation model, chemical reaction process is calculated by use of a volume reaction and laminar finite rate model [22].
Kinetic parameters of chemical reaction follow: the pre-exponential factor Ar is 2.25 × 10⁶, the temperature exponent βr is 0.014, and the reaction activation energy Er is 6.4 × 10⁷ J/kmol. The thickness of each layer is 800 mm, the porosity is 71.8%, and the diameter of catalyst pore is 4 mm. The viscous resistance coefficient of each layer was set to 3.86 × 10⁴ m−2 and the inertia resistance coefficient to 12.55 m−1. The viscous resistance coefficient in the X and Z directions is set to be 5 times greater than that in the Y direction. The volume fractions of flue gas components are 13% O2, 12.6% steam, 0.0128% NO, and remaining N2, respectively, regardless of CO2, SO2, etc.
According to the prediction model of denitration efficiency proposed by our research group in literature [22],
Y = −2418 − 83.75A + 8.791B + 215.8C − 1.015A2 − 0.008337B2 − 148.2C2
+ 0.1614AB − 2.955AC + 0.2458BC
where Y is denitration efficiency; η (%); A is the catalyst inlet air velocity, v (m/s); B is the reaction temperature, T (K); and C is the NH3/NO molar ratio. The NO distribution at the reactor outlet under different catalyst inlet distributions can be obtained, so as to analyze the influence of the nonuniform flow field on denitration performance.

2.2. Introduction to Research Ideas and Concepts

2.2.1. Monte Carlo Method

The Monte Carlo [23] method refers to how to calculate the statistical characteristics of the parameters through a sampling test to obtain the frequency of the event. Specifically, when the issue to be addressed is the likelihood of an event or the anticipated value of a random variable, a certain “experimental” approach can be applied to determine the frequency of the event or the mean of the random variable, which can be used as the answer.

2.2.2. Research Routes

The research routes of this paper follow: Firstly, the random distribution of velocity and temperature above the catalyst layer is simulated according to the actual gas volume and the actual SCR reactor model. Secondly, according to the distribution, the catalyst inlet boundary conditions are generated with different relative standard deviations of velocity and temperature. The NO concentration distribution at the outlet is obtained according to the denitration efficiency prediction model. The simulation times of each working condition are set to several times by the Monte Carlo simulation method to count confidence of measurement results for outlet NO concentration under the nonuniformity condition of velocity and temperature. Finally, the relation model of the confidence of the measurement results of the outlet NO concentration under different cases is obtained [24]. The limit of relative standard deviation of velocity and temperature that meet the confidence is proposed as the optimization goal of SCR denitration reactor in engineering application. This ensures that the measurement results of a single measurement point at the outlet of the denitration reactor can basically and accurately reflect the average NO concentration at the outlet. Another important and significant aspect of this work is that in the nonchemical reaction simulation (saving calculation cost), the SCR denitration reactor can be optimized according to the optimization objectives proposed herein, which can ensure the reliability of the optimization results when the outlet NO concentration distribution is unknown. This ensures that the actual operation, the deviation between the NO concentration measured at a single measuring point and the mean of NO concentration, is within an acceptable range at the outlet. The research ideas of this chapter are shown in Figure 2.

2.2.3. Concept Introduction

Several indicators are used below: the uniformity of velocity at the catalyst inlet can be indicated by the relative standard deviation of velocity Cv, the uniformity of temperature at the catalyst inlet can be indicated by the relative standard deviation of temperature CT, and the uniformity of NO concentration at the outlet can be indicated by the relative standard deviation of concentration velocity Cρ. The expression follows:
C v = 1 n j = 1 n ( v i v ¯ v ¯ ) 2 × 100 %
C T = 1 n j = 1 n ( T i T ¯ T ¯ ) 2 × 100 %
C ρ = 1 n j = 1 n ( c i c ¯ c ¯ ) 2 × 100 %
where vi is the velocity at the measuring point, m/s; n is the number of measuring points in the section; v ¯ is the average velocity of the measuring point section, m/s; ci is the NO concentration at the measuring point, kg/m3; n is the number of measuring points in the section; and c ¯ is the average NO concentration in the section of the measuring point, kg/m3.

3. Results and Discussion

3.1. Random Field Distribution of Velocity and Temperature

3.1.1. Determination of Velocity and Temperature Random Fields

The inlet air volume monitored by an EM-5 continuous flue gas emission monitoring system for SCR denitration reactors is converted into inlet air velocity. The numerical simulation results are obtained when the inlet gas velocity is 6.84, 9.135, 12.49, 13.17, and 13.724 m/s [22]. The temperature, velocity distribution table upstream from the first-layer catalyst, count temperature, and velocity distribution frequency are extracted, as shown in Figure 3. In Figure 3a, abscissa 510 indicates that the temperature range is 505–510 K, and so on. In Figure 3b, abscissa 0.5 denotes the velocity range of 0 to 0.5 m/s, abscissa 0.7 denotes velocity range of 0.5 to 0.7 m/s, and so on.
Figure 3a shows that the temperature distribution upstream from the first-layer catalyst has low frequencies on both sides and high frequencies in the middle, so that the temperature distribution can be approximated as conforming to a normal distribution. Figure 3b shows that the measurement points between 0 and 0.5 m/s are located within the attached layer generated by the flow of flue gas and the reactor wall, and the velocity is small, close to 0, which is negligible, except that the velocity distribution shows the characteristics of being low at both ends and high in the middle; for the convenience of numerical simulation, it can also be approximated that the velocity distribution upstream from the first catalyst layer is normal, which is basically consistent with the actual situation.

3.1.2. Setting of Velocity and Temperature Random Fields

After determining that the temperature and velocity upstream from the first-layer catalyst exhibit a normal distribution, in order to generate the catalyst inlet boundary conditions according to different relative standard deviations of velocity and temperature, and to obtain the corresponding outlet NO concentration, the catalyst inlet section and reactor outlet are divided into sufficiently small sections by using the principle of differentiation; different velocity or temperature values are set on the small section at the inlet of each catalyst, and then the NO concentration of the corresponding small section at the outlet is obtained according to the quadratic multinomial regression model equation of denitration efficiency, which was proposed by our research group [22], so as to obtain the NO concentration distribution at the outlet under different catalyst inlet parameters. Thus, the influence of nonuniformity of the flow field and temperature field on denitration performance is analyzed. This idea has been adopted in research reported in the literature [25,26].
Several main parameters to be studied in velocity and temperature fields are defined, including mean value and relative standard deviation, and the normrnd function in MATLAB is used to generate different catalyst inlet boundary conditions. As shown in Figure 4, it is the data distribution with the mean velocity 3.2 m/s and the relative standard deviation of velocity of 0.25.

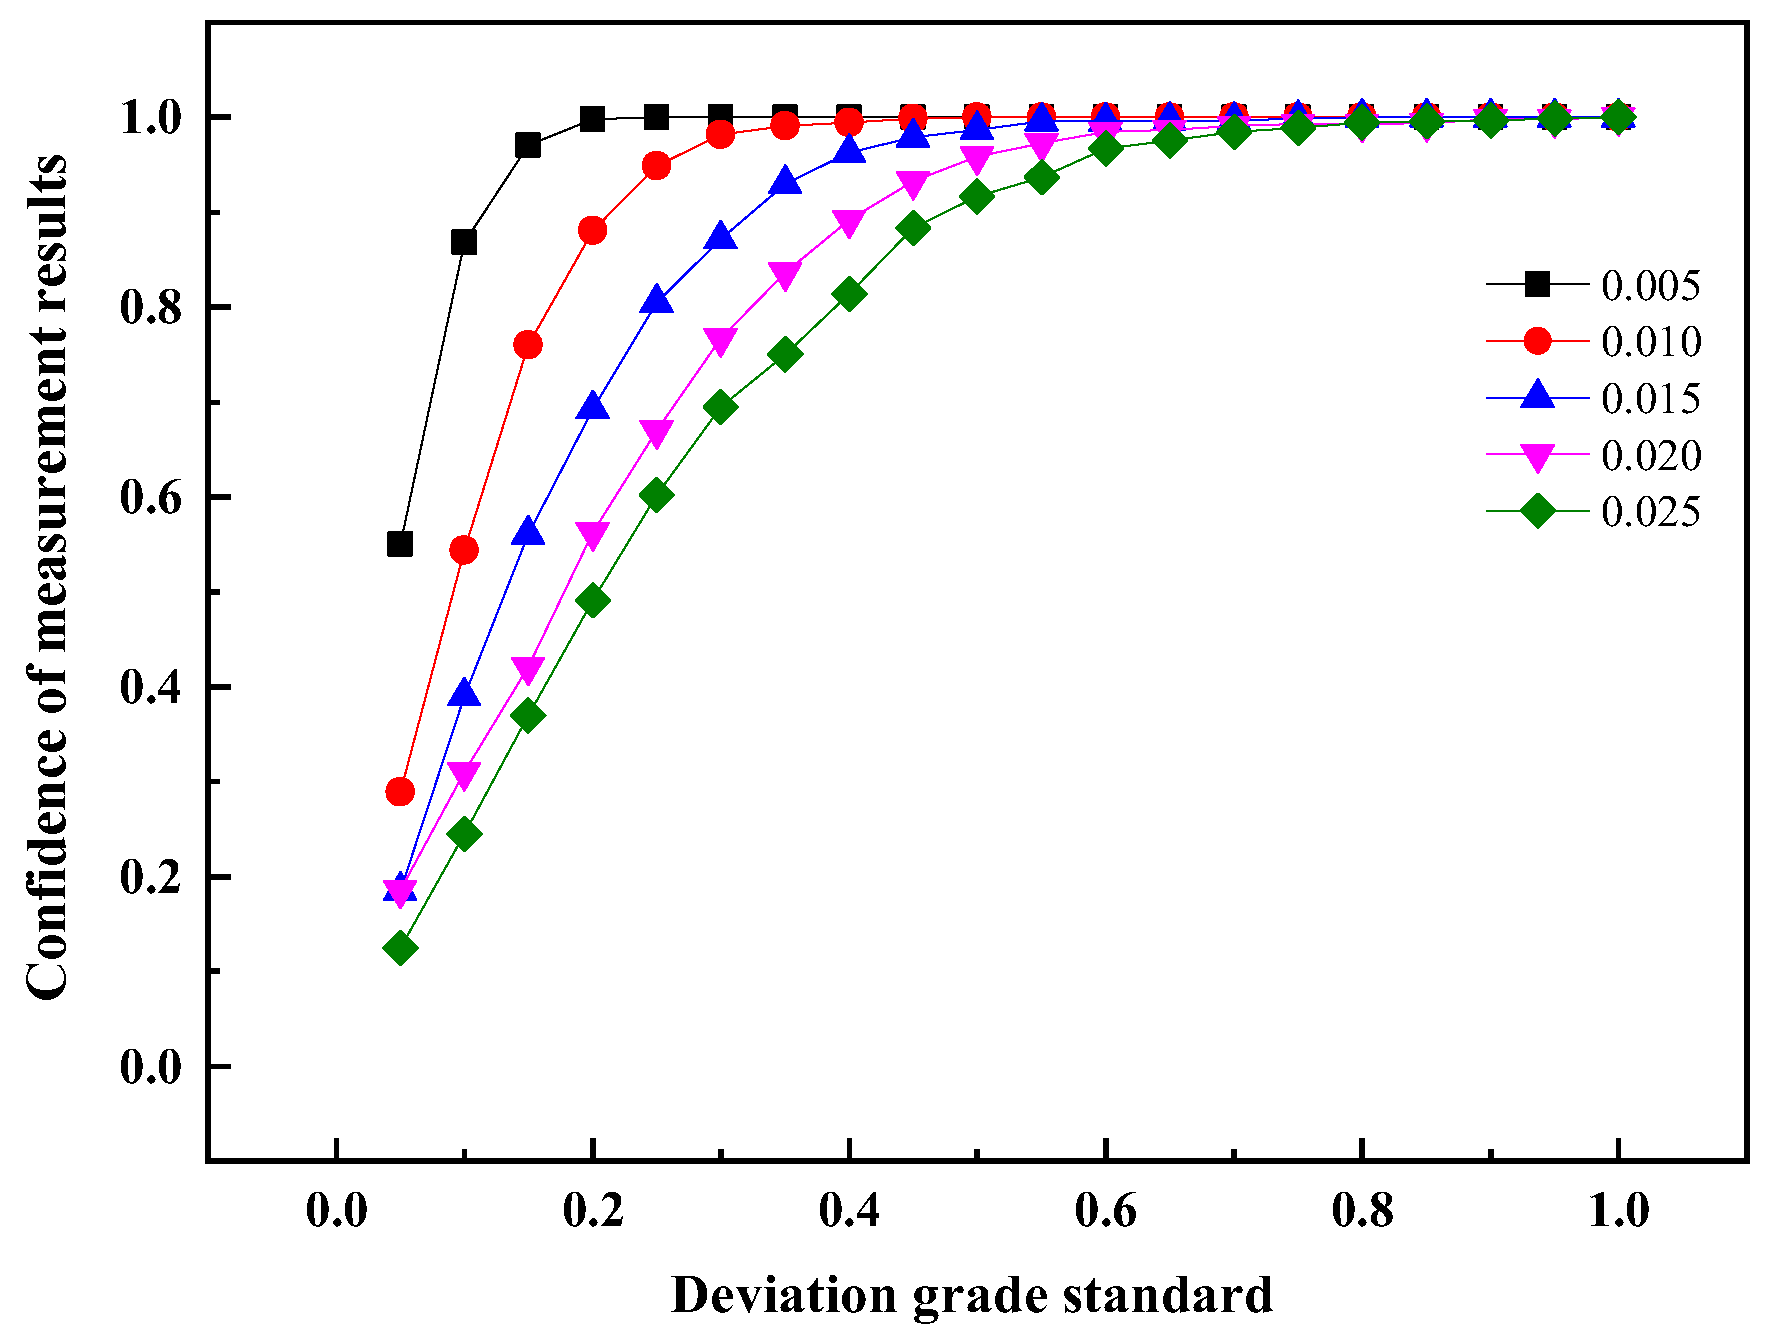
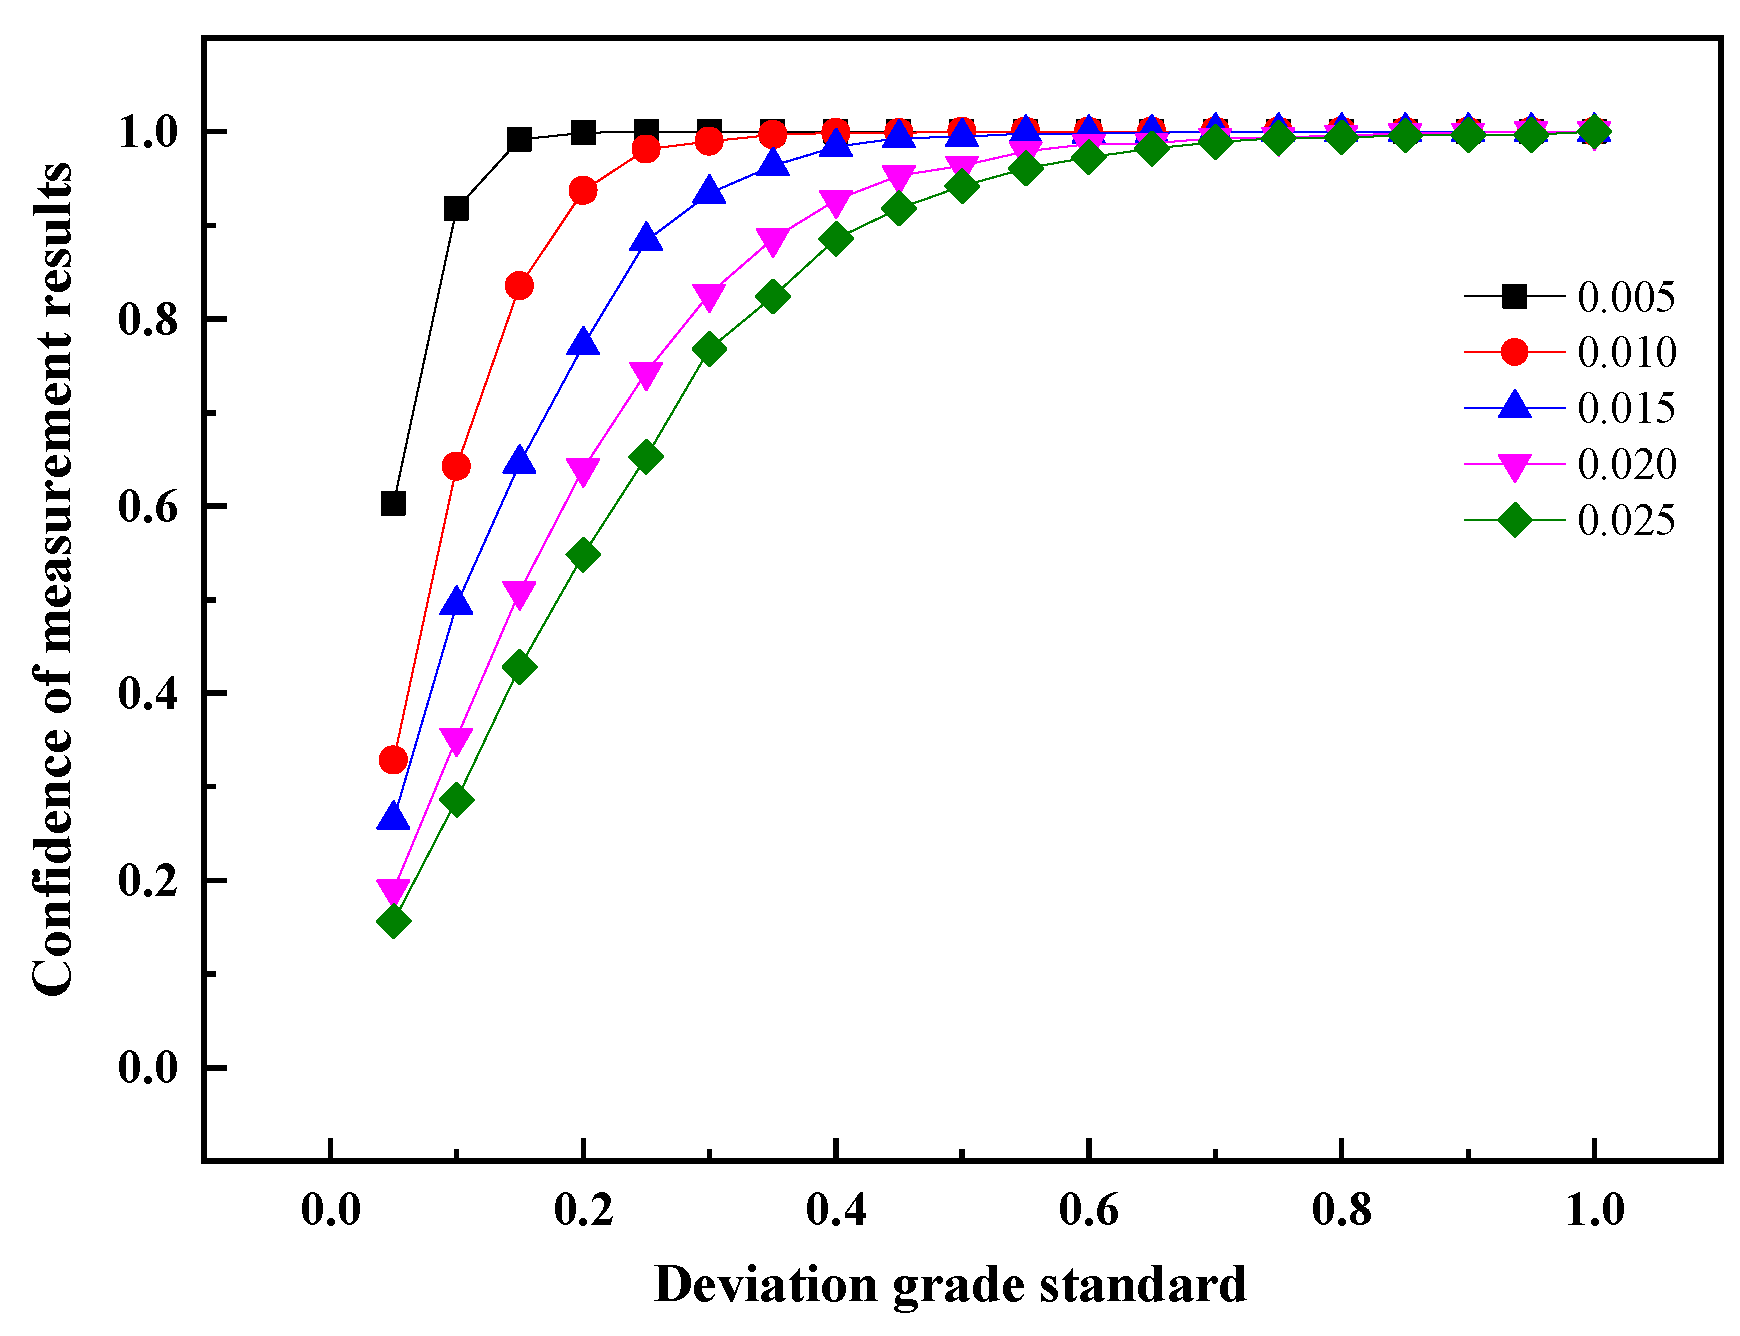
3.2. Effect of Nonuniform Temperature on the Confidence of NO Measurement Results at the Outlet

3.2.1. Different Averaged Values of Temperature

Based on the analysis in Section 3.1, this section reports on a temperature random field generated according to the normal distribution. The temperature random field is designed as follows: the mean value of the catalyst inlet velocity is 3.2 m/s, the catalyst inlet temperature is 543, 553, and 563 K, and the relative standard deviation of temperature is 0.005, 0.010, 0.015, 0.020, and 0.025. There are 15 cases in total, and each case has 1000 groups. The detailed design conditions are summarized in Table 2.
The mean NO concentration  c ¯ at the outlet and the NO concentration cp at the outlet center obtained from each random field simulation are counted, and the center concentration deviation ω is calculated. The greater the deviation of the center concentration, the greater the deviation between the NO concentration measured at the center measuring point and the mean NO concentration at the outlet, and the less the measurement results at the center measuring point have the ability to represent the average NO concentration at the outlet.
The center concentration deviation ω is calculated as follows:
ω = | c p c ¯ | c ¯
where cp is the NO concentration at the outlet center, kg/m3, and c ¯ is the mean NO concentration at the outlet, kg/m3.
The center concentration deviation is artificially divided into several deviation grade standards (hereinafter referred to as “deviation grade standards”), and different deviation grade standards represent different outlet NO measurement accuracy. For example, if the center concentration deviation grade standard is specified as 0.05, this means that the measured outlet center NO concentration cp can represent the NO concentration level of the whole outlet section only when the center concentration deviation ω is less than or equal to 0.05.
In addition, by counting 1000 groups of simulation results under each case, the ratio of the number of times the center measuring point measurement results fall within the standard range of a center concentration deviation grade to the total number of times can be obtained. This ratio is defined as “confidence of outlet NO measurement results” (hereinafter referred to as “confidence of measurement results”) to describe the probability of whether the measurement result is credible under a certain deviation grade standard. For example, it is specified that the deviation grade standard of center concentration is 0.1. If 900 of 1000 simulation results meet the deviation grade standard of 0.1, then it indicates that there is a 90% possibility that the center NO concentration can represent the mean outlet NO concentration in a single measurement result, and the confidence of a single measurement result is 0.9.
Figure 5, Figure 6 and Figure 7 show the center concentration deviation under cases T1~T5, i.e., when the catalyst inlet temperature is 543 K and the different relative standard deviations of temperature are cases T6~T10 and cases T11~T15, respectively, (1000 groups of data points are too dense—to avoid an unclear display, only 100 groups are shown in the figure and those that follow, and the overall trend is consistent with 1000 groups). Figure 8 shows the mean of 1000 groups of results for the center concentration deviation under each case.
It can be seen from Figure 5, Figure 6 and Figure 7 that when the mean temperature is constant, the greater the relative standard deviation of temperature, the greater the center concentration deviation, and the more obvious the fluctuation of center concentration deviation of 1000 groups. When the relative standard deviation of temperature is 0.005, most of the center concentration deviation does not exceed 0.2, and when the relative standard deviation of temperature is 0.025, the center concentration deviation can reach 1 or even 2. This is because the higher the reaction temperature, the stronger the chemical process and the better the NO removal effect. The greater the relative standard deviation of temperature, that is, the more nonuniform the temperature distribution, the more significant difference in NO removal effect at different positions, so the greater the center concentration deviation. Figure 8 shows the mean of center concentration deviation under different cases. As seen in the figure, the relative standard deviation of temperature shows a linear positive correlation with the mean of center concentration deviation. When the relative standard deviation of temperature is constant, the larger the mean temperature, the larger the corresponding mean of center concentration deviation, but this difference is not obvious.
Figure 9, Figure 10 and Figure 11 show the relationship between deviation grade standard and confidence of measurement results under cases T1~T5, T6~T10, and T11~T15 respectively. Figure 12 shows relationship between relative standard deviation of temperature and confidence of measurement results when deviation grade standard is 0.25.
It can be seen from Figure 9, Figure 10 and Figure 11 that the relative standard deviation of temperature has a great impact on the confidence of measurement results under different deviation grade standards. Under the same deviation grade standard, the confidence of the measurement results gradually decreases as the relative standard deviation of temperature increases, and the corresponding probability of erroneous measurement of outlet NO concentration is higher, which also conforms to the law that the worse temperature uniformity, the stronger the difference in chemical reaction, the more nonuniform the distribution of outlet NO concentration, and the easier it is to measure inaccuracy. The larger the deviation grade standard, the higher the confidence of the measurement results. When the deviation grade standard increases to a certain value, the confidence of the measurement results under the relative standard deviation of five temperatures can reach more than 0.9.
The National Environmental Protection Standard of the People’s Republic of China “Technical Specifications for Continuous Monitoring of Flue Gas (SO2, NOx, Particulate Matter) Emissions from Stationary Pollution Sources HJ 75-2017” [27] states that the detection accuracy of NOx is as follows: 20 μmol/mol (41 mg/m3) ≤ emission concentration < 50 μmol/mol (103 mg/m3), the relative error shall not exceed ±30%; emission concentration < 20 μmol/mol (41 mg/m3), the absolute error shall not exceed ±6 μmol/mol (12 mg/m3). Therefore, the deviation grade standard is set as 0.25 in this paper. We specify that the confidence of measurement results is greater than or equal to 0.90 as high reliability, that is, when the deviation of the center concentration is less than or equal to 0.25, the NO concentration measured at the center measurement point can represent the average level of NO concentration at the outlet, and when the confidence of the measurement results is greater than or equal to 0.90, the reliability of the measurement results is sufficient. Figure 12 is the relationship between the relative standard deviation of temperature and the confidence of measurement results when the deviation grade standard is 0.25, based on Figure 9, Figure 10 and Figure 11. When the catalyst inlet velocity is 3.2 m/s and the relative standard deviation of temperature is 0.005, the confidence of measurement results corresponding to the average temperature 543, 553, and 563 K reaches more than 0.98. As seen, when the velocity at the catalyst inlet is 3.2 m/s and the relative standard deviation of temperature is less than or equal to 0.005, the measurement results can be reliable.

3.2.2. Different Averaged Values of Velocity

This research is based on the condition that the inlet velocity is 3.2 m/s. Since the gas volume of the denitration reactor fluctuates in the actual project, and the mean of the reaction temperature is generally about 553 K, for comprehensive research, the influence of the relative standard deviation of the temperature on the confidence of the measurement results when the inlet velocity is different is described below. The set cases are shown in Table 3.
Figure 13, Figure 14, Figure 15, Figure 16 and Figure 17 are the center concentration deviation for cases 1~5, 6~10, 11~15, 16~20, and 21~25, respectively. Figure 18 shows the mean of the center concentration deviation of 1000 groups of simulation results under each case.
It can be seen from Figure 13, Figure 14, Figure 15, Figure 16 and Figure 17 that the catalyst inlet velocity has a significant effect on the center concentration deviation under different relative standard deviations of temperature. When the inlet velocity is large under the same relative standard deviation of temperature, the center concentration deviation fluctuates less. Figure 18 shows that when the relative standard deviation of temperature is constant, with increasing inlet velocity, the mean of center concentration deviation rises at first and then declines, reaching a maximum when the inlet velocity is 2.1 m/s. It can be explained that when the inlet velocity is 2.1 m/s, the denitration efficiency is most obviously affected by the temperature change. Therefore, the difference in NO removal effect at different temperatures and positions is more significant, and the center concentration deviation becomes larger. In addition, it can be seen from Figure 18 that the smaller the relative standard deviation of temperature, the smaller the influence of the inlet velocity on the mean of the center concentration deviation. When the relative standard deviation of temperature is reduced to 0.005, the mean of the center concentration deviation of the five inlet velocities is close.
Figure 19, Figure 20, Figure 21, Figure 22 and Figure 23 show the relationship between deviation grade standard and confidence of measurement results under cases 1~5, 6~10, 11~15, 16~20, and 21~25, respectively. Figure 24 shows the relationship between different velocities and the confidence of measurement results under the different relative standard deviations of temperature when the deviation grade standard is 0.25.
It can be seen from Figure 19, Figure 20, Figure 21, Figure 22 and Figure 23 that the velocity at the catalyst inlet has a great impact on the confidence of the measurement results under the relative standard deviation of temperature. It can be seen from Figure 24 that under the same relative standard deviation of temperature, the confidence of measurement results decreases first and then increases with the rise of velocity. When the inlet velocity is 2.1 m/s, the confidence of measurement results reaches the minimum. Figure 18 shows the opposite trend with Figure 24; the smaller the center concentration deviation, the higher the confidence of measurement results. With the decrease in the relative standard deviation of temperature, the confidence of the measurement results corresponding to each inlet velocity increases. When the relative standard deviation of temperature is less than or equal to 0.005, the velocity at the catalyst inlet of SCR denitration reactor is between 1.35 and 5.05 m/s, and the confidence is greater than 0.9. It can be considered that the measurement results are reliable at this time.
Figure 25 shows the relationship between mean velocity and relative standard deviation of outlet NO concentration under different relative standard deviations of temperature. It can be seen from Figure 25 that under the same relative standard deviation of temperature, the mean of the relative standard deviation of NO concentration at the outlet of 1000 groups first increases and then decreases with the increase in the velocity at the inlet of the catalyst, and with the increase in the relative standard deviation of temperature, the mean of the relative standard deviation of NO concentration at the outlet of 1000 groups corresponding to each velocity increases and the curve becomes steep. The center concentration deviation is consistent with the change of the relative standard deviation of NO concentration at the outlet, which is also consistent with the law that the smaller the relative standard deviation of NO concentration at the outlet, the smaller the center concentration deviation and the higher the confidence of the measurement results.

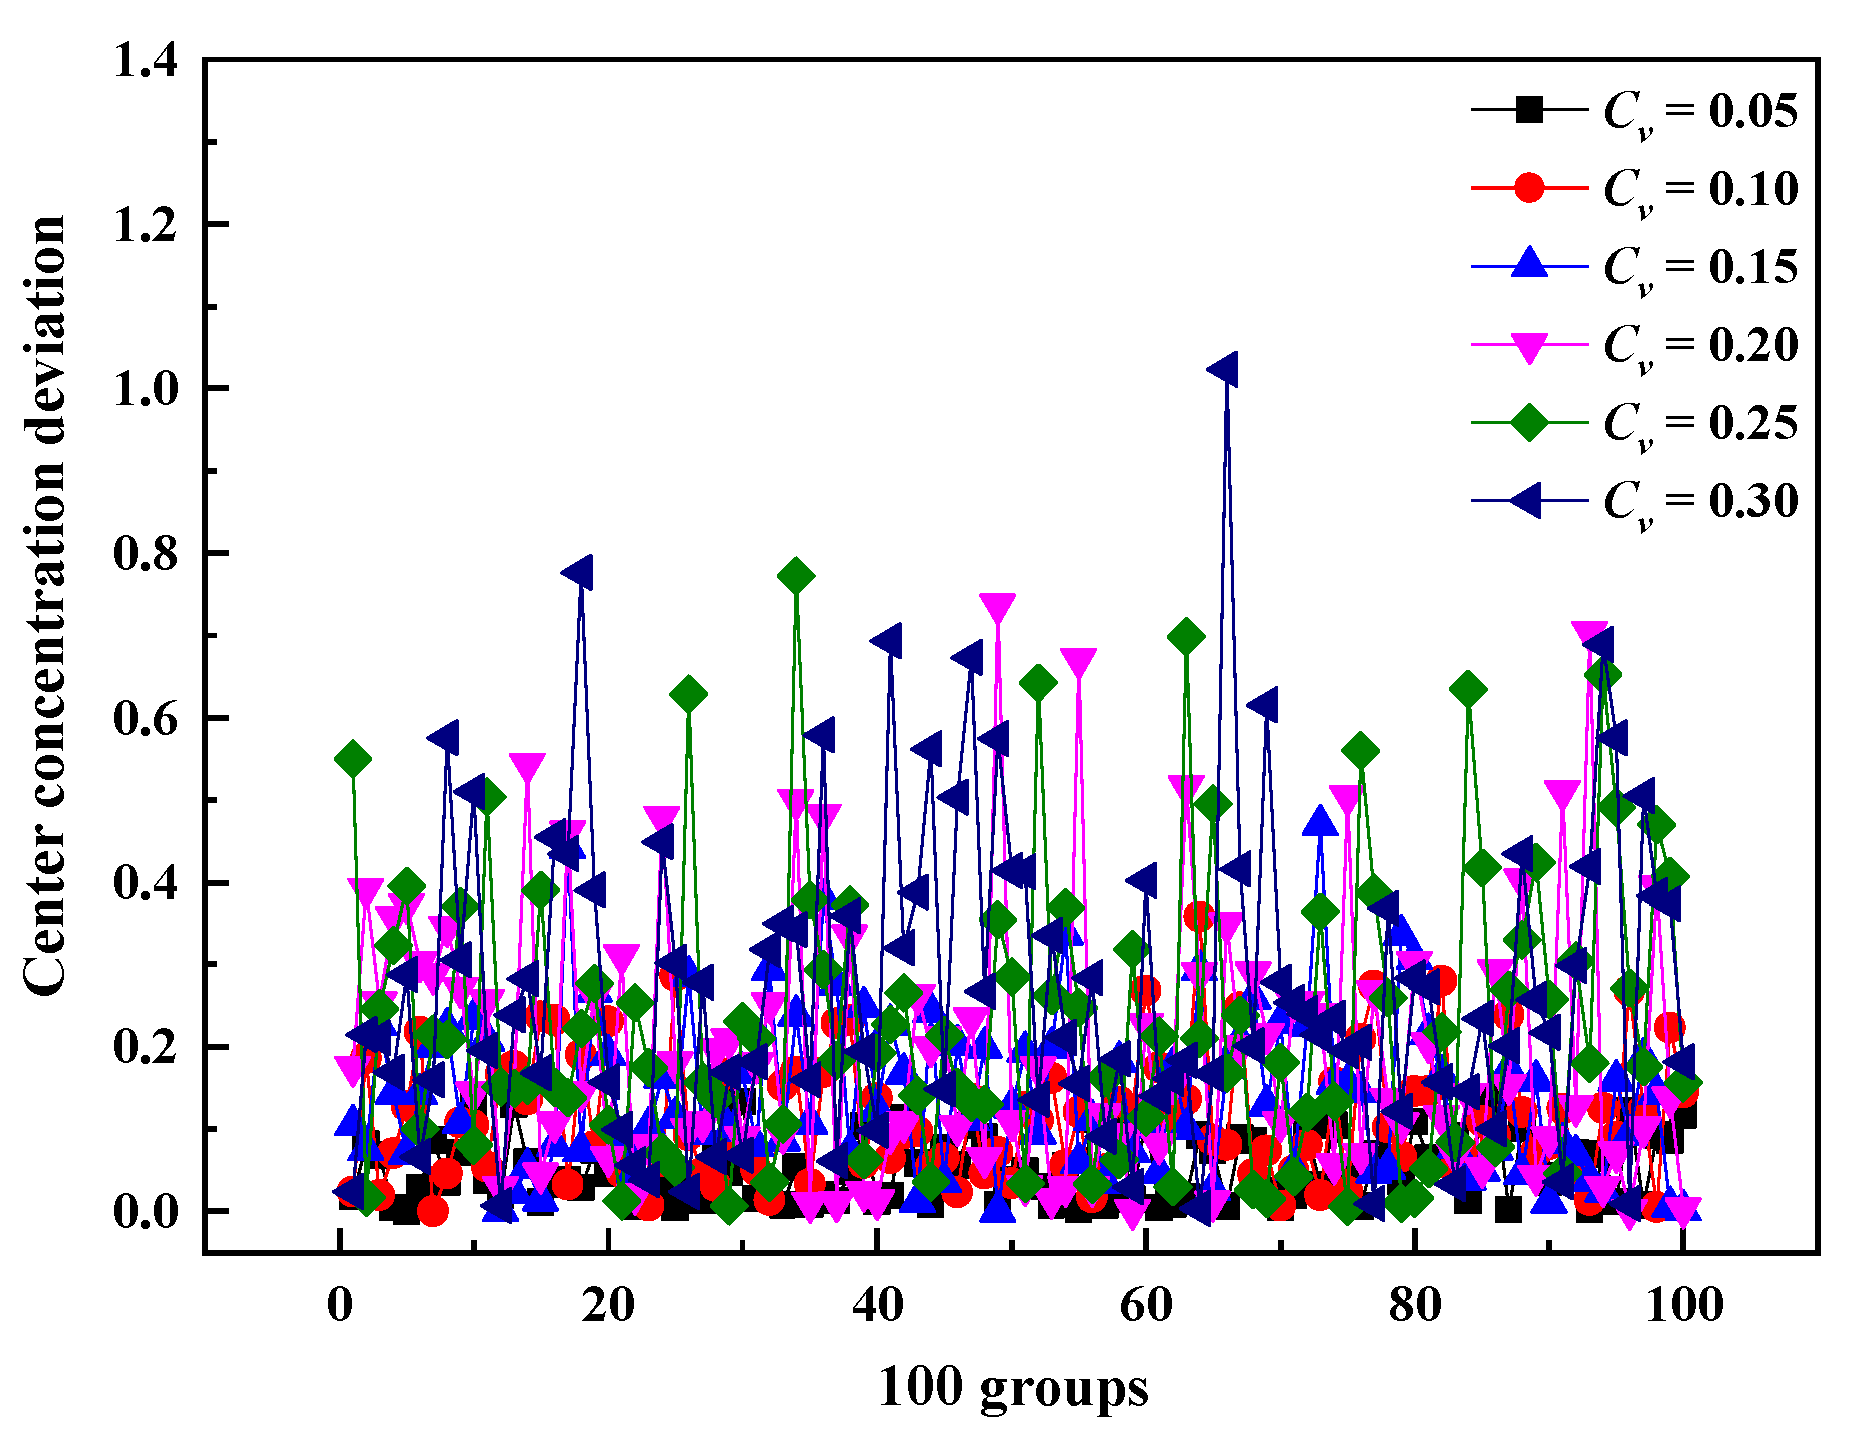
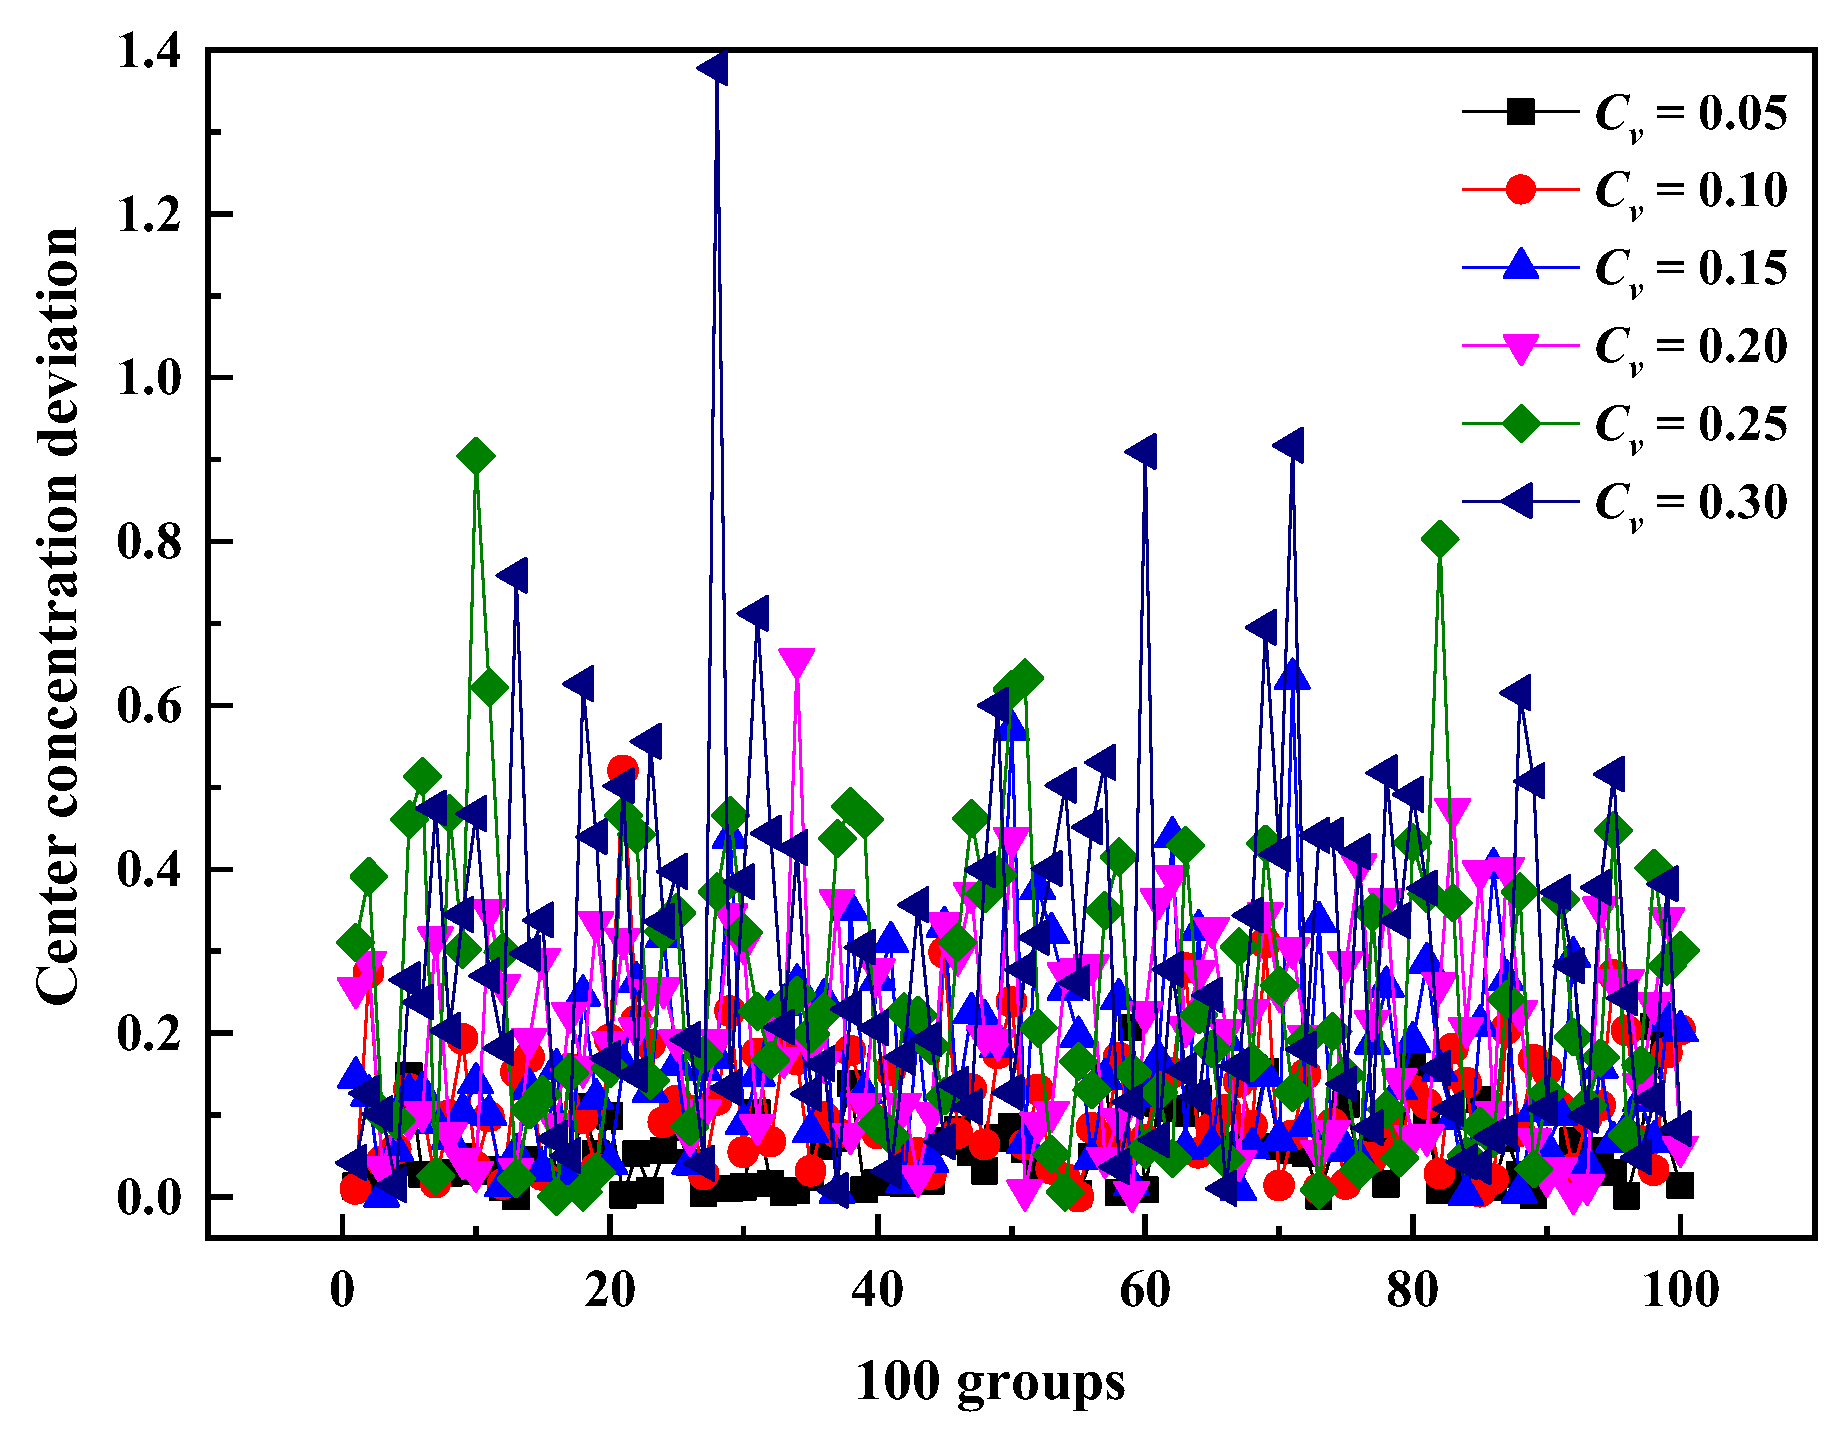
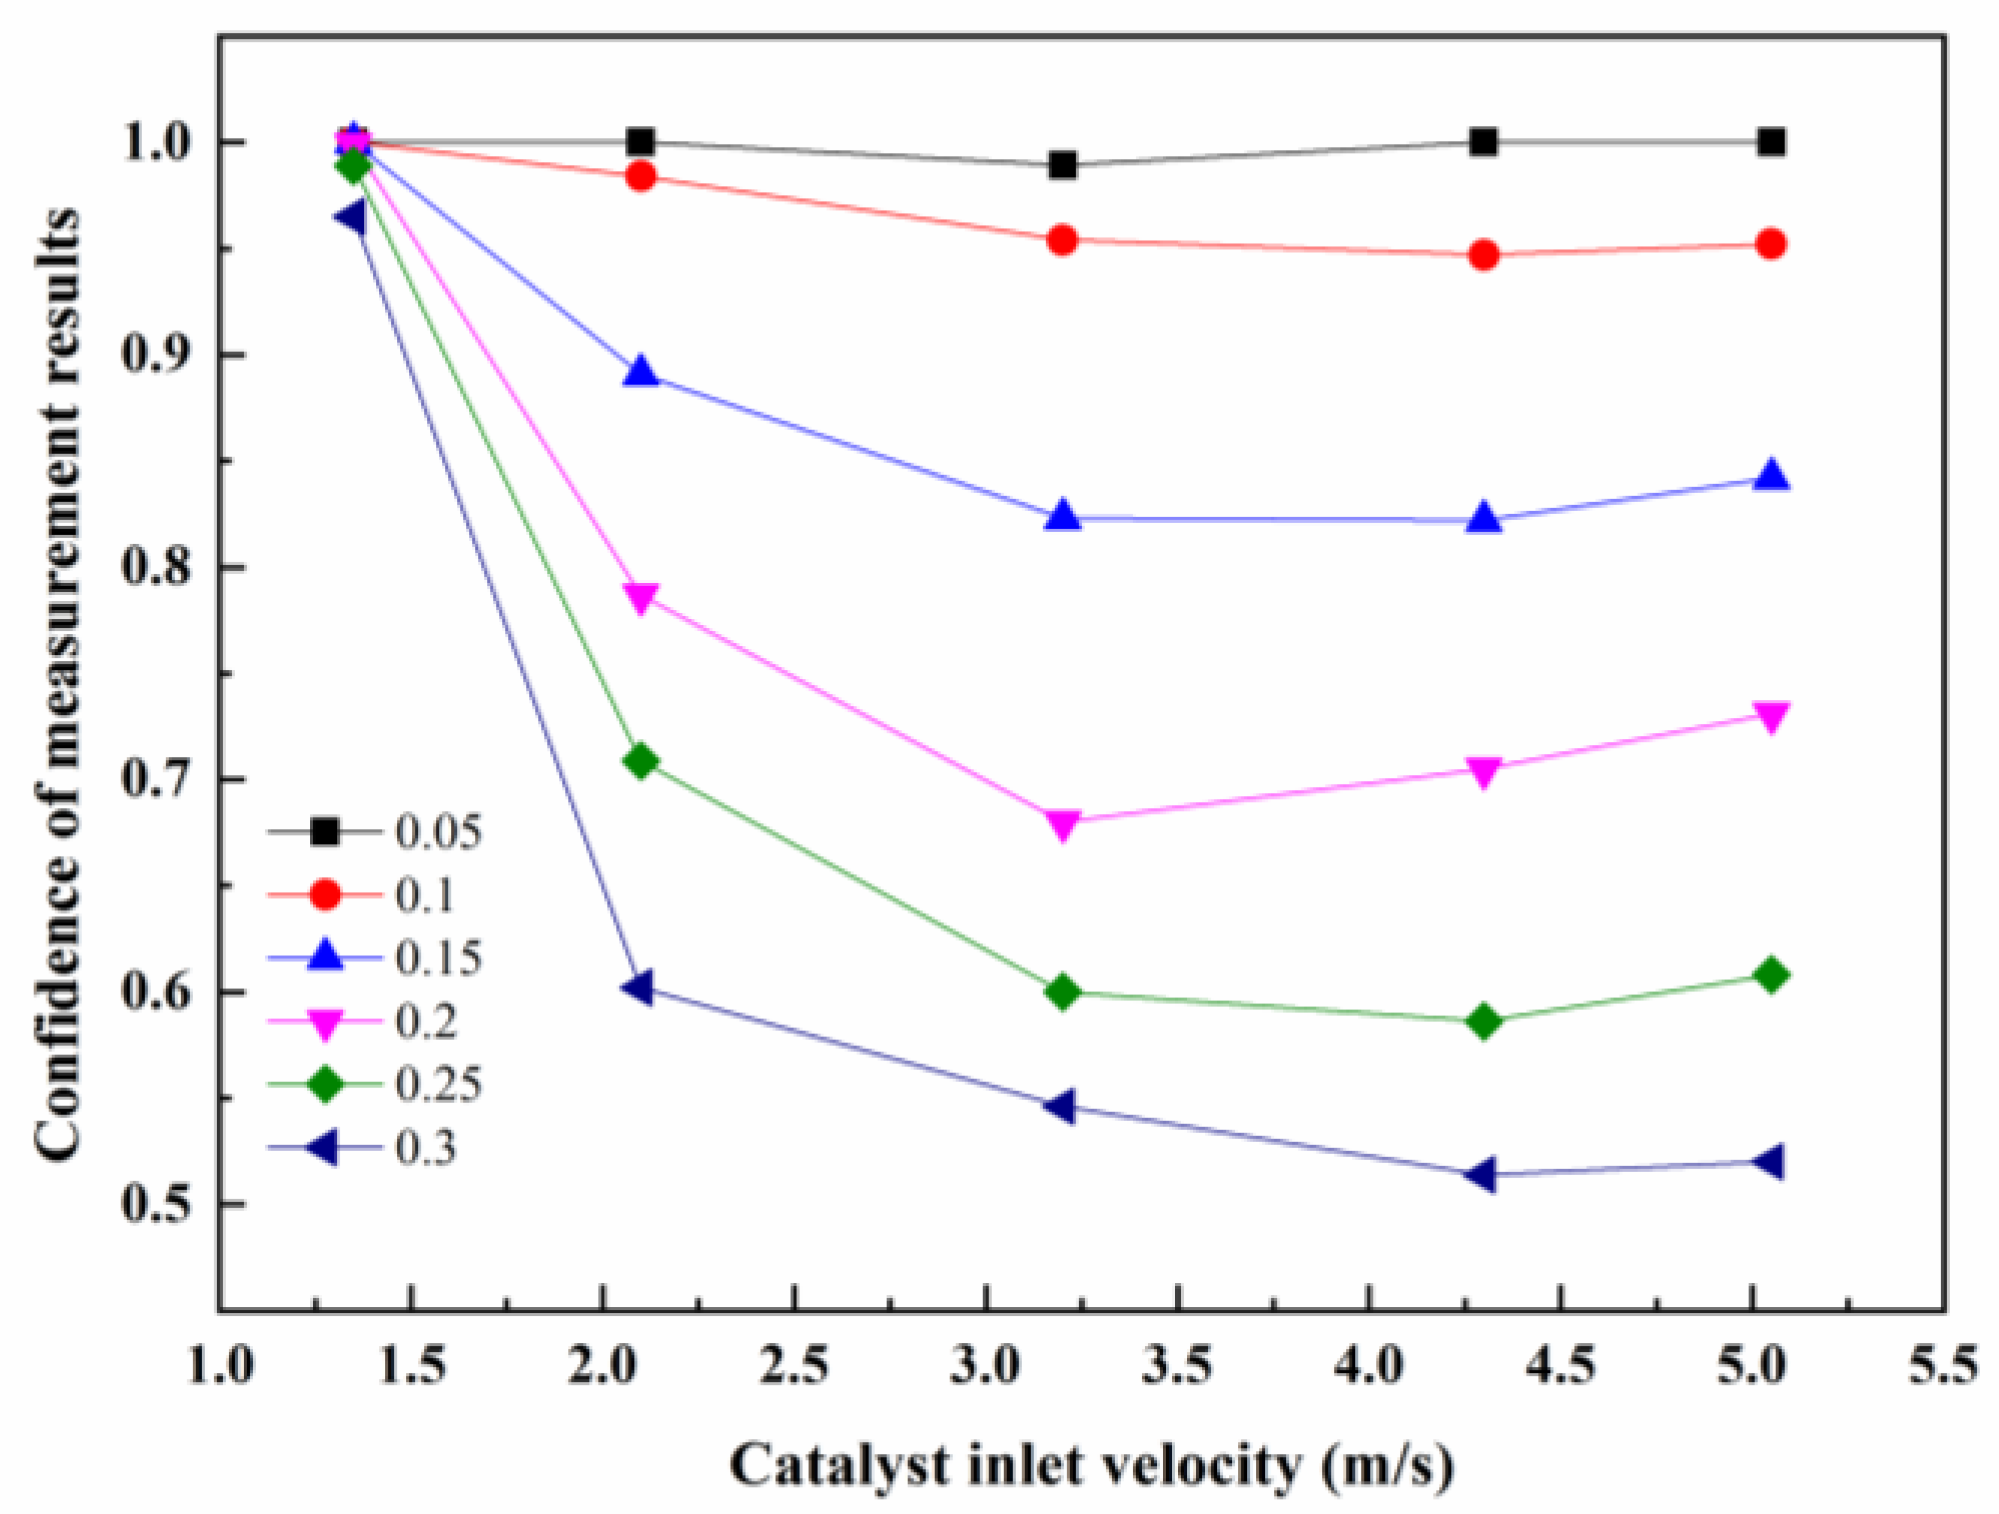
3.3. Effect of Nonuniform Velocity on the Confidence of NO Measurement Results at the Outlet

The following velocity random fields are designed: the mean velocity is 1.35, 2.1, 3.2, 4.3, and 5.05 m/s, and the relative standard deviation of velocity is 0.05, 0.1, 0.15, 0.2, and 0.25. There are 30 cases in total, and each case has 1000 groups. The detailed design conditions are summarized in Table 4.
Figure 26, Figure 27, Figure 28, Figure 29 and Figure 30 show the center concentration deviation for cases v1~v5, v6~v10, v11~v15, v16~v20, and v21~v25, respectively. Figure 31 gives the mean of 1000 groups of results for center concentration deviation under each case.
Figure 26, Figure 27, Figure 28, Figure 29 and Figure 30 show that when the mean velocity is constant, the greater the relative standard deviation of velocity, the greater the center concentration deviation, and the more obvious the fluctuation of the center concentration deviation of 1000 groups. When the relative standard deviation of velocity is 0.05, most of the center concentration deviation does not exceed 0.1, and when the relative standard deviation of velocity is 0.30, the center concentration deviation can reach 1.4. This is because the greater the relative standard deviation of velocity, that is, the more nonuniform the velocity distribution, the more significant the difference in NO removal effect at different positions, so the greater the center concentration deviation. Figure 31 shows the mean of center concentration deviation under different cases. It can be seen from the figure that when the relative standard deviation of velocity is constant, the average value of center concentration deviation first increases and then decreases with the increase in the mean velocity, and the mean velocity corresponding to the inflection point is between 3.2 and 4.3 m/s, which can be understood as when the relative standard deviation of velocity is constant, the greater the mean velocity at the inlet, the greater the difference between the NO concentration at the outlet center and the mean concentration at the outlet, and the greater the average NO concentration at the outlet. The ratio of the difference between the NO concentration at the outlet center and the average concentration at the outlet to the average NO concentration at the outlet gradually increases, but the increasing range gradually decreases until the velocity at the inlet is a certain value between 3.2 and 4.3 m/s, the ratio of the difference between the NO concentration at the outlet center and the average concentration at the outlet to the average NO concentration at the outlet reaches the maximum.
Figure 32, Figure 33, Figure 34, Figure 35 and Figure 36 give the relationship between the deviation grade standard and the confidence of measurement results under cases v1~v5, v6~v10, v11~v15, v16~v20, and v21~v25, respectively. Figure 37 shows the relationship between relative standard deviation of velocity and confidence of measurement results when deviation grade standard is 0.25.
It can be seen from Figure 32, Figure 33, Figure 34, Figure 35 and Figure 36 that the inlet velocity has a great influence on the confidence of measurement results under different relative standard deviations of velocity. It can be seen from Figure 37 that under the same relative standard deviation of velocity, the confidence of measurement results decreases first and then increases with the increase in velocity, and the confidence of measurement results reaches the minimum when the catalyst inlet velocity is between 3.2 and 4.3 m/s. With the decrease in the relative standard deviation of the velocity, the confidence of the measurement results corresponding to each inlet velocity increases. When the relative standard deviation of velocity is less than or equal to 0.1, the inlet velocity of SCR denitration reactor catalyst is between 1.35 and 5.05 m/s, and the confidence is greater than 0.9, it can be considered that the measurement results are reliable at this time.

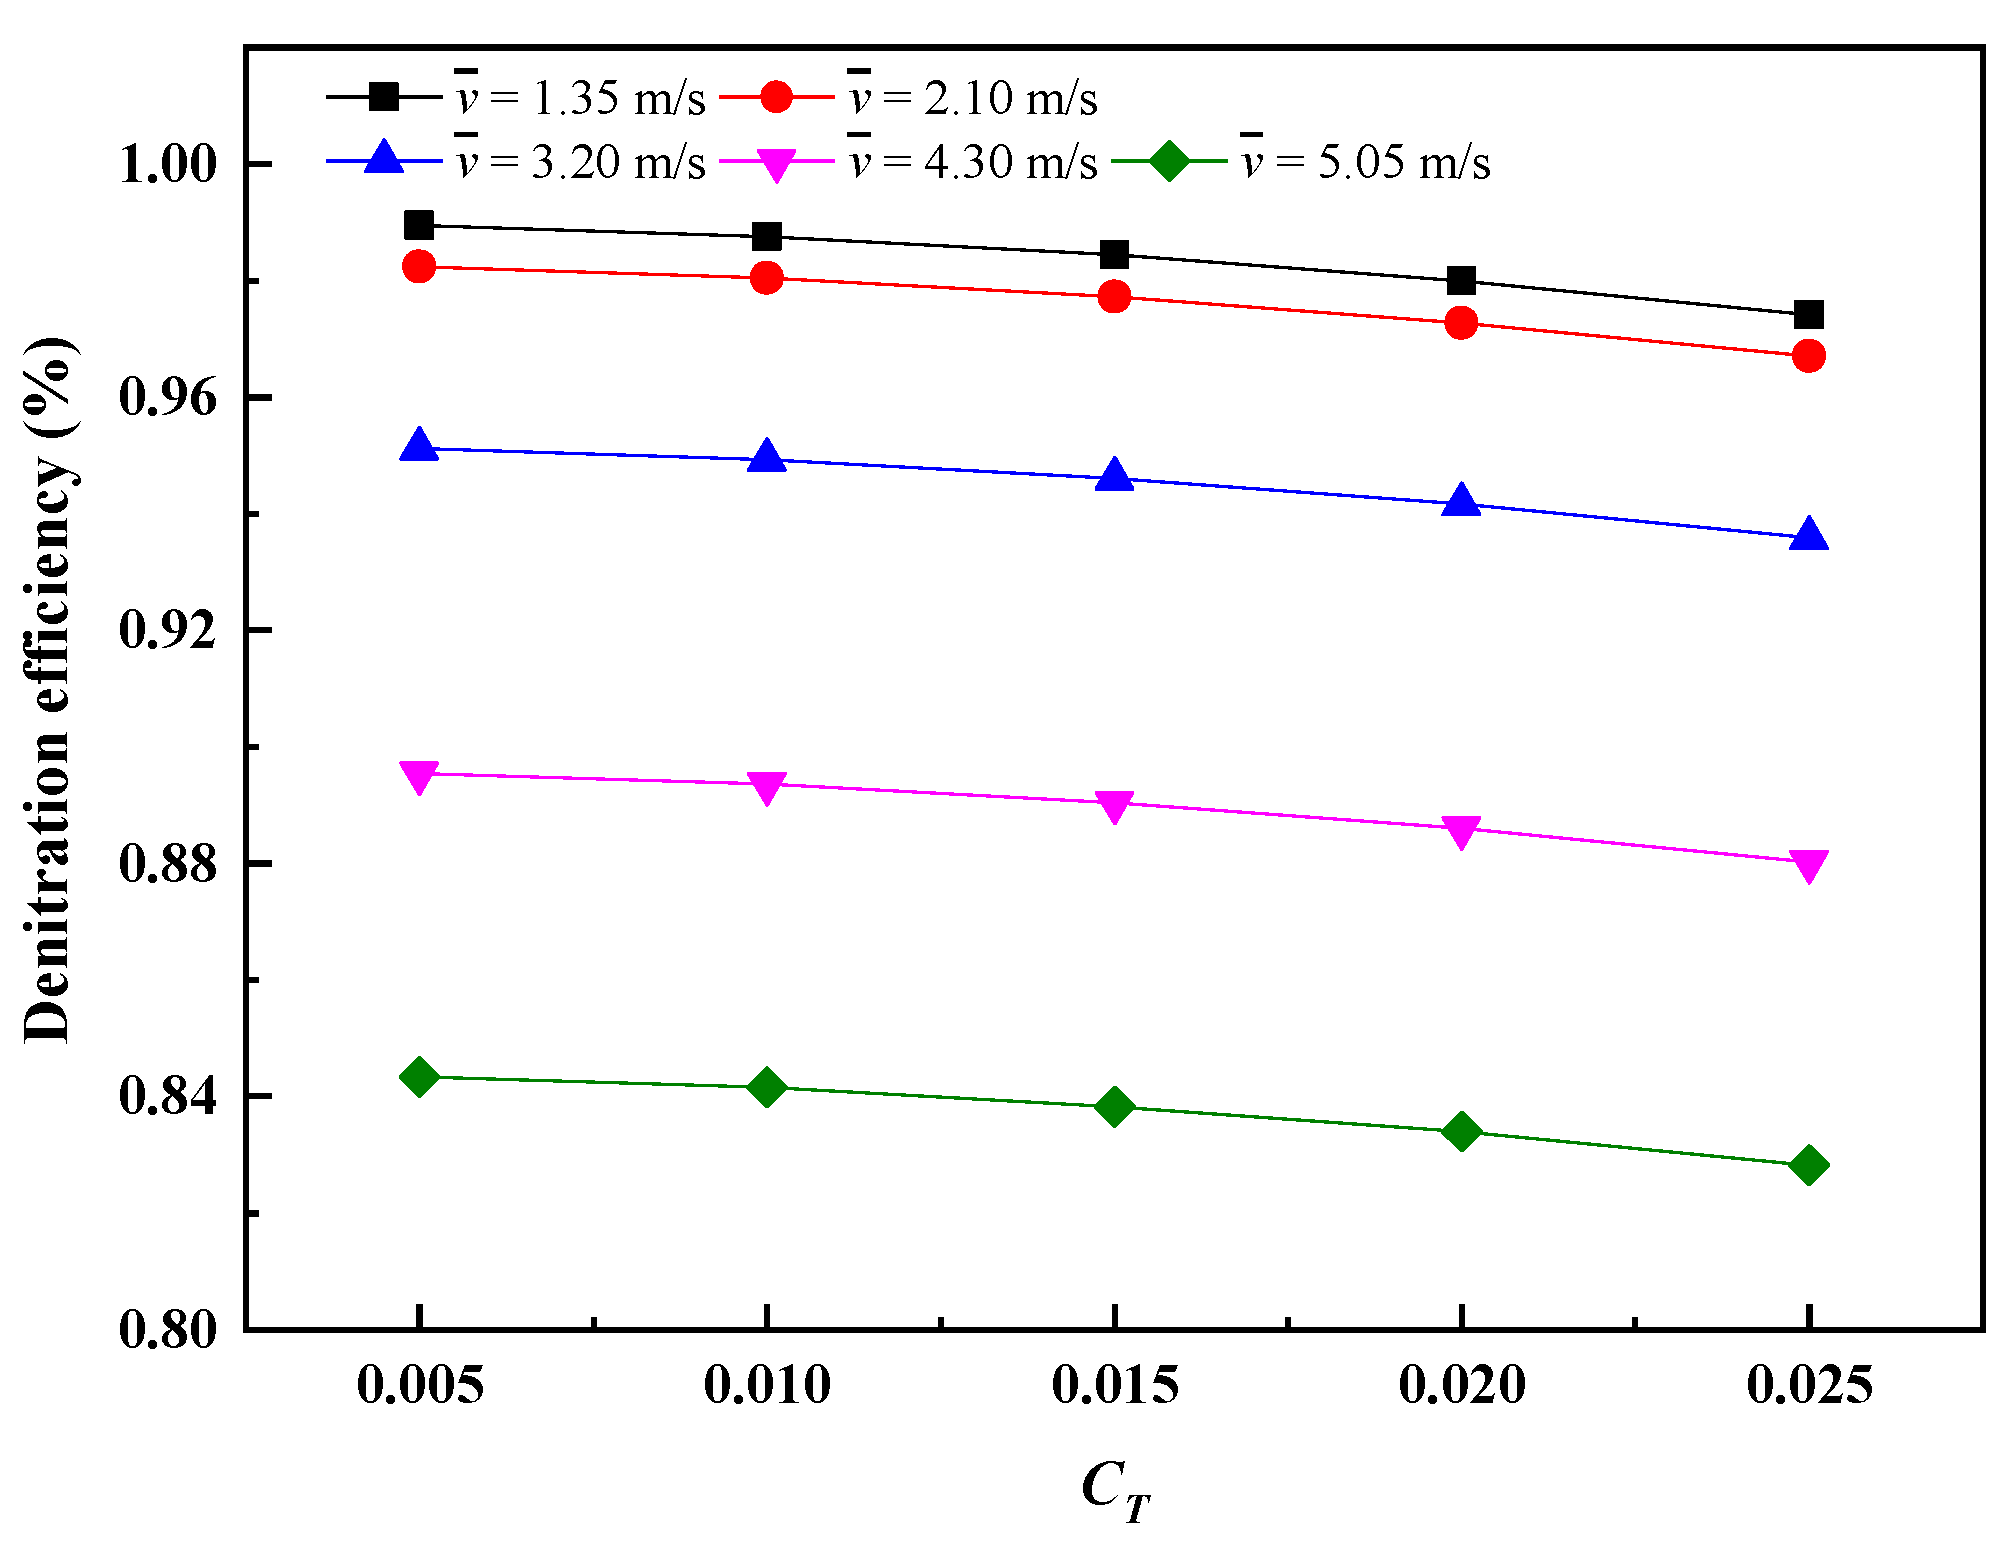
3.4. Effect of Nonuniform Temperature and Velocity on Denitration Efficiency

3.4.1. Effect of Nonuniform Temperature on Denitration Efficiency

Based on Section 3.2.1, a relationship is obtained between the relative standard deviation of temperature and the denitration efficiency at different mean temperatures when the catalyst inlet velocity is 3.2 m/s, as shown in Figure 38. With the increase in the relative standard deviation of temperature, the denitration efficiency decreases slightly, and the mean temperature is different, and the variation range of denitration efficiency with the relative standard deviation of temperature is similar. Based on Section 3.2.2, a relationship is obtained between the relative standard deviation of temperature and the denitration efficiency at different mean velocities, as shown in Figure 39. For different velocities, the corresponding denitration efficiency decreases with the increase in the relative standard deviation of temperature.
Through this analysis, it can be seen that the relative standard deviation of temperature has little impact on denitration efficiency, but has a great impact on the confidence of measurement results. Under different mean temperatures or mean velocities, the relative standard deviation of temperature is different, and the confidence of measurement results is very different. When the relative standard deviation of temperature is 0.005, it can be guaranteed to be within the air volume range studied in this paper; the measurement results are reliable, so as to realize accurate ammonia injection.

3.4.2. Effect of Nonuniform Velocity on Denitration Efficiency

Based on Section 3.3, a relationship is obtained between the relative standard deviation of velocity and denitrification efficiency at different mean velocities, as shown in Figure 40. With the increase in the relative standard deviation of velocity, the denitration efficiency decreases slightly; the greater the velocity, the greater the reduction in the corresponding denitration efficiency with the increase in the relative standard deviation of velocity. This is because when the velocity mean value is constant, the maximum velocity difference also increases with the increase in the relative standard deviation of velocity. When the mean velocity increases, the growth range of the maximum velocity difference also increases, therefore, the greater the reduction range of denitration efficiency.
Through this analysis, it can be seen that the relative standard deviation of velocity has a certain impact on denitration efficiency and has a great impact on the confidence of measurement results. Under different velocity mean values, the relative standard deviation of velocity is different, and the confidence of measurement results is very different. When the relative standard deviation of velocity is 0.1, it can ensure that the measurement results are credible within the air volume range studied in this paper.
Rogers et al. [28] studied the influence of the nonuniformity of parameters such as flow field, NH3/NO molar ratio, and temperature on the efficiency of SCR denitration reaction system, which is basically consistent with the trend in this paper.

4. Conclusions

In this study, research was performed to solve the problem that the outlet NO concentration is uneven due to the nonuniformity of temperature and velocity, and the results of a single measurement point of outlet NO concentration are not representative. The following conclusions are obtained:
The catalyst inlet velocity has a great influence on the center concentration deviation and the confidence of measurement results under different relative standard deviations of temperature and velocity. When the relative standard deviation of temperature or velocity is constant, with the increase in catalyst inlet velocity, the mean of center concentration deviation first increases and then decreases, and the confidence of measurement results first decreases and then increases. The smaller the relative standard deviation is, the smaller the influence of catalyst inlet velocity on the mean of center concentration deviation is, and the confidence of measurement results corresponding to each velocity increases. Within the air volume range studied in this paper, in order to ensure the credibility of the measurement results, the relative standard deviation of temperature must be within 0.005 and the relative standard deviation of velocity must be within 0.1. When the catalyst inlet velocity is greater than 4 m/s, it can be relaxed to the relative standard deviation of temperature within 0.01 and the relative standard deviation of velocity within 0.1.
With the increase in the relative standard deviation of temperature or velocity, the denitration efficiency decreases slightly. With different temperature means, the variation range of denitration efficiency with the relative standard deviation of temperature is similar. The corresponding denitration efficiency decreases similarly with the increase in relative standard deviation of temperature. With different velocity means, the corresponding denitration efficiency decreases with the increase in relative standard deviation of temperature; the greater the velocity, the greater the reduction in the corresponding denitration efficiency with the increase in the relative standard deviation of velocity.

Supplementary Materials

The following are available online at https://0-www-mdpi-com.brum.beds.ac.uk/article/10.3390/atmos13060931/s1, Figure S1. Structure of catalyst meso model, Figure S2. Structure of catalyst macro model, Figure S3. Comparison between numerical simulation results and experimental results based on [1], Figure S4. Comparison of meso (b) and macro (a) simulation velocity of catalyst, Figure S5. Comparison of meso (b) and macro (a) simulation NO concentration of catalyst, Figure S6. Nonuniform velocity inlet distribution, Figure S7. Comparison of meso (b) and macro (a) simulated velocity of catalyst under nonuniform inlet conditions, Figure S8. Comparison of meso (b) and macro (a) simulated NO concentration of catalyst under nonuniform inlet conditions.

Author Contributions

Methodology, F.Q.; Project administration, F.Q., J.L., S.W., N.H. and B.X.; Writing—original draft, W.S.; Writing—review & editing, M.Y., Y.G., Y.S. and F.Q. All authors have read and agreed to the published version of the manuscript.

Funding

This research received no external funding.

Data Availability Statement

Not applicable.

Conflicts of Interest

The authors declare no conflict of interest.

References

  1. Xu, Z.J.; Zheng, Z.; Gao, X.Q. Operation optimization of the steel manufacturing process: A brief review. Int. J. Miner. Metall. Mater. 2021, 28, 1274–1287. [Google Scholar] [CrossRef]
  2. Wang, Y.Z.; Zhang, J.L.; Liu, Z.J.; Du, C.B. Recent Advances and Research Status in Energy Conservation of Iron Ore Sintering in China. Miner. Met. Mater. Soc. 2017, 69, 2404–2411. [Google Scholar] [CrossRef]
  3. Ye, L.; Lu, P.; Chen, D.; Chen, D.; Wu, H.; Dai, W.; Gan, Y.; Xiao, J.; Xie, Z.; Li, Z.; et al. Activity enhancement of acetate precursor prepared on MnOx-CeO2 catalyst for low-temperature NH3-SCR: Effect of gaseous acetone addition. Chin. Chem. Lett. 2021, 32, 2509–2512. [Google Scholar] [CrossRef]
  4. Meng, H. Deep desulfurization of sintering flue gas in iron and steel works based on low-temperature oxidation. Open Chem. 2020, 18, 1370–1380. [Google Scholar] [CrossRef]
  5. Shen, B.; Ma, H.; Yan, Y.J. Mn-CeOx/Ti-PILCs for selective catalytic reduction of NO with NH3 at low temperature. J. Environ. Sci. 2012, 24, 499–506. [Google Scholar] [CrossRef]
  6. Kobayashi, M.; Kuma, R.; Morita, A. Low temperature selective catalytic reduction of NO by NH3 over V2O5 supported on TiO2–SiO2–MoO3. Catal. Lett. 2006, 112, 37–44. [Google Scholar] [CrossRef]
  7. Wang, Y.; Tan, H.; Dong, K.; Liu, H.; Xiao, J.; Zhang, J. Study of ash fouling on the blade of induced fan in a 330 MW coal-fired power plant with ultra-low pollutant emission. Appl. Therm. Eng. 2017, 118, 283–291. [Google Scholar] [CrossRef]
  8. Theinnoi, K.; Tsolakis, A.; Sitshebo, S.; Cracknell, R.F.; Clark, R.H. Fuels combustion effects on a passive mode silver/alumina HC-SCR catalyst activity in reducing NOx. Chem. Eng. J. 2010, 158, 468–473. [Google Scholar] [CrossRef]
  9. Zhang, K.; Zhao, J.; Zhu, Y. MPC case study on a selective catalytic reduction in a power plant. J. Process Control 2018, 62, 1–10. [Google Scholar] [CrossRef]
  10. Tan, P.Q.; Zhang, S.C.; Wang, S.Y.; Hu, Z.Y.; Lou, D.M. Simulation on catalytic performance of fresh and aged SCR catalysts for diesel engines. J. Energy Inst. 2020, 93, 2280–2292. [Google Scholar] [CrossRef]
  11. Li, Z.; Lee, Y.S.; Chen, J.; Qian, Y. Developing variable moving window PLS models: Using case of NOx emission prediction of coal-fired power plants. Fuel 2021, 296, 120441. [Google Scholar] [CrossRef]
  12. Liu, G.; Zhang, Y.; Shen, D.; Yuan, B.; Li, R.; Sun, Y. Anticipatory NH3 injection control for SCR system based on the prediction of the inlet NOx concentration. J. Energy Inst. 2021, 94, 167–175. [Google Scholar] [CrossRef]
  13. Yao, J.; Zhong, Z.; Zhu, L. Porous Medium Model in Computational Fluid Dynamics Simulation of a Honeycombed SCR DeNOx Catalyst. Chem. Eng. Technol. 2015, 38, 283–290. [Google Scholar] [CrossRef]
  14. Yang, J.; Ma, H.; Yamamoto, Y.; Yu, J.; Xu, G.; Zhang, Z.; Suzuki, Y. SCR catalyst coated on low-cost monolith support for flue gas denitration of industrial furnaces. Chem. Eng. J. 2013, 230, 513–521. [Google Scholar] [CrossRef]
  15. Yue, G.; Qiu, T.; Lei, Y. Experimental demonstration of NOx reduction and ammonia slip for diesel engine SCR system. Environ. Sci. Pollut. Res. 2022, 29, 1118–1133. [Google Scholar] [CrossRef]
  16. Zhang, Y.; Lou, D.; Tan, P.; Hu, Z.; Fang, L. Effect of SCR downsizing and ammonia slip catalyst coating on the emissions from a heavy-duty diesel engine. Energy Rep. 2022, 8, 749–757. [Google Scholar] [CrossRef]
  17. Cheng, T.; Zheng, C.; Yang, L.; Wu, H.; Fan, H. Effect of selective catalytic reduction denitrification on fine particulate matter emission characteristics. Fuel 2019, 238, 18–25. [Google Scholar] [CrossRef]
  18. Sohn, J.; Hwang, I.S.; Hwang, J. Improvement of ammonia mixing in an industrial scale selective catalytic reduction De-NOx system of a coal-fired power plant: A numerical analysis. Process Saf. Environ. Prot. 2021, 147, 334–345. [Google Scholar] [CrossRef]
  19. Tian, X.; Xiao, Y.; Zhou, P.; Zhang, W.; Chu, Z.; Zheng, W. Study on the mixing performance of static mixers in selective catalytic reduction (SCR) systems. J. Mar. Eng. Technol. 2015, 14, 57–60. [Google Scholar] [CrossRef] [Green Version]
  20. Ye, D.; Wang, X.; Wang, R.; Gao, S.; Liu, H.; Wang, H. Optimizing flow field in an SCR system of a 600 MW power plant: Effects of static mixer alignment style. Waste Dispos. Sustain. Energy 2021, 3, 339–346. [Google Scholar] [CrossRef]
  21. Wang, L.; Qian, F.; Zhu, J.; Huang, N.; Xu, B.; Wu, H. Multi-scale simulation of flow characteristics in selective catalytic reduction honeycomb catalyst. Chin. J. Process Eng. 2020, 20, 134–140. [Google Scholar] [CrossRef]
  22. Ye, M.; Qian, F.; Gao, Y.; Lu, J.; Han, Y.; Huang, N.; Xu, B.; Wu, H. CFD analysis of influencing factors on SCR denitration efficiency of sintering flue gas based on response surface methodology. Atmos. Pollut. Res. 2021, 12, 101107. [Google Scholar] [CrossRef]
  23. Frenkel, D.; Schrenk, K.J.; Martiniani, S. Monte Carlo sampling for stochastic weight functions. Proc. Natl. Acad. Sci. USA 2017, 114, 6924–6929. [Google Scholar] [CrossRef] [PubMed] [Green Version]
  24. Kunsch, R.J.; Rudolf, D. Optimal confidence for Monte Carlo integration of smooth functions. Adv. Comput. Math. 2019, 45, 3095–3122. [Google Scholar] [CrossRef] [Green Version]
  25. Dammalapati, S.; Aghalayam, P.; Kaisare, N. Modeling the Effect of Nonuniformities from Urea Injection on SCR Performance Using CFD. Ind. Eng. Chem. Res. 2019, 58, 20247–20258. [Google Scholar] [CrossRef]
  26. Cho, J.M.; Choi, J.W.; Hong, S.H.; Kim, K.C.; Na, J.H.; Lee, J.Y. Application of computational fluid dynamics analysis for improving performance of commercial scale selective catalytic reduction. Korean J. Chem. Eng. 2006, 23, 43–56. [Google Scholar] [CrossRef]
  27. HJ 75-2017; Technical Specification for Continuous Monitoring of Flue gas (SO2, NOx and Particulate Matter) Emission from Fixed Pollution Sources. Ministry of Environmental Protection, Chinese Academy of Environmental Sciences: Beijing, China, 2017.
  28. Rogers, K.; Nolan, P.S. SCR Reactor Performance Profiling and Results Analysis; The U.S. EPA/DOE/EPRI Combined Power Plant Air Pollutant Control Symposium: Chicago, IL, USA, 2001; pp. 20–23.
Figure 1. Geometric model of the SCR reactor.
Atmosphere 13 00931 g001
Figure 2. Schematic diagram of research routes.
Atmosphere 13 00931 g002
Figure 3. Frequency distribution of temperature and velocity upstream from the first-layer catalyst: (a) temperature; (b) velocity.
Atmosphere 13 00931 g003
Figure 4. Example of catalyst inlet boundary condition data.
Atmosphere 13 00931 g004
Figure 5. Center concentration deviation under different relative standard deviations of temperature at mean temperature 543 K.
Atmosphere 13 00931 g005
Figure 6. Center concentration deviation under different relative standard deviations of temperature at mean temperature 553 K.
Atmosphere 13 00931 g006
Figure 7. Center concentration deviation under different relative standard deviations of temperature at mean temperature 563 K.
Atmosphere 13 00931 g007
Figure 8. Relationship between different relative standard deviations of temperature and the mean of center concentration deviation.
Atmosphere 13 00931 g008
Figure 9. Relationship between deviation grade standard and confidence of measurement results under the different relative standard deviations of temperature at mean temperature 543 K.
Atmosphere 13 00931 g009
Figure 10. Relationship between deviation grade standard and confidence of measurement results under the different relative standard deviations of temperature at mean temperature 553 K.
Atmosphere 13 00931 g010
Figure 11. Relationship between deviation grade standard and confidence of measurement results under the different relative standard deviations of temperature at mean temperature 563 K.
Atmosphere 13 00931 g011
Figure 12. Relationship between relative standard deviation of temperature and confidence of measurement results at deviation grade standard of 0.25.
Atmosphere 13 00931 g012
Figure 13. Center concentration deviation under the different relative standard deviations of temperature at velocity 1.35 m/s.
Atmosphere 13 00931 g013
Figure 14. Center concentration deviation under the different relative standard deviations of temperatures at velocity 2.1 m/s.
Atmosphere 13 00931 g014
Figure 15. Center concentration deviation under the different relative standard deviations of temperatures at velocity 3.2 m/s.
Atmosphere 13 00931 g015
Figure 16. Center concentration deviation under the different relative standard deviations of temperatures at velocity 4.3 m/s.
Atmosphere 13 00931 g016
Figure 17. Center concentration deviation under the different relative standard deviations of temperatures at velocity 5.05 m/s.
Atmosphere 13 00931 g017
Figure 18. Relationship between different inlet velocity and the mean of center concentration deviation under different relative standard deviations of temperature.
Atmosphere 13 00931 g018
Figure 19. Relationship between deviation grade standard and confidence of measurement results under different relative standard deviations of temperature at velocity 1.35 m/s.
Atmosphere 13 00931 g019
Figure 20. Relationship between deviation grade standard and confidence of measurement results under different relative standard deviations of temperature at velocity 2.1 m/s.
Atmosphere 13 00931 g020
Figure 21. Relationship between deviation grade standard and confidence of measurement results under different relative standard deviations of temperature at velocity 3.2 m/s.
Atmosphere 13 00931 g021
Figure 22. Relationship between deviation grade standard and confidence of measurement results under different relative standard deviations of temperature at velocity 4.3 m/s.
Atmosphere 13 00931 g022
Figure 23. Relationship between deviation grade standard and confidence of measurement results under different relative standard deviations of temperature at velocity 5.05 m/s.
Atmosphere 13 00931 g023
Figure 24. Relationship between mean velocity and the confidence of the measurement results under different relative standard deviations of temperature at deviation grade standard 0.25.
Atmosphere 13 00931 g024
Figure 25. Relationship between mean velocity and relative standard deviation of outlet NO concentration under different relative standard deviations of temperature.
Atmosphere 13 00931 g025
Figure 26. Center concentration deviation under different relative standard deviations of velocity at velocity 1.35 m/s.
Atmosphere 13 00931 g026
Figure 27. Center concentration deviation under different relative standard deviations of velocity at velocity 2.1 m/s.
Atmosphere 13 00931 g027
Figure 28. Center concentration deviation under different relative standard deviations of velocity at velocity 3.2 m/s.
Atmosphere 13 00931 g028
Figure 29. Center concentration deviation under different relative standard deviations of velocity at velocity 4.3 m/s.
Atmosphere 13 00931 g029
Figure 30. Center concentration deviation under different relative standard deviations of velocity at velocity 5.05 m/s.
Atmosphere 13 00931 g030
Figure 31. Relationship between mean velocity and mean deviation of center concentration under different relative standard deviations of velocity.
Atmosphere 13 00931 g031
Figure 32. Relationship between deviation grade standard and confidence of measurement results under different relative standard deviation of velocity at mean velocity 1.35 m/s.
Atmosphere 13 00931 g032
Figure 33. Relationship between deviation grade standard and confidence of measurement results under different relative standard deviation of velocity at mean velocity 2.1 m/s.
Atmosphere 13 00931 g033
Figure 34. Relationship between deviation grade standard and confidence of measurement results under different relative standard deviation of velocity at mean velocity 3.2 m/s.
Atmosphere 13 00931 g034
Figure 35. Relationship between deviation grade standard and confidence of measurement results under different relative standard deviation of velocity at mean velocity 4.3 m/s.
Atmosphere 13 00931 g035
Figure 36. Relationship between deviation grade standard and confidence of measurement results under different relative standard deviation of velocity at mean velocity 5.05 m/s.
Atmosphere 13 00931 g036
Figure 37. Relationship between relative standard deviation of velocity and confidence of measurement results at deviation grade standard 0.25.
Atmosphere 13 00931 g037
Figure 38. Relationship between relative standard deviation of temperature and denitration efficiency at velocity 3.2 m/s.
Atmosphere 13 00931 g038
Figure 39. Relationship between relative standard deviation of temperature and denitration efficiency under different velocities.
Atmosphere 13 00931 g039
Figure 40. Relationship between relative standard deviation of velocity and denitration efficiency.
Atmosphere 13 00931 g040
Table 1. Structural parameters of the SCR reactor.
SCR ReactorSize
Inlet section size/(mm × mm)2500 × 7000
Section size of flue collector/(mm × mm)2400 × 9288
Section size of reactor bulk/(mm × mm)8000 × 8950
Outlet section size/(mm × mm)2500 × 7000
Thickness of catalyst layer/(mm)800
Porosity of catalyst0.718
Reactor height/(mm)20,000
Table 2. Design of the temperature random field (different averaged values of temperature).
CaseMean of Catalyst Inlet Temperature (K)Relative Standard Deviation of TemperatureCatalyst Inlet Velocity
(m/s)
Case T1~T55430.005, 0.010, 0.015, 0.020, 0.0253.2
Case T6~T105530.005, 0.010, 0.015, 0.020, 0.0253.2
Case T11~T155630.005, 0.010, 0.015, 0.020, 0.0253.2
Table 3. Design of random temperature field (different averaged values of velocity).
CaseMean of Catalyst Inlet Temperature (K)Relative Standard Deviation of TemperatureCatalyst Inlet Velocity
(m/s)
Case 1~55530.005, 0.010, 0.015, 0.020, 0.0251.35
Case 6~105530.005, 0.010, 0.015, 0.020, 0.0252.1
Case 11~15
(T6~T10)
5530.005, 0.010, 0.015, 0.020, 0.0253.2
Case 16~205530.005, 0.010, 0.015, 0.020, 0.0254.3
Case 21~255530.005, 0.010, 0.015, 0.020, 0.0255.05
Table 4. Design of velocity random field.
CaseMean Catalyst
Inlet Velocity
Relative Standard Deviation of VelocityCatalyst Inlet Temperature
Case v1~v61.350.05, 0.10, 0.15, 0.20, 0.25, 0.30553
Case v7~v122.10.05, 0.10, 0.15, 0.20, 0.25, 0.30553
Case v13~v183.20.05, 0.10, 0.15, 0.20, 0.25, 0.30553
Case v19~v244.30.05, 0.10, 0.15, 0.20, 0.25, 0.30553
Case v25~v305.050.05, 0.10, 0.15, 0.20, 0.25, 0.30553
Publisher’s Note: MDPI stays neutral with regard to jurisdictional claims in published maps and institutional affiliations.

