
Primary Exploration of Leisure Path Design along Songhua River by a Small Number of Sample Experiment, Considering Several Multiple Indexes

Abstract
:1. Introduction
2. Materials and Methods
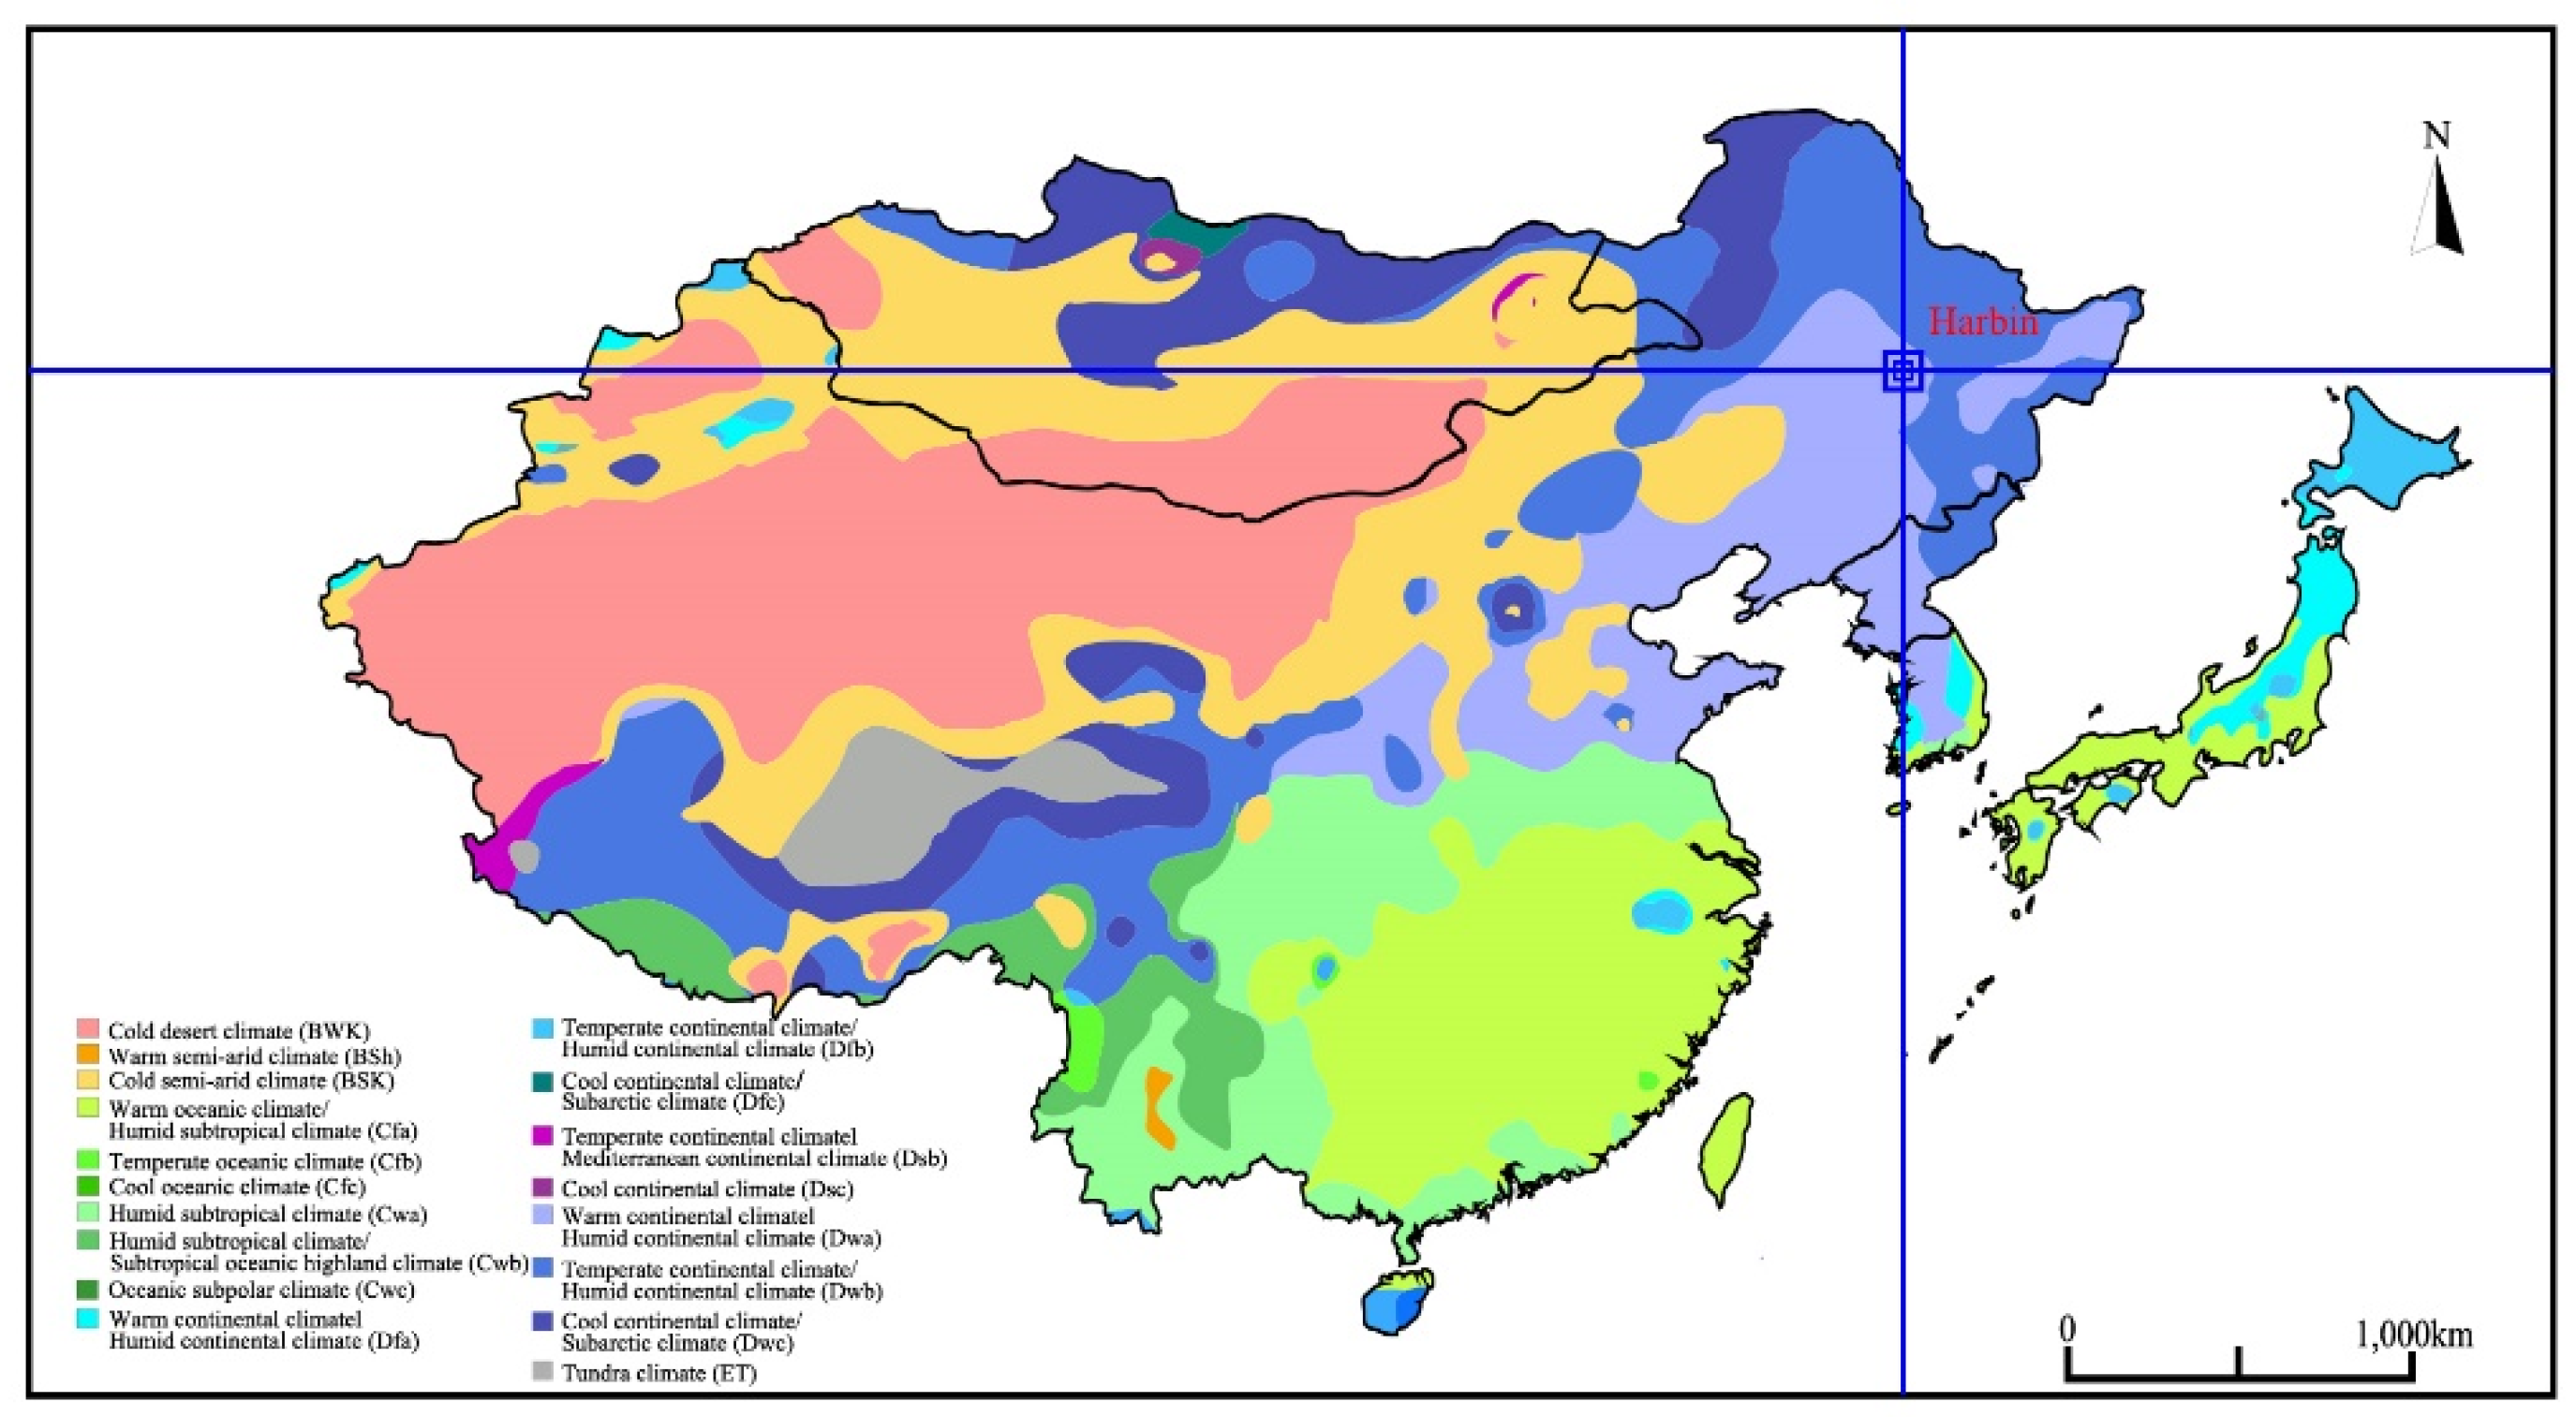
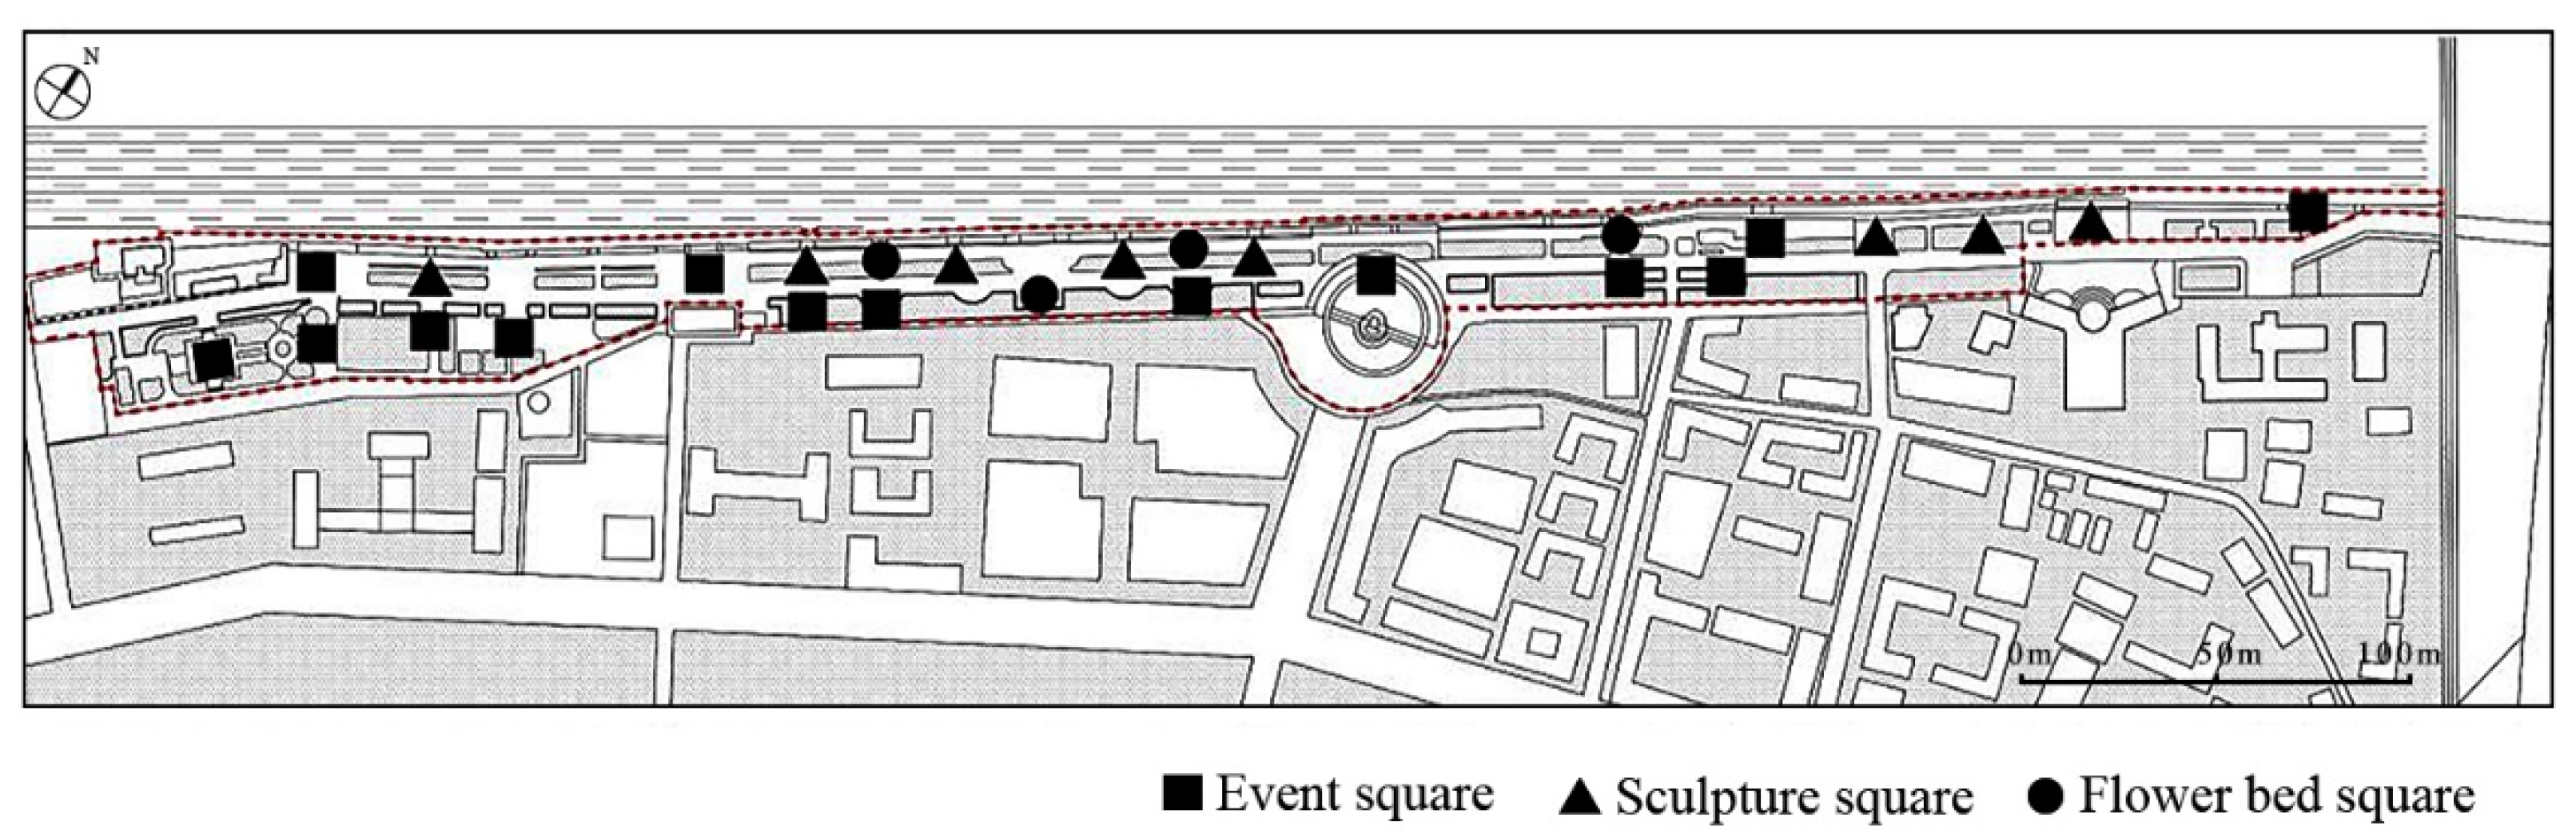
2.1. Location and Time
2.2. Selection of Evaluation Indexes
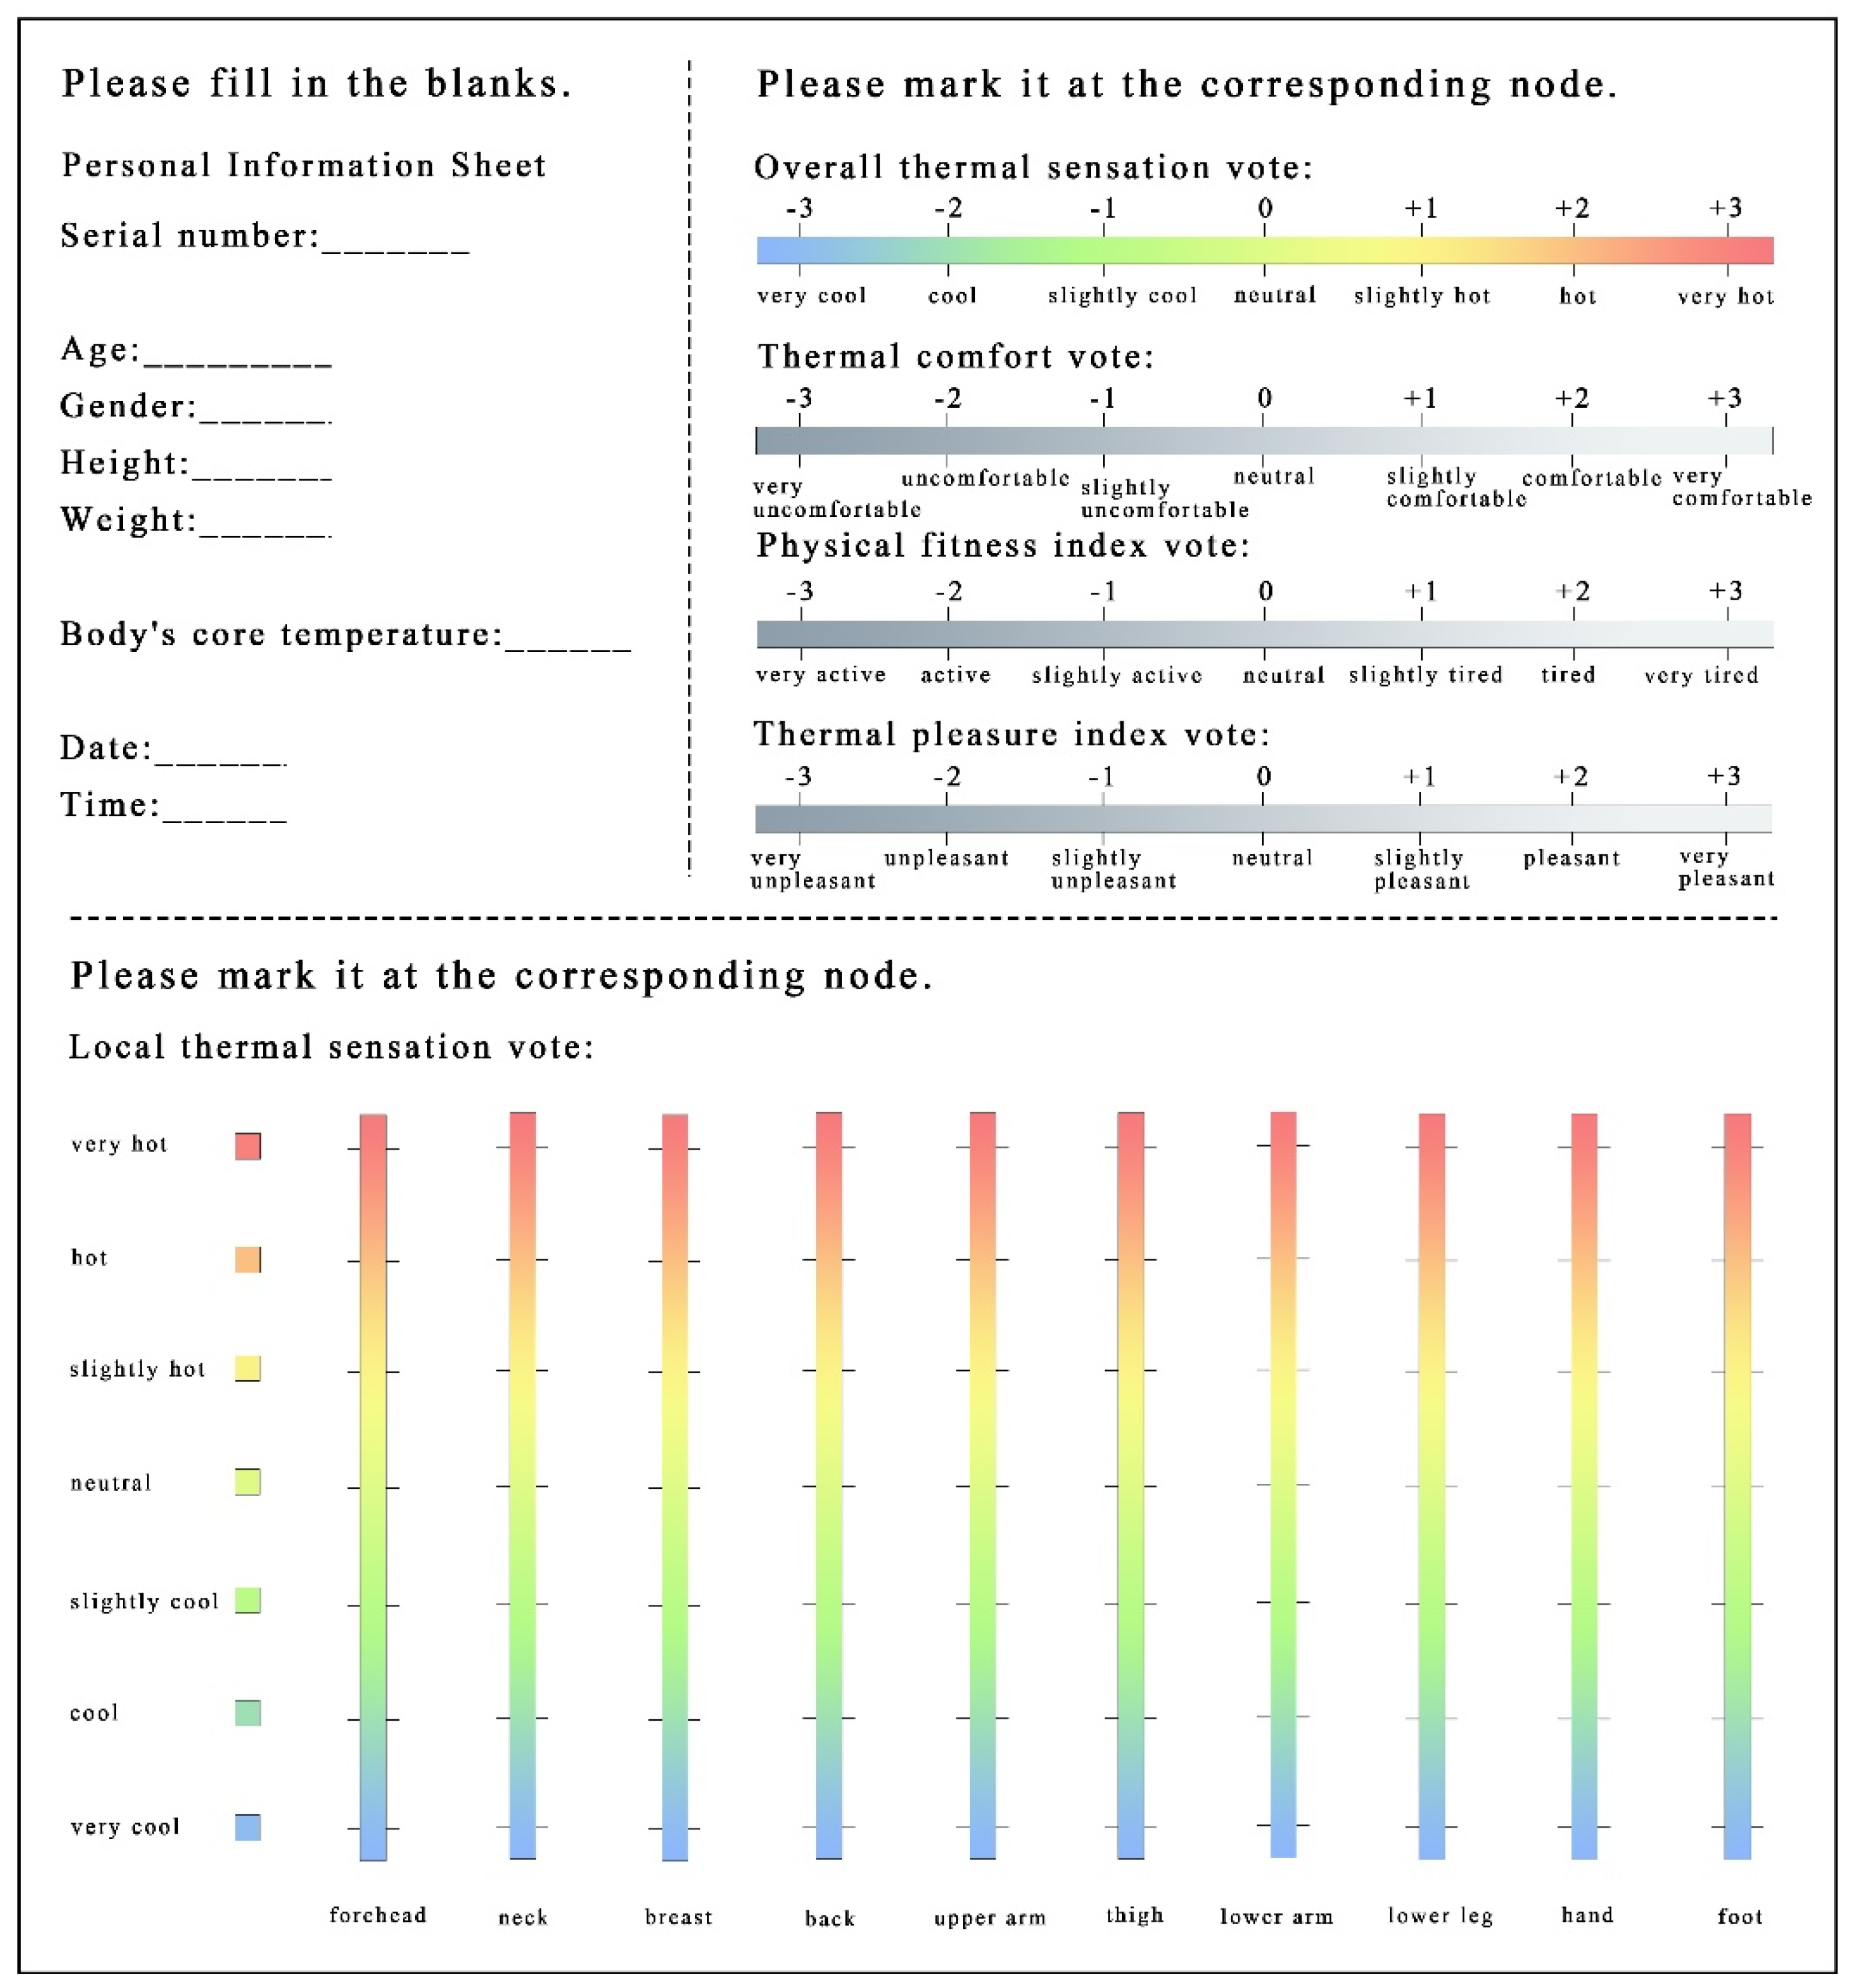
2.2.1. Outdoor Thermal Comfort Index
2.2.2. Thermal Pleasure
2.2.3. Fatigue Scale Vote
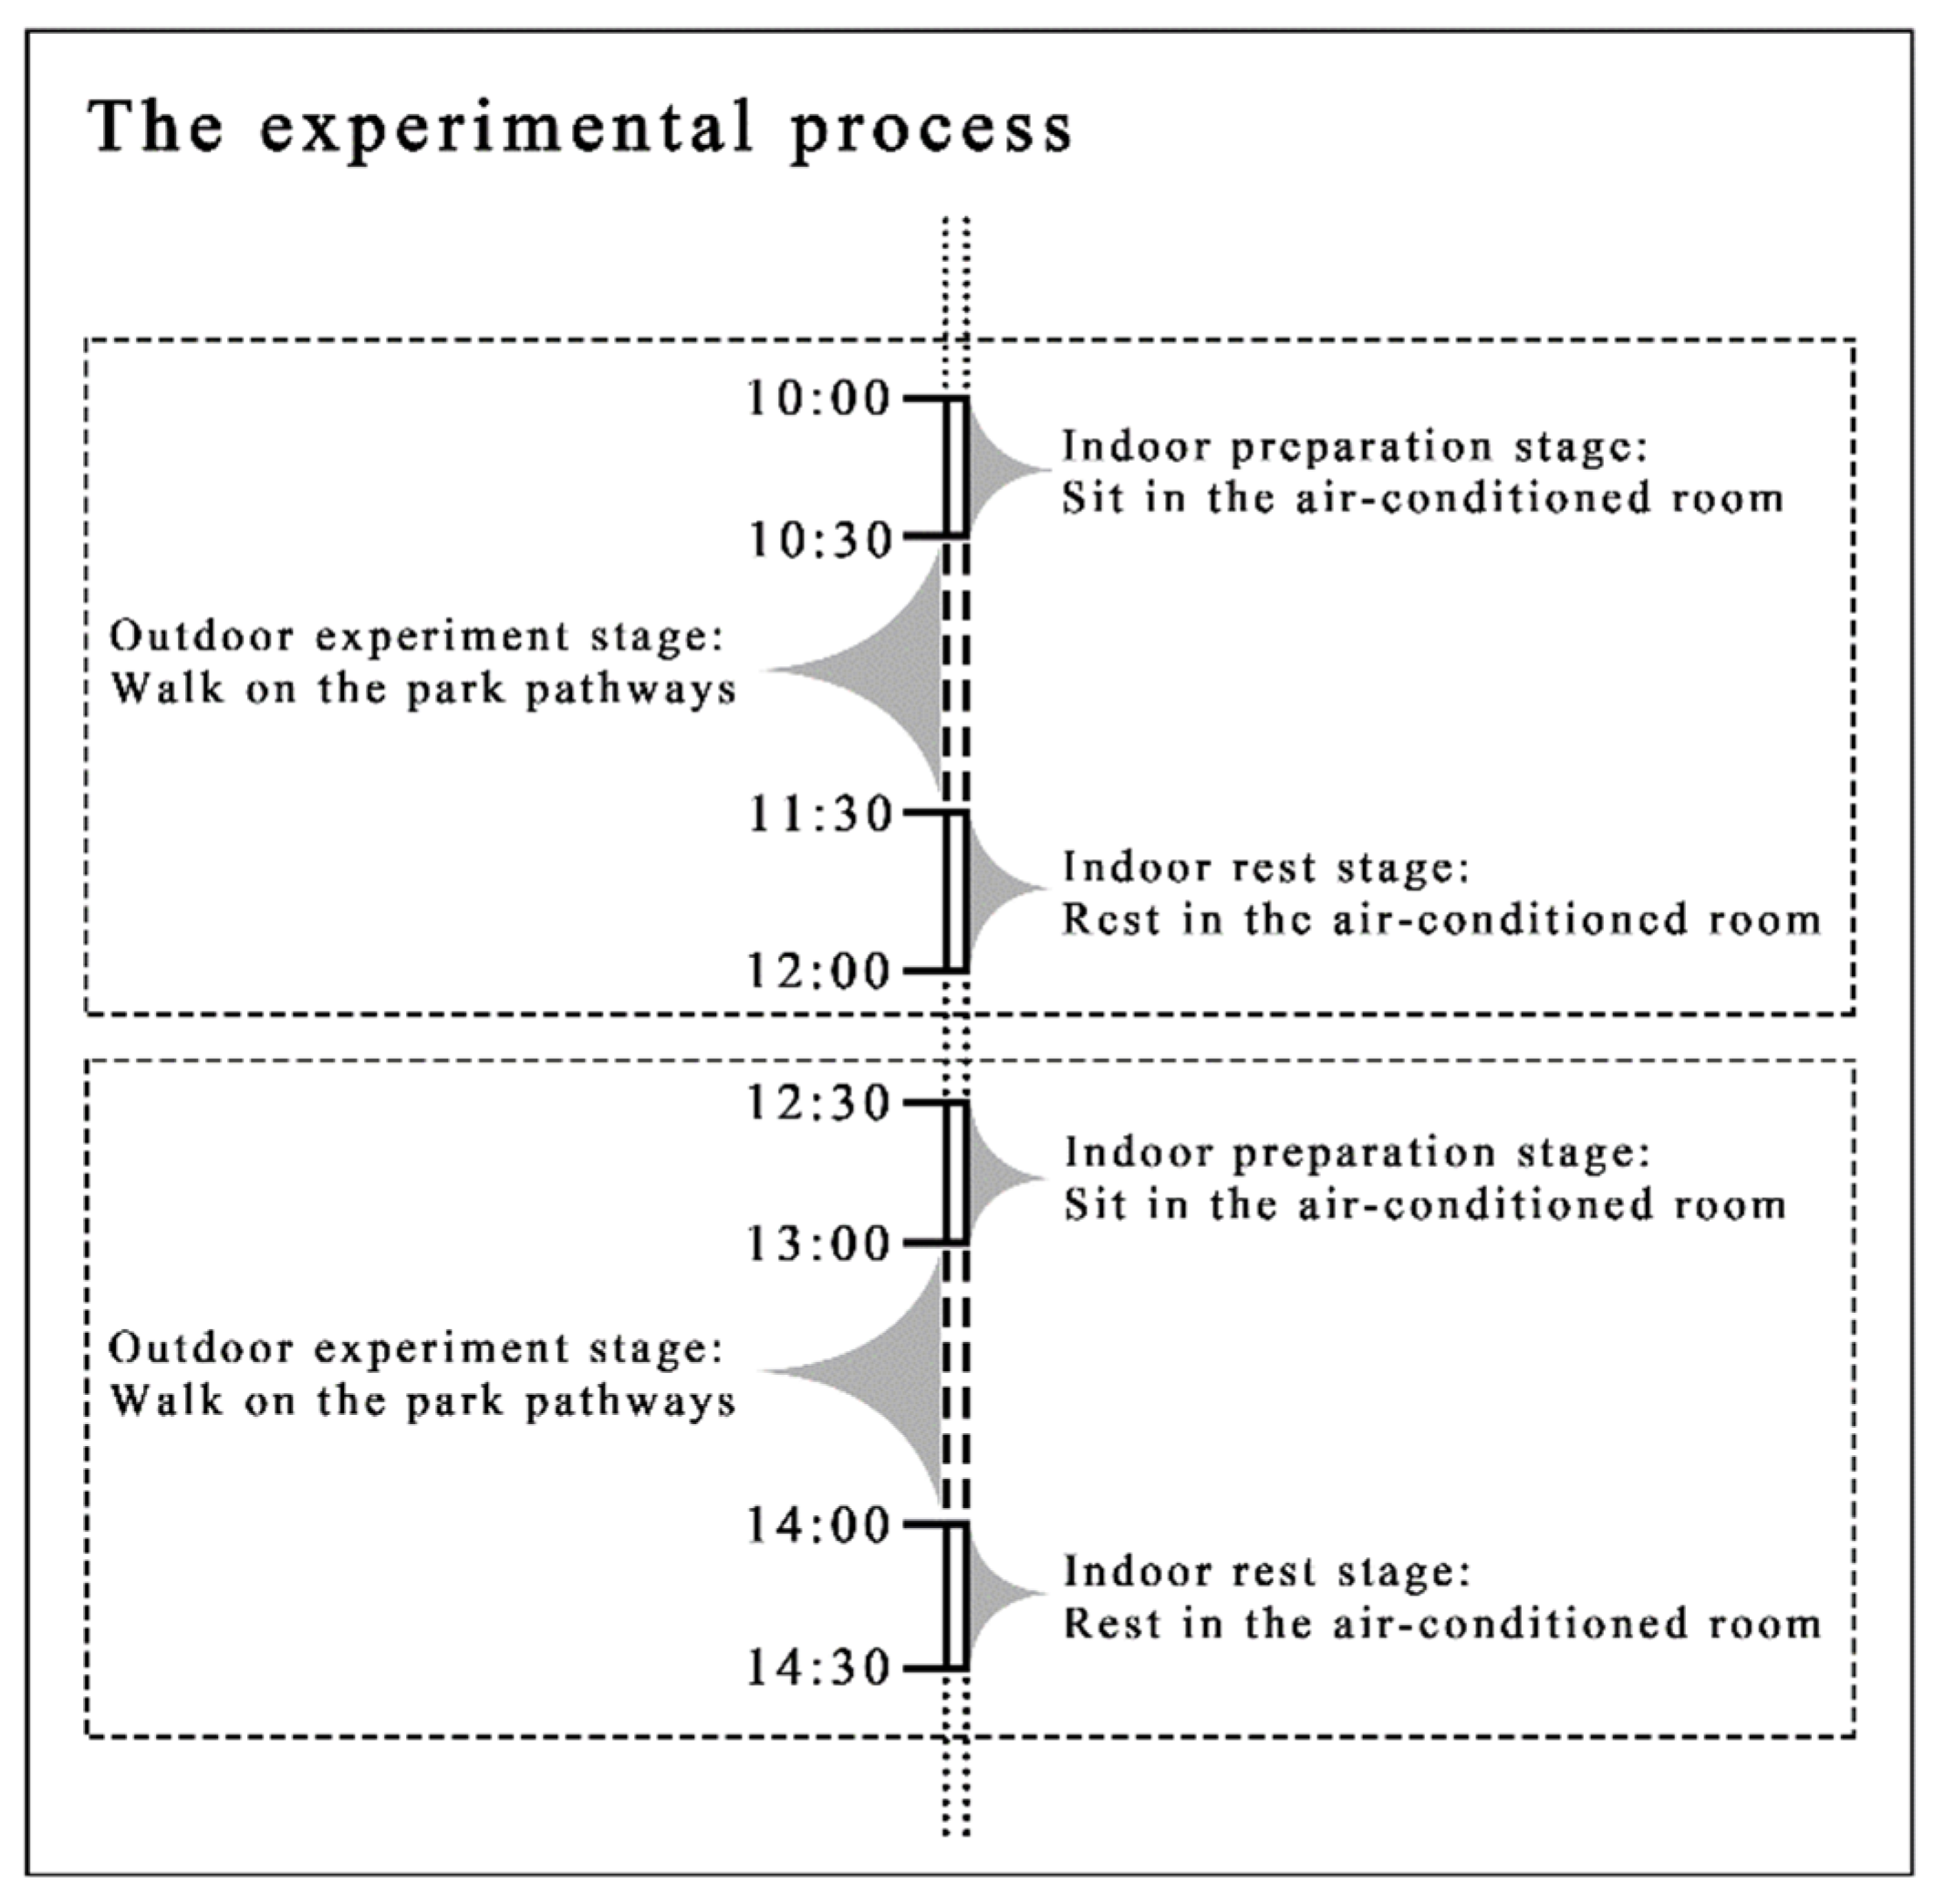
2.3. Introduction to the Experimental Process
- From 9:00 a.m. to 11:00 a.m.: the number of visitors begins to rise significantly.
- From 11:00 a.m. to 1:00 p.m.: the number of visitors remains stable or increases slightly.
- From 1:00 p.m. to 5:00 p.m.: the number of visitors increases significantly for the second time.
- Indoor preparation stage:
- 2.
- Outdoor experiment stage:
- 3.
- Indoor recovery stage:
2.4. Data Analysis
2.5. Statistical Test
3. Results
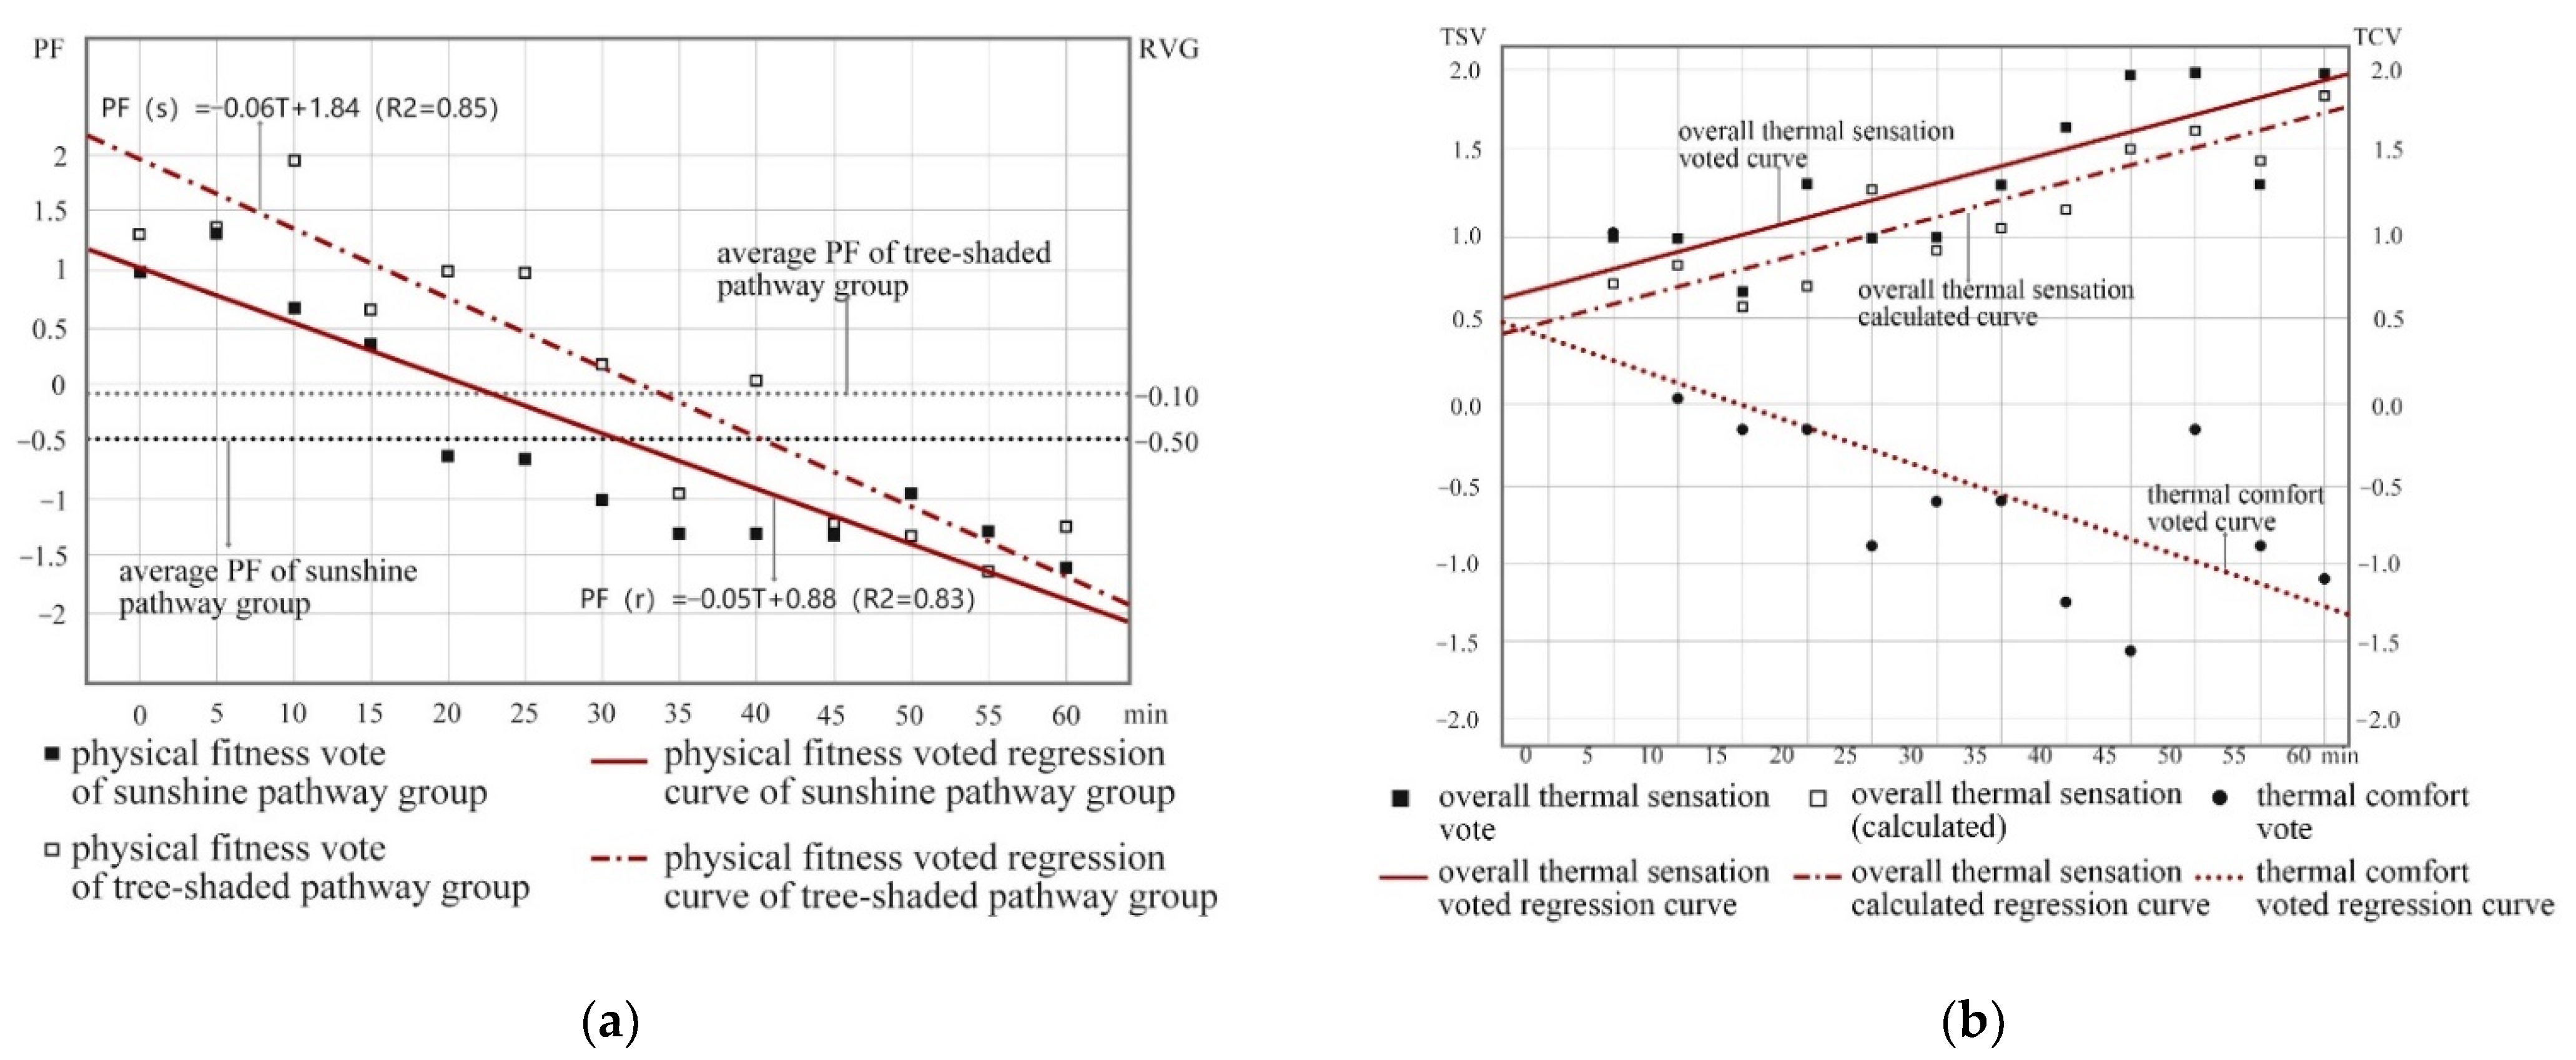
3.1. Overall Thermal Sensation and Thermal Comfort
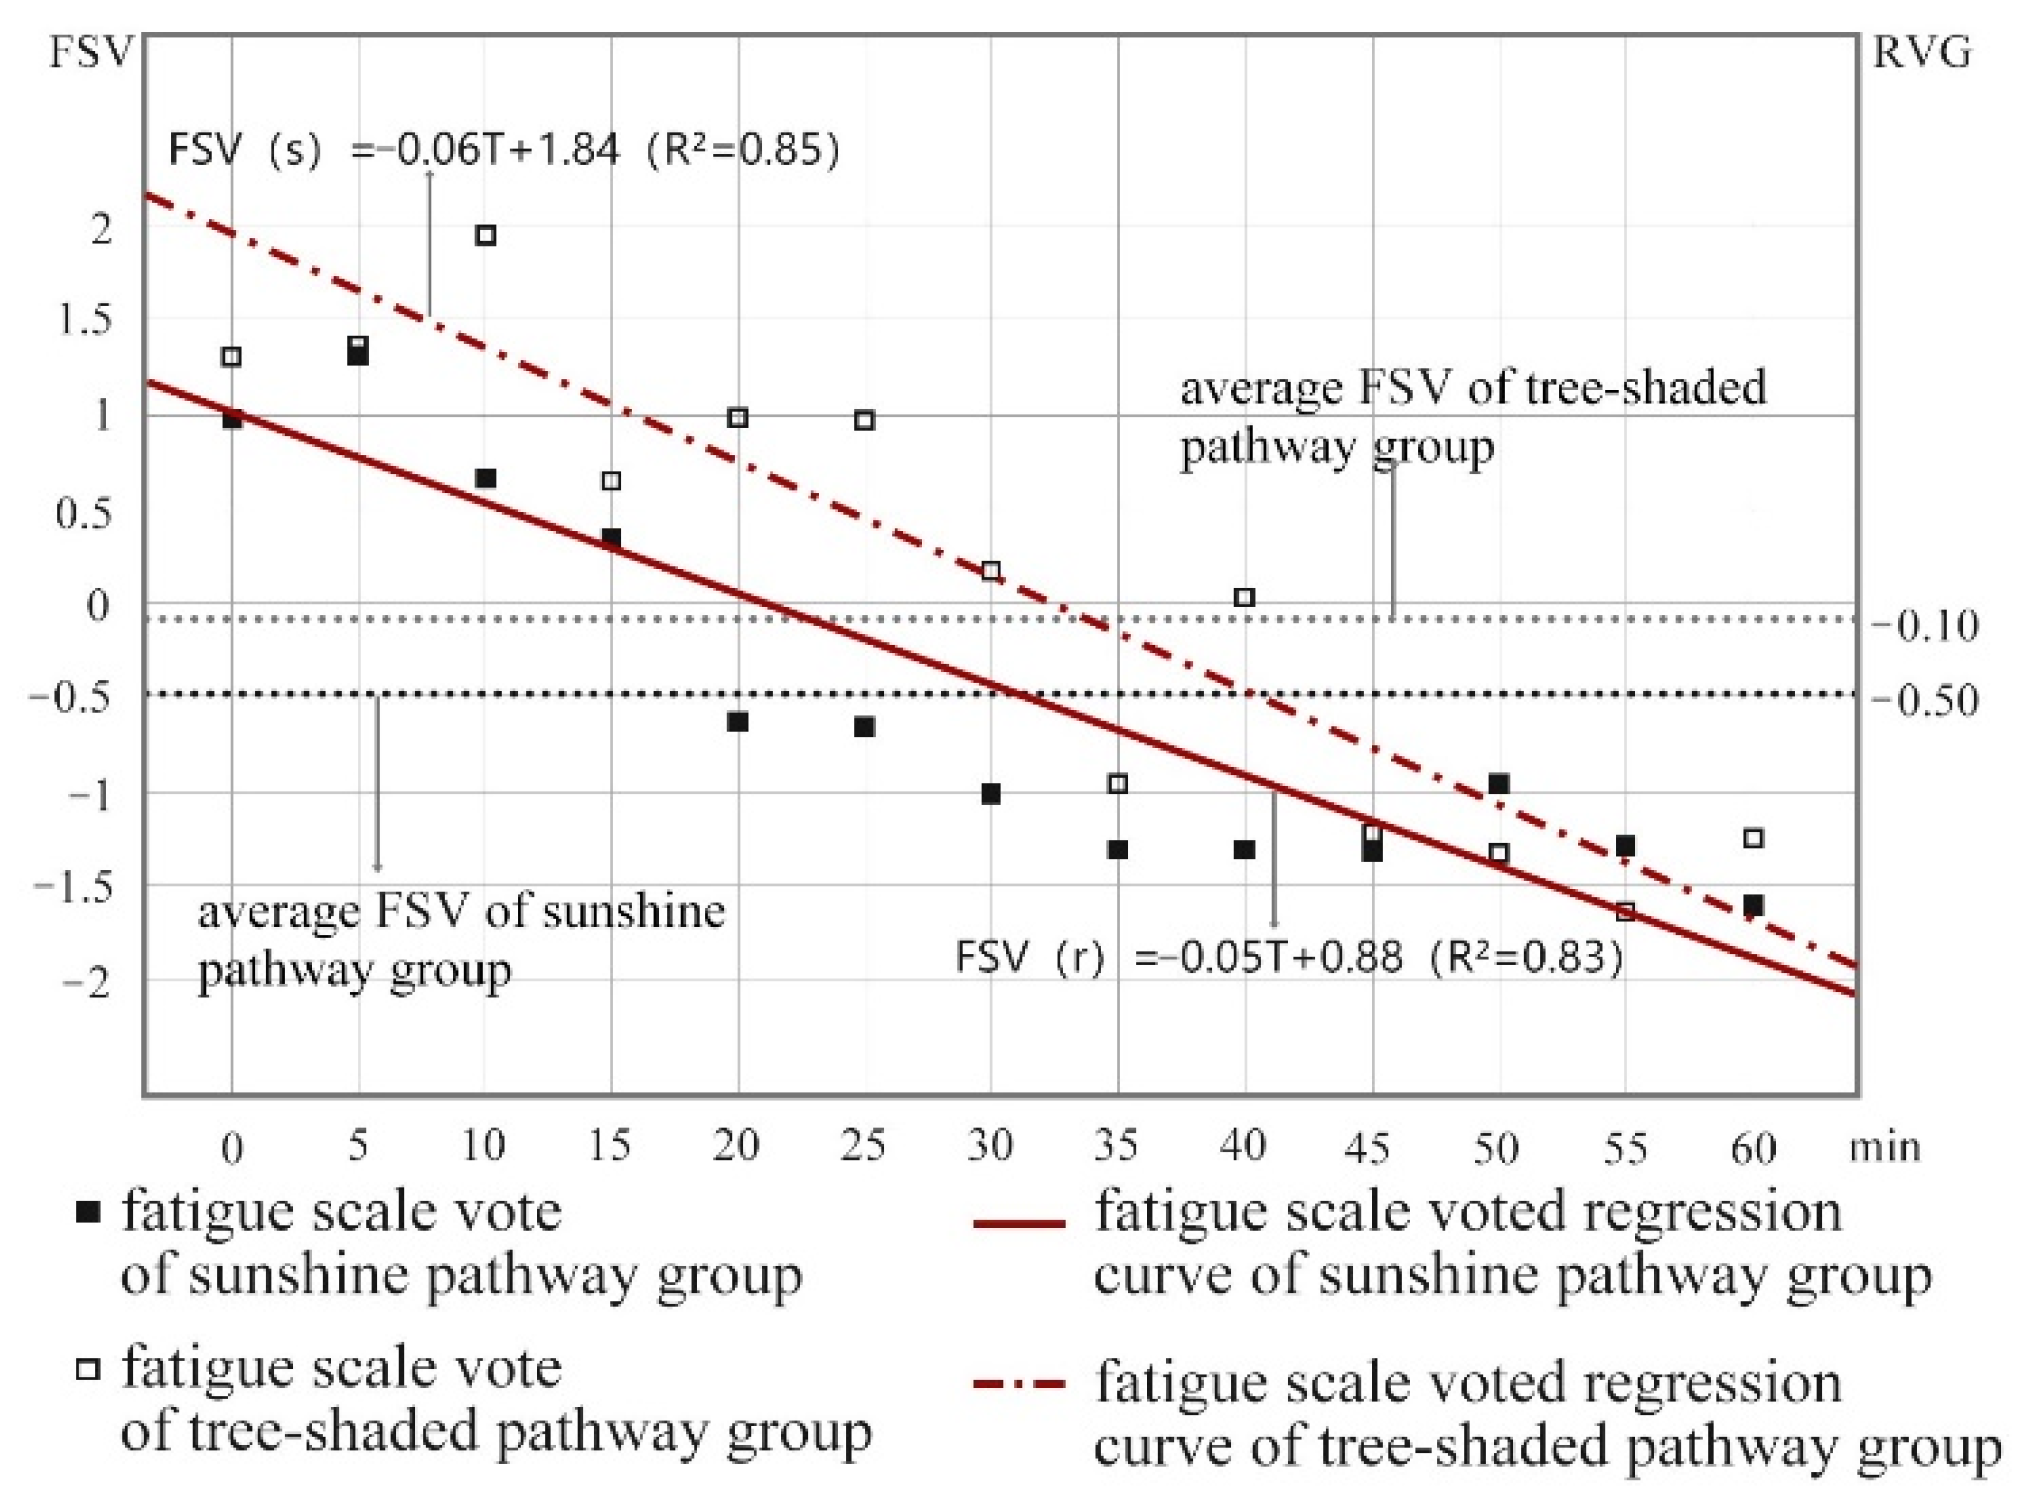
3.2. Fatigue Scale Vote
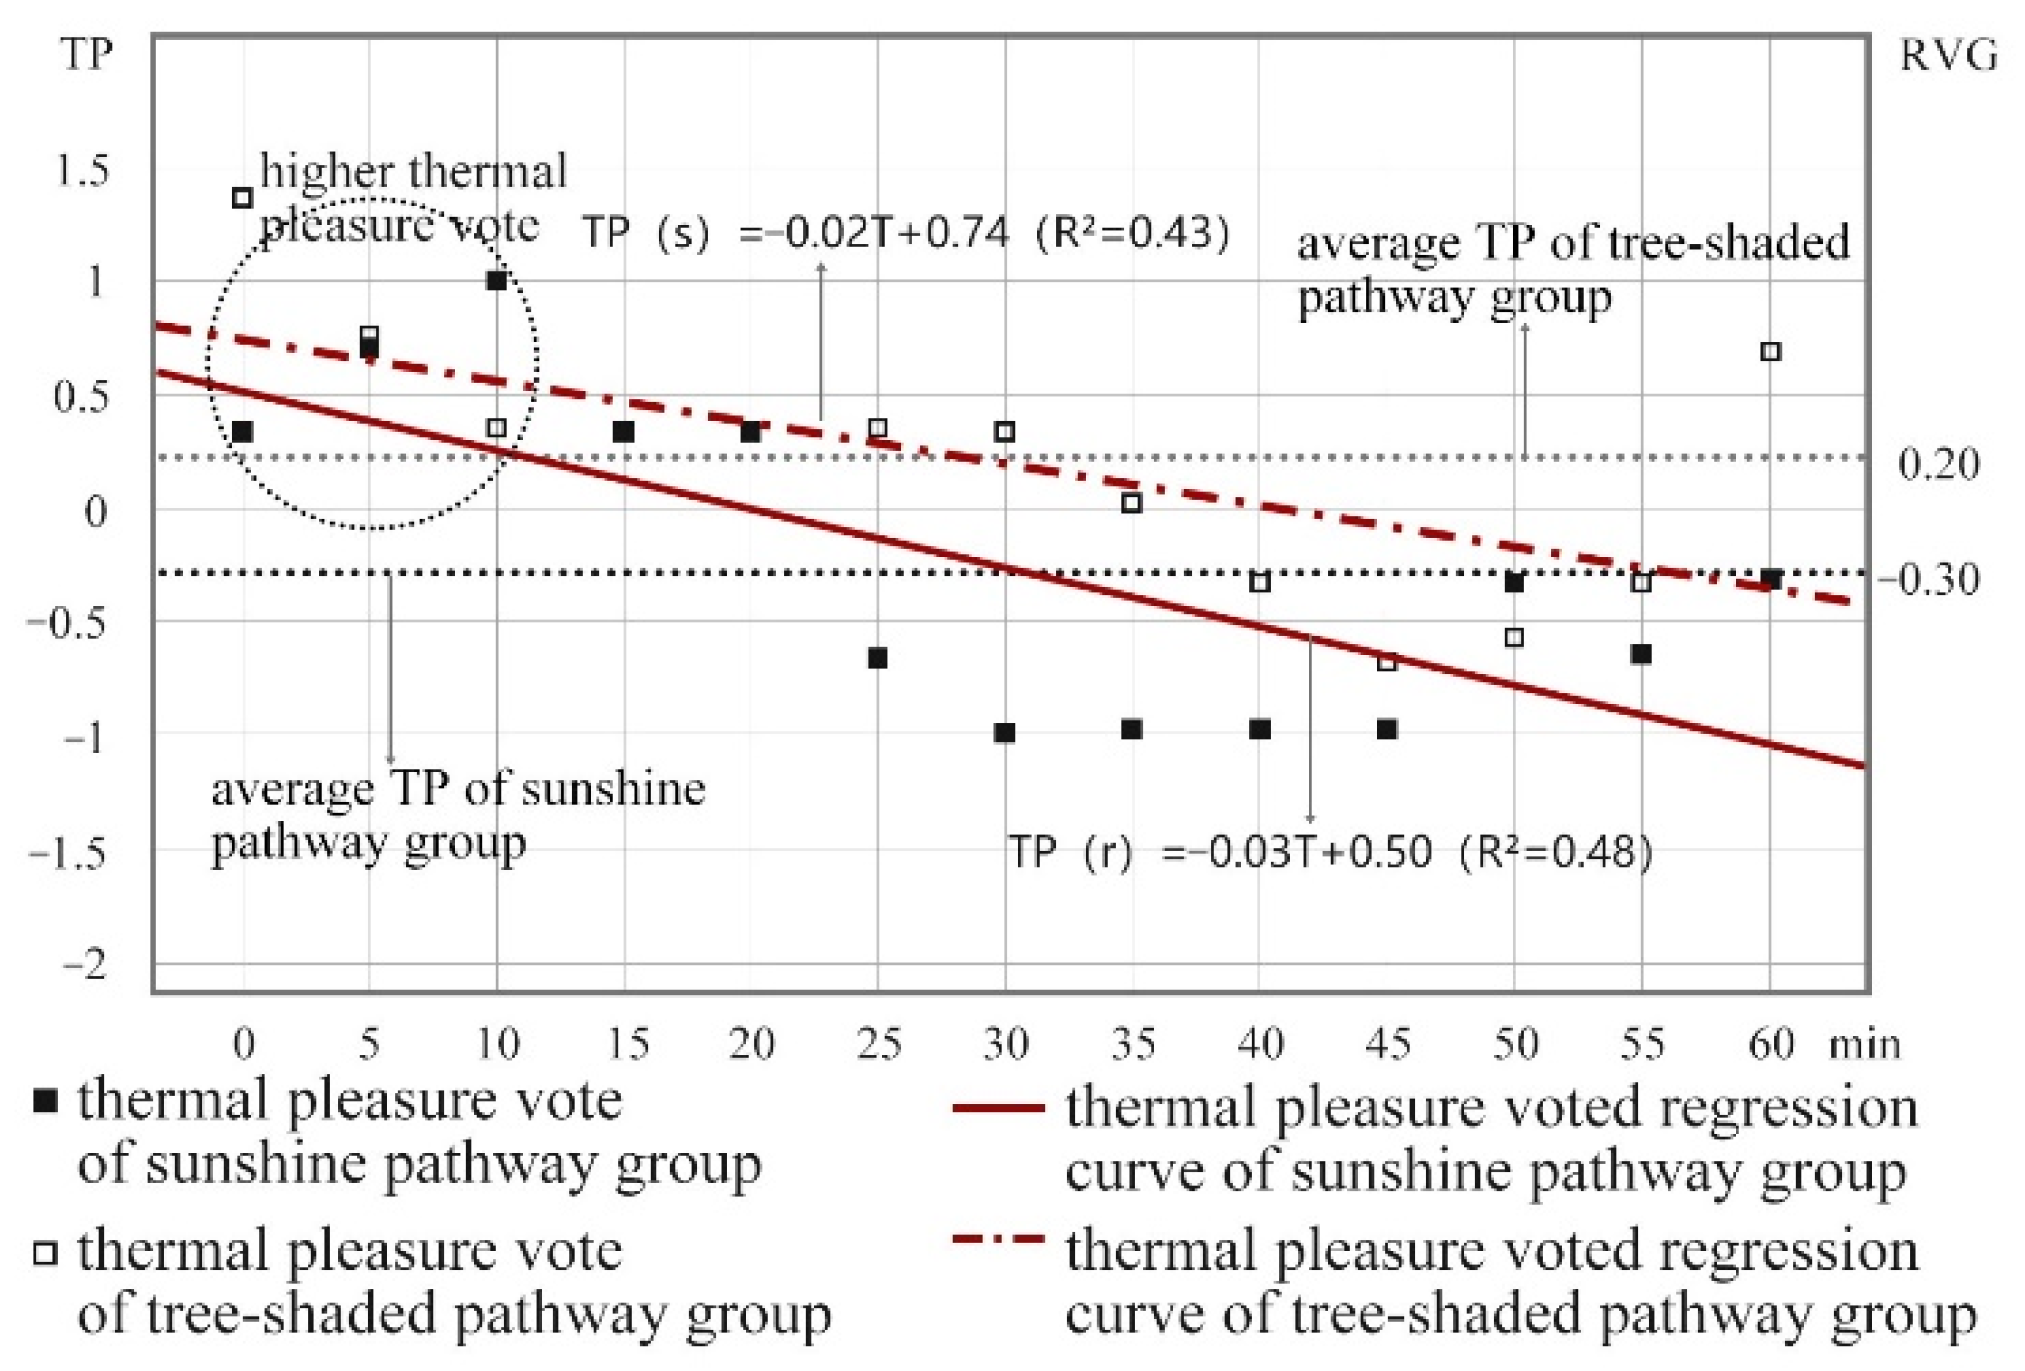
3.3. Thermal Pleasure
4. Discussion
4.1. Overall Thermal Sensation and Thermal Comfort
4.2. Fatigue Scale Vote
4.3. Thermal Pleasure
4.4. Limitation
5. Conclusions
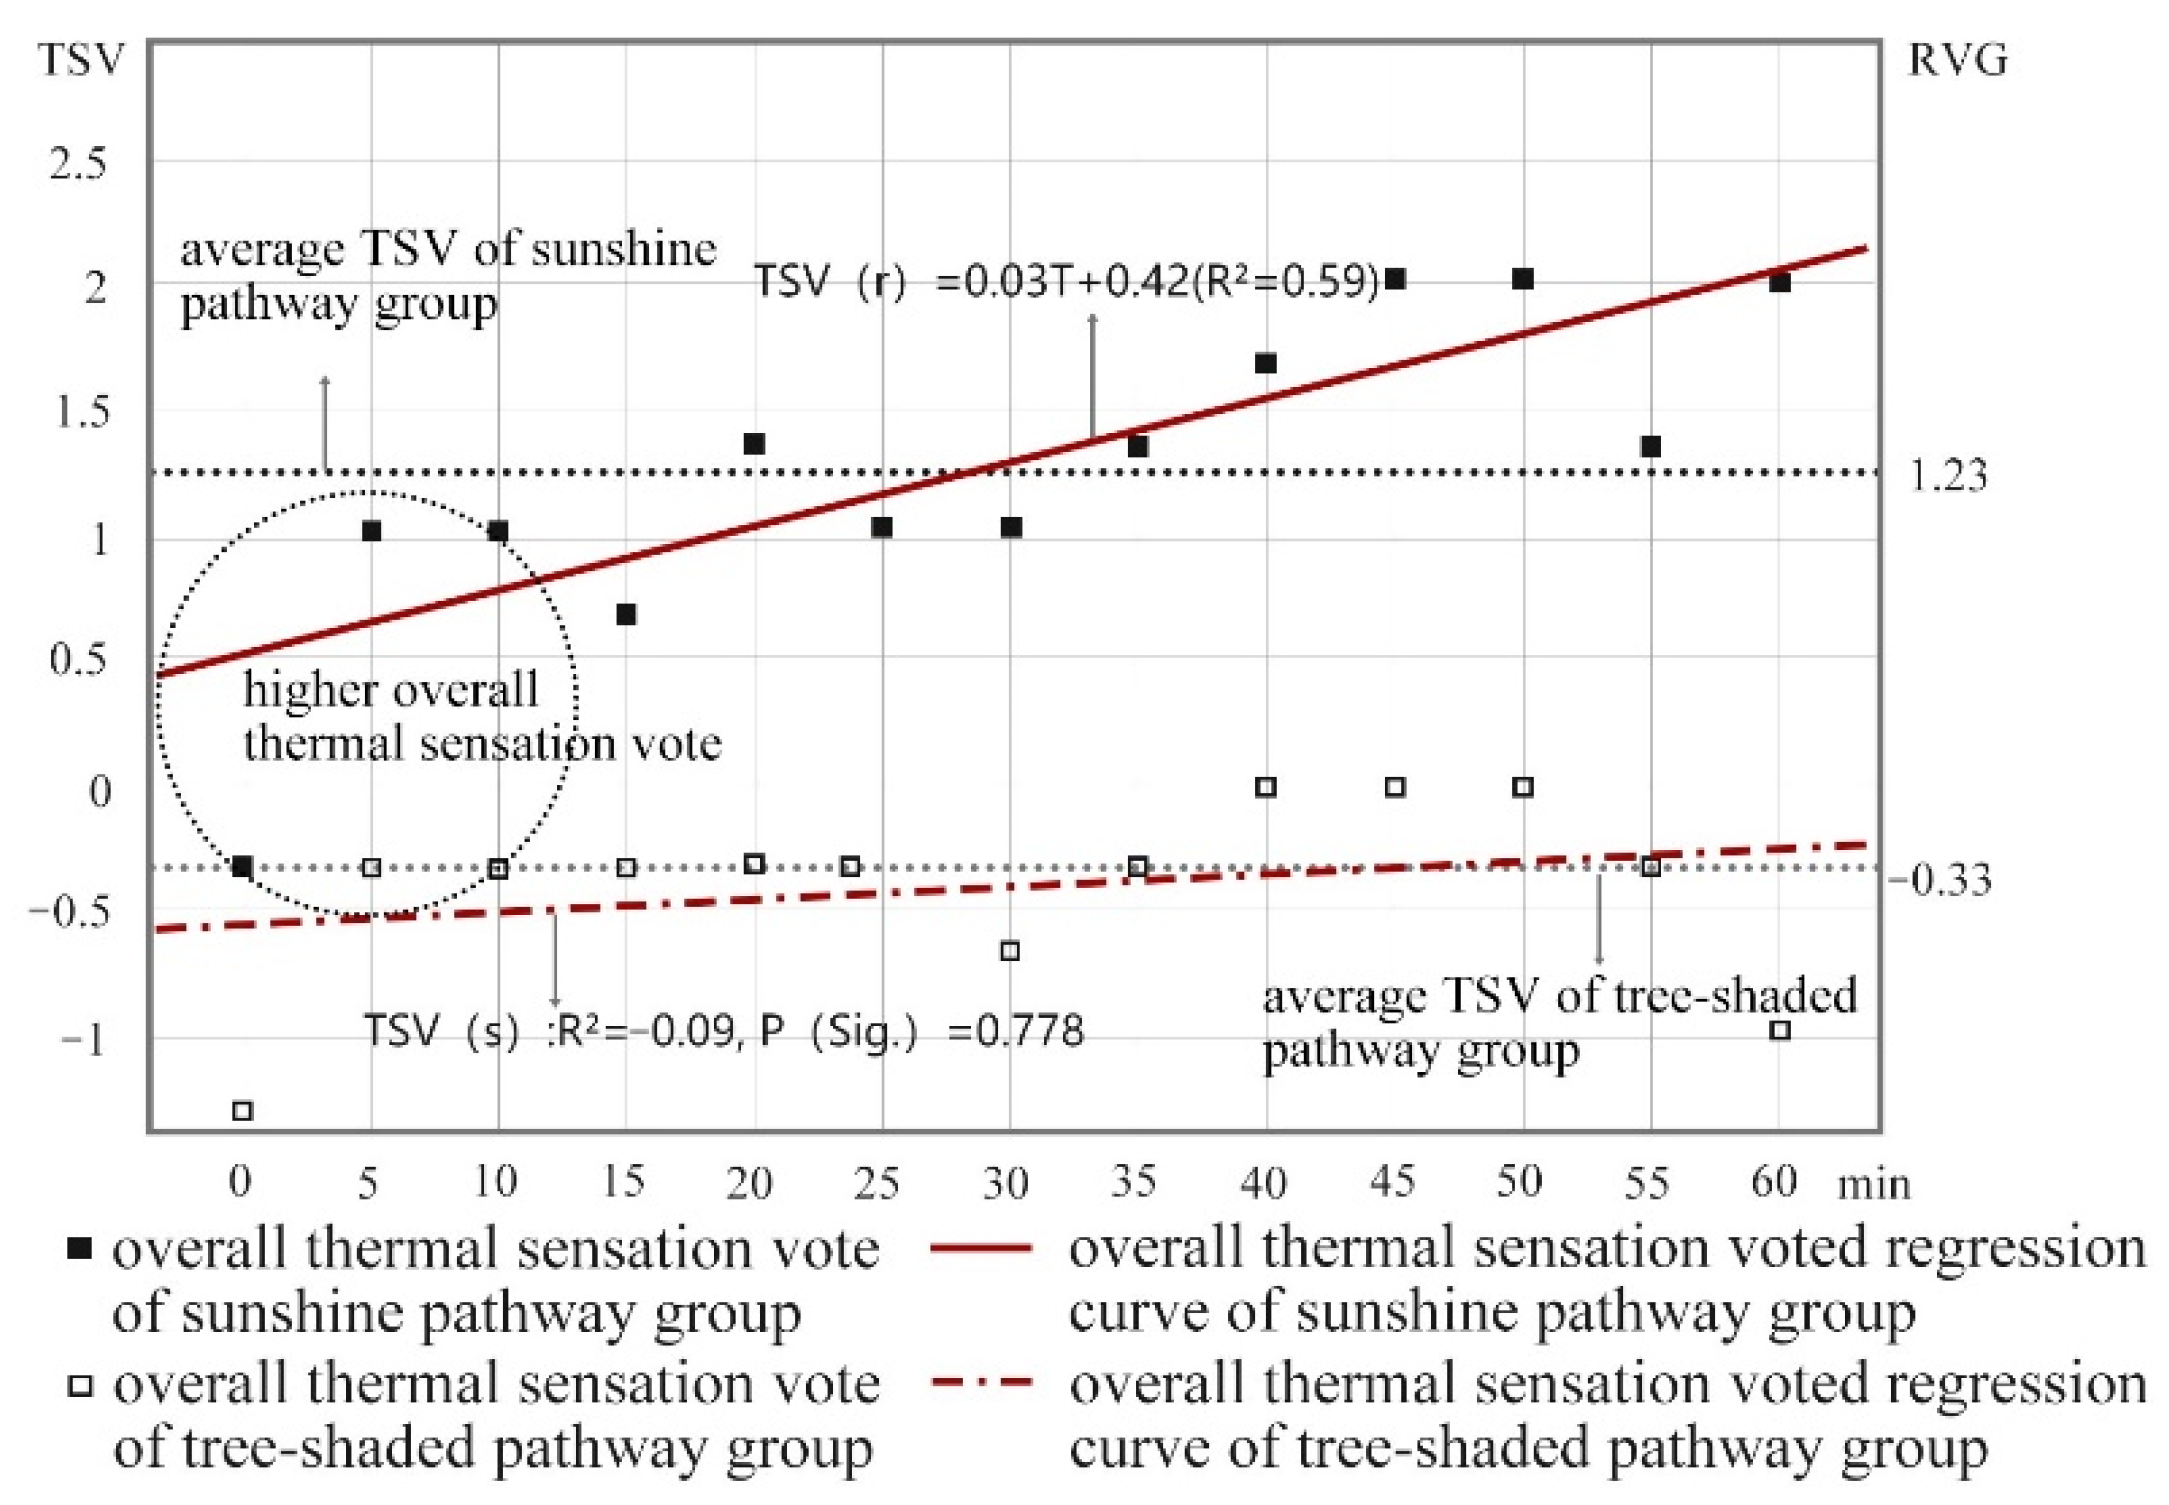
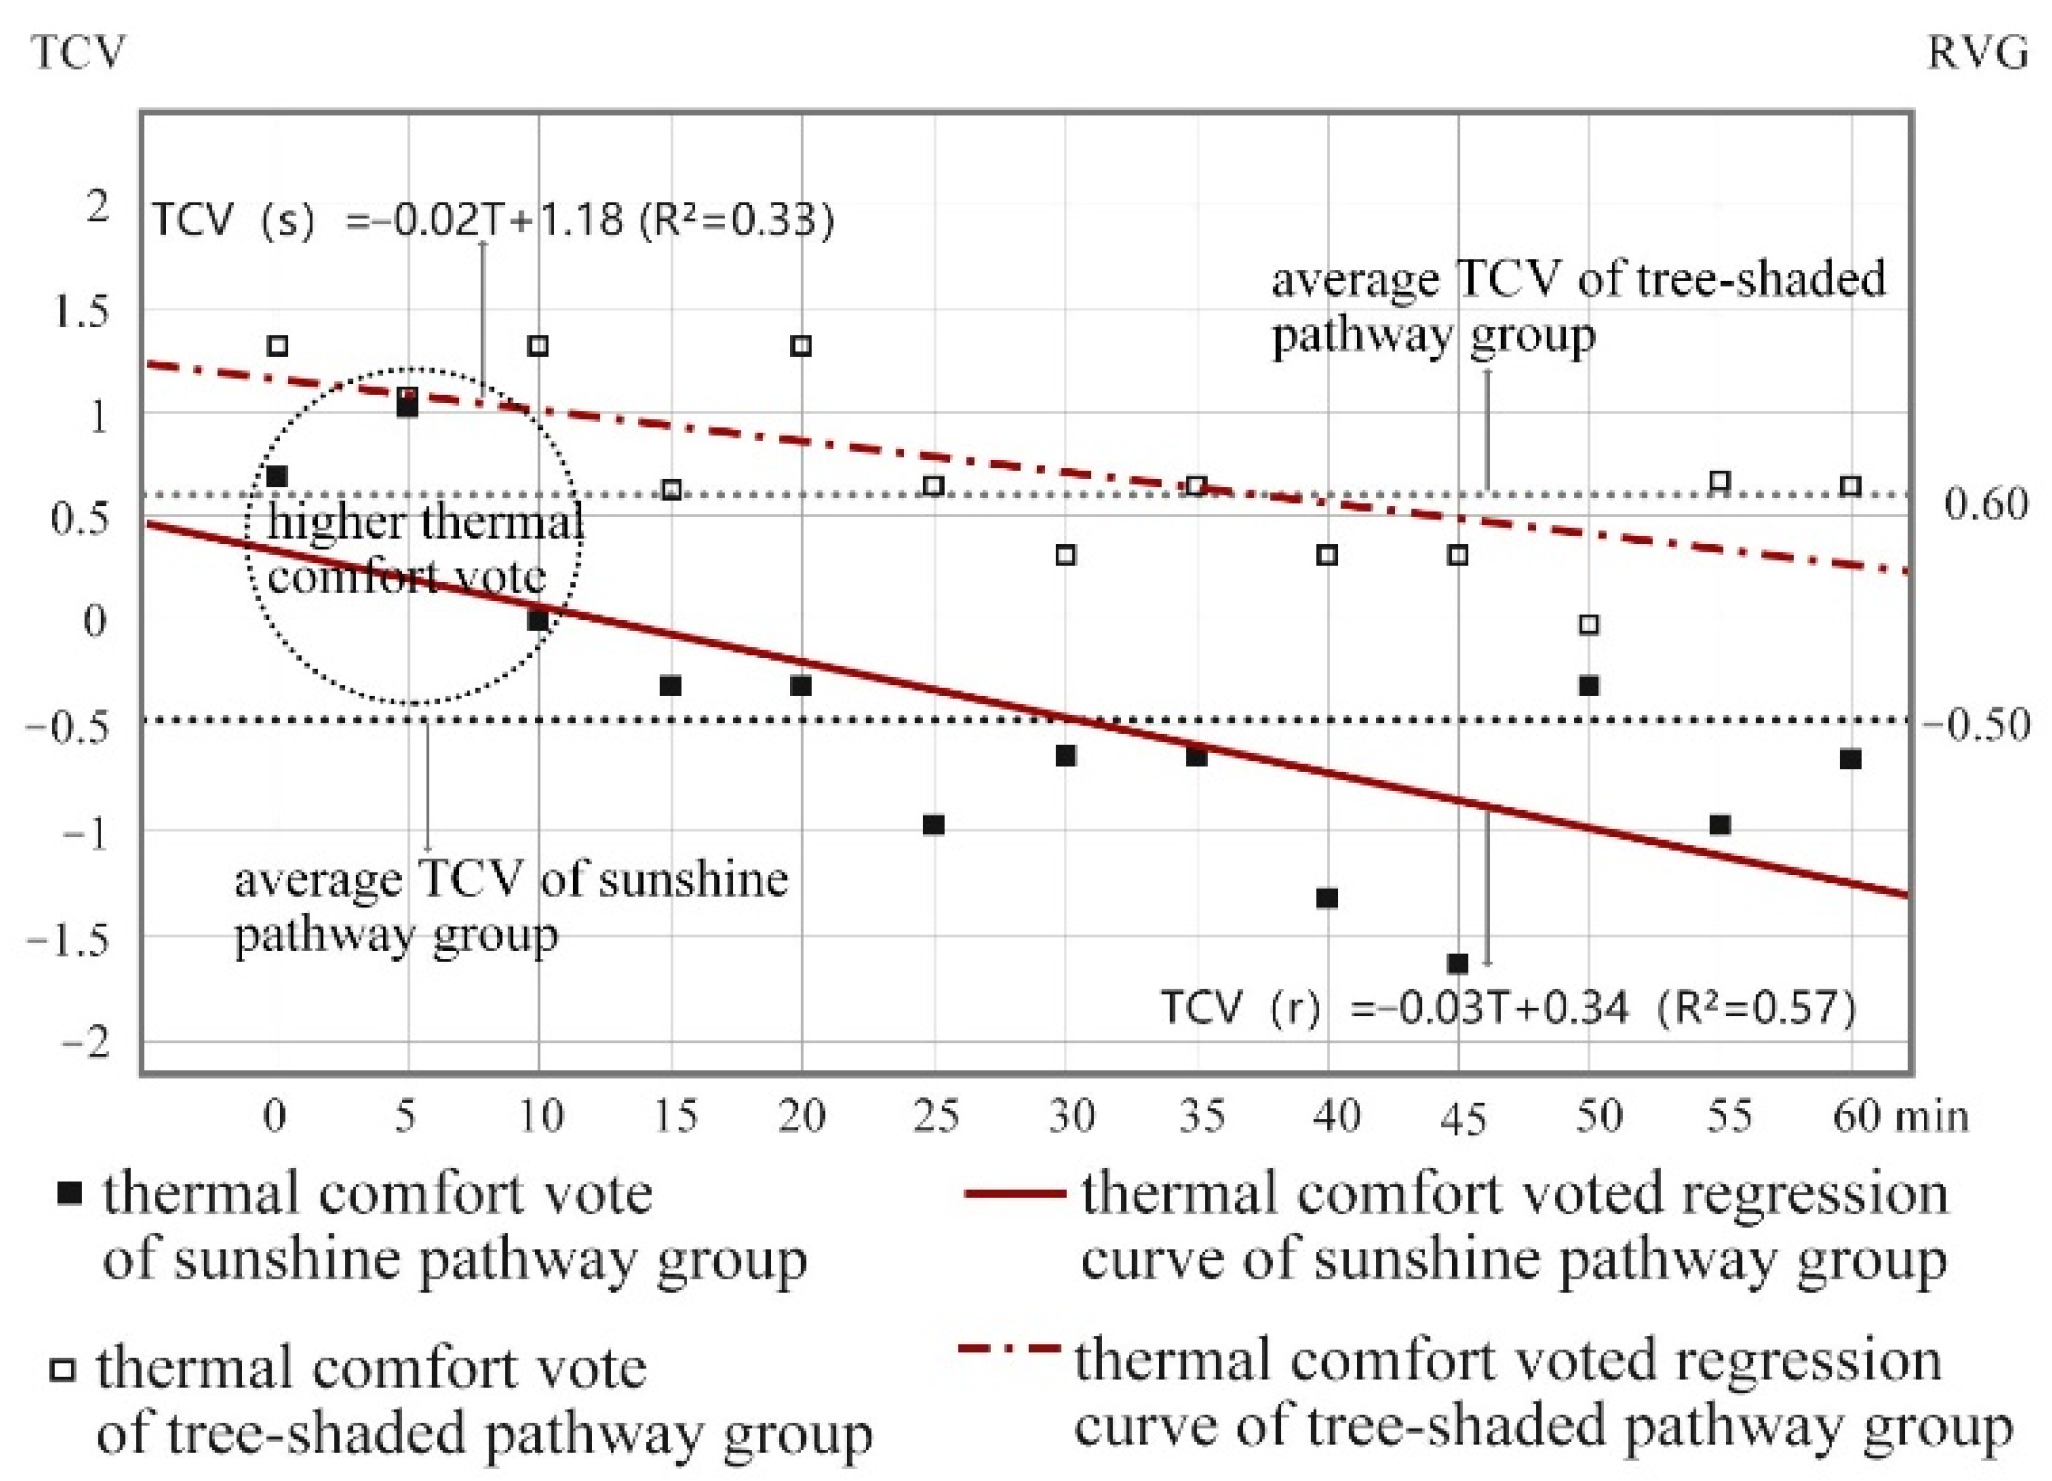
- At the very beginning (about 10 min), although the thermal sensation of the sunshine pathway group was higher than that of the tree-shaded pathway group, people still voted for higher thermal comfort and thermal pleasure when walking on the sunshine pathway, which indicated that thermal comfort not only relates to thermal sensation but also the whole environment. In this case, the waterfront view should improve people’s general feelings, including thermal comfort.
- Comparing the voted overall thermal sensation and overall thermal sensation calculated by local thermal sensations, it was found that the two results fitted well with each other in the sunshine pathway group but the voted overall thermal sensation in the tree-shaded pathway group was much lower than the calculated result. This result showed that people’s overall thermal sensation is not only influenced by both local thermal sensation and the physical environmental influencing factors, but is also influenced by the environment design. As thermal sensation is people’s subjective response to the environment, the diversified landscape on the tree-shaded pathway led to lower thermal sensations.
- Compared with the sunshine pathway, the tree-shaded pathway led to lower thermal sensations, lower fatigue scale vote, higher thermal comfort, and higher thermal pleasure.
- The average thermal sensation of the tree-shaded pathway group was −0.33, which was 1.56 lower than that of the sunshine pathway group;
- The average thermal comfort of the tree-shaded pathway group was 0.6, which was 1.1 higher than that of the sunshine pathway group;
- The average fatigue scale vote of the tree-shaded pathway group was −0.1, which was 0.6 higher than that of the sunshine pathway group;
- The average thermal pleasure of the tree-shaded pathway group was 0.2, which was 0.5 higher than that of the sunshine pathway group.
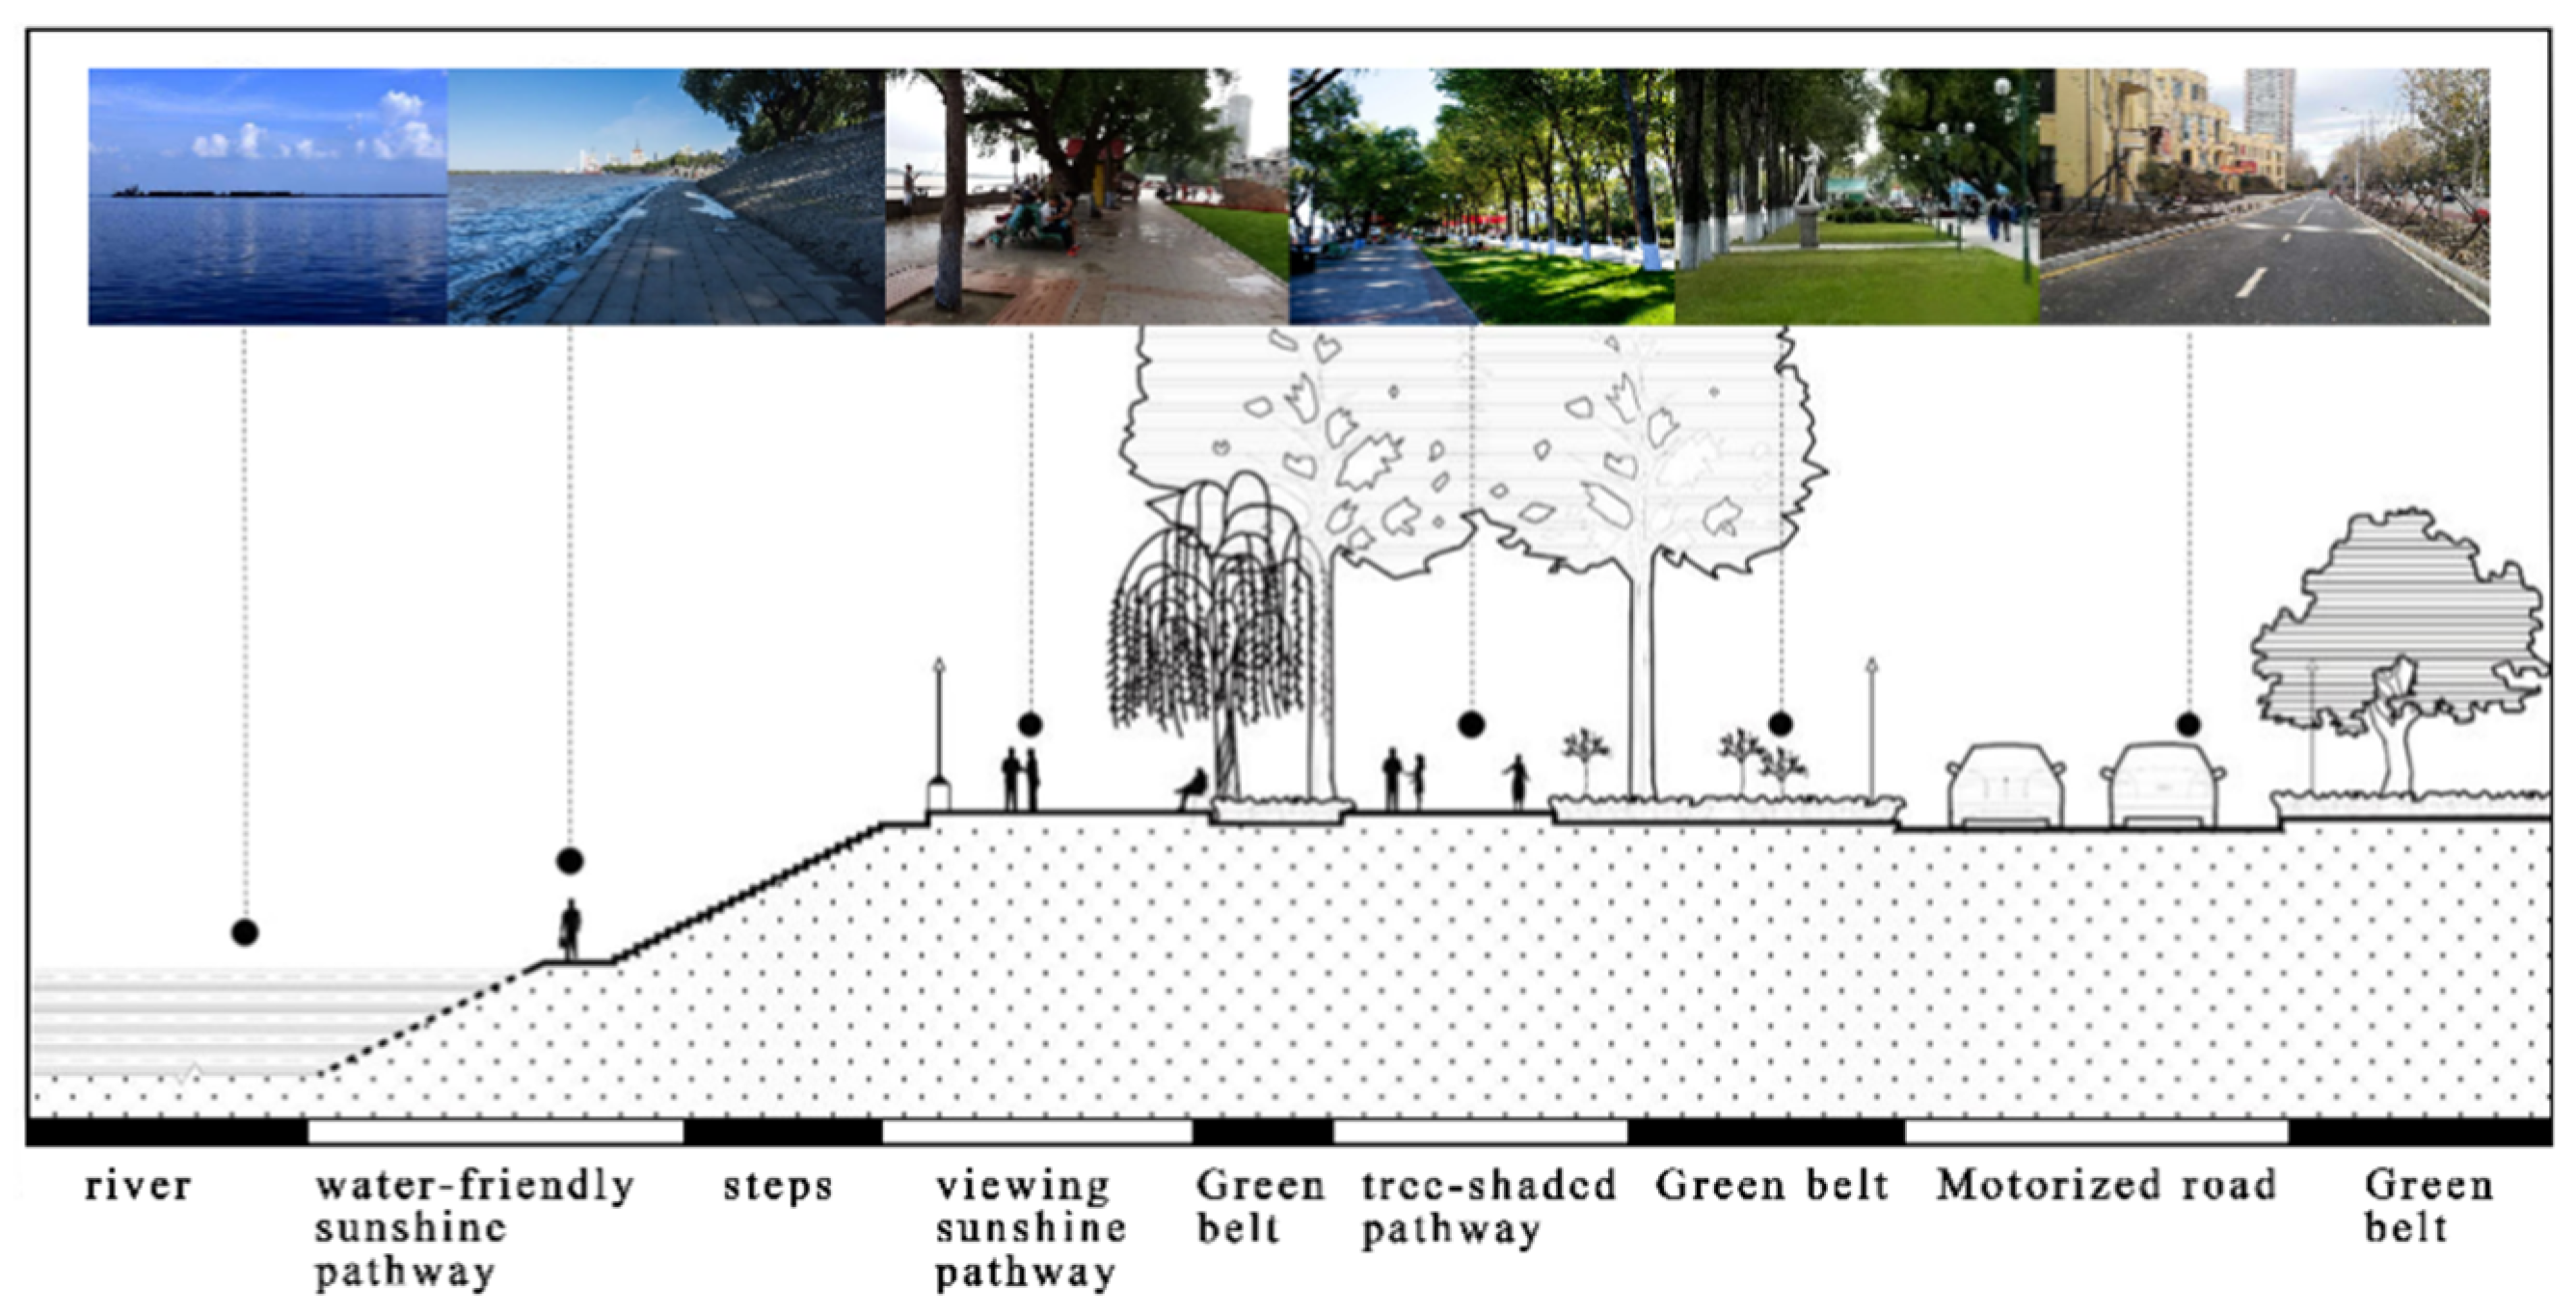
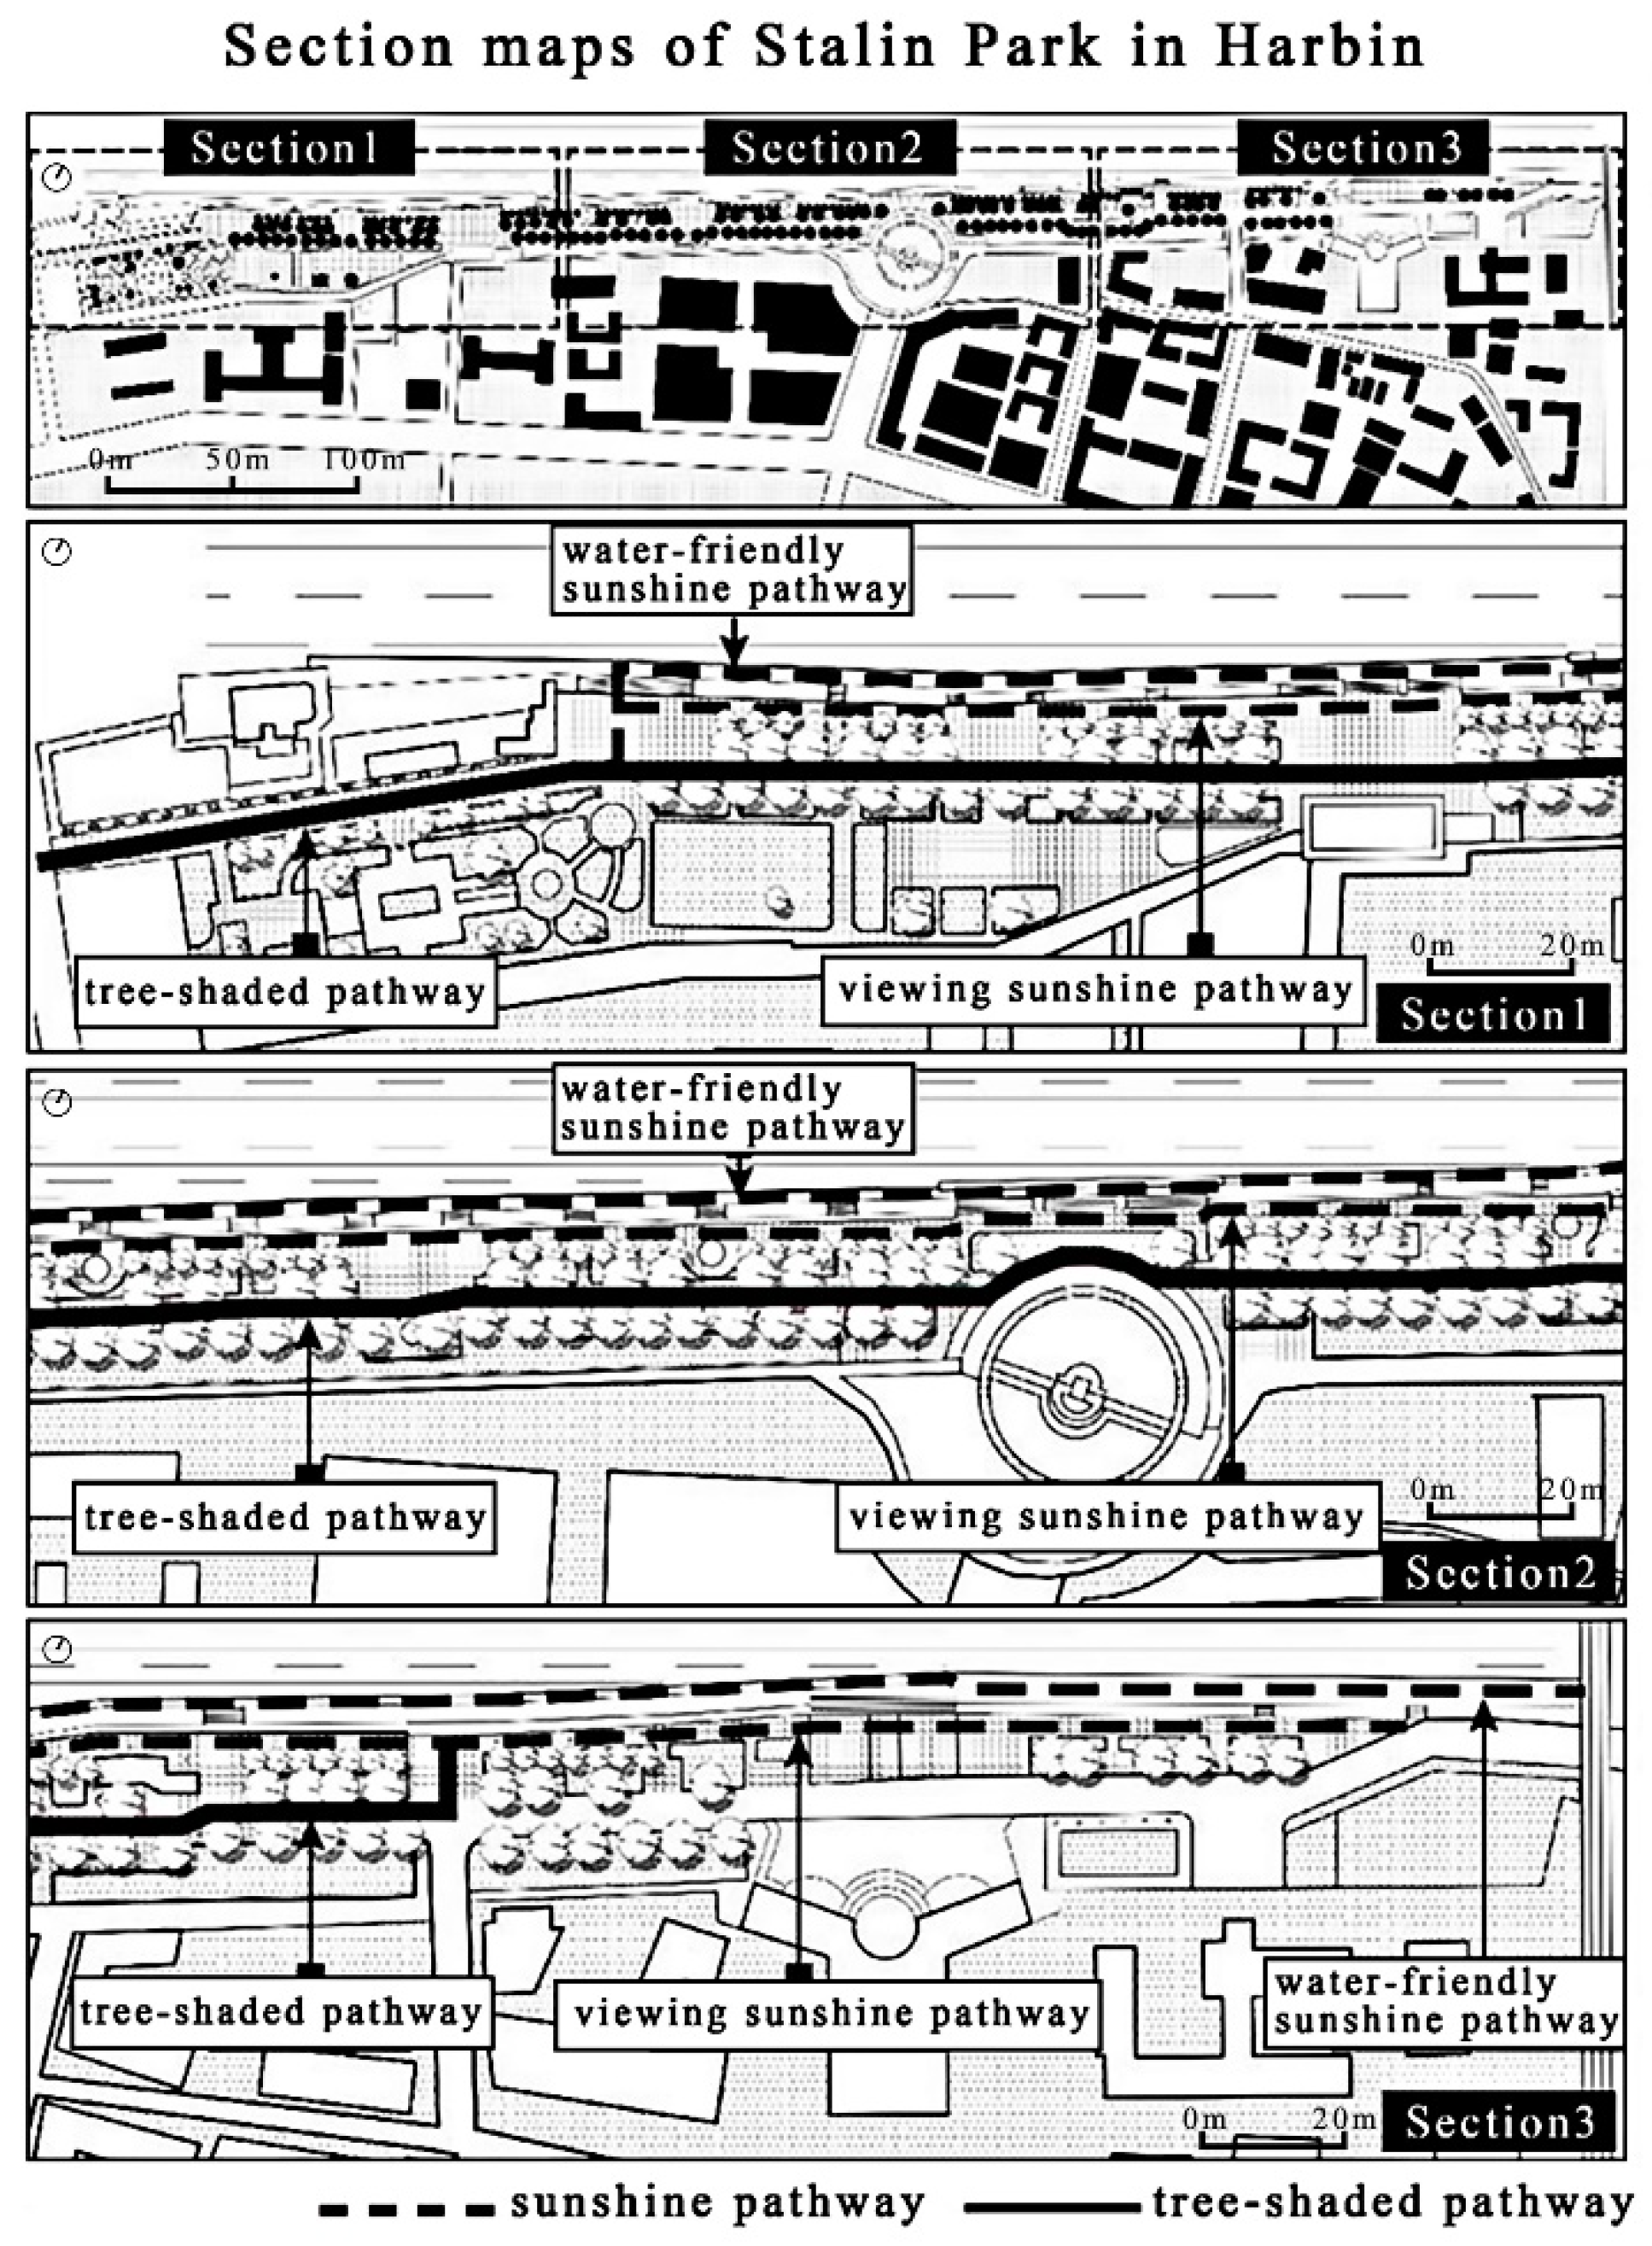
- According to the results, some suggestions were provided for the pathway design to improve people’s subjective response to the environment. The shaded device of the sunshine pathway should be implemented at 15-min-walk intervals, or accessible ways to the tree-shaded pathway should be designed. The rest facilities should be designed according to a 30-min walking distance on the tree-shaded pathway and a 20-min walking distance on the sunshine pathway. Diversified landscape should be designed for both the tree-shaded pathway and sunshine pathway, which could improve people’s outdoor thermal comfort and the general subjective response to the environment. The mechanism of how visible design influences people’s thermal comfort and fatigue has not been revealed in this study, and only the phenomena was detected; to make a further step for this, a method that enables those design factors to be measured and analyzed is necessary [58].
Supplementary Materials
Author Contributions
Funding
Institutional Review Board Statement
Informed Consent Statement
Data Availability Statement
Conflicts of Interest
References
- Siddique, S.; Uddin, M.M. Green space dynamics in response to rapid urbanization: Patterns, transformations and topographic influence in Chattogram city, Bangladesh. Land Use Policy 2022, 114, 105974. [Google Scholar] [CrossRef]
- Population Reference Bureau (PRB): 213 Lantana Road, Westland Nairobi, Kenya. Available online: https://www.prb.org/news/population-of-older-adults-increasing-globally/ (accessed on 10 July 2020).
- Zhao, Z.; Pan, Y.; Zhu, J.; Wu, J.; Zhu, R. The Impact of Urbanization on the Delivery of Public Service-Related SDGs in China. Sustain. Cities Soc. 2022, 80, 103776. [Google Scholar] [CrossRef]
- Peng, Y.; Feng, T.; Timmermans, H. A path analysis of outdoor comfort in urban public spaces. Build. Environ. 2019, 148, 459–467. [Google Scholar] [CrossRef]
- Ahmed, K.S. Comfort in urban spaces: Defining the boundaries of outdoor thermal comfort for the tropical urban environments. Energy Build. 2003, 35, 103–110. [Google Scholar] [CrossRef]
- Zhu, W.; Wang, J.; Qin, B. Quantity or quality? Exploring the association between public open space and mental health in urban China. Landsc. Urban Plan. 2021, 213, 104128. [Google Scholar] [CrossRef]
- Triguero-Mas, M.; Dadvand, P.; Cirach, M.; Martmanez, D.; Medina, A.; Mompart, A.; Basagaa, X.; Grauleviien, R.; Nieuwenhuijsen, M.J. Natural outdoor environments and mental and physical health: Relationships and mechanisms. Environ. Int. 2015, 77, 35–41. [Google Scholar] [CrossRef] [Green Version]
- Vučković, D.; Jovic, S.; Bozovic, R.; Dżamić, V.; Kićović, D. Potential of neuro-fuzzy methodology for forecasting of outdoor thermal comfort index at urban open spaces. Urban Clim. 2019, 28, 100467. [Google Scholar] [CrossRef]
- Lai, D.; Lian, Z.; Liu, W.; Guo, C.; Liu, W.; Liu, K.; Chen, Q. A comprehensive review of thermal comfort studies in urban open spaces. Sci. Total Environ. 2020, 742, 140092. [Google Scholar] [CrossRef]
- Sarhadi, F.; Rad, V.B. The structural model for thermal comfort based on perceptions individuals in open urban spaces. Build. Environ. 2020, 185, 107260. [Google Scholar] [CrossRef]
- Peschardt, K.K.; Schipperijn, J.; Stigsdotter, U.K. Use of Small Public Urban Green Spaces (SPUGS). Urban For. Urban Green. 2012, 11, 235–244. [Google Scholar] [CrossRef]
- Subiza-Pérez, M.; Vozmediano, L.; San Juan, C. Green and blue settings as providers of mental health ecosystem services: Comparing urban beaches and parks and building a predictive model of psychological restoration. Landsc. Urban Plan. 2020, 204, 103926. [Google Scholar] [CrossRef]
- Yao, X.; Yu, K.; Zeng, X.; Lin, Y.; Ye, B.; Shen, X.; Liu, J. How can urban parks be planned to mitigate urban heat island effect in “Furnace cities”? An accumulation perspective. J. Clean. Prod. 2022, 330, 129852. [Google Scholar] [CrossRef]
- Brown, R.D.; Vanos, J.; Kenny, N.; Lenzholzer, S. Designing urban parks that ameliorate the effects of climate change. Landsc. Urban Plan. 2015, 138, 118–131. [Google Scholar] [CrossRef]
- Akbari, H.; Cartalis, C.; Kolokotsa, D.; Muscio, A.; Pisello, A.L.; Rossi, F.; Santamouris, M.; Synnef, A.; Wong, N.H.; Zinzi, M. Local Climate Change and Urban Heat Island Mitigation Techniques—The State of the Art. J. Civ. Eng. Manag. 2015, 22, 1–16. [Google Scholar] [CrossRef] [Green Version]
- Shiflett, S.A.; Liang, L.L.; Crum, S.M.; Feyisa, G.L.; Wang, J.; Jenerette, G.D. Variation in the urban vegetation, surface temperature, air temperature nexus. Sci. Total Environ. 2017, 579, 495–505. [Google Scholar] [CrossRef] [PubMed]
- Van Renterghem, T.; Botteldooren, D.; Verheyen, K. Road traffic noise shielding by vegetation belts of limited depth. J. Sound Vib. 2012, 331, 2404–2425. [Google Scholar] [CrossRef] [Green Version]
- Cohen, P.; Potchter, O.; Schnell, I. The impact of an urban park on air pollution and noise levels in the Mediterranean city of Tel-Aviv, Israel. Environ. Pollut. 2014, 195, 73–83. [Google Scholar] [CrossRef]
- Shadman, S.; Ahanaf Khalid, P.; Hanafiah, M.M.; Koyande, A.K.; Islam, M.A.; Bhuiyan, S.A.; Kok, S.W.; Show, P.-L. The carbon sequestration potential of urban public parks of densely populated cities to improve environmental sustainability. Sustain. Energy Technol. Assess. 2022, 52, 102064. [Google Scholar] [CrossRef]
- Wolch, J.R.; Byrne, J.; Newell, J.P. Urban green space, public health, and environmental justice: The challenge of making cities ‘just green enough’. Landsc. Urban Plan. 2014, 125, 234–244. [Google Scholar] [CrossRef] [Green Version]
- Chen, M.; Jia, W.; Yan, L.; Du, C.; Wang, K. Quantification and mapping cooling effect and its accessibility of urban parks in an extreme heat event in a megacity. J. Clean. Prod. 2022, 334, 130252. [Google Scholar] [CrossRef]
- Ruiz, M.A.; Colli, M.F.; Martinez, C.F.; Correa-Cantaloube, E.N. Park cool island and built environment. A ten-year evaluation in Parque Central, Mendoza-Argentina. Sustain. Cities Soc. 2022, 79, 103681. [Google Scholar] [CrossRef]
- Vidrih, B.; Medved, S. Multiparametric model of urban park cooling island. Urban For. Urban Green. 2013, 12, 220–229. [Google Scholar] [CrossRef]
- Cheung, P.K.; Jim, C.Y.; Siu, C.T. Effects of urban park design features on summer air temperature and humidity in compact-city milieu. Appl. Geogr. 2021, 129, 102439. [Google Scholar] [CrossRef]
- Wei, D.; Yang, L.; Bao, Z.; Lu, Y.; Yang, H. Variations in outdoor thermal comfort in an urban park in the hot-summer and cold-winter region of China. Sustain. Cities Soc. 2021, 77, 103535. [Google Scholar] [CrossRef]
- Kong, H.; Choi, N.; Park, S. Thermal environment analysis of landscape parameters of an urban park in summer—A case study in Suwon, Republic of Korea. Urban For. Urban Green. 2021, 65, 127377. [Google Scholar] [CrossRef]
- Liu, L. A Study on Urban Waterfront Park System. Master’s Thesis, Southeast University, Nanjing, China, 2004. (In Chinese). [Google Scholar]
- Jianguo Wang, Z.L. The historical process of waterfront development and construction in cities around the world and its experience. City Plan. Rev. 2001, 7, 41–46. (In Chinese) [Google Scholar]
- Shi, M. Research on the Planning and Design of Waterfront City Ribbon Park North. Master’s Thesis, Northeast Forestry University, Harbin, China, 2013. (In Chinese). [Google Scholar]
- Uebel, K.; Marselle, M.; Dean, A.J.; Rhodes, J.R.; Bonn, A. Urban green space soundscapes and their perceived restorativeness. People Nat. 2021, 3, 756–769. [Google Scholar] [CrossRef]
- Yang, W.; Wong, N.H.; Jusuf, S.K. Thermal comfort in outdoor urban spaces in Singapore. Build. Environ. 2013, 59, 426–435. [Google Scholar] [CrossRef]
- Johansson, E.; Thorsson, S.; Emmanuel, R.; Kruger, E. Instruments and methods in outdoor thermal comfort studies? The need for standardization. Urban Clim. 2014, 10, 346–366. [Google Scholar] [CrossRef] [Green Version]
- Chen, L.; Ng, E. Outdoor thermal comfort and outdoor activities: A review of research in the past decade. Cities 2012, 29, 118–125. [Google Scholar] [CrossRef]
- Fang, Z.; Feng, X.; Lin, Z. Investigation of PMV Model for Evaluation of the Outdoor Thermal Comfort. Procedia Eng. 2017, 205, 2457–2462. [Google Scholar] [CrossRef]
- Chan, S.Y.; Chau, C.K.; Leung, T.M. On the study of thermal comfort and perceptions of environmental features in urban parks: A structural equation modeling approach. Build. Environ. 2017, 122, 171–183. [Google Scholar] [CrossRef]
- Lau, K.K.-L.; Choi, C.Y. The influence of perceived aesthetic and acoustic quality on outdoor thermal comfort in urban environment. Build. Environ. 2021, 206, 108333. [Google Scholar] [CrossRef]
- Knez, I.; Thorsson, S. Thermal, emotional and perceptual evaluations of a park: Cross-cultural and environmental attitude comparisons. Build. Environ. 2008, 43, 1483–1490. [Google Scholar] [CrossRef]
- Nikolopoulou, M.; Baker, N.; Steemers, K. Thermal comfort in outdoor urban spaces: Understanding the human parameter. Sol. Energy 2001, 70, 227–235. [Google Scholar] [CrossRef]
- Nitidara, N.P.A.; Sarwono, J.; Suprijanto, S.; Soelami, F.X.N. The multisensory interaction between auditory, visual, and thermal to the overall comfort in public open space: A study in a tropical climate. Sustain. Cities Soc. 2022, 78, 103622. [Google Scholar] [CrossRef]
- Lin, T.-P. Thermal perception, adaptation and attendance in a public square in hot and humid regions. Build. Environ. 2009, 44, 2017–2026. [Google Scholar] [CrossRef]
- Liu, S.; Nazarian, N.; Niu, J.; Hart, M.; de Dear, R. From thermal sensation to thermal affect: A multi-dimensional semantic space to assess outdoor thermal comfort. Build. Environ. 2020, 182, 107112. [Google Scholar] [CrossRef]
- Sun, Y. Study on Usage Assessment and Strategy of Open Park in Harbin. Master’s Thesis, Northeast Forestry University, Harbin, China, 2015. (In Chinese). [Google Scholar]
- Zhang, J. Analysis of historical law of Harbin section of Songhua River in low water level and flood period. Heilongjiang Meteorol. 2008, 1, 17–18. (In Chinese) [Google Scholar]
- Xie, L.; Yang, Z.; Cai, J.; Cheng, Z.; Wen, T.; Song, T.J. Harbin: A rust belt city revival from its strategic position. Cities 2016, 58, 26–38. [Google Scholar] [CrossRef]
- Klemm, W.; Heusinkveld, B.G.; Lenzholzer, S.; Jacobs, M.H.; Van Hove, B. Psychological and physical impact of urban green spaces on outdoor thermal comfort during summertime in The Netherlands. Build. Environ. 2015, 83, 120–128. [Google Scholar] [CrossRef]
- ANSI/ASHRAE Standard 55-2020; Thermal Environmental Conditions for Human Occupancy. ANSI/ASHRAE: Peachtree Corners, GA, USA, 2020.
- Krupp, L.B.; LaRocca, N.G.; Muir-Nash, J.; Steinberg, A.D. The Fatigue Severity Scale: Application to patients with multiple sclerosis and systemic lupus erythematosus. Arch. Neurol. 1989, 46, 1121–1123. [Google Scholar] [CrossRef] [PubMed]
- Martinez-Martin, P.; Wetmore, J.B.; Arbelo, J.M.; Catalán, M.-J.; Valldeoriola, F.; Rodriguez-Blazquez, C. Validation study of the Parkinson’s Fatigue Scale in advanced Parkinson’s disease. Patient Relat. Outcome Meas. 2019, 10, 141–152. [Google Scholar] [CrossRef] [PubMed] [Green Version]
- Labrague, L.J. Pandemic fatigue and clinical nurses’ mental health, sleep quality and job contentment during the COVID-19 pandemic: The mediating role of resilience. J. Nurs. Manag. 2021, 29, 1992–2001. [Google Scholar] [CrossRef] [PubMed]
- Jeong, J.-H.; Lee, K.-H. The physical environment in museums and its effects on visitors’ satisfaction. Build. Environ. 2006, 41, 963–969. [Google Scholar] [CrossRef]
- Choi, J.-H.; Loftness, V. Investigation of human body skin temperatures as a bio-signal to indicate overall thermal sensations. Build. Environ. 2012, 58, 258–269. [Google Scholar] [CrossRef]
- I.J.I.S.O. 9886; Ergonomics-Evaluation of Thermal Strain by Physiological Measurements. 2nd ed. ISO: Geneva, Switzerland, 2004; pp. 1–21.
- Ye, Y. A survey on landscape planning and design of urban waterfront, taking Stalin Park in Harbin as an example. Heilongjiang Sci. Technol. Inf. 2010, 36, 340. (In Chinese) [Google Scholar]
- Cheung, P.K.; Jim, C.Y. Improved assessment of outdoor thermal comfort: 1-hour acceptable temperature range. Build. Environ. 2019, 151, 303–317. [Google Scholar] [CrossRef]
- Chen, X.; Xue, P.; Liu, L.; Gao, L.; Liu, J. Outdoor thermal comfort and adaptation in severe cold area: A longitudinal survey in Harbin, China. Build. Environ. 2018, 143, 548–560. [Google Scholar] [CrossRef]
- Zhang, H.; Huizenga, C.; Arens, E.; Wang, D. Thermal sensation and comfort in transient non-uniform thermal environments. Eur. J. Appl. Physiol. 2004, 92, 728–733. [Google Scholar] [CrossRef]
- Fang, Z.; Liu, H.; Li, B.; Tan, M.; Olaide, O.M. Experimental investigation on thermal comfort model between local thermal sensation and overall thermal sensation. Energy Build. 2018, 158, 1286–1295. [Google Scholar] [CrossRef] [Green Version]
- Ewing, R.; Handy, S. Measuring the Unmeasurable: Urban Design Qualities Related to Walkability. J. Urban Des. 2009, 14, 65–84. [Google Scholar] [CrossRef]


| Gender | Number of People | Age | Height (m) | Weight (kg) | BMI | Human Skin Surface Area (m2) |
|---|---|---|---|---|---|---|
| Female | 3 | 25 ± 5 | 1.65 ± 0.01 | 55 ± 4 | 22.20 ± 1.50 | 1.59 ± 0.05 |
| Male | 3 | 25 ± 5 | 1.79 ± 0.04 | 71 ± 4 | 22.45 ± 0.65 | 1.87 ± 0.07 |
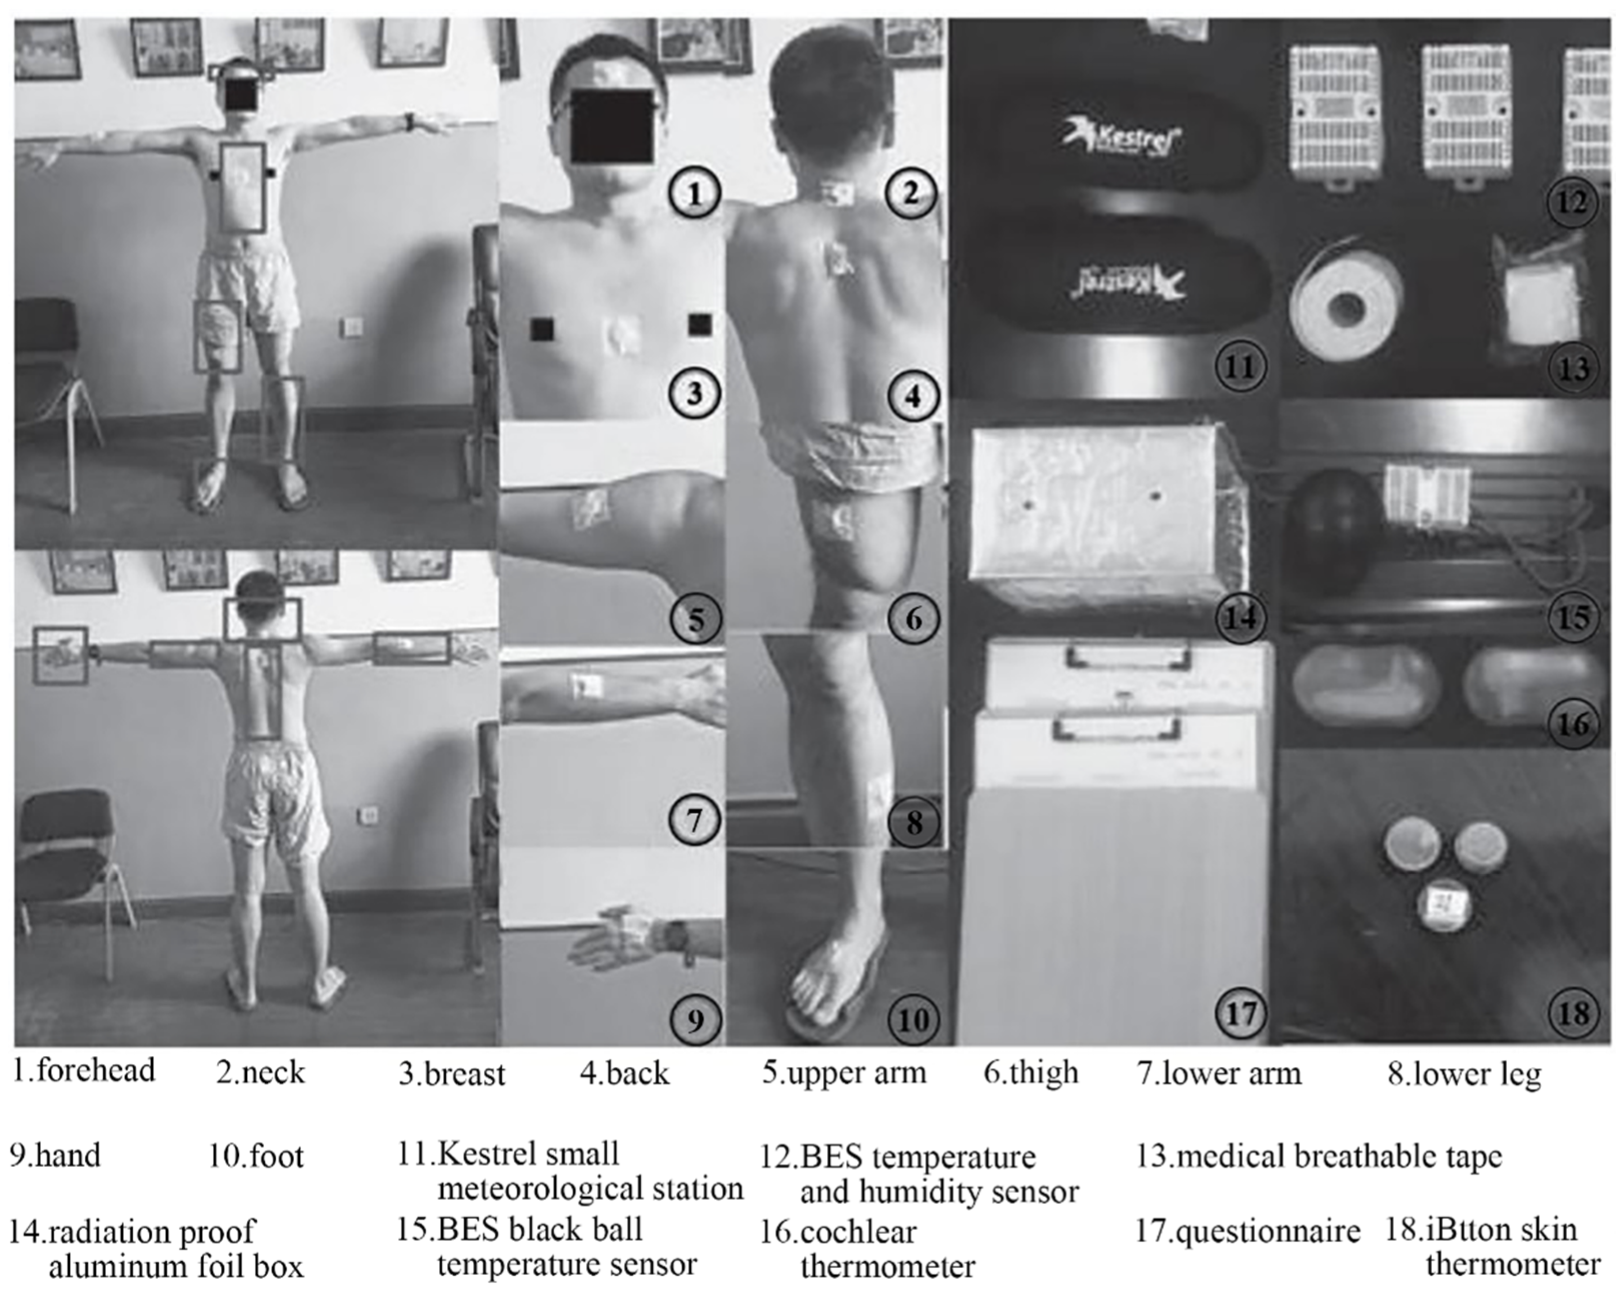
| Body Part | Forehead | Neck | Breast | Back | Upper Arm | Lower Arm | Hand | Thigh | Lower Leg | Foot |
|---|---|---|---|---|---|---|---|---|---|---|
| Coefficient | 0.5 | 0.5 | 0.41 | 0.32 | 0.105 | 0.105 | 0.06 | 0.51 | 0.36 | 0.13 |
Publisher’s Note: MDPI stays neutral with regard to jurisdictional claims in published maps and institutional affiliations. |
© 2022 by the authors. Licensee MDPI, Basel, Switzerland. This article is an open access article distributed under the terms and conditions of the Creative Commons Attribution (CC BY) license (https://creativecommons.org/licenses/by/4.0/).
Share and Cite
Xi, T.; Zhang, X.; Jin, W.; Xu, W.; Wu, Y.; Qin, H. Primary Exploration of Leisure Path Design along Songhua River by a Small Number of Sample Experiment, Considering Several Multiple Indexes. Atmosphere 2022, 13, 1165. https://0-doi-org.brum.beds.ac.uk/10.3390/atmos13081165
Xi T, Zhang X, Jin W, Xu W, Wu Y, Qin H. Primary Exploration of Leisure Path Design along Songhua River by a Small Number of Sample Experiment, Considering Several Multiple Indexes. Atmosphere. 2022; 13(8):1165. https://0-doi-org.brum.beds.ac.uk/10.3390/atmos13081165
Chicago/Turabian StyleXi, Tianyu, Xinyue Zhang, Wenxin Jin, Weiqing Xu, Yu Wu, and Huan Qin. 2022. "Primary Exploration of Leisure Path Design along Songhua River by a Small Number of Sample Experiment, Considering Several Multiple Indexes" Atmosphere 13, no. 8: 1165. https://0-doi-org.brum.beds.ac.uk/10.3390/atmos13081165