
Impact of a New Radiation Scheme on Simulated Climate in the Global–Regional Integrated SysTem Model under Varying Physical Parameterization Schemes


Abstract
:1. Introduction
2. Model Description
2.1. The GRIST Model
2.2. BCC-RAD Radiation Scheme
3. Experimental Design
3.1. Single Column Model Experiments
3.2. GCM Experiments
4. Results
4.1. Comparison between BCC-RAD and RRTMG in the Single Column Model
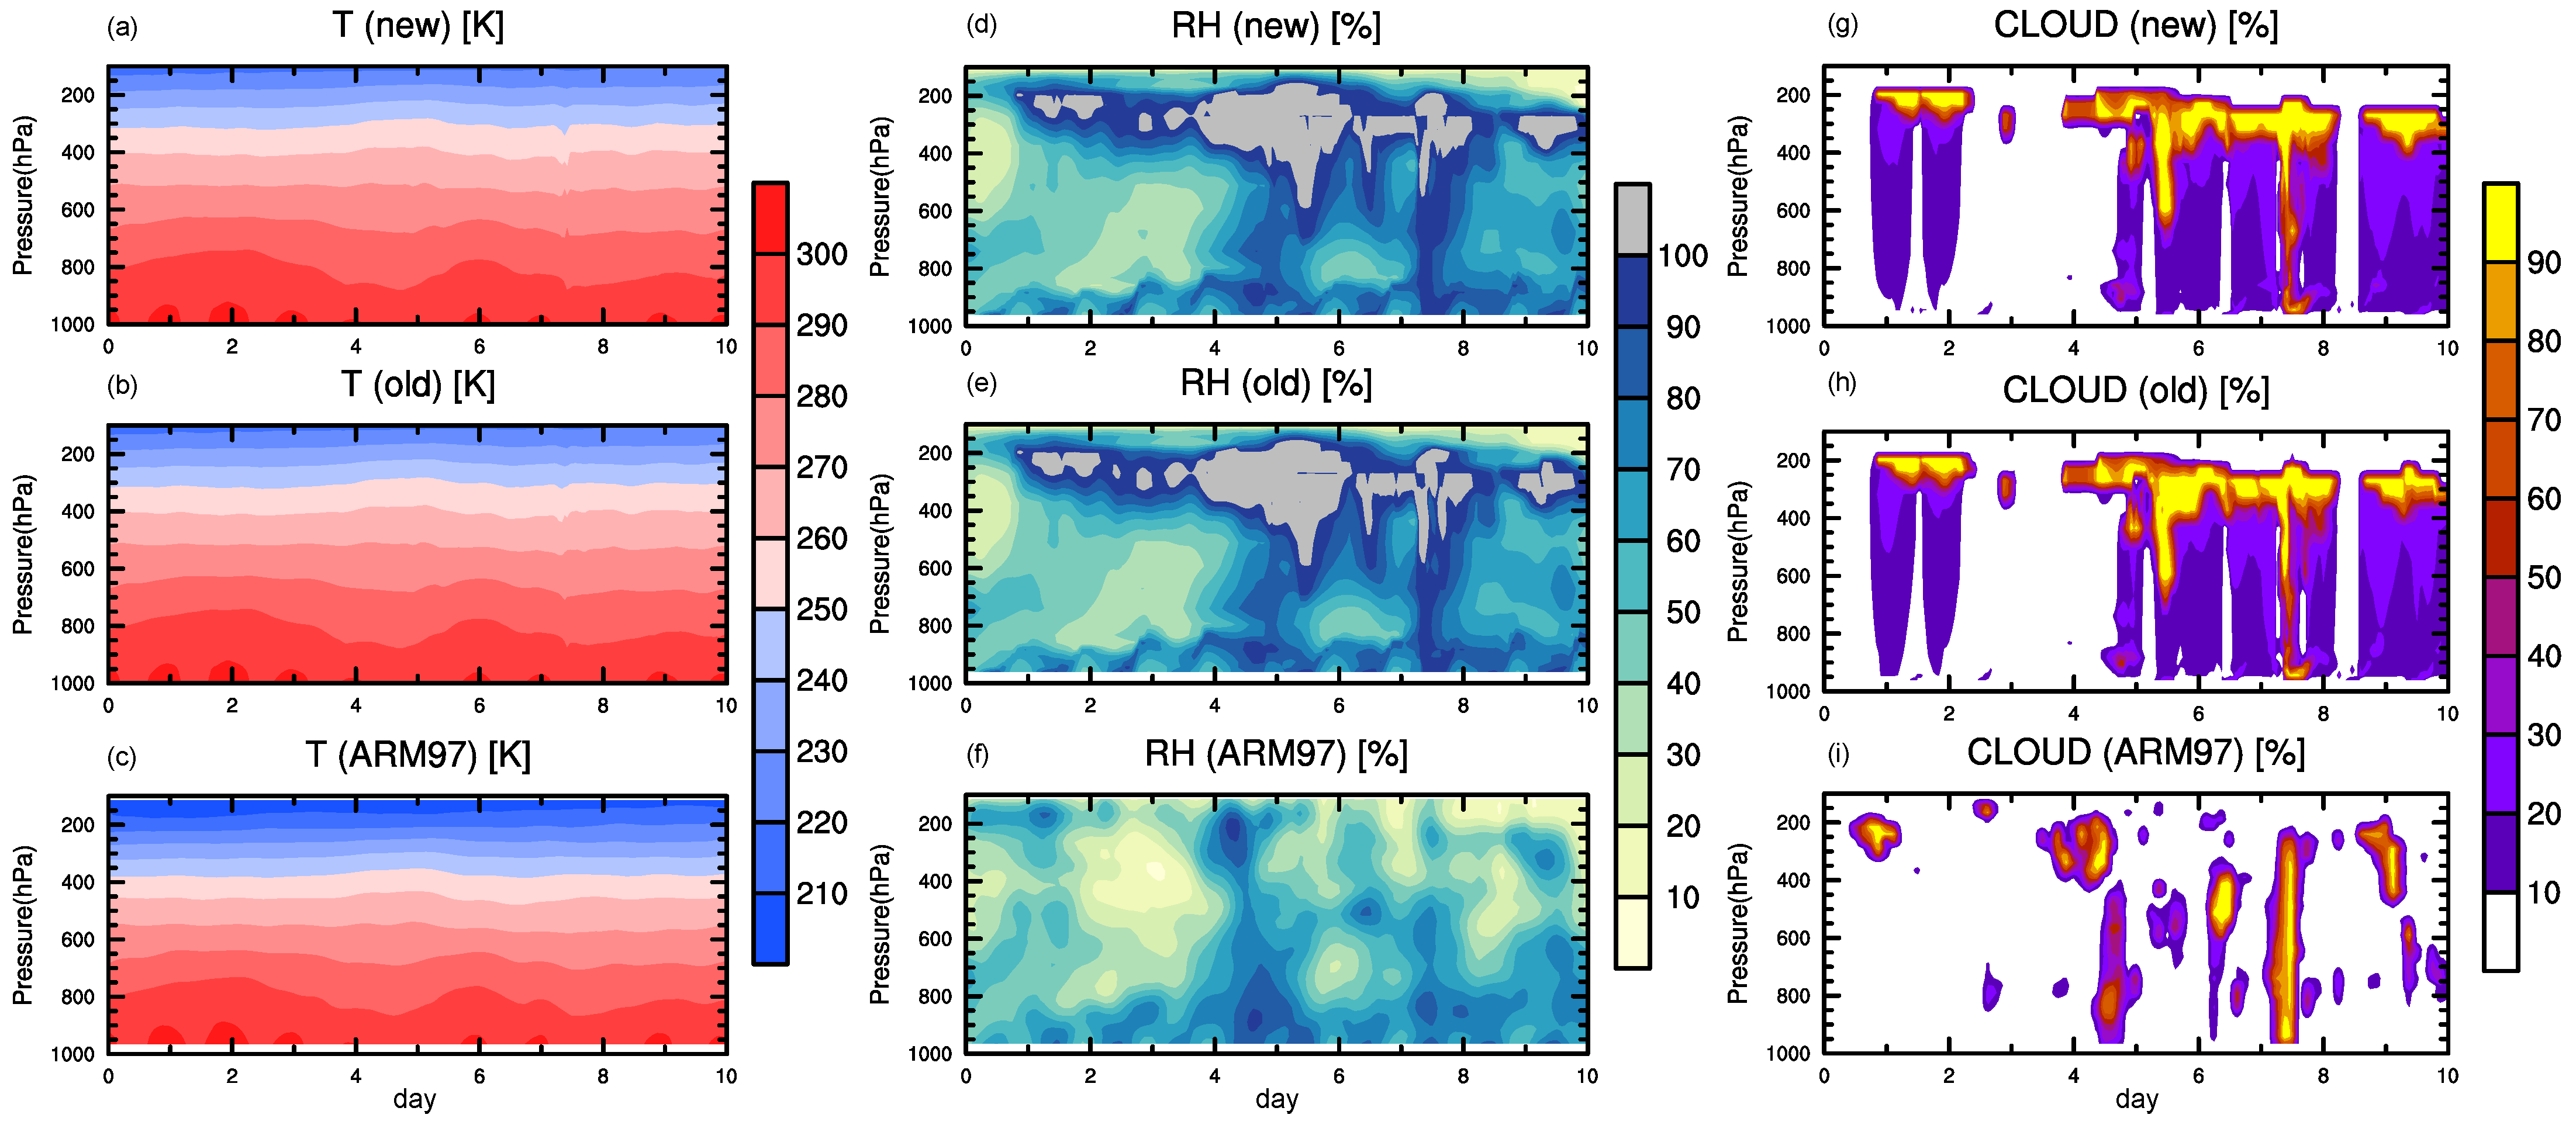
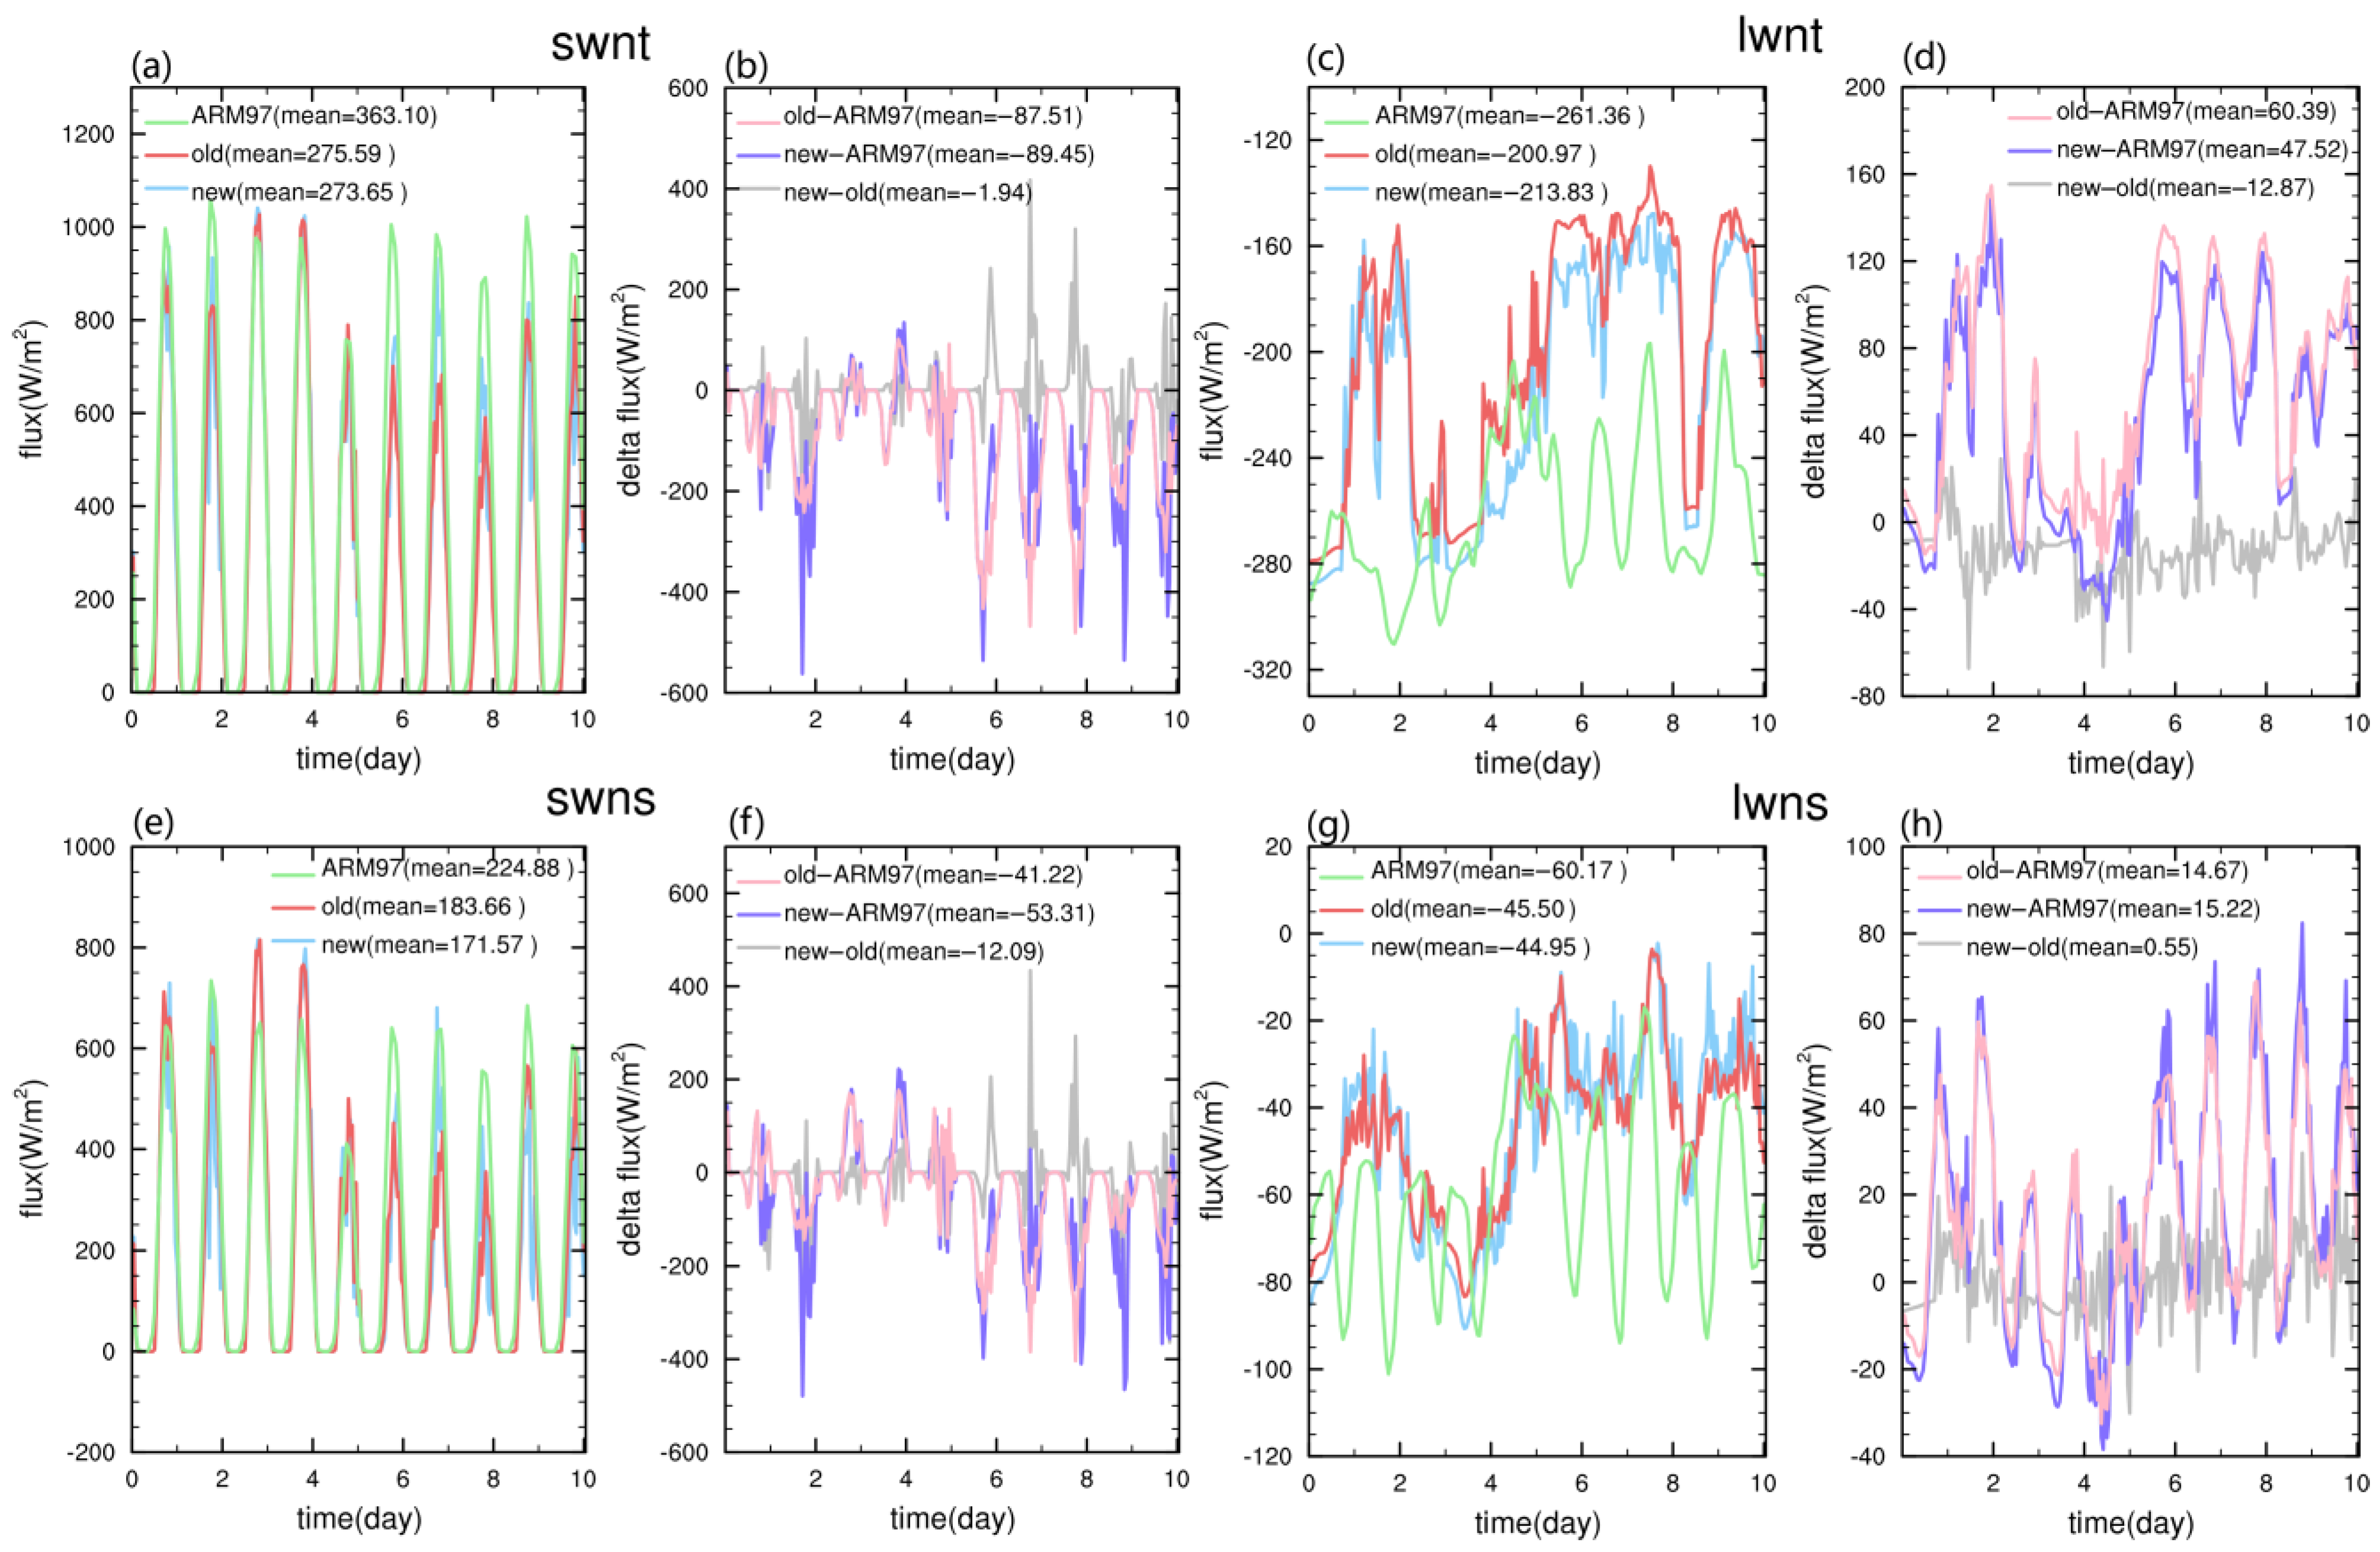
4.1.1. ARM97
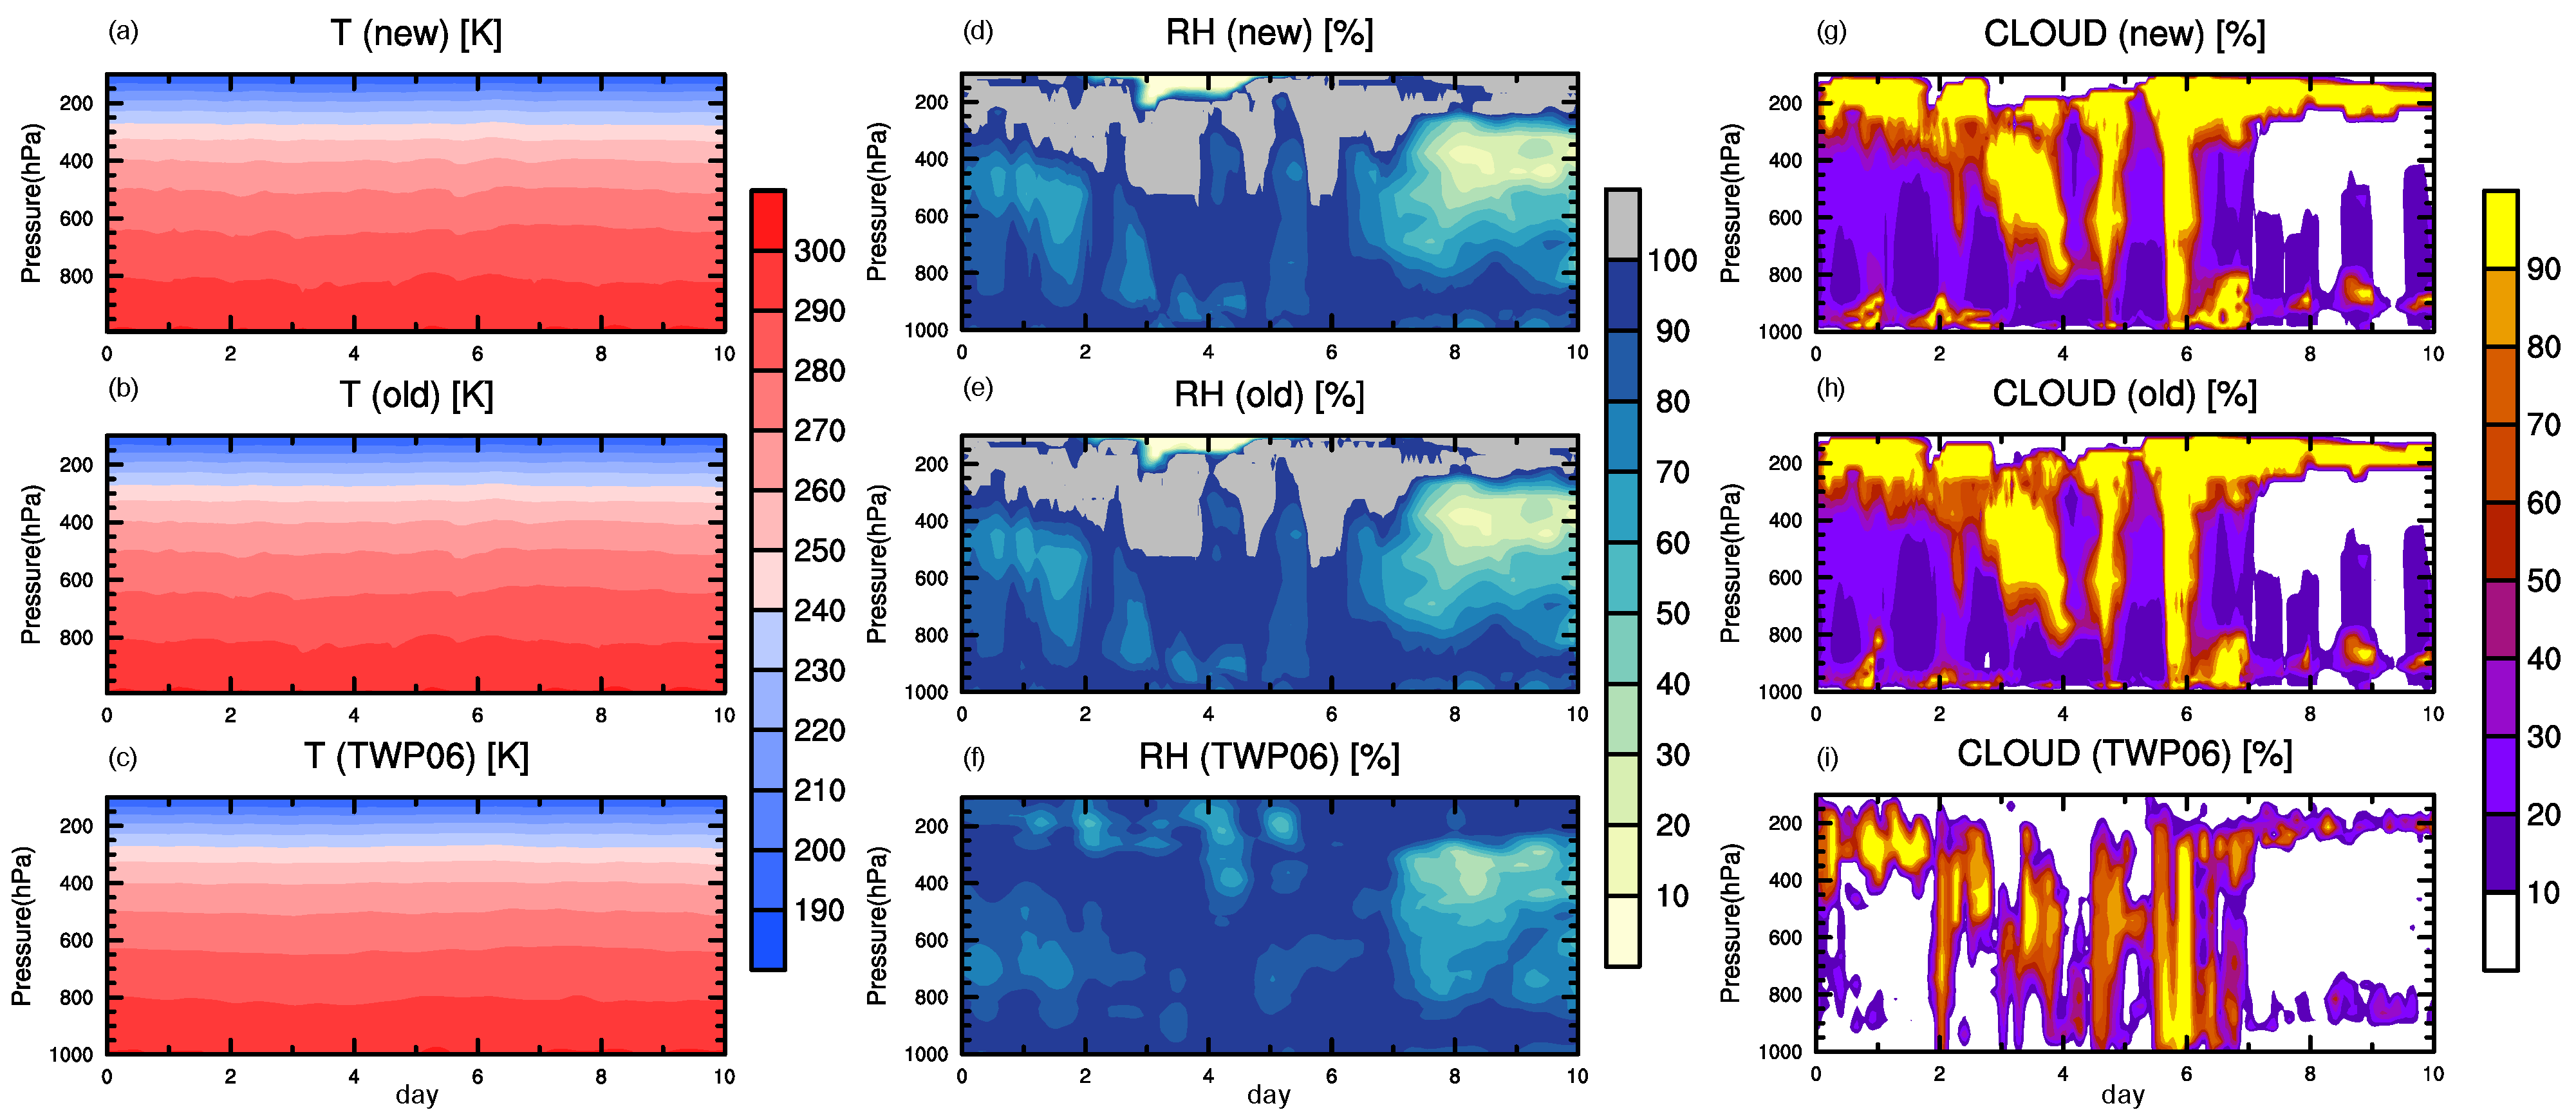
4.1.2. TWP06
4.2. GCM Simulations under PhysC Parameterization Scheme
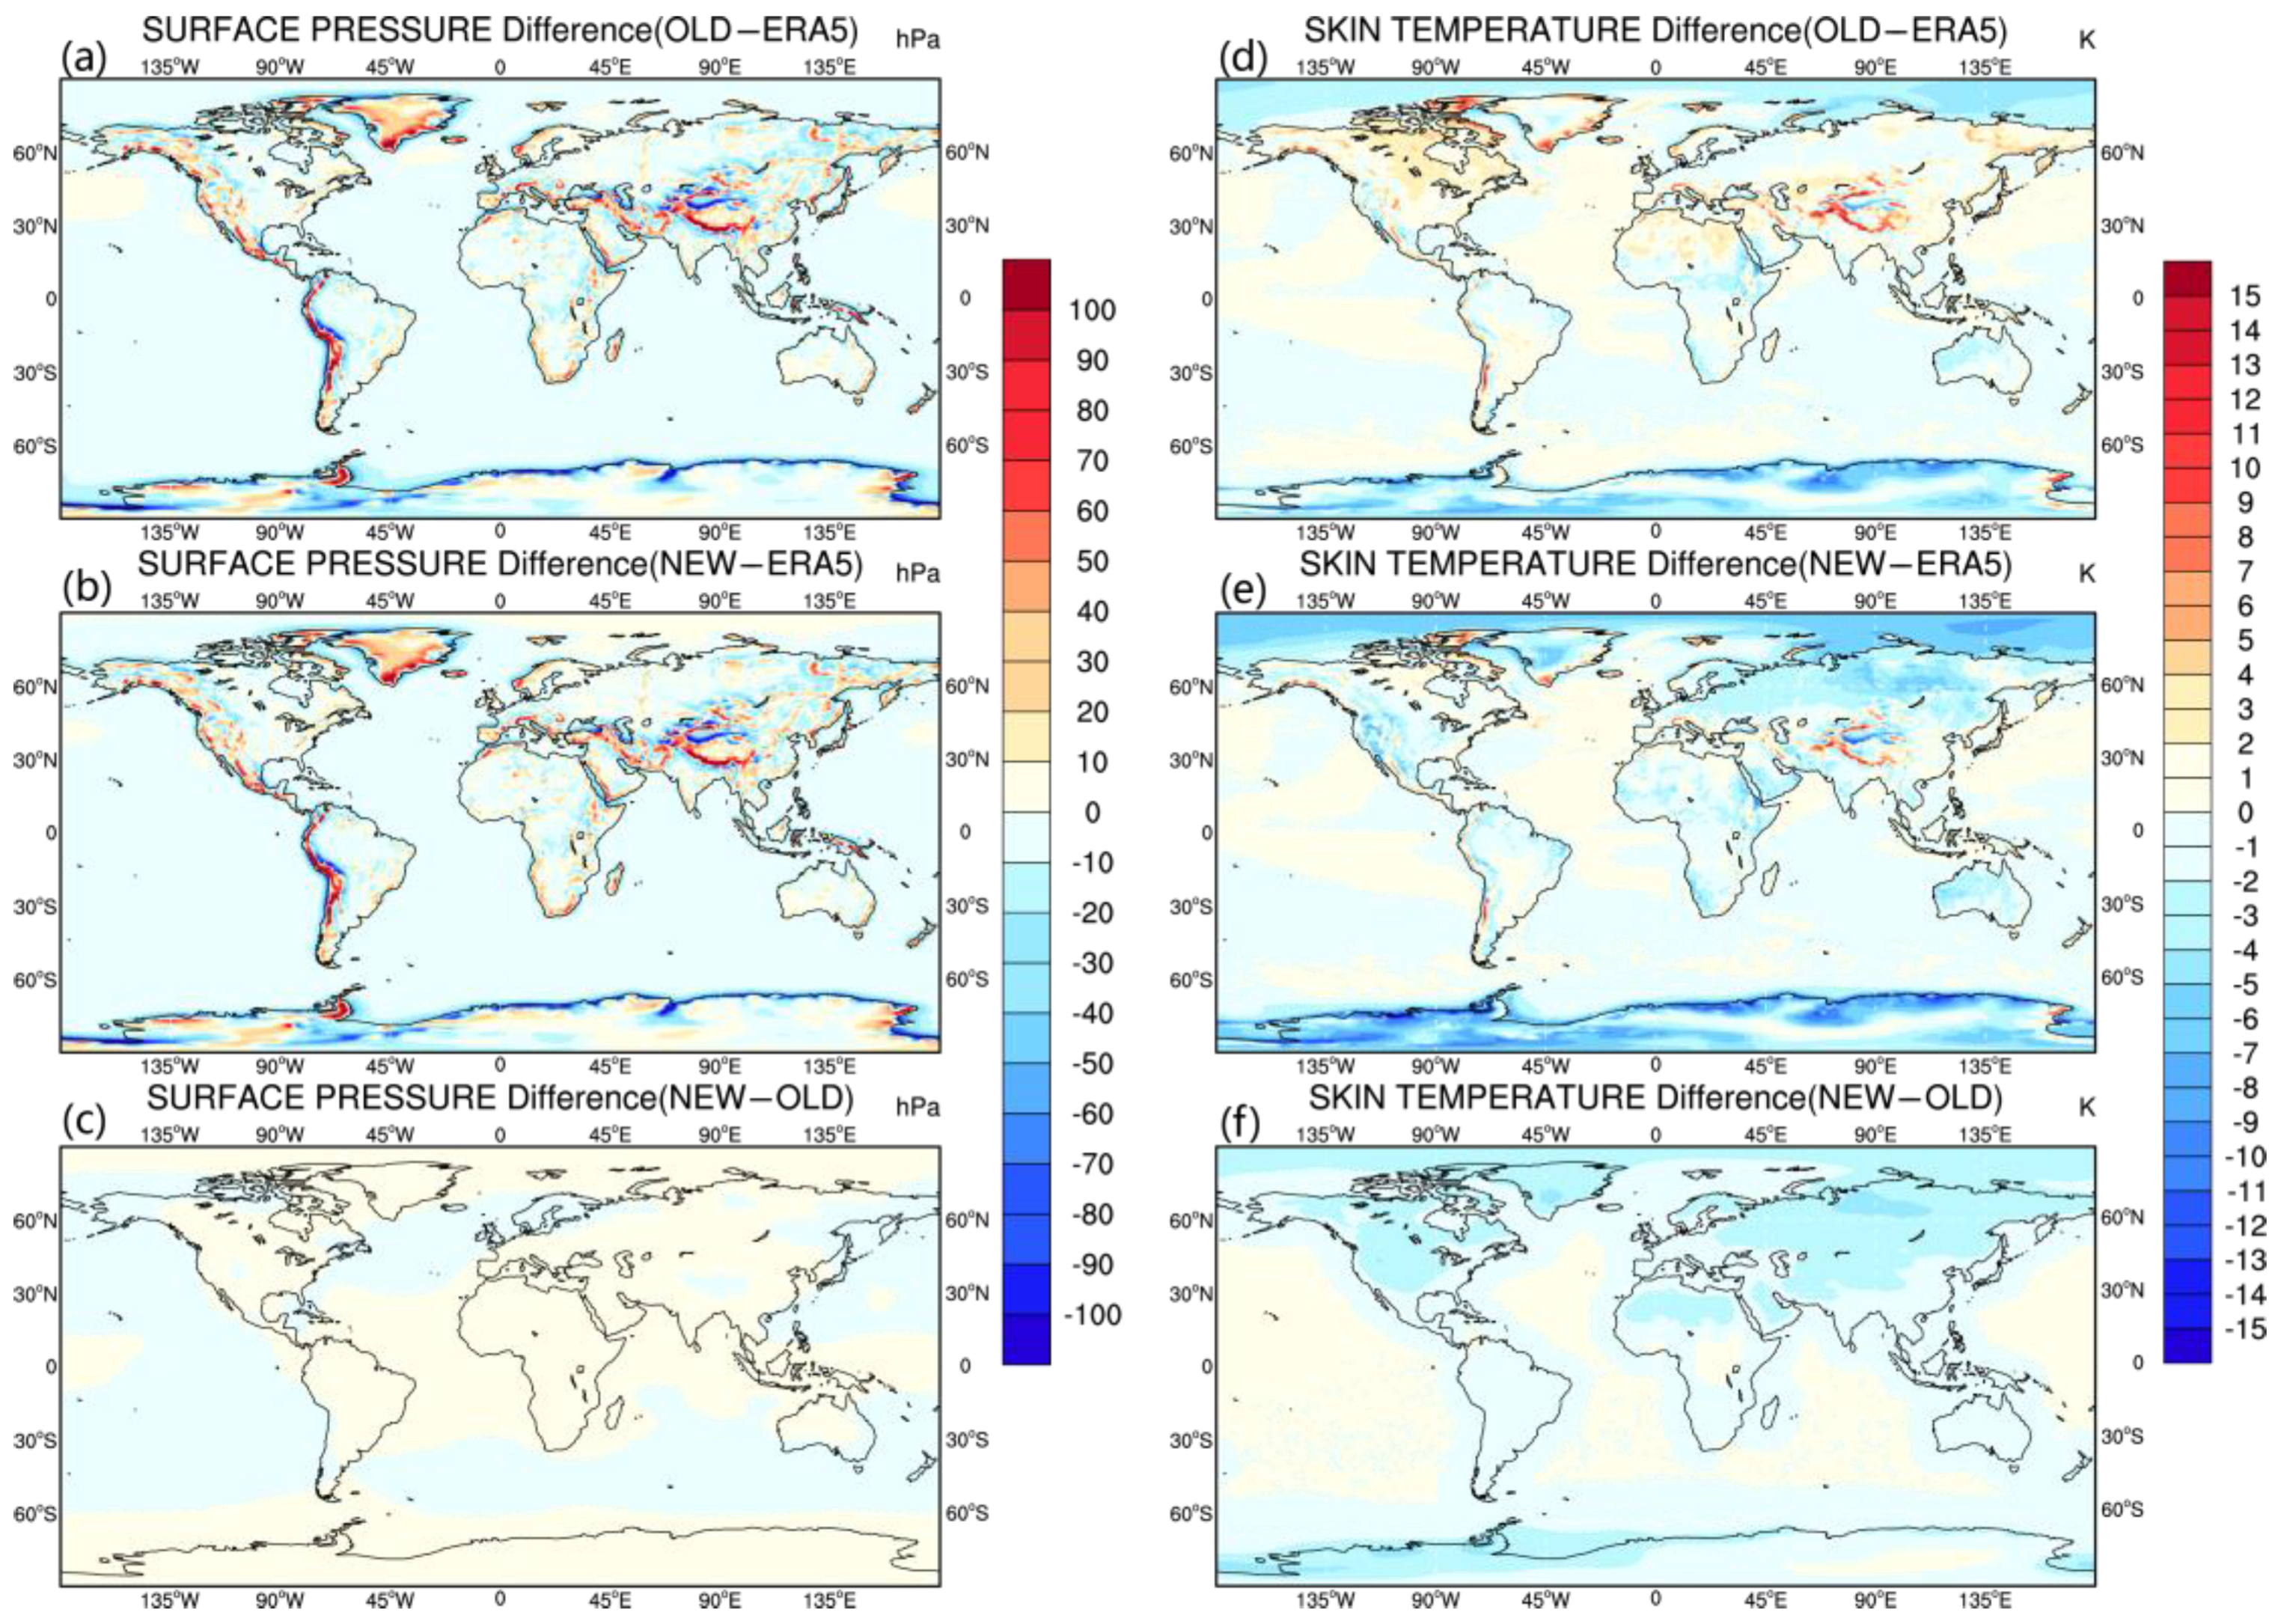
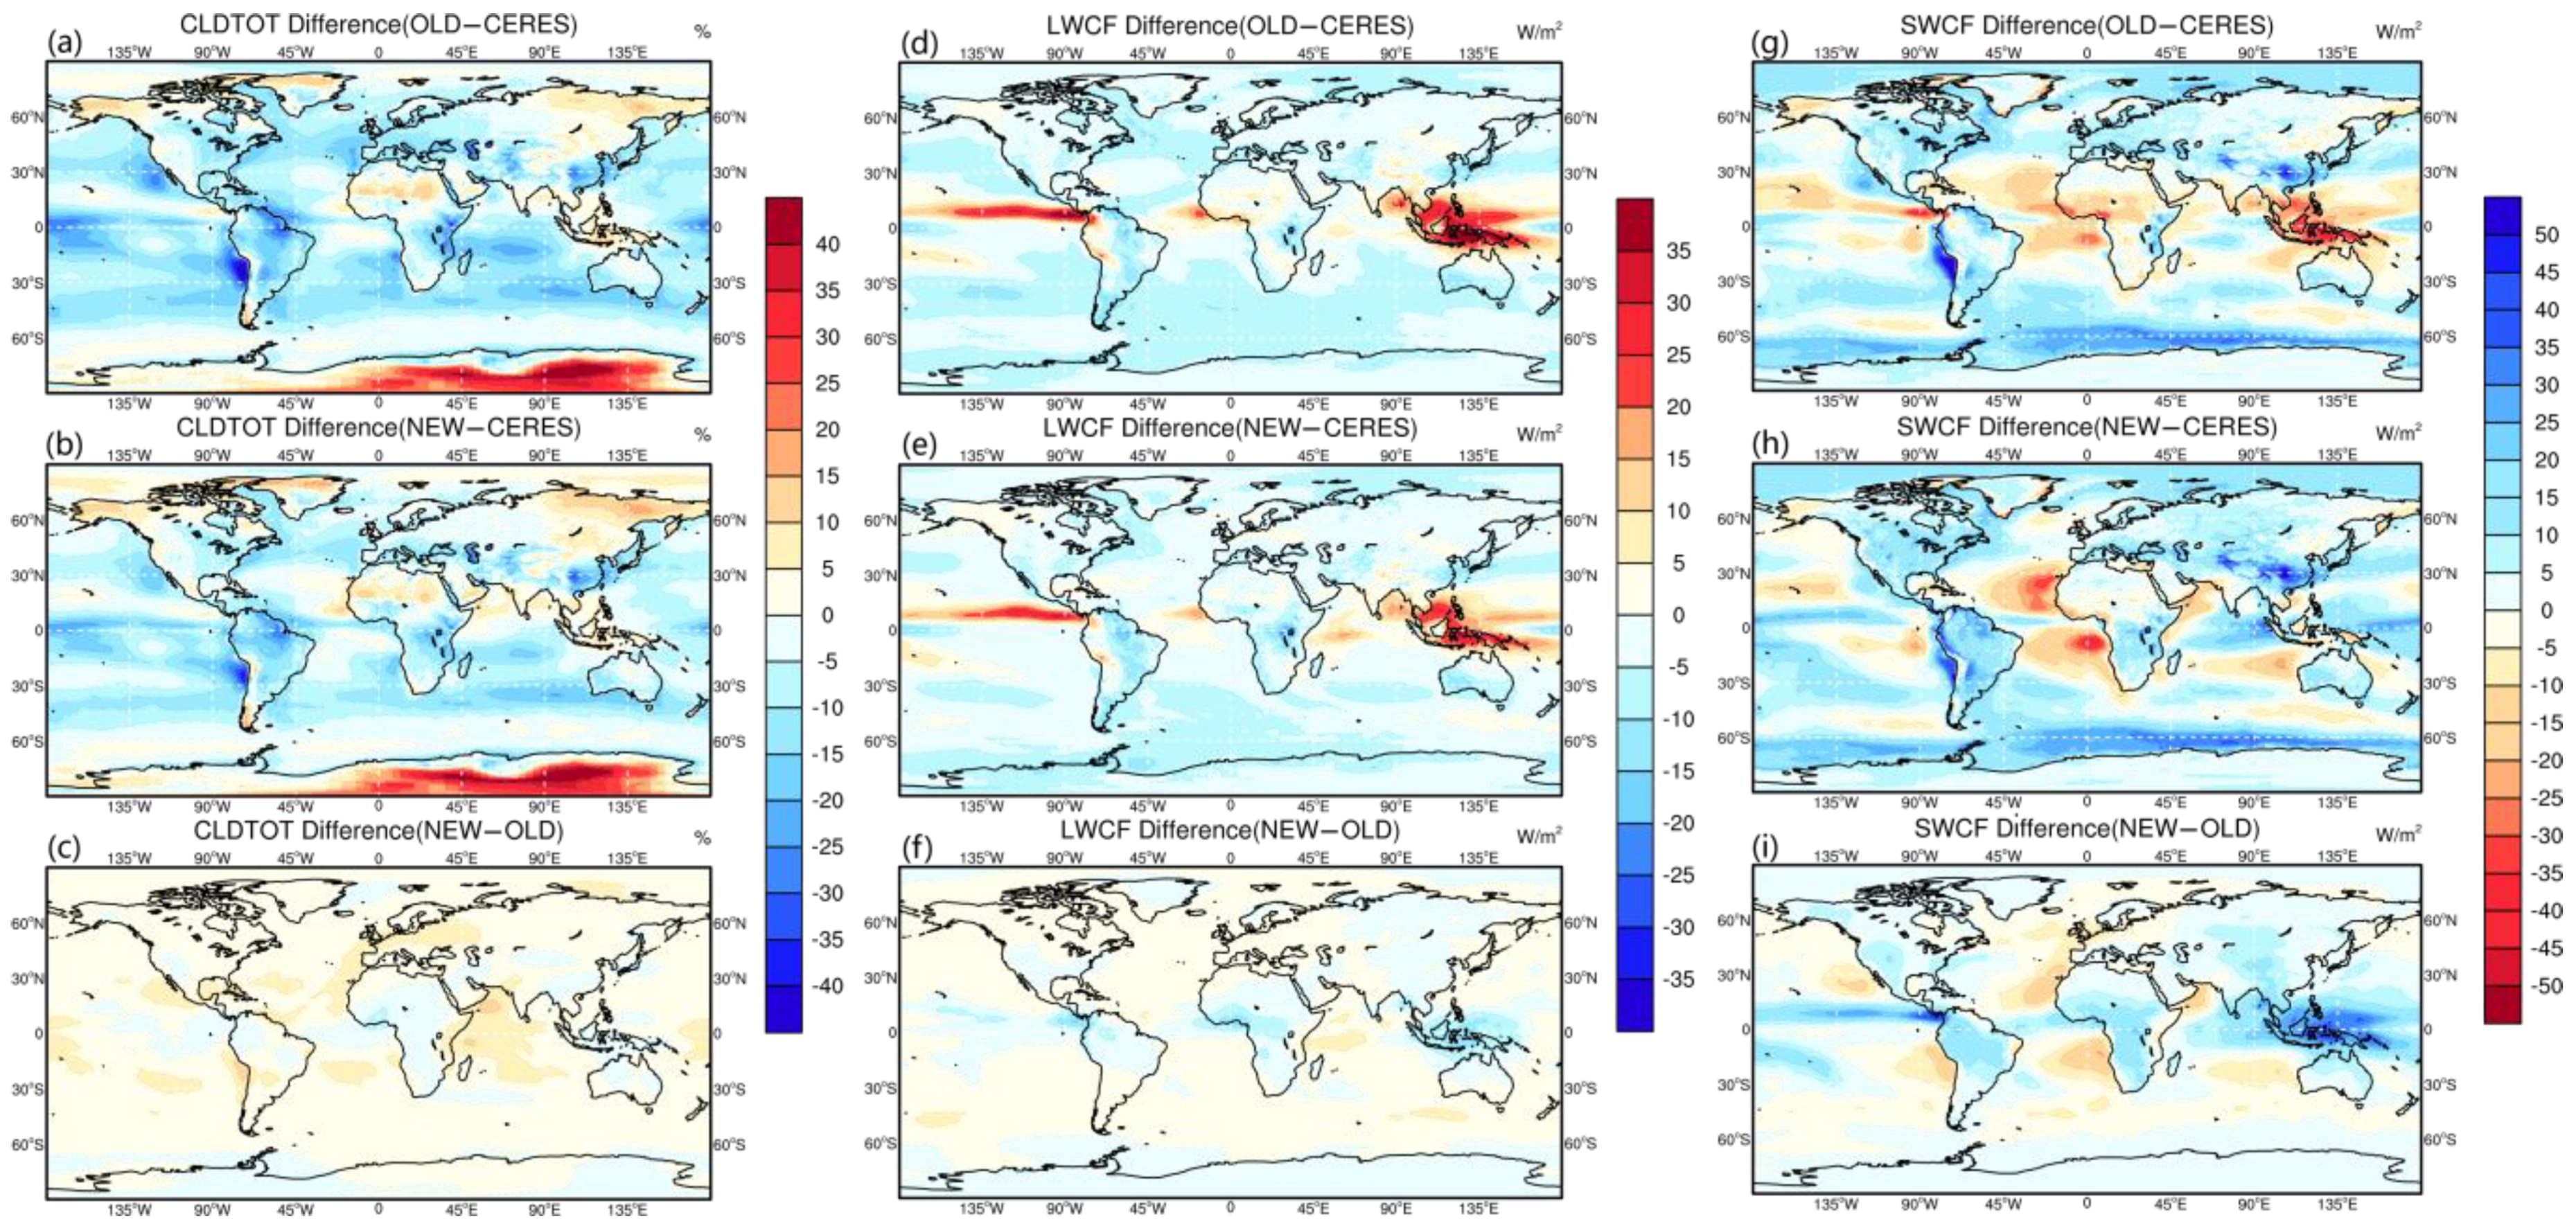
4.2.1. Global Distributions
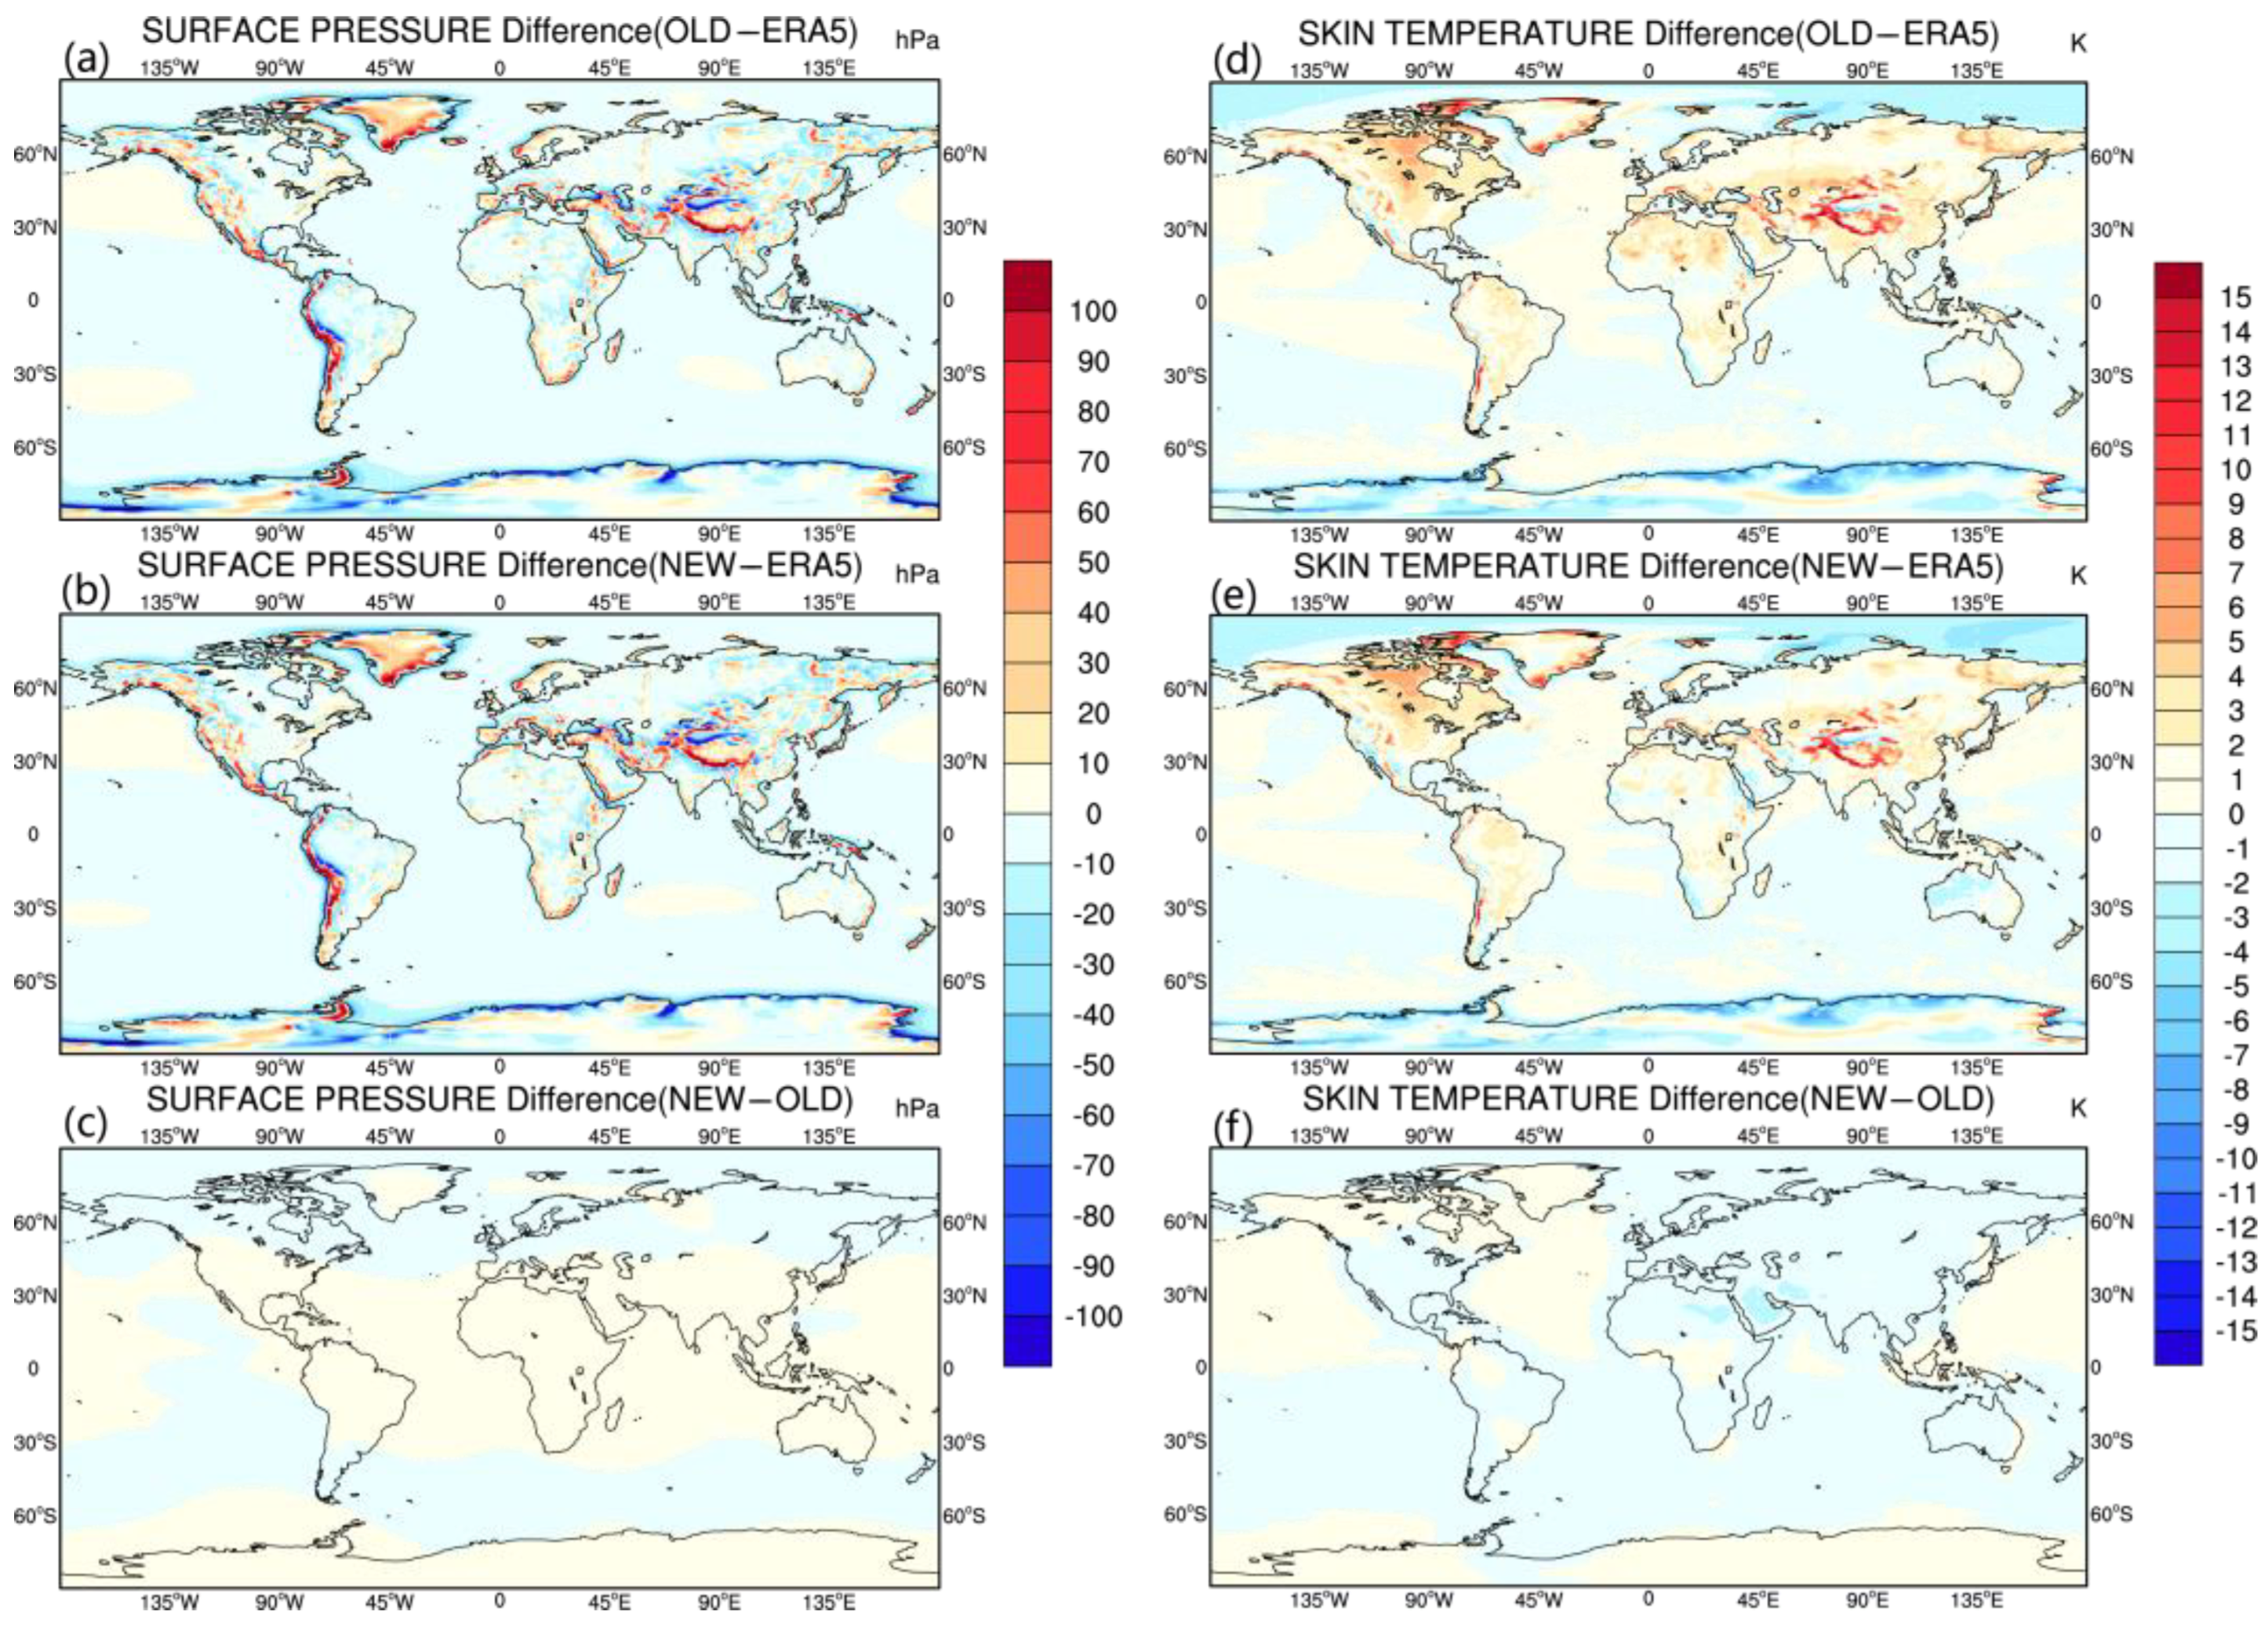
4.2.2. Atmospheric State
4.3. GCM Simulations under the PhysCN Parameterization Scheme
4.3.1. Global Distributions
4.3.2. Atmospheric State
5. Conclusions and Discussion
Author Contributions
Funding
Institutional Review Board Statement
Informed Consent Statement
Data Availability Statement
Conflicts of Interest
References
- Kahn, R.A. Reducing the Uncertainties in Direct Aerosol Radiative Forcing. Surv. Geophys. 2012, 33, 701–721. [Google Scholar] [CrossRef]
- Pincus, R.; Forster, P.M.; Stevens, B. The Radiative Forcing Model Intercomparison Project (RFMIP): Experimental protocol for CMIP6. Geosci. Model. Dev. 2016, 9, 3447–3460. [Google Scholar] [CrossRef]
- Jahangir, E.; Libois, Q.; Couvreux, F.; Vié, B.; Saint-Martin, D. Uncertainty of SW Cloud Radiative Effect in Atmospheric Models Due to the Parameterization of Liquid Cloud Optical Properties. J. Adv. Model. Earth Syst. 2021, 13, e2021MS002742. [Google Scholar] [CrossRef]
- Adams, S.V.; Ford, R.W.; Hambley, M.; Hobson, J.M.; Kavčič, I.; Maynard, C.M.; Melvin, T.; Müller, E.H.; Mullerworth, S.; Porter, A.R.; et al. LFRic: Meeting the challenges of scalability and performance portability in Weather and Climate models. J. Parallel Distrib. Comput. 2019, 132, 383–396. [Google Scholar] [CrossRef]
- Giorgetta, M.A.; Brokopf, R.; Crueger, T.; Esch, M.; Fiedler, S.; Helmert, J.; Hohenegger, C.; Kornblueh, L.; Köhler, M.; Manzini, E.; et al. ICON-A, the Atmosphere Component of the ICON Earth System Model: I. Model Description. J. Adv. Model. Earth Syst. 2018, 10, 1613–1637. [Google Scholar] [CrossRef]
- Crueger, T.; Giorgetta, M.A.; Brokopf, R.; Esch, M.; Fiedler, S.; Hohenegger, C.; Kornblueh, L.; Mauritsen, T.; Nam, C.; Naumann, A.K.; et al. ICON-A, The Atmosphere Component of the ICON Earth System Model: II. Model Evaluation. J. Adv. Model. Earth Syst. 2018, 10, 1638–1662. [Google Scholar] [CrossRef]
- Tomita, H.; Miura, H.; Iga, S.; Nasuno, T.; Satoh, M. A global cloud-resolving simulation: Preliminary results from an aqua planet experiment. Geophys. Res. Lett. 2005, 32, 8. [Google Scholar] [CrossRef]
- Zhang, Y.; Li, X.; Liu, Z.; Rong, X.; Li, J.; Zhou, Y.; Chen, S. Resolution Sensitivity of the GRIST Nonhydrostatic Model from 120 to 5 km (3.75 km) During the DYAMOND Winter. Earth Space Sci. 2022, 9, e2022EA002401. [Google Scholar] [CrossRef]
- Zhang, H.; Shi, G.; Nakajima, T.; Suzuki, T. The effects of the choice of the k-interval number on radiative calculations. J. Quant. Spectrosc. Radiat. Transf. 2006, 98, 31–43. [Google Scholar] [CrossRef]
- Zhang, H.; Jing, X.; Li, J. Application and evaluation of a new radiation code under McICA scheme in BCC_AGCM2.0.1. Geosci. Model. Dev. 2014, 7, 737–754. [Google Scholar] [CrossRef]
- Zhang, H.; Zhu, S.; Zhao, S.; Wei, X. Establishment of high-resolution aerosol parameterization and its influence on radiation calculations. J. Quant. Spectrosc. Radiat. Transf. 2020, 243, 106802. [Google Scholar] [CrossRef]
- Zhou, C.; Zhang, H.; Zhao, S.; Li, J. On Effective Radiative Forcing of Partial Internally and Externally Mixed Aerosols and Their Effects on Global Climate. J. Geophys. Res. Atmos. 2018, 123, 401–423. [Google Scholar] [CrossRef]
- Zhang, H.; Zhou, C.; Zhao, S. Influences of the Internal Mixing of Anthropogenic Aerosols on Global Aridity Change. J. Meteorol. Res. 2018, 32, 723–733. [Google Scholar] [CrossRef]
- Zhang, H.; Wang, Z.; Zhang, F.; Jing, X. Impact of four-stream radiative transfer algorithm on aerosol direct radiative effect and forcing. Int. J. Climatol. 2015, 35, 4318–4328. [Google Scholar] [CrossRef]
- Li, X.; Zhang, Y.; Lin, Y.; Peng, X.; Li, J. Implementation of a moist physics parameterization package in the GRIST global model and its impact on the modeled climate. Acta Meteorol. Sin. 2023, 81, 630–644. [Google Scholar]
- Chu, W.; Lin, Y.; Zhao, M. Implementation and Evaluation of a Double-Plume Convective Parameterization in NCAR CAM5. J. Clim. 2022, 35, 617–637. [Google Scholar] [CrossRef]
- Qin, Y.; Lin, Y.; Xu, S.; Ma, H.-Y.; Xie, S. A Diagnostic PDF Cloud Scheme to Improve Subtropical Low Clouds in NCAR Community Atmosphere Model (CAM5). J. Adv. Model. Earth Syst. 2018, 10, 320–341. [Google Scholar] [CrossRef]
- Zhao, X.; Lin, Y.; Peng, Y.; Wang, B.; Morrison, H.; Gettelman, A. A single ice approach using varying ice particle properties in global climate model microphysics. J. Adv. Model. Earth Syst. 2017, 9, 2138–2157. [Google Scholar] [CrossRef]
- Li, X.; Zhang, Y.; Peng, X.; Chu, W.; Lin, Y.; Li, J. Improved Climate Simulation by Using a Double-Plume Convection Scheme in a Global Model. J. Geophys. Res. Atmos. 2022, 127, e2021JD036069. [Google Scholar] [CrossRef]
- Li, J.; Zhang, Y. Enhancing the stability of a global model by using an adaptively implicit vertical moist transport scheme. Meteorol. Atmos. Phys. 2022, 134, 55. [Google Scholar] [CrossRef]
- Wang, L.; Zhang, Y.; Li, J.; Liu, Z.; Zhou, Y. Understanding the Performance of an Unstructured-Mesh Global Shallow Water Model on Kinetic Energy Spectra and Nonlinear Vorticity Dynamics. J. Meteorol. Res. 2019, 33, 1075–1097. [Google Scholar] [CrossRef]
- Zhang, Y.; Li, J.; Yu, R.; Zhang, S.; Liu, Z.; Huang, J.; Zhou, Y. A Layer-Averaged Nonhydrostatic Dynamical Framework on an Unstructured Mesh for Global and Regional Atmospheric Modeling: Model Description. Baseline Evaluation, and Sensitivity Exploration. J. Adv. Model. Earth Syst. 2019, 11, 1685–1714. [Google Scholar] [CrossRef]
- Ringler, T.; Ju, L.; Gunzburger, M. A multiresolution method for climate system modeling: Application of spherical centroidal Voronoi tessellations. Ocean Dyn. 2008, 58, 475–498. [Google Scholar] [CrossRef]
- Jacobsen, D.W.; Gunzburger, M.; Ringler, T.; Burkardt, J.; Peterson, J. Parallel algorithms for planar and spherical Delaunay construction with an application to centroidal Voronoi tessellations. Geosci. Model. Dev. 2013, 6, 1353–1365. [Google Scholar] [CrossRef]
- Li, X.; Zhang, Y.; Peng, X.; Li, J. Using a single column model (SGRIST1.0) for connecting model physics and dynamics in the Global-to-Regional Integrated forecast SysTem (GRIST-A20.8). Geosci. Model. Dev. Discuss. 2020, 2020, 1–28. [Google Scholar]
- Neale, R.B.; Richter, J.H.; Jochum, M. The Impact of Convection on ENSO: From a Delayed Oscillator to a Series of Events. J. Clim. 2008, 21, 5904–5924. [Google Scholar] [CrossRef]
- Zhang, G.J.; McFarlane, N.A. Sensitivity of climate simulations to the parameterization of cumulus convection in the Canadian climate centre general circulation model. Atmos.-Ocean 1995, 33, 407–446. [Google Scholar] [CrossRef]
- Park, S.; Bretherton, C.S. The University of Washington Shallow Convection and Moist Turbulence Schemes and Their Impact on Climate Simulations with the Community Atmosphere Model. J. Clim. 2009, 22, 3449–3469. [Google Scholar] [CrossRef]
- Morrison, H.; Gettelman, A. A New Two-Moment Bulk Stratiform Cloud Microphysics Scheme in the Community Atmosphere Model, Version 3 (CAM3). Part I: Description and Numerical Tests. J. Clim. 2008, 21, 3642–3659. [Google Scholar] [CrossRef]
- Mlawer, E.J.; Taubman, S.J.; Brown, P.D.; Iacono, M.J.; Clough, S.A. Radiative transfer for inhomogeneous atmospheres: RRTM. a validated correlated-k model for the longwave. J. Geophys. Res. Atmos. 1997, 102, 16663–16682. [Google Scholar] [CrossRef]
- Iacono, M.J.; Delamere, J.S.; Mlawer, E.J.; Shephard, M.W.; Clough, S.A.; Collins, W.D. Radiative forcing by long-lived greenhouse gases: Calculations with the AER radiative transfer models. J. Geophys. Res. Atmos. 2008, 113, D13. [Google Scholar] [CrossRef]
- Morcrette, J.-J.; Barker, H.W.; Cole, J.N.S.; Iacono, M.J.; Pincus, R. Impact of a New Radiation Package, McRad, in the ECMWF Integrated Forecasting System. Mon. Weather Rev. 2008, 136, 4773–4798. [Google Scholar] [CrossRef]
- Price, E.; Mielikainen, J.; Huang, B.; Huang, H.A.; Lee, T. GPU acceleration experience with RRTMG longwave radiation model. In High-Performance Computing in Remote Sensing III; SPIE: Bellingham, WA, USA, 2013; pp. 71–82. [Google Scholar]
- Zhang, H.; Nakajima, T.; Shi, G.; Suzuki, T.; Imasu, R. An optimal approach to overlapping bands with correlated k distribution method and its application to radiative calculations. J. Geophys. Res. Atmos. 2003, 108, D20. [Google Scholar] [CrossRef]
- Zhang, H.; Suzuki, T.; Nakajima, T.; Shi, G.; Zhang, X.; Liu, Y. Effects of band division on radiative calculations. Opt. Eng. 2006, 45, 016002. [Google Scholar]
- Zhou, Y.; Zhang, Y.; Li, J.; Yu, R.; Liu, Z. Configuration and evaluation of a global unstructured mesh atmospheric model (GRIST-A20.9) based on the variable-resolution approach. Geosci. Model. Dev. 2020, 13, 6325–6348. [Google Scholar] [CrossRef]
- Wei, X.; Zhang, H. Analysis of Optical Properties of Nonspherical Dust Aerosols. Acta Opt. Sin. 2011, 31, 0501002. [Google Scholar]
- Zhang, H.; Wang, Z.; Wang, Z.; Liu, Q.; Gong, S.; Zhang, X.; Shen, Z.; Lu, P.; Wei, X.; Che, H.; et al. Simulation of direct radiative forcing of aerosols and their effects on East Asian climate using an interactive AGCM-aerosol coupled system. Clim. Dyn. 2012, 38, 1675–1693. [Google Scholar] [CrossRef]
- Nakajima, T.; Tsukamoto, M.; Tsushima, Y.; Numaguti, A.; Kimura, T. Modeling of the radiative process in an atmospheric general circulation model. Appl. Opt. 2000, 39, 4869–4878. [Google Scholar] [CrossRef] [PubMed]
- Lu, P.; Zhang, H.; Li, J. Correlated k-Distribution Treatment of Cloud Optical Properties and Related Radiative Impact. J. Atmos. Sci. 2011, 68, 2671–2688. [Google Scholar] [CrossRef]
- Fu, Q. An Accurate Parameterization of the Solar Radiative Properties of Cirrus Clouds for Climate Models. J. Clim. 1996, 9, 2058–2082. [Google Scholar] [CrossRef]
- Yang, P.; Wei, H.; Huang, H.-L.; Baum, B.A.; Hu, Y.X.; Kattawar, G.W.; Mishchenko, M.I.; Fu, Q. Scattering and absorption property database for nonspherical ice particles in the near-through far-infrared spectral region. Appl. Opt. 2005, 44, 5512–5523. [Google Scholar] [CrossRef]
- Baum, B.A.; Heymsfield, A.J.; Yang, P.; Bedka, S.T. Bulk Scattering Properties for the Remote Sensing of Ice Clouds. Part I: Microphysical Data and Models. J. Appl. Meteorol. 2005, 44, 1885–1895. [Google Scholar] [CrossRef]
- Jing, X.; Zhang, H.; Peng, J.; Li, J.; Barker, H.W. Cloud overlapping parameter obtained from CloudSat/CALIPSO dataset and its application in AGCM with McICA scheme. Atmos. Res. 2016, 170, 52–65. [Google Scholar] [CrossRef]
- Jing, X.; Zhang, H.; Satoh, M.; Zhao, S. Improving Representation of Tropical Cloud Overlap in GCMs Based on Cloud-Resolving Model Data. J. Meteorol. Res. 2018, 32, 233–245. [Google Scholar] [CrossRef]
- Ebert, E.E.; Curry, J.A. A parameterization of ice cloud optical properties for climate models. J. Geophys. Res. Atmos. 1992, 97, 3831–3836. [Google Scholar] [CrossRef]
- Slingo, A. A GCM Parameterization for the Shortwave Radiative Properties of Water Clouds. J. Atmos. Sci. 1989, 46, 1419–1427. [Google Scholar] [CrossRef]
- Hong, G.; Yang, P.; Baum, B.A.; Heymsfield, A.J.; Xu, K.-M. Parameterization of Shortwave and Longwave Radiative Properties of Ice Clouds for Use in Climate Models. J. Clim. 2009, 22, 6287–6312. [Google Scholar] [CrossRef]
- Yuan, J.; Fu, Q.; McFarlane, N. Tests and improvements of GCM cloud parameterizations using the CCCMA SCM with the SHEBA data set. Atmos. Res. 2006, 82, 222–238. [Google Scholar] [CrossRef]
- Li, J.; Peng, X.; Li, X.; Lin, Y.; Chu, W. Evaluation of a Flexible Single Ice Microphysics and a Gaussian Probability-Density-Function Macrophysics Scheme in a Single Column Model. Atmosphere 2021, 12, 638. [Google Scholar] [CrossRef]
- Zhang, Y.; Yu, R.; Li, J.; Li, X.; Rong, X.; Peng, X.; Zhou, Y. AMIP Simulations of a Global Model for Unified Weather-Climate Forecast: Understanding Precipitation Characteristics and Sensitivity Over East Asia. J. Adv. Model. Earth Syst. 2021, 13, e2021MS002592. [Google Scholar] [CrossRef]
- Wild, M. The global energy balance as represented in CMIP6 climate models. Clim. Dyn. 2020, 55, 553–577. [Google Scholar] [CrossRef]


| Old (RRTMG) | New (BCC-RAD) | |
|---|---|---|
| Absorbing gases in LW | H2O, CO2, and O3 CH4, N2O, CFC11, CFC12, CFC22, CCL4 [33] | H2O, CO2, and O3 CH4, N2O, CFC11, CFC12, CFC22 |
| Absorbing gases in SW | H2O, CO2, O3, and O2 | H2O, CO2, O3, N2O, and O2 |
| Range of LW | 10–3250 cm−1 [30] | 10–2680 cm−1 |
| Range of SW | 2600–50,000 cm−1 | 2110–49,000 cm−1 |
| Band transmittance scheme | CKD scheme | CKD scheme |
| Cloud optics | LW: emissivity formulations [46]; SW: formulas of Slingo [47] for liquid and of Ebert and Curry [46] for ice | Ice cloud: computed using data from Fu [41], Yang et al. [42], and Hong et al. [48] |
| Cloud overlap | McICA with Maximum-Random overlap | McICA with observation-based e-folding overlap |
| ARM97 | TWP06 | |
|---|---|---|
| Location | 36.605° N, 97.485° W | 12.425° S, 130.891° E |
| Observation period | from 18 June to 19 July 97 | from 18 January to 13 February 2006 |
| Simulation period | From 19 June to 28 June 1997 | from 18 January to 27 January 2006 |
| Time resolution | 1 h | |
| Model time step | 1200 s | |
| Vertical layer number | 30 | |
| Group 1 | Group 2 | |
|---|---|---|
| Physics parameterization scheme | PhysC | PhysCN |
| Radiation scheme | RRTMG | |
| BCC-RAD | ||
| Simulation period | 2011–2020 (monthly average) | |
| Horizontal resolution | G6 (120 km) | |
| Time step | 1200 s | |
| Vertical layer number | 30 | |
| Variable Name 1 | RRTMG (PhysC) | BCC-RAD (PhysC) | RRTMG (PhysCN) | BCC-RAD (PhysCN) | OBS | CMIP6 |
|---|---|---|---|---|---|---|
| CLDTOT (%) | 55.30 | 58.33 | 59.84 | 62.18 | 67.37 | 63.96 |
| SWCF (W/m−2) | −52.70 | −54.07 | −42.04 | −39.17 | −45.11 | −47.80 |
| LWCF (W/m−2) | 19.41 | 16.38 | 23.28 | 23.79 | 25.61 | 24.10 |
| FSWT (W/m−2) | 236.61 | 238.44 | 247.41 | 253.75 | 240.47 | −239.50 |
| FSWTC (W/m−2) | 289.34 | 292.51 | 289.48 | 292.93 | 286.81 | 287.30 |
| FLWT (W/m−2) | −241.00 | −249.53 | −238.51 | −245.33 | 239.24 | 238.30 |
| FLWTC (W/m−2) | −260.42 | −266.09 | −261.79 | −269.30 | −266.08 | −262.40 |
| TOA NET (W/m−2) | −4.40 | −11.09 | 8.90 | 8.42 | 1.23 | −5.50 |
| FSWS (W/m−2) | 161.82 | 161.21 | 173.06 | 174.08 | 164.24 | 163.40 |
| FSWSC (W/m−2) | 219.13 | 220.95 | 218.93 | 220.63 | 212.10 | 214.60 |
| FLWS (W/m−2) | −51.63 | −57.71 | −54.65 | −57.84 | −53.92 | −56.20 |
| FLWSC (W/m−2) | −78.10 | −86.05 | −77.50 | −84.51 | −81.12 | −81.70 |
| SFC NET (W/m−2) | 110.19 | 103.50 | 118.41 | 116.24 | 110.32 | 107.20 |
| IWC (mg/kg) | 0.73 | 0.75 | (5.92) 3 | (5.84) 3 | 1.55 2 (4.46) 2, 3 | - |
| LWC (mg/kg) | 5.40 | 5.62 | 4.52 | 4.79 | 4.37 2 | - |
| SFC TEMP (K) | 288.40 | 287.82 | 288.84 | 288.68 | 279.35 2 | - |
| PRECT (mm) | 3.11 | 3.13 | 2.92 | 2.92 | 2.44 2 | - |
Disclaimer/Publisher’s Note: The statements, opinions and data contained in all publications are solely those of the individual author(s) and contributor(s) and not of MDPI and/or the editor(s). MDPI and/or the editor(s) disclaim responsibility for any injury to people or property resulting from any ideas, methods, instructions or products referred to in the content. |
© 2024 by the authors. Licensee MDPI, Basel, Switzerland. This article is an open access article distributed under the terms and conditions of the Creative Commons Attribution (CC BY) license (https://creativecommons.org/licenses/by/4.0/).
Share and Cite
Yuan, C.; Zhang, H.; Jing, X.; Zhao, S.; Li, X. Impact of a New Radiation Scheme on Simulated Climate in the Global–Regional Integrated SysTem Model under Varying Physical Parameterization Schemes. Atmosphere 2024, 15, 501. https://0-doi-org.brum.beds.ac.uk/10.3390/atmos15040501
Yuan C, Zhang H, Jing X, Zhao S, Li X. Impact of a New Radiation Scheme on Simulated Climate in the Global–Regional Integrated SysTem Model under Varying Physical Parameterization Schemes. Atmosphere. 2024; 15(4):501. https://0-doi-org.brum.beds.ac.uk/10.3390/atmos15040501
Chicago/Turabian StyleYuan, Chang, Hua Zhang, Xianwen Jing, Shuyun Zhao, and Xiaohan Li. 2024. "Impact of a New Radiation Scheme on Simulated Climate in the Global–Regional Integrated SysTem Model under Varying Physical Parameterization Schemes" Atmosphere 15, no. 4: 501. https://0-doi-org.brum.beds.ac.uk/10.3390/atmos15040501