Article

Study on the Water Supply and the Requirements, Yield, and Water Use Efficiency of Maize in Heilongjiang Province Based on the AquaCrop Model

1
School of Water Conservancy and Electric Power, Heilongjiang University, Harbin 150080, China
2
School of Water Conservancy and Civil Engineering, Northeast Agricultural University, Harbin 150030, China
3
Key Laboratory of Agricultural Water Resource Use, Ministry of Agriculture, Harbin 150030, China
4
College of Hydraulic and Environmental Engineering, China Three Gorges University, Yichang 443002, China
5
College of Ecology and Environment, Hainan University, Haikou 570208, China
6
Xingtai Hydrographic Survey and Research Center of Hebei Province, Xingtai 054000, China
*
Author to whom correspondence should be addressed.
Submission received: 23 July 2021 / Revised: 12 September 2021 / Accepted: 24 September 2021 / Published: 27 September 2021

Abstract

:
Agricultural irrigation depends heavily on freshwater resources. Under the context of increasingly severe water shortages, studying the relationship among crop water requirements (ETc), actual crop evapotranspiration (ETa), irrigation water requirements (Ir), yield, and water use efficiency (WUE) would be beneficial to improve the agricultural application of irrigation water. Based on the daily data of 26 meteorological stations in Heilongjiang Province from 1960 to 2015, this study used the calibrated AquaCrop model to calculate the ETc, ETa, Ir, and yield of maize (Zea mays L.) in different hydrological years (extremely dry years, dry years, normal years, and wet years) along with WUE to evaluate the mass of yield produced per unit mass of crop evapotranspiration (ET) under rainfed and irrigated scenarios. The results showed that ETc and ETa decreased first and then increased from the west to the east during the four types of hydrological years. Ir exhibited a decreasing trend from the west to the east. Compared with the irrigation scenario, the rainfed scenario’s average yield only decreased by 2.18, 0.55, 0.03, and 0.05 ton/ha, while the WUE increased by 0.32, 0.4, 0.33, and 0.21 kg/m3 in the extremely dry years, dry years, normal years, and wet years, respectively. The results indicated that in the normal and wet years, the WUE was high in the central regions, and irrigation did not significantly increase yield; further, we determined that irrigation should not be considered in these two hydrological years in Heilongjiang Province. In the extremely dry and dry years, irrigation was necessary because it increased the yield, even though the WUE decreased. This study provides a theoretical basis for studying the regional irrigation schedule in Heilongjiang Province.

1. Introduction

At present, the shortage of freshwater is regarded as one of the most critical global problems by scientists, policymakers, and even the general public [1]. According to an analysis of global water scarcity, two-thirds of the world’s population will be affected by water scarcity in the next few decades. Water shortages in developing countries are also attributable to water distribution, poor management, and the inherent injustices and inequities of water distribution [2]. Agricultural water accounts for 70–75% of the total freshwater extracted. The available agricultural resources and the narrowing yield gaps of all crops play a crucial role in providing sufficient food for the rapidly growing global population [3]. According to Food and Agriculture Organization (FAO) projections, food production in irrigated areas will need to be increased by more than 50% by 2050, but only a 10% increase in water withdrawal for agriculture will be possible [4]. In addition, the large amount of agricultural irrigation has led to a rapid decline in the groundwater level over the past 20 years [5]. Some areas have experienced severe land subsidence, salt intrusion near the coast, degradation of ecosystems, and deterioration of groundwater quality [5].
Promoting sustainable agriculture, increasing crop productivity, and ensuring the effective management of limited water resources are indispensable for increasing global food production [6]. Maize (Zea mays L.) is one of the most important global food sources, accounting for 30% of the world’s total grain production [7,8]. As the world’s population continues to grow, by 2050, maize yield needs to increase by 66% to meet global demands [9]. As one of the arid countries, China is also the second-largest maize-producing country. Arid and semi-arid regions in the north of China make up 30% of the national land area but have less than 20% of total national available water resources because precipitation is low and evapotranspiration is high [10,11,12]. Using precipitation resources reasonably may become one of the fastest and most effective ways to alleviate water shortages and reduce unnecessary irrigation [7,13]. Moreover, numerous studies have shown a correlation between crop yields and water consumption in arid regions, as precipitation and crop adaptability directly impact the precipitation use efficiency of crops, thereby affecting crop yields [13,14,15]. In the north of China, droughts occur in maize growing stages frequently; in dry years, irrigation alleviates the reduction in maize production, while in wet years, precipitation meets maize water requirements [16]. Therefore, in order to explore the difference between maize under rainfed and irrigation scenarios, make full use of precipitation to reduce irrigation water requirements (Ir), study on maize evapotranspiration (ET) and yield may provide a basis for the regional balance on irrigation and rainfed.
As a significant component of the regional and global hydrological cycle, crop water requirements (ETc) play an essential role in evaluating related Ir and crop water stress in agricultural ecosystems [17]. Exploring the relationship between ETc and Ir will help maximize the use of rain resources and optimize the allocation of regional water resources. As precipitation directly affects the ETc, actual crop evapotranspiration (ETa), and Ir values of different crops, for maize, the precipitation in normal years and wet years can almost meet the ETa, and irrigation is only required in dry years. However, irrigation significantly increases the wheat yield in semi-arid areas [18]. Irmak indicated that in maize growing season, there was an ununiform temporal distribution of precipitation, resulting in greater ETc or ETa losses. In these circumstances, full irrigation has a higher yield than rainfed [19]. In semi-arid China, irrigation could alleviate crop ETa losses which are caused by the uneven distribution of precipitation, and in a dry year, irrigation would be more efficient to crop growth than in a wet year, though irrigation appears valuable in a wet year [20]. The relationship among ETc, ETa, and Ir varies depending on the crop, region, precipitation amounts, and distribution patterns, especially the changes in effective precipitation that affect ETa, ETc, and Ir [21].
Water use efficiency (WUE) can be used to assess the relationship between water and crop yields. Many studies have used WUE to evaluate the practicality of irrigation management (rainfed, limited, or full irrigation). Crops in the northern Republic of Serbia are largely grown under rainfed conditions; due to the high variability of regional precipitation, and low crop yields are closely related to insufficient precipitation [22]. In Vojvodina, WUE was found to be higher during dry and normal years than during wet years. Moreover, lower WUE and higher yields were found for fully irrigated treatments compared to rainfed treatments [23]. In arid areas, to increase crop yields and WUE, irrigation at a fixed time is more effective than rainfed irrigation [24]. A previous study showed that crop WUE increased with an increase in irrigation until the additional irrigation no longer produced additional yield [25]. Moreover, because of differences in regional environmental conditions and seasonal precipitation fluctuations, irrigation may not improve WUE and yield continuously [26]. In eastern China, especially during dry years with little precipitation, rainfed farming provides insufficient water to crops, and irrigation is needed to reduce yield loss [27]. In the case of seasonal precipitation fluctuations and large inter-annual differences in precipitation, WUE provides a theoretical basis for regional water consumption and changes in the irrigation schedule under different circumstances.
The above factors underscore the need to identify irrigation patterns under rainfed and irrigated scenarios to maximize the utilization of available resources and improve productivity. However, due to time, funding, and resource constraints, it is not feasible to evaluate large combinations of various crop management options under field scenarios in many different regions and environmental contexts. To solve this issue, AquaCrop, as a fully tested, calibrated, and validated crop model, can be used to evaluate factors affecting maize yield and WUE [28]. López-Urrea et al. noted that AquaCrop correctly simulates the evolution of the harvest index, canopy cover (CC), ETa, ETc, yield, and aboveground biomass and is a better model than MOPECO for assessing the impact of a specific irrigation system on crops [29]. Nader Pirmoradian et al. found that AquaCrop can accurately simulate the Ir of a crop in wet, normal, and dry years [30]. Heng et al. further concluded that FAO’s AquaCrop is an excellent crop growth model for designing and evaluating water management plans and studying the soil types and sowing dates of crops under rainfed or irrigated scenarios. The model was found to correctly simulate ET and production, and the measured and simulated values of WUE showed a high degree of fit [27]. However, when this model is implemented for practical purposes, it is necessary to use field measurements from different climate regions to verify the model under water-management scenarios to ensure the model’s accuracy, as well as its potential limitation. Therefore, it is necessary to carefully test, calibrate, and validate the model for specific locations when simulating crop yields [31].
Heilongjiang Province is one of the main grain-producing areas [32]. As the main food crop, maize is a widely planted crop, and its planting area is increasing year by year. As of 2016, the planting area of maize was 7.72 × 10⁶ hm2, accounting for 52.2% of the province’s crop planting area, and its yield was 3.544 × 10⁷ t, accounting for 56% of the province’s grain [33]. The East Asian summer monsoon controls precipitation in Heilongjiang Province, where the ETc and irrigation are different over time and space [34]. Therefore, it is necessary to quantify the ETc and Ir of maize, clarify the temporal and spatial changes and trends of ETc and Ir, and determine the irrigation management methods necessary for different places and hydrological years. This assessment will provide essential information for irrigation strategies and sustainable water management to adapt to climate change in the region.
The purposes of this study were to (1) quantify the ETc, ETa, Ir, and yield of maize over four hydrological years in Heilongjiang Province (from 1960 to 2015) using AquaCrop; (2) clarify the temporal and spatial distribution of ETc and ETa in the growing seasons of maize; (3) determine the temporal and spatial variations in yield and WUE under irrigation and rainfed scenarios; and (4) further reveal the effects of rainfed and irrigated scenarios on the Ir and WUE of maize.

2. Materials and Methods
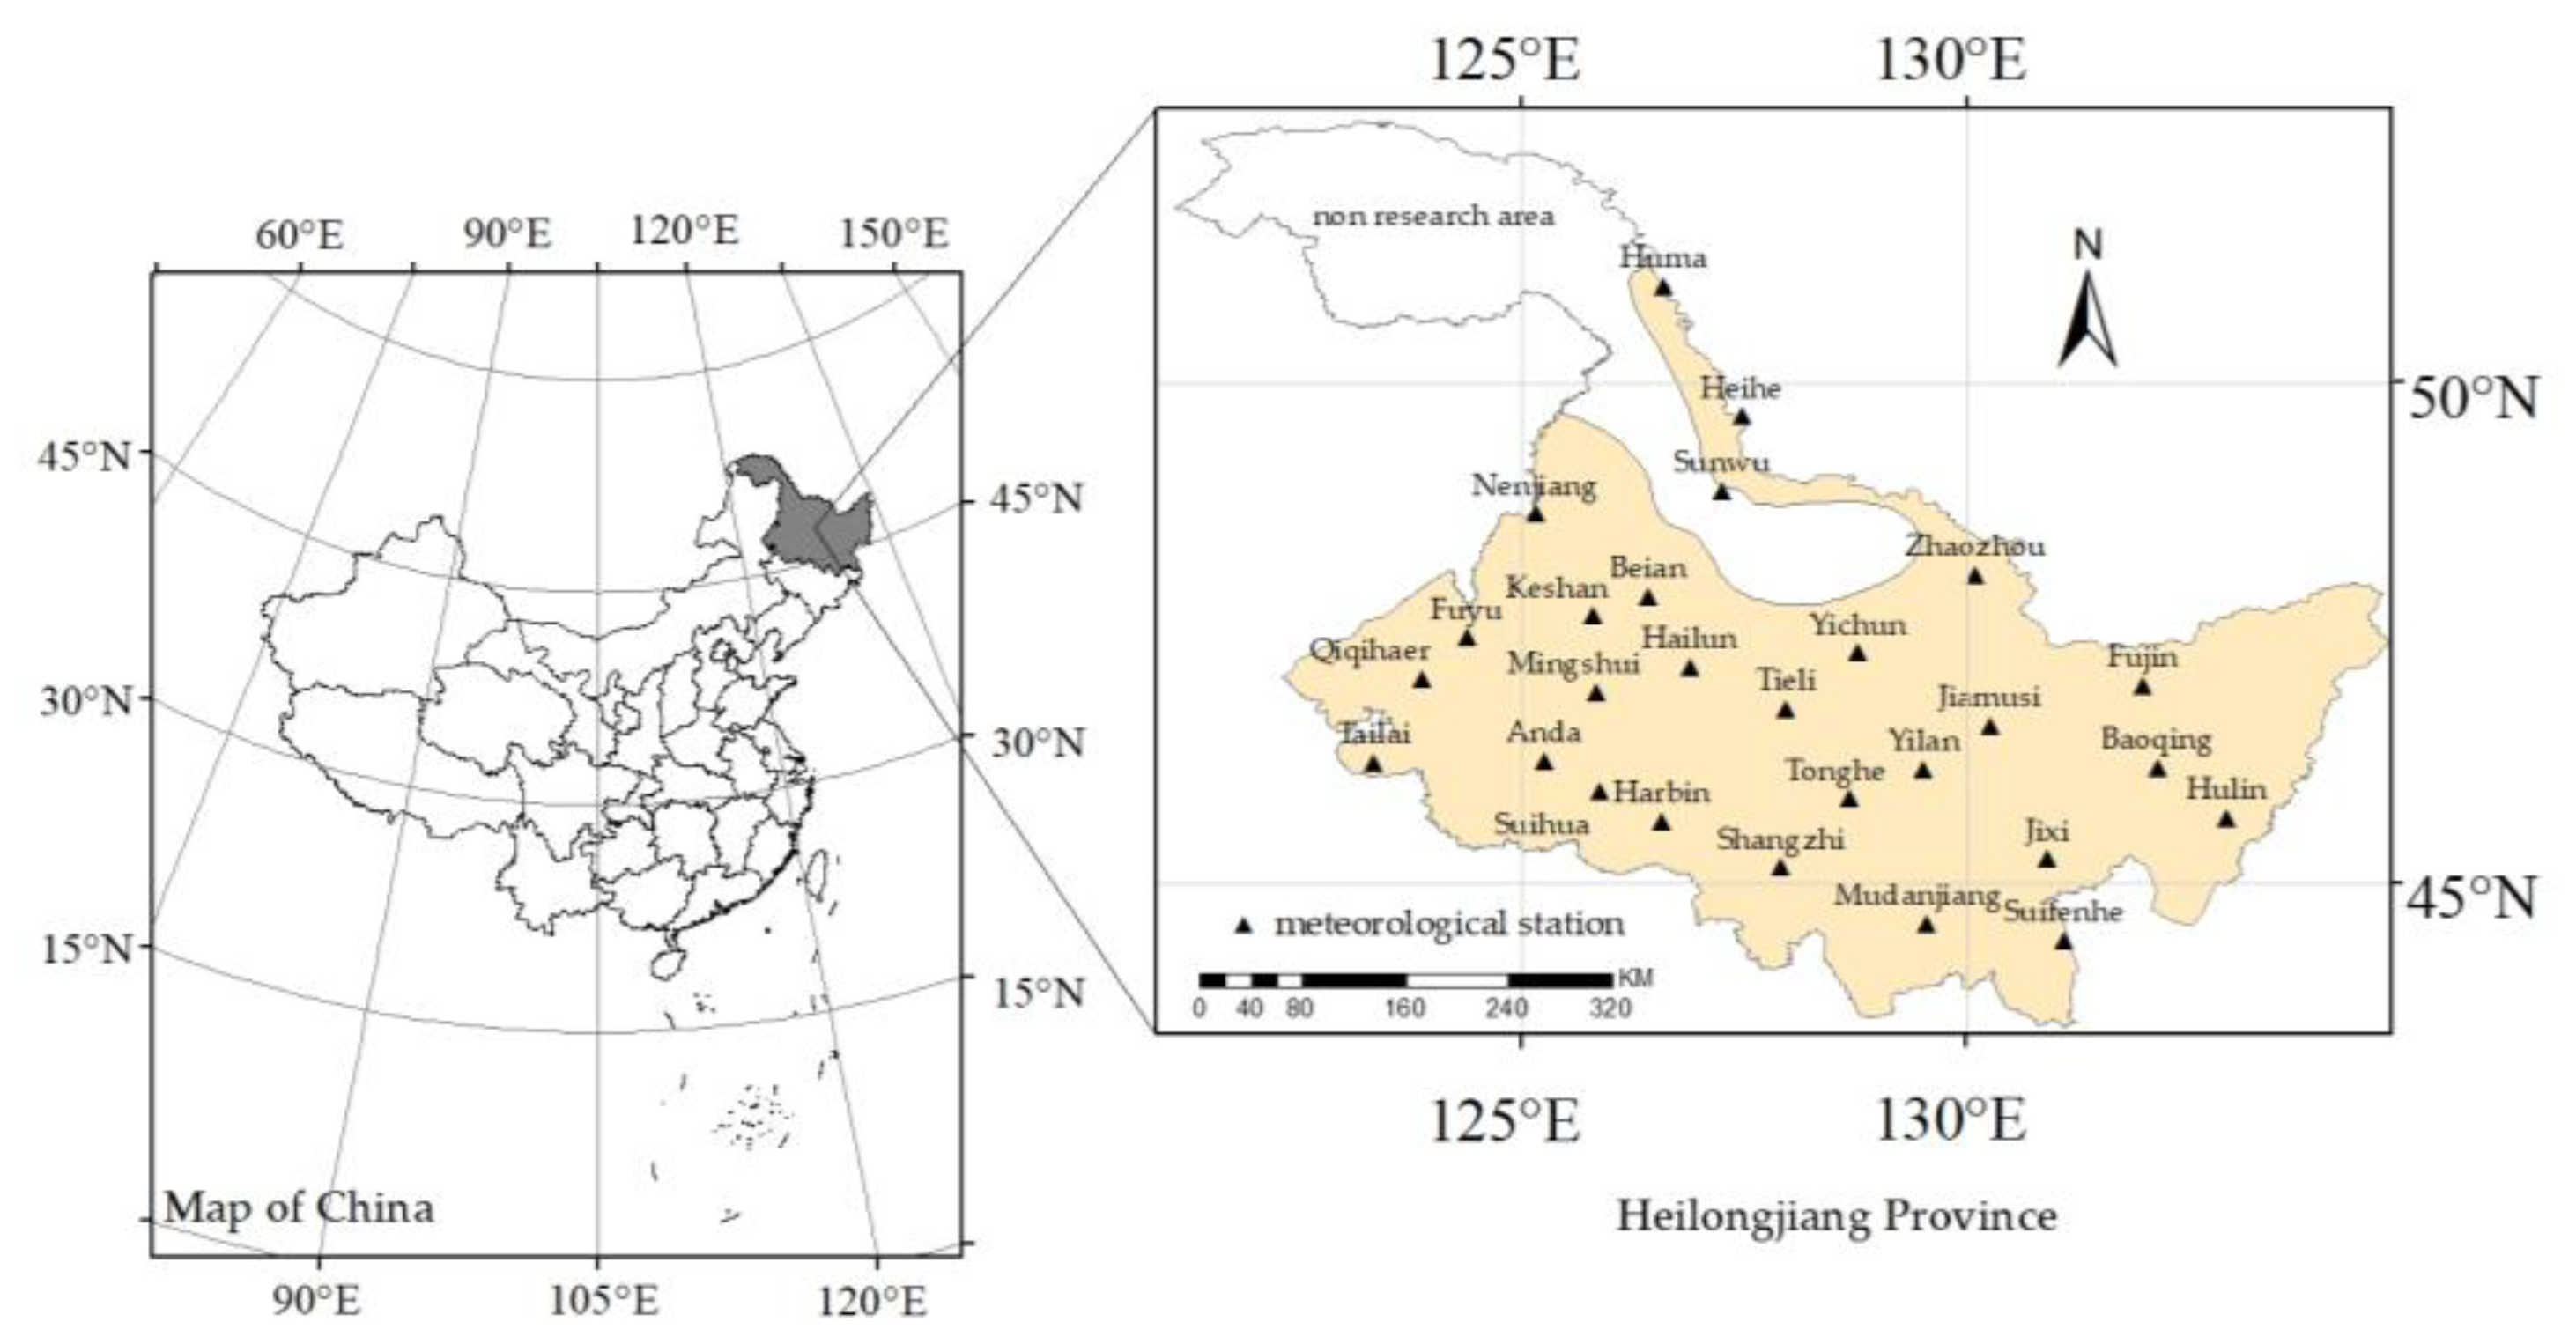
2.1. Study Area

This paper used the daily meteorological data from 26 stations in Heilongjiang Province from 1960 to 2015, including the maximum air temperature, minimum air temperature, average relative humidity, average wind speed, sunshine duration, precipitation, and longitude and latitude information of each station. All the above data were obtained from the China Meteorological Data Network (http://data.cma.cn, accessed on 22 July 2021), and the CO2 data were obtained from the UK Greenhouse Gas Emissions database (https://www.gov.uk, accessed on 22 July 2021). Figure 1 shows the study area and the distribution of the site. Due to the different geographical locations of the meteorological stations in Heilongjiang Province, each station’s division of annual accumulated temperature is different. According to the Heilongjiang Provincial Agricultural Commission’s reports, “Heilongjiang Crop Variation Accumulative Temperature Zone” [35] and “Area Layout Planning of High-quality and High-yield Main Food Crops in Heilongjiang Province in 2015” [36], the sixth accumulative temperature zone is not suitable for maize planting. Therefore, the sixth temperature accumulation zone was not studied in this paper.

2.2. Sources of Experimental Data

Data from three field experiments investigating maize planted in Heilongjiang Province, China, were used for the model calibration and verification (Table 1). The first experimental area was located at the Heilongjiang Province Hydraulic Research Institute, Harbin. The areas used for the second and third experiments were located at the Institute of Water Resources Science and Agricultural Technology Extension Center, Zhaozhou County, Daqing city [37,38,39].

2.3. AquaCrop Model Principle

2.3.1. AquaCrop Model Description

The weather model included precipitation, reference crop evapotranspiration(ET0), CO2, and maximum air temperature, minimum air temperature, and daily ET0 was calculated by the Penman–Monteith equation recommended by the FAO [40,41]. The crop model included crop growth, development, senescence, and yield. The management submodels included irrigation and field management practices; the soil models included soil and water balance management. The four main production processes were simulated using a daily time step and included crop development, transpiration (Tr), aboveground biomass production, and yield.
First, we used the green canopy cover (CC) in AquaCrop to simulate crop growth, development, and aging. CC was then used in conjunction with ET0 and the transpiration coefficient (KcTr) to calculate transpiration. Similarly, soil evaporation was calculated using the soil evaporation coefficient, CC, and ET0 [31].

2.3.2. From the Ky Approach to the AquaCrop Model

The yield response to water (Ky) is used here to describe the relationship between crop yield and water stress due to the insufficient water supply by precipitation or irrigation during the growing period. In FAO.33, an empirical production function is used to assess the yield response to water [42]:
1 Y Y x = K y 1 E T E T x
where Yx (ton/ha) and Y (ton/ha) are the maximum and actual yield, and (1 − Y/Yx) is the relative yield decline. ETx (mm) and ET (mm) are the maximum and actual evapotranspiration, (1 − ET/ETx) is the relative water stress, and Ky is the proportionality factor between the relative yield decline and relative reduction in ET. When Ky > 1: crop response is very sensitive to water deficit with proportional larger yield reductions when water use is reduced because of stress. When Ky < 1: crop is more tolerant to water deficit and recovers partially from stress, exhibiting less than proportional reductions in yield with reduced water use. When Ky = 1: yield reduction is directly proportional to reduced water use.

2.3.3. Evapotranspiration and Yield

This model estimates transpiration and yield by establishing canopy growth and senescence models. For our study, ETc was divided into transpiration and evaporation components to avoid the impact of the unproductive consumption (evaporation) of water [43,44,45]. Under the rainfed scenario, crops may be subjected to water stress, in which case, the crop evapotranspiration is ETa. The Formulas (2) and (3) in AquaCrop for calculating crop transpiration (Tr, mm/ day), soil evaporation (E, mm/day), and final grain yield (Y, ton/ha) are as follows [46]:
T r = K s K s Tr K c T r , x C C * E T 0
E = K r ( 1 C C * ) K ex E T 0
Y = f H I H I 0 B
where CC* is the actual canopy cover (%) adjusted for micro-advective effects, Ks is the crop coefficient, and KsTr is temperature stress. KcTr,x is the maximum standard crop transpiration coefficient (dimensionless), ET0 is the grass-reference evapotranspiration (mm/day), Kr is the evaporation reduction coefficient used to adjust for the effect of insufficient water in the topsoil layer, Kex is the maximum soil evaporation coefficient, fHI is the adjustment factor for water stresses, HI0 is the reference harvest index, and B is the aboveground dry biomass (ton/ha).

2.4. Scenario Setting and Maize Irrigation Water Requirements

In this study, we developed two scenarios to explore the changes in irrigation water supply and the requirements and yield of maize in Heilongjiang Province:
  • Rainfed: The distribution of precipitation in Heilongjiang Province was uneven over the four seasons. Past studies showed that the distribution of precipitation in Heilongjiang Province has decreased in recent decades and that most of the maize planting in this region relies on rainfed farming [35]. The rainfed scenario involves the use of precipitation alone, without irrigation.
  • Irrigation: In this study, irrigation without a water shortage was used to compare the differences in maize ETa, ETc, Ir, yield, and WUE between the rainfed and irrigated scenarios. In the AquaCrop model, irrigation management was achieved through irrigation timing and the number of irrigation events during the crop growing season. In the irrigation scenario, maize was considered fully irrigated when the soil water content reached 80% field capacity, with 100% field capacity achieved by the end of the day to restore root zone moisture.

2.5. AquaCrop Model Data and Evaluation

The AquaCrop model provides default parameters for maize, but these default parameters cannot sufficiently reflect ETa, ETc, and yield during maize growing stages when used; the default parameters need to be verified (Table 2). The calibration procedure followed the guidelines outlined in the AquaCrop Reference Manual and FAO Irrigation and Drainage Document No.66, Crop Yield Responses to Water [46]. The experiments used for calibration and verification are shown in Table 1.
The output of the AquaCrop model compared to the field measurements was assessed using both qualitative and quantitative approaches. The qualitative approach involved the use of graphical interpretations of the results to evaluate the trends in simulated and measured data. The quantitative approach consisted of using statistical indicators such as the root mean square error (RMSE), the normalized root mean square error (NRMSE), the Nash–Sutcliffe model efficiency coefficient (EF), the coefficient of determination (R2), and Willmott’s index of agreement (d).
The RMSE measures the magnitude of difference between simulated and observed values and ranges from 0 to positive infinity, with 0 indicating good model performance and positive infinity indicating poor model performance [47]:
R M S E = i = 1 n S i   M i 2 n
N R M S E = 100 RMSE O ¯
where Mi and Si (i = 1, 2, …, n) represent the measured and simulated values, and O ¯ is the average of the measured values. If NRMSE < 10%, the verification is considered to have a high degree of fit. If the NRMSE is between 10% and 20%, the fit is deemed good. If the NRMSE is between 20 and 30%, the verification is considered acceptable in terms of goodness-of-fit. If the value is greater than 30%, the verification fit is assumed to be poor [48].
The EF (ranging from 1 to negative infinity) determines the relative size of the residual value and the degree of fit between the observed data and the simulated data. An EF close to 1 indicates that the residual value is small and that the model offers a reasonable simulation. R2 is the coefficient of determination (goodness-of-fit). The better the goodness-of-fit, the higher the independent variable’s explanation for the dependent variable [49]. Here, d ranges from 0 to 1, indicating that the model performance is better when d is close to 1. The calculation formula is as follows:
E F   = 1 i = 1 n ( S i   M i ) 2 i = 1 n ( M i   M ¯ ) 2
d = 1   i = 1 n ( S i   O i ) 2 i = 1 n S i   -   O i + O i O ¯ 2
where M ¯ represents the mean value, and R2 and EF are used to quantify the predictive ability of the model, while the RMSE represents the model prediction error.

2.6. Division of Hydrological Years

The precipitation during the maize growing season at different sites levels from 1960 to 2015 was arranged in decreasing order of magnitude. Formula (9) was used to calculate the empirical frequency and draw the logarithmic normal distribution map to obtain the precipitation, precipitation values at Fa = 95%, 75%, 50%, 25% probability were defined as extremely dry year, dry year, normal year, and wet year [50] The average precipitation during the maize growing season in extremely dry, dry, normal, and wet year were 256.1, 333.6, 410.4, 487.9 mm in Heilongjiang Province. The precipitation varies in different regions, but we strictly follow the formula:
F a = 100 m n + 1
where Fa is the empirical frequency of m items in the observation series, m is the sequence number of the observation series arranged from large to small, and n is the number of years in the observation series.

2.7. Water Use Efficiency

Increasing crop WUE is the key to increasing agricultural productivity under limited water resources. WUE refers to the amount of assimilated matter produced per unit of water consumed during crop production, reflecting the relationship between the yield and ET of crops [37]. The calculation method is as follows:
W U E = Y E T
where WUE is expressed in kg/m3 based on units of water volume, ET is evapotranspiration (mm), and Y is grain yield (ton/ha).

2.8. Data Processing

In this paper, we used the spatial analysis function of ArcMap 10.5 toolbox to interpolate the spatial distribution maps of ETc, ETa, Ir, yield, and WUE in different hydrological years.

3. Results

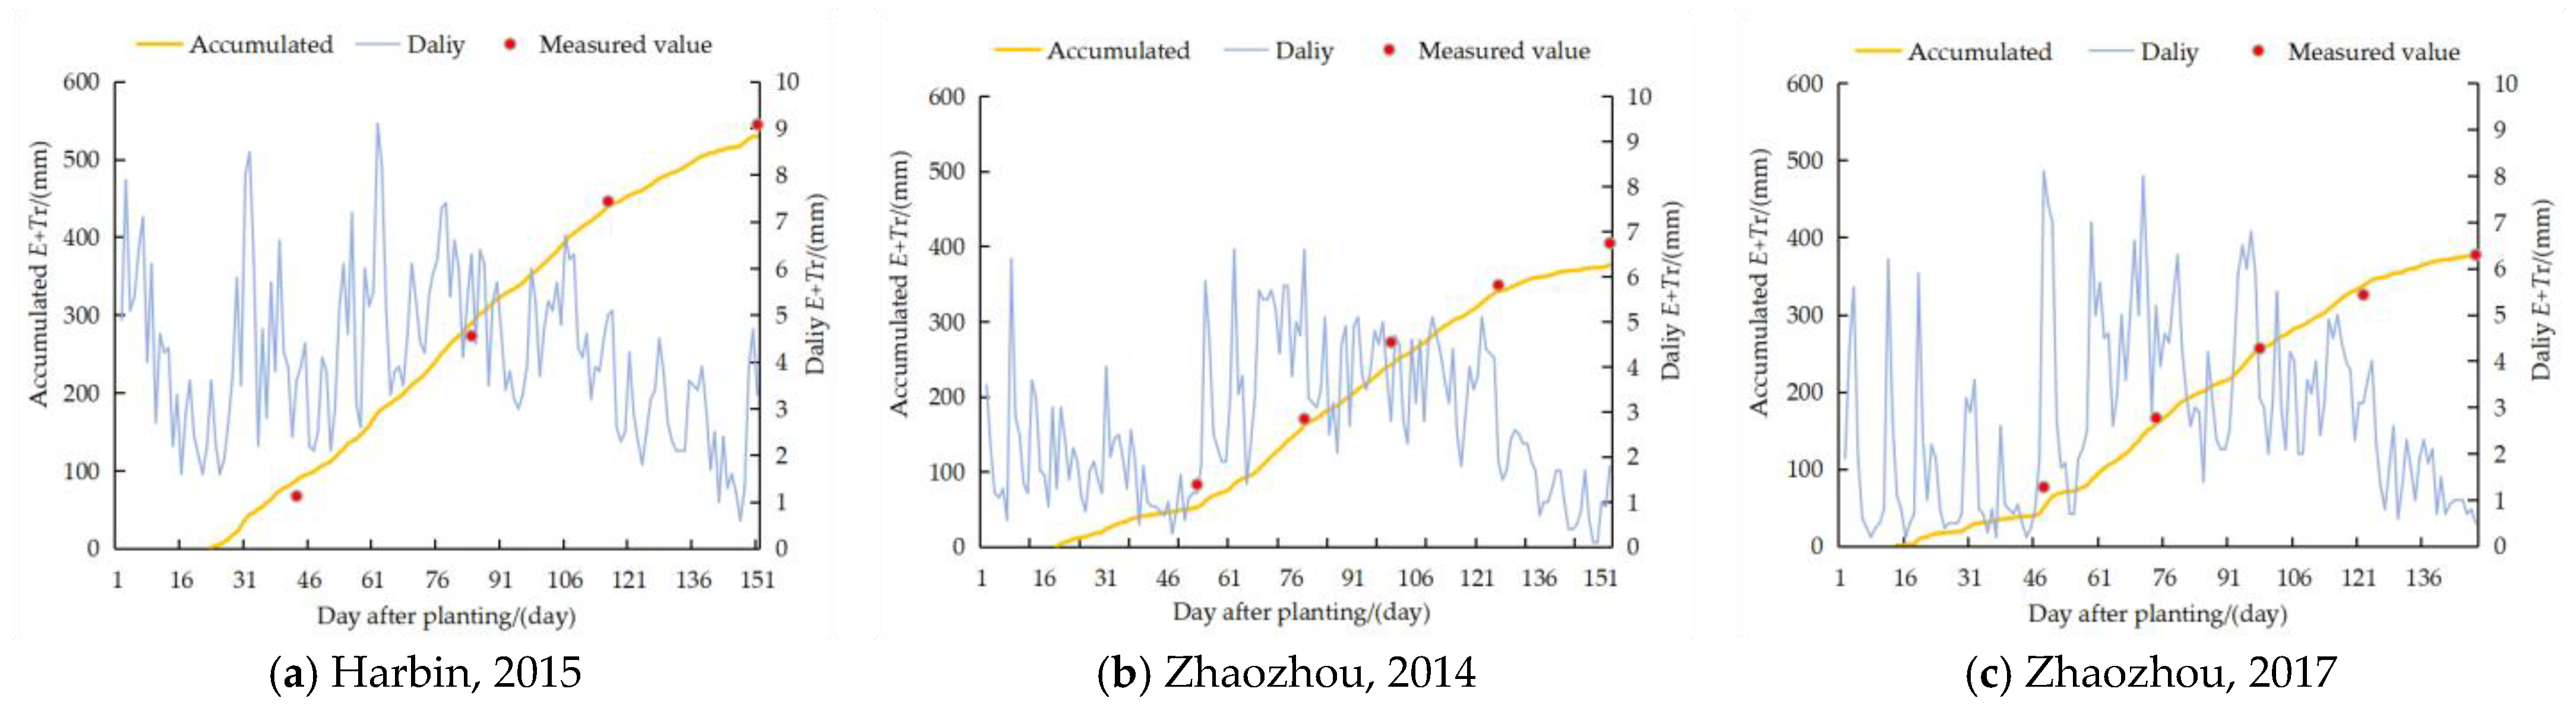
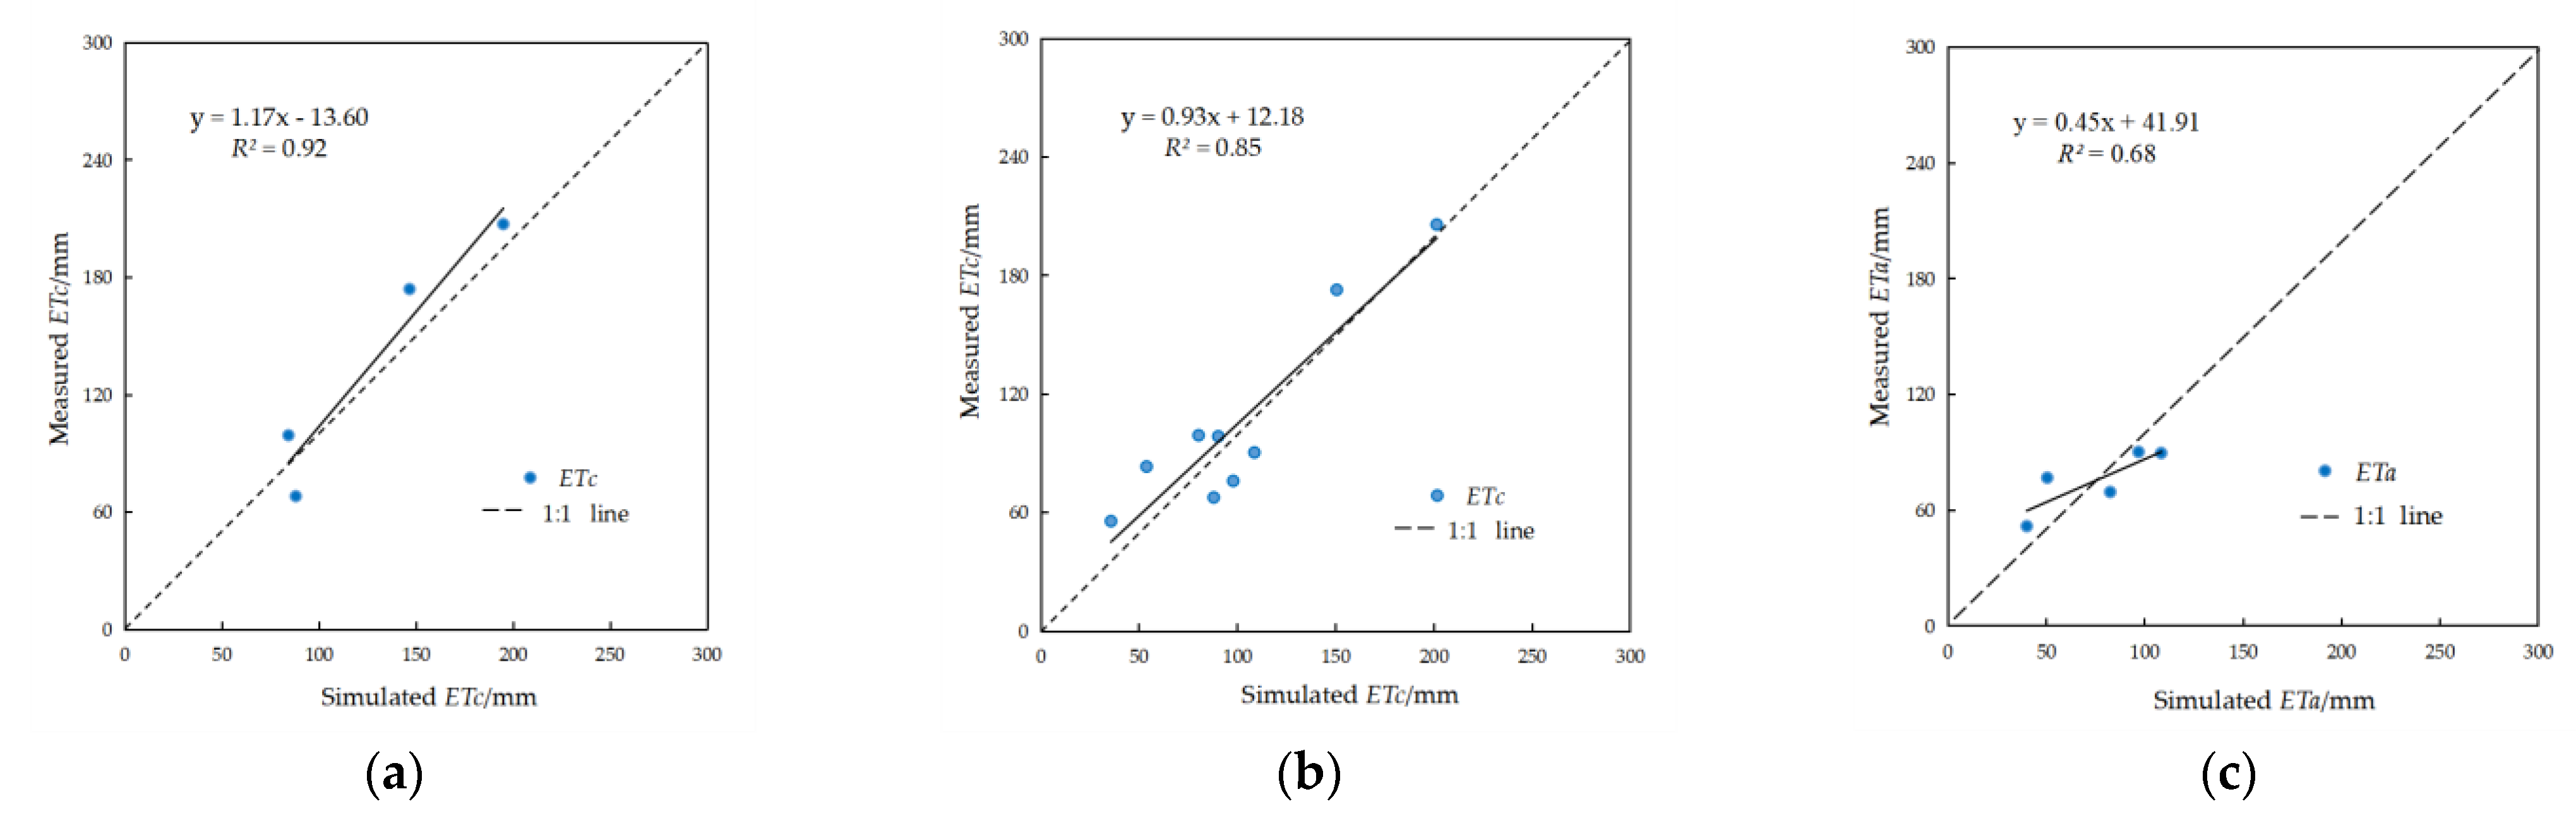
3.1. Calibration and Verification of the AquaCrop Model

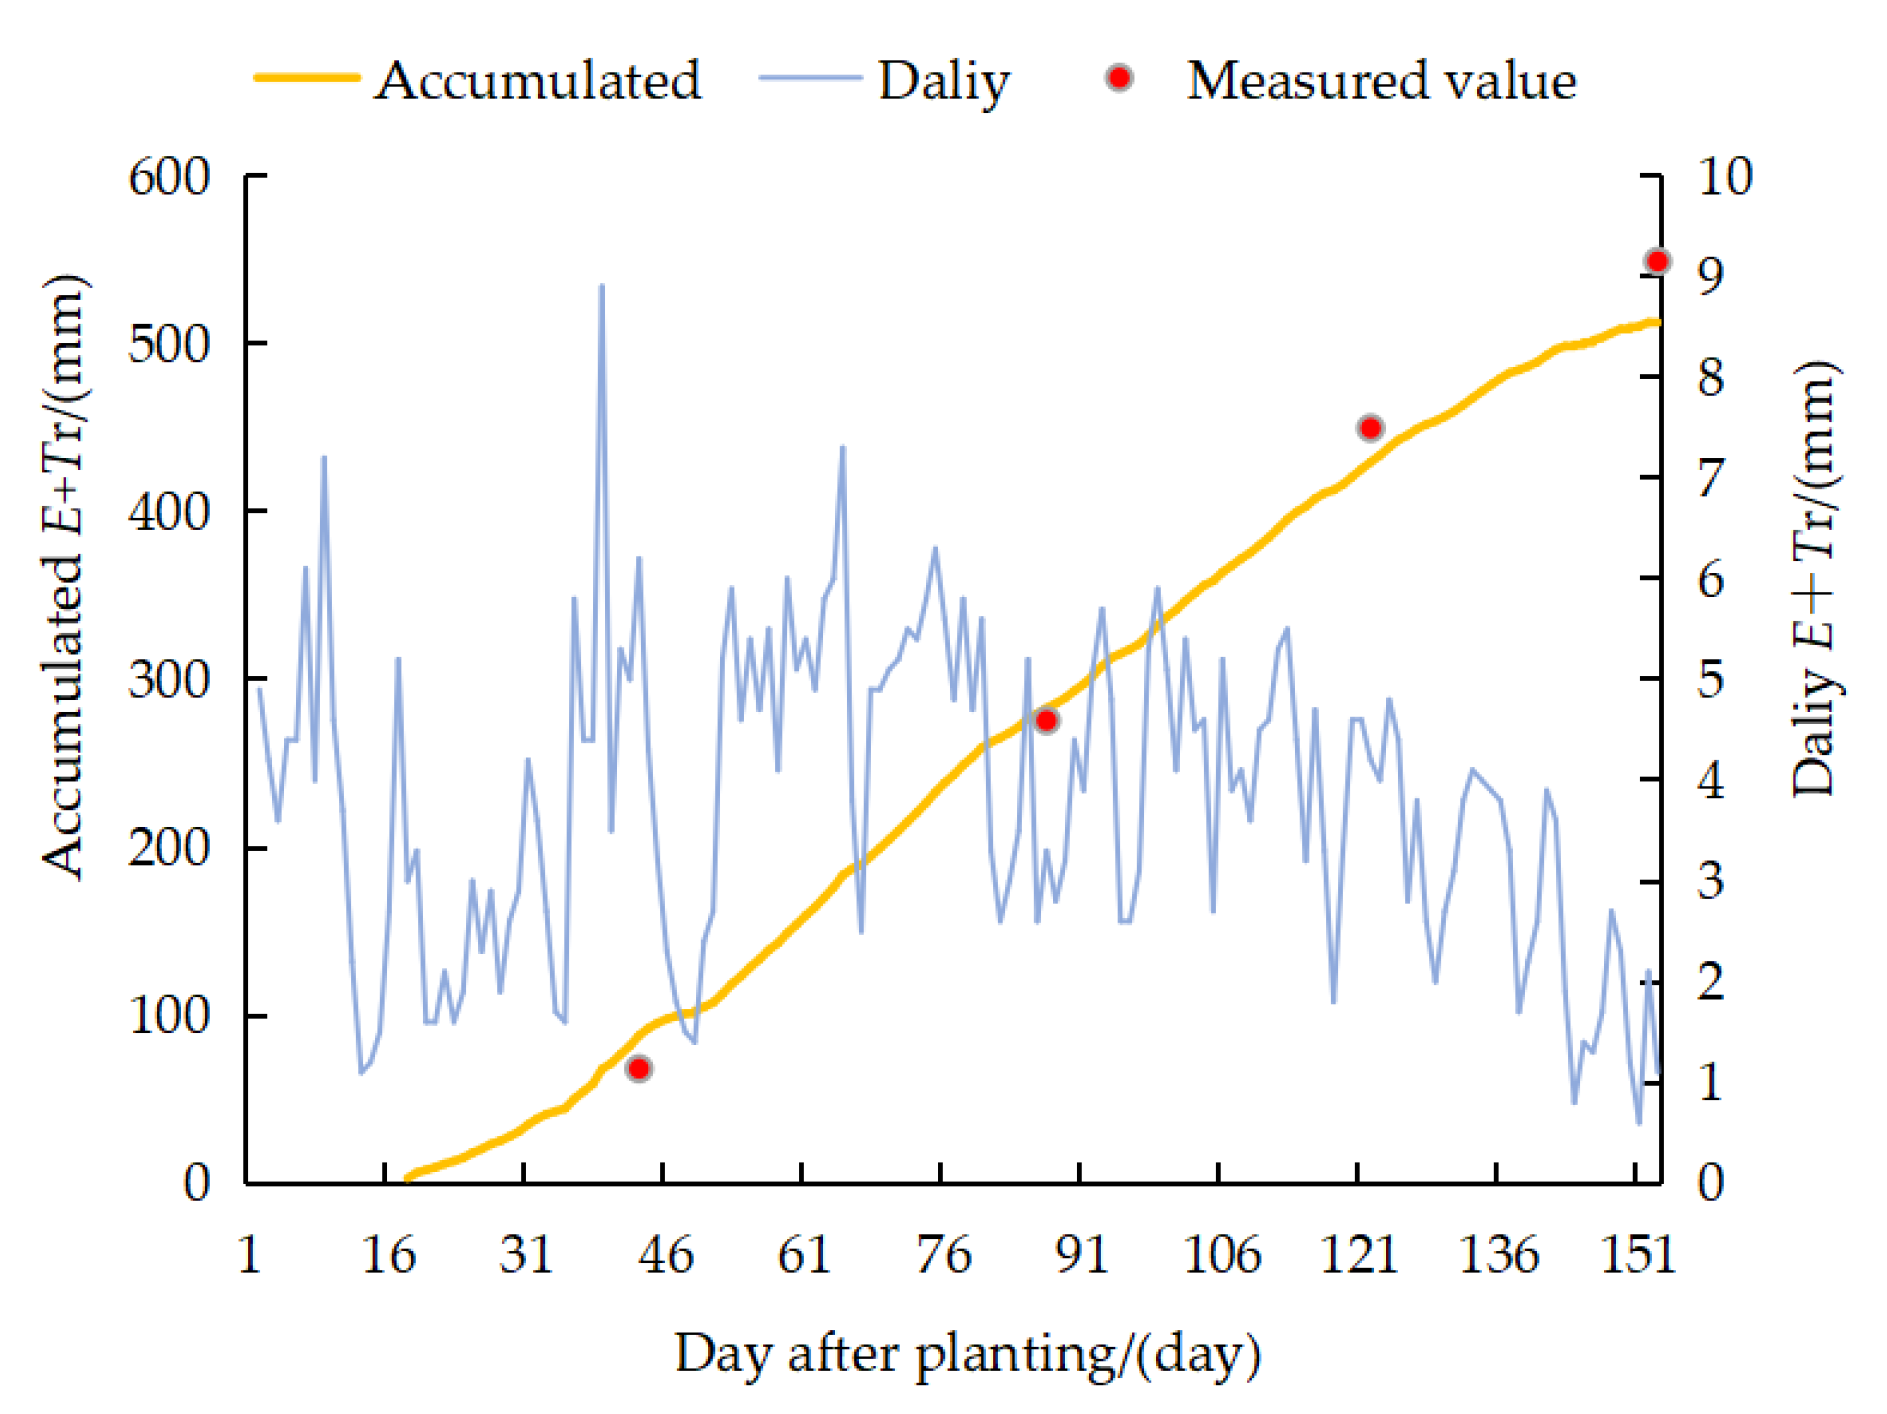
3.1.1. Crop Water Requirement

Figure 2 illustrates a comparison between the measured and simulated values of ETc at all growth stages, based on a calibration of AquaCrop in Harbin 2014. The corrected model underestimated the ETc with values 15~30 mm in the late growth period (Figure 2). However, the model showed a high degree of fit overall, with low RMSE (19.56 mm) and NRMSE (14.25%) and acceptable EF (0.87) and d (0.67) values.
The measured and simulated values of ETc at different growth stages were compared and verified by the data for Harbin in 2015 and Zhaozhou in 2014 and 2017 (Figure 3). In the verification process, AquaCrop was used to simulate the growth trend of maize during the growth seasons. However, as the model underestimated the ETc with the value of 10~30 mm in the later growth stage, the degree of underestimation was less than that of the calibration 50~60 mm. Figure 4 illustrates a comparison between all the measured and simulated values listed in Table 3; these values provided the goodness-of-fit parameters for model calibration and verification in all years and locations. AquaCrop underestimated the ETc during calibration, and the results showed an overestimation of ETc though R2 close to 1, during verification, especially for the verified ETa (R2 = 0.68) in Figure 4. In general, the model provided a high degree of fit between the simulated and measured values.

3.1.2. Yield

The yields of four experiments were used for calibration and verification. The measured and simulated yields are shown in Figure 5. The model results indicate that the simulated yield overestimated the actual yield less than 0.6 ton/ha with R2 (0.9) close to 1. The model had low RMSE (0.595 ton/ha) and NRMSE (4.2%) values and acceptable EF (0.98), d (0.9), and R2 (0.901) values.

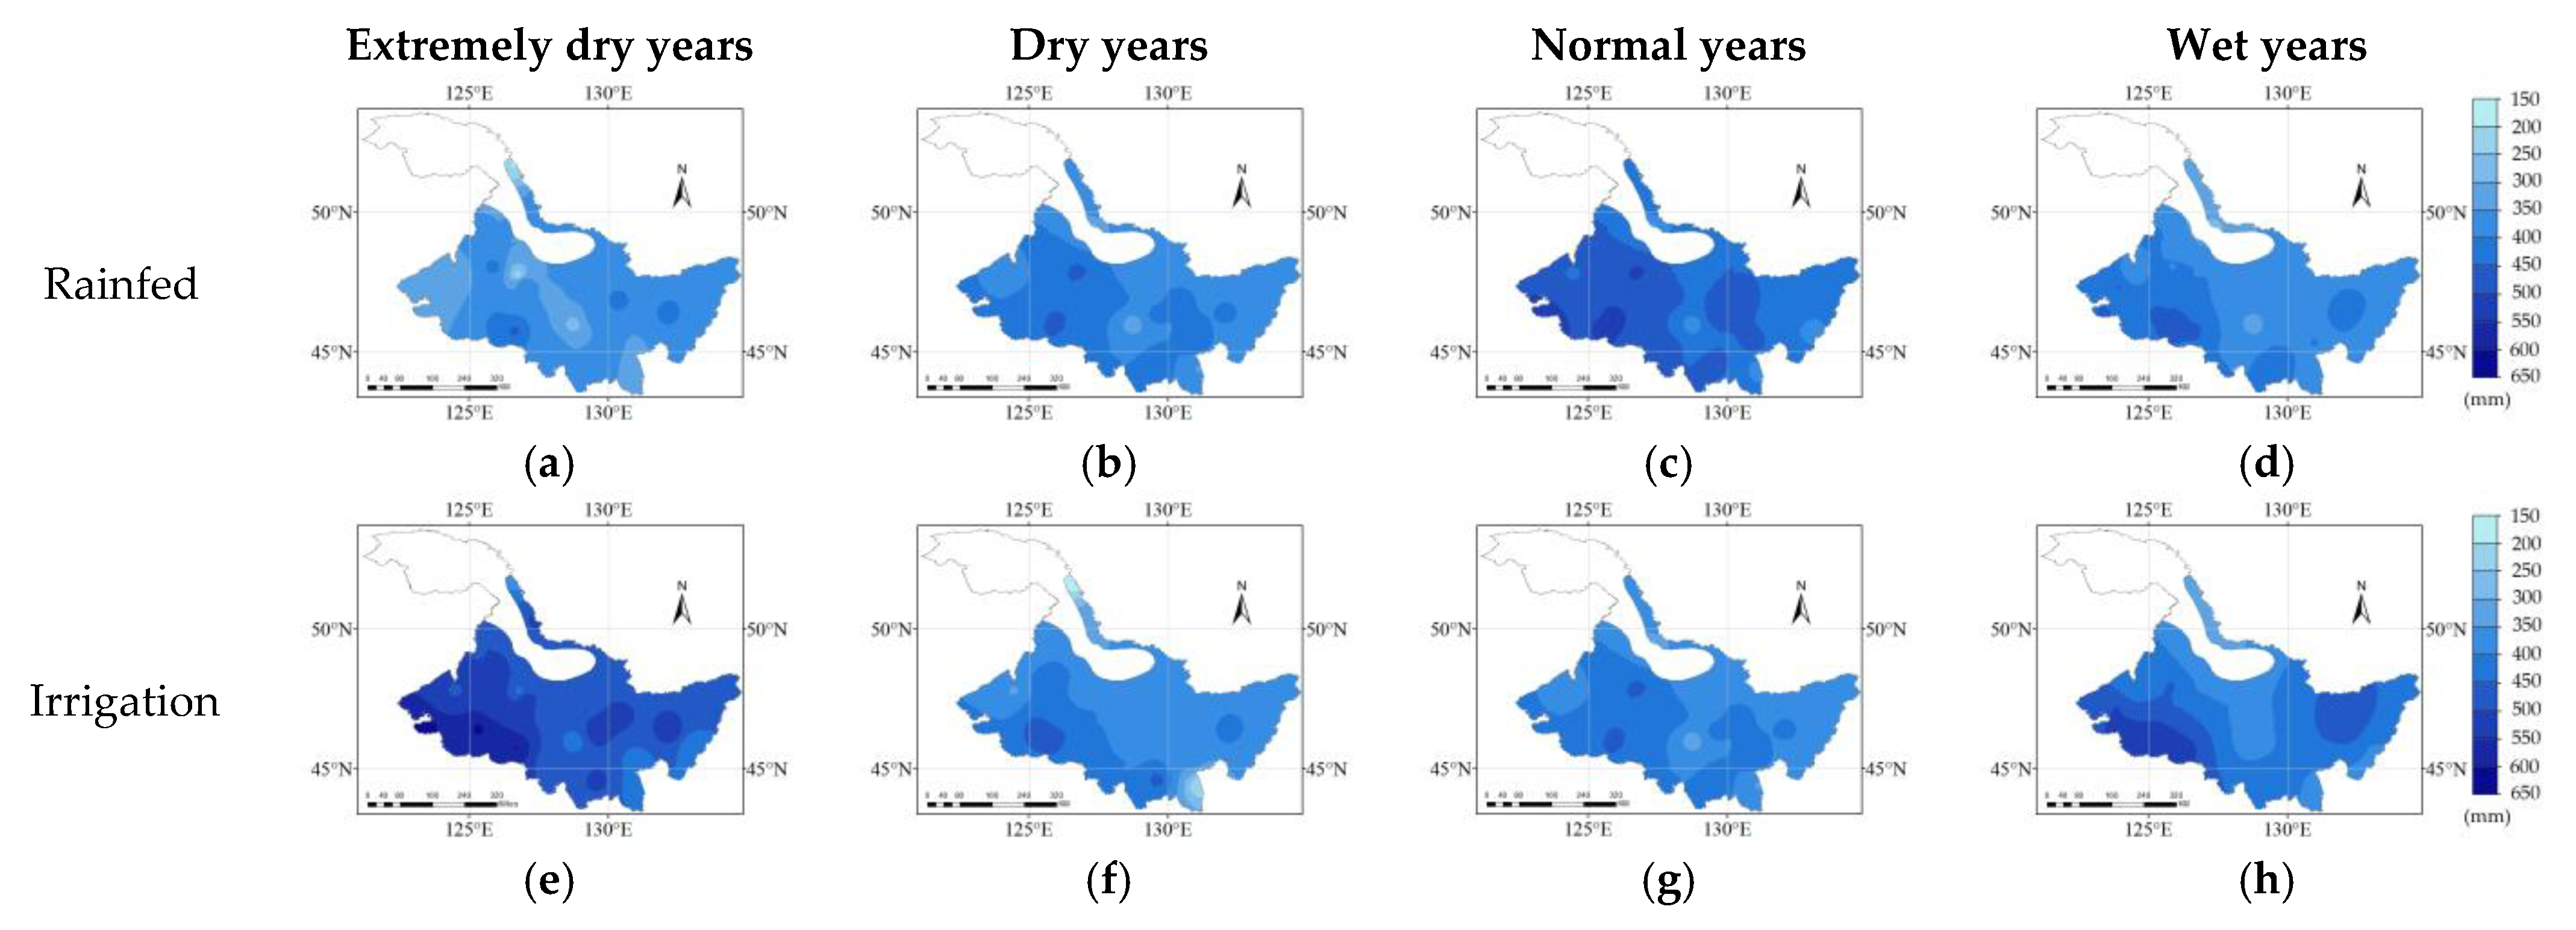
3.2. Comparison of ETc and ETa in Different Hydrological Years

The characteristics of ETa and ETc in the growing season of maize were then determined. The spatial distribution patterns of ETa and ETc were generally similar over the four hydrological years—first decreasing and then increasing from west to east. High ETc and ETa with values greater than 500 and 400 mm were located along the strip extending from the west to the south (Figure 6). As a whole, the average ETc decreased from the extremely dry years to wet years, with values of 499, 464, 453, and 423 mm, respectively. The value of the average ETa increased from the extremely dry years to normal years and varied weakly from normal years to wet years. The average ETa values were 144, 82, 52, and 31 mm lower, respectively, than the average ETc values.

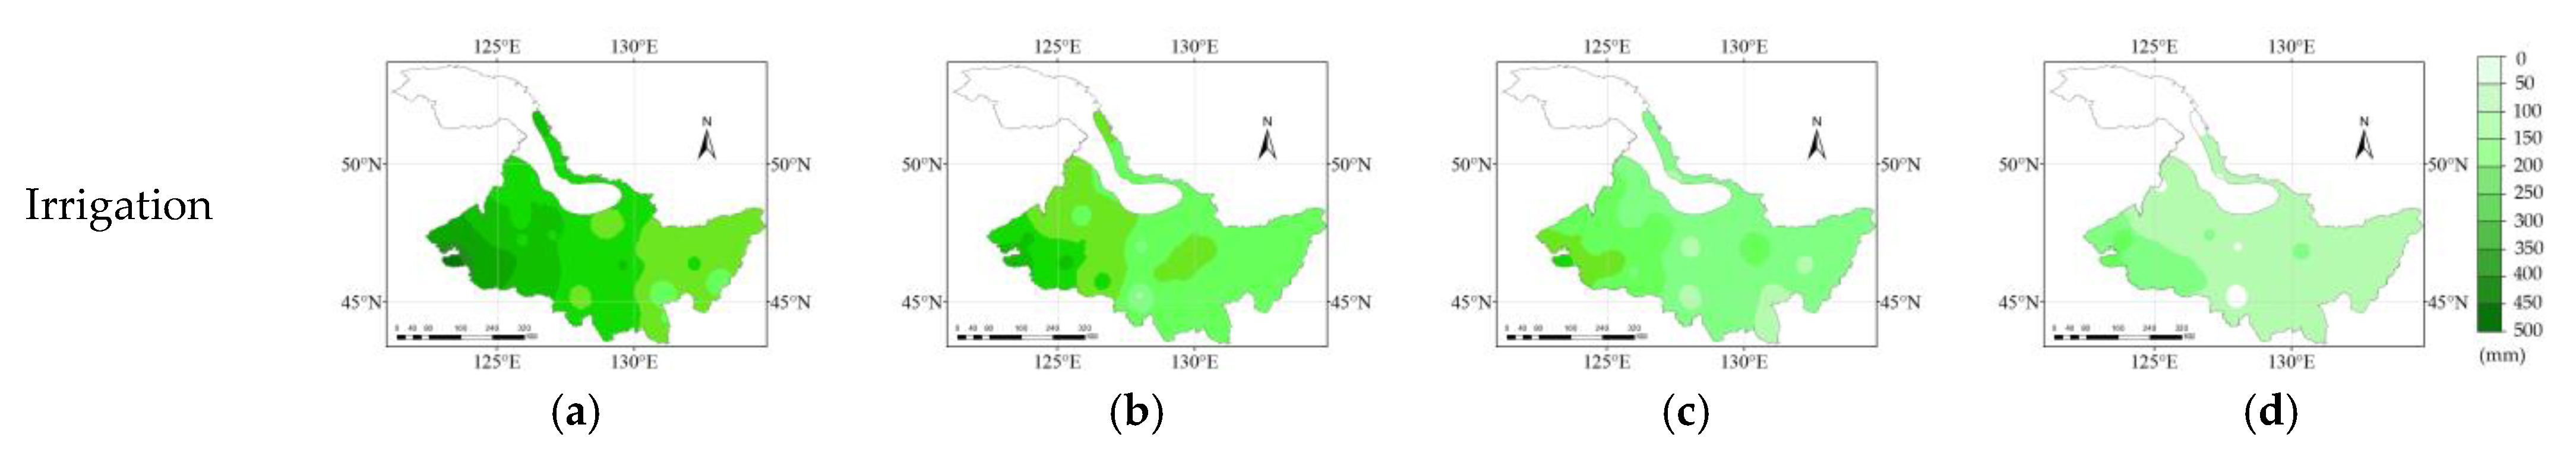
3.3. Spatial Distribution of Ir in Different Hydrological Years

Weak variations in Ir trends were observed between the four hydrologic years in the different regions, with a decreasing trend from west to east over the four hydrological years (Figure 7). The average Ir values were 289, 212, 141, and 80 mm, and high values were mainly distributed in the west, similar to the locations of ETc, greater than 400, 300, 200, 100 mm in the extremely dry years, dry years, normal years, and wet years, respectively.

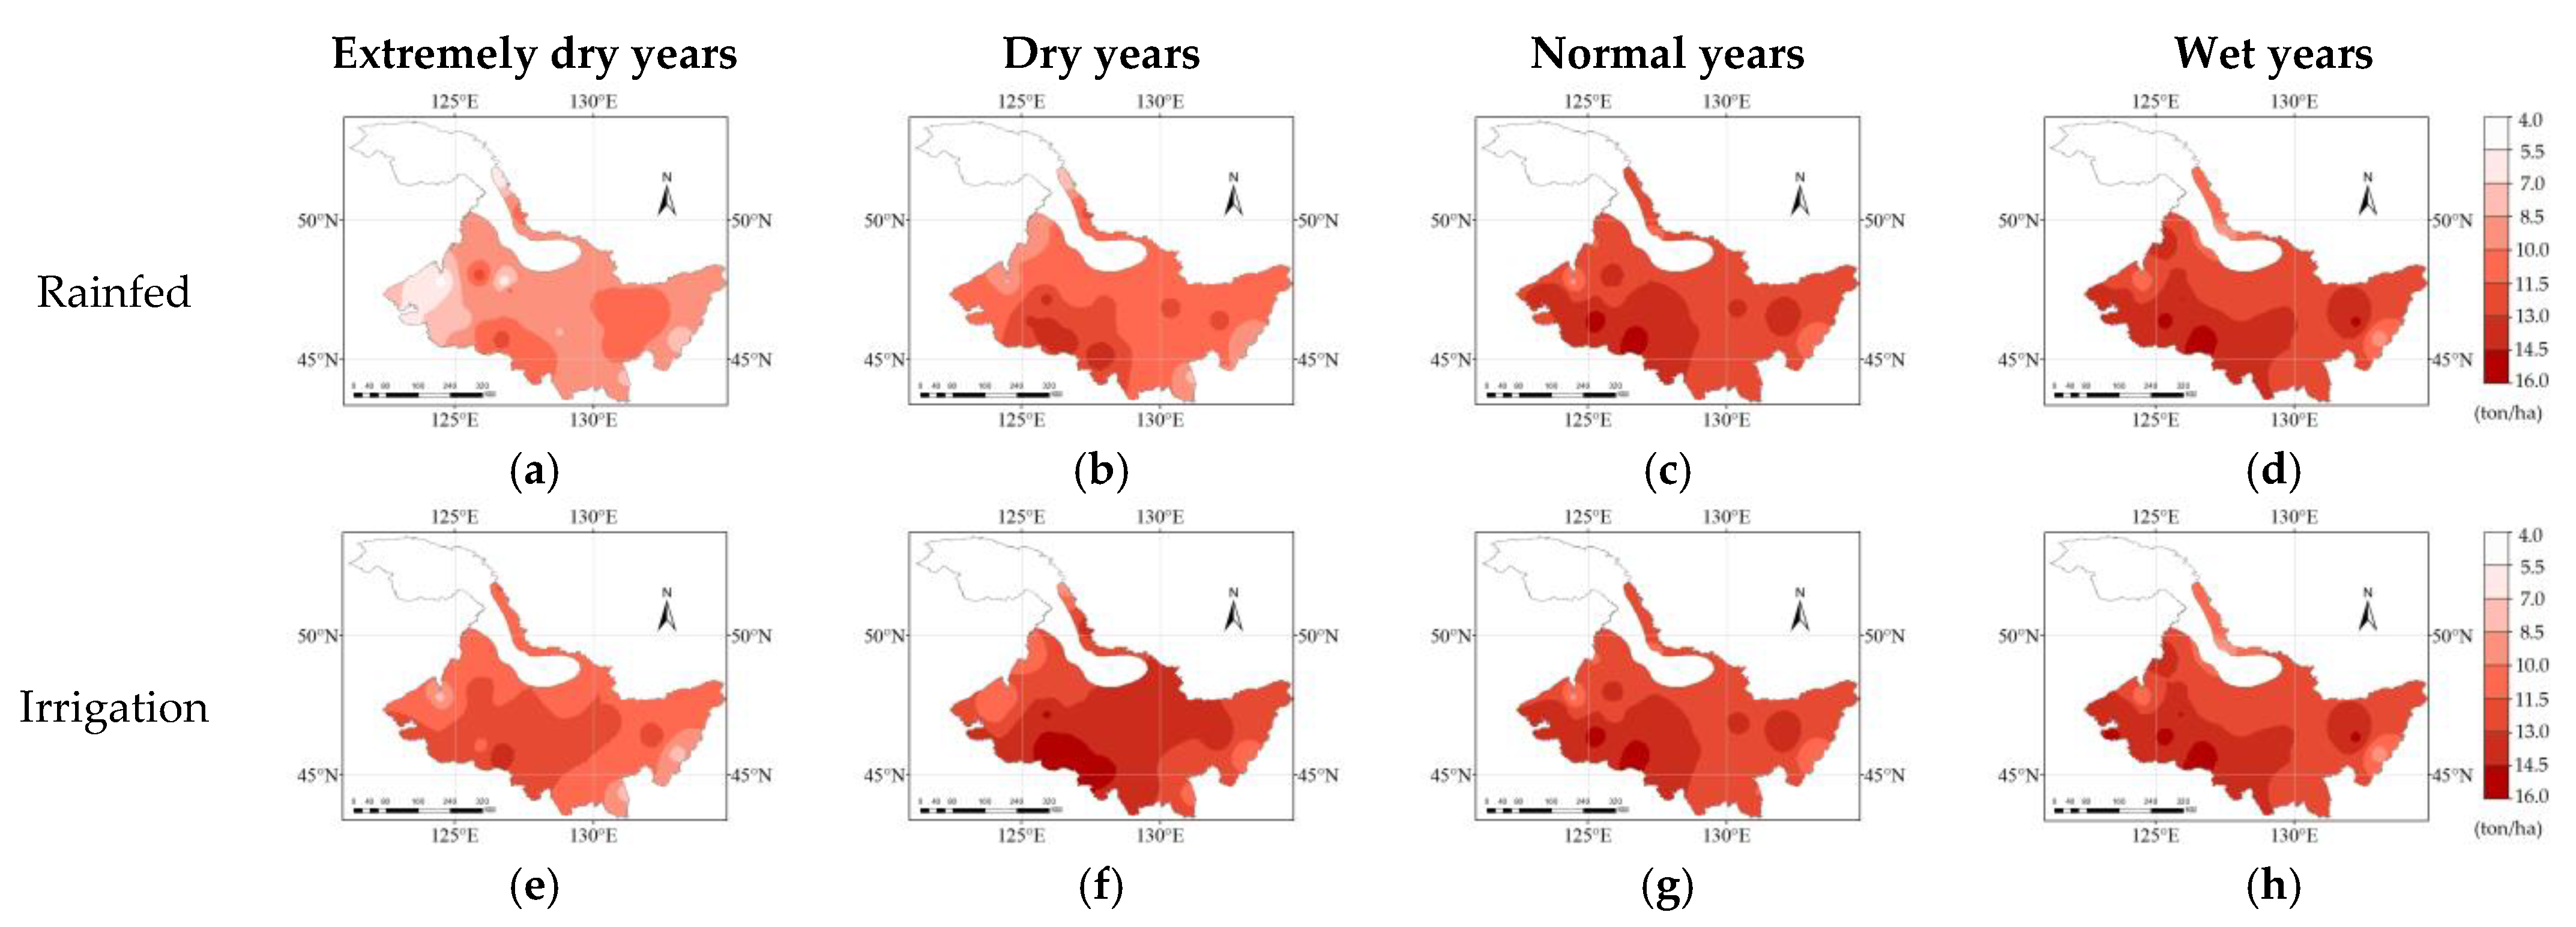
3.4. Spatial Distribution of Yield in Different Hydrological Years under Rainfed and Irrigation Scenarios

The average yields under the rainfed scenario during the extremely dry years, dry years, normal years, and wet years were 9.59, 11.32, 11.73, and 11.71 ton/ha, respectively. Irrigation increased maize yield in most areas during the extremely dry and dry years by 2.18 and 0.55 ton/ha, respectively, especially in the regions where ETc and Ir were high. However, in the normal and wet years, irrigation only increased the yield by 0.03 and 0.05 ton/ha, respectively (Figure 8). The high yield values greater than 13.0 ton/ha were mainly distributed in the southwest, while the low yield values less than 8.5 ton/ha were primarily distributed in the eastern regions.

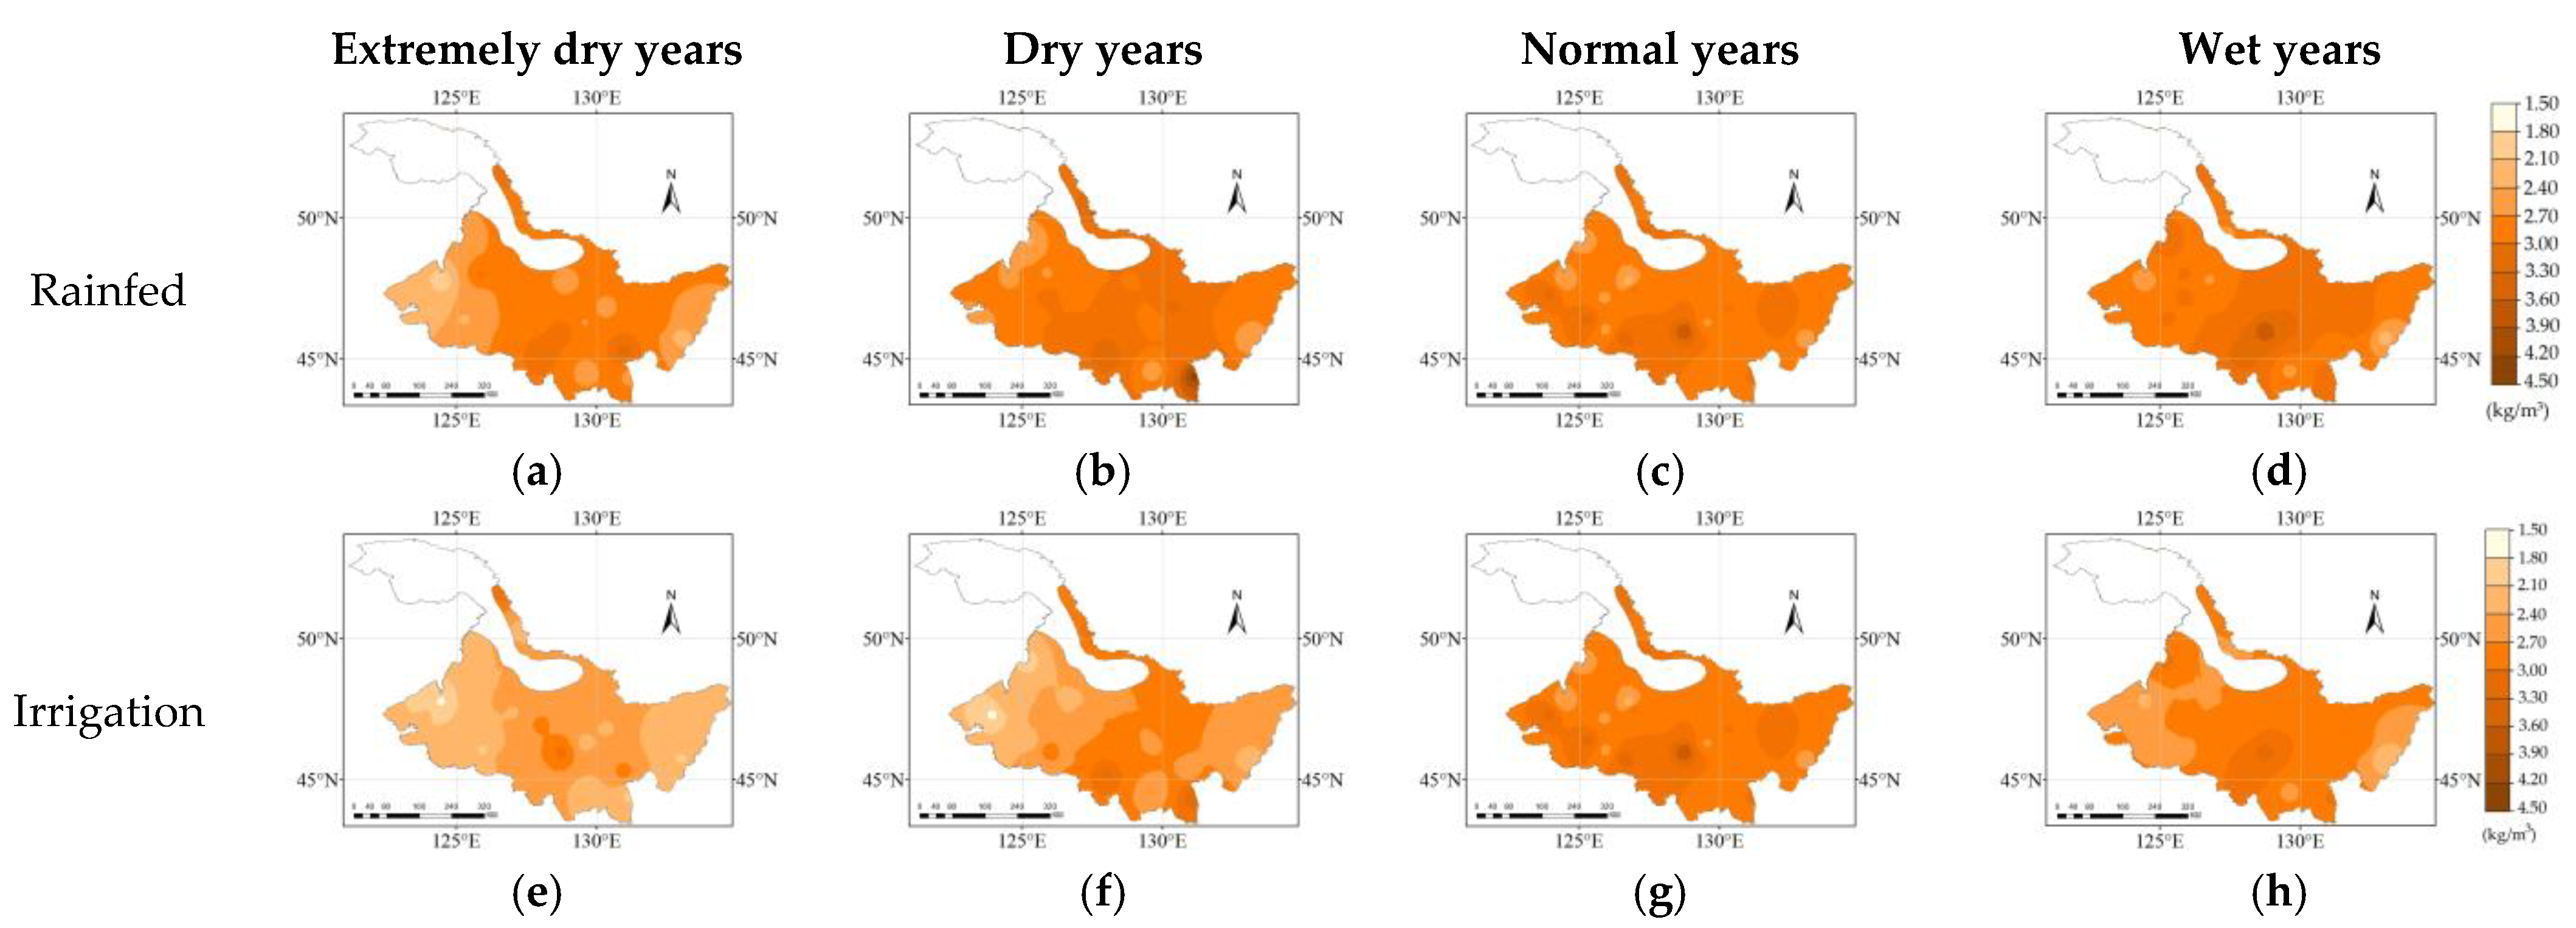
3.5. Spatial Distribution of WUE in Different Hydrological Years under Rainfed and Irrigation Scenarios

WUE showed a trend of increasing first and then decreasing from the western to the eastern regions over the four hydrological years (Figure 9). The average WUE under the rainfed scenario in the respective extremely dry years, dry years, normal years, and wet years was 2.70, 3.00, 2.95, and 2.99 kg/m3. The average WUE under the irrigation scenario was 0.32, 0.4, 0.33, and 0.21 kg/m3 lower than that under the rainfed scenario in the extremely dry years, dry years, normal years, and wet years. Overall, irrigation reduced the WUE over the four hydrological years, especially during normal and wet years. Irrigation did not significantly improve the WUE and yield in most areas; thus, rainfed farming could be employed as an alternative schedule.

4. Discussion

The results demonstrated that AquaCrop performed well in simulating ETc and maize yield (Figure 4 and Figure 5), with acceptable RMSE, NRMSE, EF, and d values (Table 3). However, AquaCrop underestimated ETc in the final simulation (Figure 3 and Figure 4). Ultimately, the result for ETc was lower than the actual result. Rupinder indicated that under irrigation and rainfed scenarios, the AquaCrop model consistently underestimates the trends of ETc [31]. Thus, the observed bias in simulated values was most likely due to insufficient parameterization of the crop parameters during later growth stages, as the model was highly impacted by crop senescence stress coefficients [27,51]. In this study, due to the limited data, adjustments in the canopy decline may have affected the correction of ETc for the later growth stages.
Many previous studies indicated that high values of ETc are mainly distributed in the western regions [52,53], with an average of 401.64 mm, while low values are primarily distributed in the eastern regions [34]. In [34], the spatial distribution of ETc was the same as that in this study, but the value of ETc was greater than 401.64 mm, which may have been caused by the use of different models and methods. The previous study used a single crop coefficient to calculate ETc. However, the present study used the AquaCrop model with two crop coefficients (E and Tr) and considered the impact of CO2 on ETc [45]. Studies have shown that the use of two crop coefficients offers more accuracy than the use of a single crop coefficient and that predicting ETc using two crop coefficients provides better performance than predicting ETc using a single crop coefficient [54]. In the present study, the AquaCrop model was calibrated and verified using experimental data from the field. The results obtained through this method may be more reliable than those acquired by calibrating Kc in the CropWAT model using the FAO-56 method. Furthermore, a more reliable localized AquaCrop model will require more experimental data for calibration and verification. In future studies, we will further optimize the AquaCrop model to make it more accurate and applicable to more crop simulations.
The present study demonstrated that, in the west, Ir was high while the yield and WUE were low. Nie indicated that ETc and Ir in each accumulated temperature zone are increased with increasing temperature, confirming the spatial distribution trend of ETc and Ir in this study [51]. Sun showed that precipitation in the maize growing season fluctuates strongly in the west [55], which may be one reason for the large amount of irrigation in these regions. Moreover, due to the high accumulated temperature, relatively low air humidity, strong solar radiation, and high maize ETc, drought frequently occurred in the west [56]. Past research has shown that the increase in greenhouse gases in Heilongjiang Province has affected radiation to a certain extent, thereby increasing ET0. However, the ET0 in the northeast slightly decreased. This trend reduced the ETc and the potential Ir for ET [57]. Moreover, research has shown that the water shortage in the west improved from 1960 to 2015 [34]. Based on this trend, the ET0 will alleviate drought in the west, which will be beneficial for employing a rainfed schedule during normal and wet years in Heilongjiang Province.
Under the studied irrigation scenarios, the WUE was lower than that under the rainfed scenario. In extremely dry and dry years, irrigation alleviated drought and increased maize yields in most regions. Moreover, the water supply increased as the ET increased, and the WUE was low, possibly because the additional water supply contributed to biomass production rather than an increase in the yield [58]. During normal and wet years, irrigation did not significantly increase the yield. The results further demonstrate that excess irrigation may be lost through deep percolation. Therefore, except for the WUE being lower under the irrigation scenario, there was no significant difference in the spatial distribution between the two hydrological years. In the future, based on the water-saving principle, irrigation should not be considered during normal and wet years. When irrigation is necessary during extremely dry years and dry years, a water-saving irrigation schedule (such as drip irrigation under mulch or the use of sprinklers) needs to be implemented under appropriate agricultural management strategies to improve WUE. These measures are essential to increase the yields of similar crops under the same climate regions and provide a basis for optimizing the allocation of water resources and improving the WUE of maize planted in Heilongjiang Province.

5. Conclusions

In this study, the data from three field experiments on maize were used to calibrate and validate the AquaCrop model in Heilongjiang Province. The ETc, ETa, Ir, and yield were correctly simulated under rainfed and irrigation scenarios over four hydrological years. The results demonstrated that in the west, the ETc, ETa, and Ir were high, but the yield was low. Moreover, irrigation increased the yield in extremely dry years, while there were no significant changes during normal and wet years. The WUE under irrigation was lower than that under the rainfed scenario. Notably, in normal and wet years, irrigation did not increase yield but instead reduced WUE. Therefore, the planting area may not require irrigation during normal and wet years, but the drought in the western area of Heilongjiang Province cannot be ignored.
The results obtained by the localized AquaCrop model may provide a reference for areas with similar phenology in Heilongjiang Province. Due to limited experimental data used for calibration and verification in this study, the AquaCrop model still has a deviation. In the future, we will focus on calibrating the AquaCrop model with more field experiments, dividing rainfed and irrigation districts, and formulating irrigation schedules for irrigation districts to guide agricultural irrigation in Heilongjiang Province.

Author Contributions

T.N. collected the data; Y.J. and T.N analyzed data; Y.J. wrote the paper; Y.T., N.L., T.W. and C.D. drew the figures for this paper; Z.Z., T.L., S.Z., Z.S. and F.L. reviewed and edited the paper. All authors have read and agreed to the published version of the manuscript.

Funding

This work was fund by the Basic Scientific Research Fund of Heilongjiang Provincial Universities, grant number RCCXYJ201912&2018-KYYWF-1570, National Natural Science Foundation Project of China, grant number 51809042.

Institutional Review Board Statement

Not applicable.

Informed Consent Statement

Not applicable.

Acknowledgments

We thank the Chinese meteorological data sharing service (http://data.cma.cn, accessed on 22 July 2021) for providing the meteorological data. We thank the anonymous reviewers and the editor for their suggestions, which substantially improved the manuscript.

Conflicts of Interest

The authors declare no conflict of interest.

References

  1. UNEP. Global Environmental Outlook. 2000. Available online: http://www.unep.org/geo/geo2000/english/index.htm (accessed on 7 July 2021).
  2. Rijsberman, F.R. Water scarcity: Fact or fiction? Agric. Water Manag. 2006, 80, 5–22. [Google Scholar] [CrossRef] [Green Version]
  3. Crow, B. Contesting water injustice: The Santa Cruz Declaration on the global water crisis. Water Int. 2014, 39, 246–261. [Google Scholar] [CrossRef]
  4. Tittonell, P.; Giller, K.E. When yield gaps are poverty traps: The paradigm of ecological intensification in African smallholder agriculture. Field Crops Res. 2013, 143, 76–90. [Google Scholar] [CrossRef] [Green Version]
  5. FAO. FAO Statistical Yearbook 2007: World Food and Agriculture. Available online: http://www.fao.org/docrep/018/i3107e/i3107e00.htm (accessed on 7 July 2021).
  6. Beshir, S. Review on Estimation of Crop Water Requirement, Irrigation Frequency and Water Use Efficiency of Cabbage Production. J. Geosci. Environ. Prot. 2017, 5, 59–69. [Google Scholar] [CrossRef] [Green Version]
  7. Sandhu, R.; Irmak, S. Performance of AquaCrop model in simulating maize growth, yield, and evapotranspiration under rainfed, limited and full irrigation. Agric. Water Manag. 2019, 223, 105687. [Google Scholar] [CrossRef]
  8. Kehlenbeck, K.; Jamnadass, R. Food and Nutrition—Fruits, Nuts, Vegetables and Staples from Trees. In Treesilience: An Assessment of the Resilience Provided by Trees in the Drylands of Eastern Africa; De, L.J., Njenga, M., Wagner, B.I., Eds.; ICRAF: Nairobi, Kenya, 2014; Chapter 6.2.1; p. 166. ISBN 978-92-9059-352-2. [Google Scholar]
  9. Alexandratos, N.; Bruinsma, J. World Agriculture towards 2030/2050: The 2012 Revision; ESA Working Paper No. 12-03; FAO of UN: Rome, Italy, 2012; Chapter 2.1.2; pp. 32–33. [Google Scholar]
  10. Zhang, Q.S.; Shi, Q.L.; Chen, C.; Shi, Q. Impacts of land use and land cover changes on surface energy and water balance in the Heihe River Basin of China, 2000–2010. Phys. Chem. Earth 2015, 79–82, 2–10. [Google Scholar] [CrossRef]
  11. Qian, X.; Wei, S.A.; Ying, Z.C. Forecast and optimal allocation of production, living and ecology water consumption in Zhangye, China. Phys. Chem. Earth 2016, 96, 16–25. [Google Scholar] [CrossRef]
  12. Deng, X.P.; Lun, S.; Zhang, H.; Turner, N.C. Improving agricultural water use efficiency in arid and semiarid areas of China. Agric. Water Manag. 2006, 80, 23–40. [Google Scholar] [CrossRef]
  13. Yang, X.L.; Chen, Y.Q.; Pacenka, S.; Steenhuis, T.S.; Sui, P. Managing food and bioenergy crops with declining groundwater levels in the North China Plain. Field Crops Res. 2019, 234, 1–14. [Google Scholar] [CrossRef]
  14. Ammar, M.E.; Davies, E. On the accuracy of crop production and water requirement calculations: Process-based crop modelling at daily, semi-weekly, and weekly time steps for integrated assessments. J. Environ. Manag. 2019, 238, 460–472. [Google Scholar] [CrossRef]
  15. Adeboye, O.; Schultz, B.; Adekalu, K.O.; Prasad, K. Performance evaluation of AquaCrop in simulating soil water storage, yield, and water productivity of rainfed soybeans (Glycine max L. merr) in Ile-Ife, Nigeria. Agric. Water Manag. 2019, 213, 1130–1146. [Google Scholar] [CrossRef]
  16. Nie, T.Z.; Liang, Q.Z.; Wang, T.Y.; Chu, L.L.; Chen, X.; Li, F.R. Water requirement and supply and irrigation schedule formulation for maize in the western region of Heilongjiang Province. South-to-North Water Transfers and Water Sci. Technol. 2021, 1–13. Available online: http://kns.cnki.net/kcms/detail/13.1430.TV.20210628.1130.002.html (accessed on 7 July 2021).
  17. Allen, R.G.; Walter, I.A.; Elliott, R.L. The ASCE Standardized Reference Evapotranspiration Equation; ASCE: Reston, VA, USA, 2005; pp. 46–47. [Google Scholar] [CrossRef]
  18. Sun, H.Y.; Shen, Y.J.; Yu, Q.; Flerchinger, G.N. Effect of precipitation change on water balance and WUE of the winter wheat–summer maize rotation in the North China Plain. Agric. Water Manag. 2010, 97, 1139–1145. [Google Scholar] [CrossRef]
  19. Djaman, K.; Irmak, S.; William, R.R.; Martin, D. Maize evapotranspiration, yield production functions, biomass, grain yield, harvest index, and yield response factors under full and limited irrigation. Trans. ASABE 2013, 56, 273–293. [Google Scholar] [CrossRef]
  20. Qin, S.; Li, L.; Wang, D.; Zhang, J.L. Effects of Limited Supplemental Irrigation with Catchment Rainfall on Rain-fed Potato in Semi-arid Areas on the Western Loess Plateau, China. Am. J. Potato Res. 2013, 90, 33–42. [Google Scholar] [CrossRef]
  21. Acharjee, T.K.; Halsema, G.; Ludwig, F.; Hellegers, P. Declining trends of water requirements of dry season Boro rice in the north-west Bangladesh. Agric. Water Manag. 2017, 180, 148–159. [Google Scholar] [CrossRef]
  22. Kresovic, B.; Matovic, G.; Gregoric, E.; Djuricin, S.; Bodroza, D. Irrigation as a climate change impact mitigation measure: An agronomic and economic assessment of maize production in Serbia. Agric. Water Manag. 2014, 139, 7–16. [Google Scholar] [CrossRef]
  23. Kresovi’ ca, B.; Tapanarova, A.; Tomić, Z.; Zixotic, L. Grain yield and water use efficiency of maize as influenced by different irrigation regimes through sprinkler irrigation under temperate climate. Agric. Water Manag. 2016, 169, 34–43. [Google Scholar] [CrossRef]
  24. Attia, A.; El-Hendawy, S.; Al-Suhaibani, N.; Alotaibi, M. Evaluating deficit irrigation scheduling strategies to improve yield and water productivity of maize in arid environment using simulation. Agric. Water Manag. 2021, 249, 106812. [Google Scholar] [CrossRef]
  25. Djaman, K.; Irmak, S. Soil water extraction patterns and crop, irrigation, and evapotranspiration water use efficiency of maize under full and limited irrigation and rainfed settings. Trans. ASABE 2012, 55, 1223–1238. [Google Scholar] [CrossRef]
  26. Zou, Y.F.; Saddique, Q.; Ajaz, A.; Xu, J.T. Deficit irrigation improves maize yield and water use efficiency in a semi-arid environment. Agric. Water Manag. 2020, 243, 106483. [Google Scholar] [CrossRef]
  27. Heng, L.; Hsiao, T.C.; Evett, S.; Howell, T.A. Validating the FAO AquaCrop Model for Irrigated and Water Deficient Field Maize. Agron. J. 2009, 101, 488–498. [Google Scholar] [CrossRef] [Green Version]
  28. Sandhu, R.; Irmak, S. Performance assessment of Hybrid-Maize model for rainfed, limited and full irrigation conditions. Agric. Water Manag. 2020, 242, 106402. [Google Scholar] [CrossRef]
  29. López-Urrea, R.; Domínguez, A.; Pardo, J.J.; Montoya, F. Parameterization and comparison of the AquaCrop and MOPECO models for a high-yielding barley cultivar under different irrigation levels. Agric. Water Manag. 2020, 230, 105931. [Google Scholar] [CrossRef]
  30. Pirmoradian, N.; Davatgar, N. Simulating the effects of climatic fluctuations on rice irrigation water requirement using AquaCrop. Agric. Water Manag. 2019, 213, 97–106. [Google Scholar] [CrossRef]
  31. Sandhu, R.; Irmak, S. Assessment of AquaCrop model in simulating maize canopy cover, soil-water, evapotranspiration, yield, and water productivity for different planting dates and densities under irrigated and rainfed conditions. Agric. Water Manag. 2019, 224, 105753. [Google Scholar] [CrossRef]
  32. Bai, J.; Chen, X.; Dobermann, A.; Yang, H.S.; Kenneth, G.; Cassman, K.G.; Zhang, F.S. Evaluation of NASA Satellite and Model-Derived Weather Data for Simulation of Maize Yield Potential in China. Agron. J. 2010, 102, 9–16. [Google Scholar] [CrossRef]
  33. Heilongjiang Bureau of Statistics. Heilongjiang Statistical Yearbook; China Statistics Press: Beijing, China, 2016. Available online: http://tjj.hlj.gov.cn/tjsj/tjnj/ (accessed on 7 July 2021).
  34. Wang, T.Y.; Du, C.; Nie, T.; Sun, Z.Y.; Liang, Q.Z. Spatiotemporal Analysis of Maize Water Requirement in the Heilongjiang Province of China during 1960–2015. Water 2020, 12, 2472. [Google Scholar] [CrossRef]
  35. Heilongjiang Provincial Agriculture Committee. Division of Accumulated Temperature Zones of Crop Varieties in Heilongjiang Province. Available online: http//www.hljagri.gov.cn/ nygk/nzwpzjwqh/ (accessed on 7 July 2021).
  36. Accumulated Temperature Zone of Crop Varieties in Heilongjiang Province. Available online: http://www.hljagri.gov.cn/ (accessed on 7 July 2021).
  37. Li, H. Experimental Study on Water Consumption Law and Irrigation Scheme Evaluation of Corn under Regulated Deficit Irrigation; Agricultural University: Harbin, China, 2016. (In Chinese) [Google Scholar]
  38. Wang, D. Experimental Study on Coupling Effect of Water and Fertilizer of Corn Sprinkler Irrigation in Semi-Arid Area of Heilongjiang Province; Agricultural University: Harbin, China, 2016. (In Chinese) [Google Scholar]
  39. Chen, S. Experimental Research on Corn Irrigation System and Water and Nitrogen Utilization in Semi-Arid Area of Western Heilongjiang; Northeast Agricultural University: Harbin, China, 2019. (In Chinese) [Google Scholar]
  40. Bottazzi, M.; Bancheri, M.; Mobilia, M.; Bertoldi, G.; Rigon, R. Comparing Evapotranspiration Estimates from the GEOframe-Prospero Model with Penman–Monteith and Priestley-Taylor Approaches under Different Climate Conditions. Water 2020, 13, 1221. [Google Scholar] [CrossRef]
  41. Zotarelli, L.; Dukes, M.D.; Romero, C.C.; Migliaccio, K.W.; Morgan, K.T. Step by Step Calculation of the Penman-Monteith Evapotranspiration (FAO-56 Method); Institute of Food and Agricultural Sciences, University of Florida: Gainesville, FL, USA, 2010; pp. 1–10. [Google Scholar]
  42. Doorenbos, J.; Kassam, A.H. FAO Irrigation and Drainage Paper No. 33; FAO of UN: Rome, Italy, 1979; pp. 37–55. ISBN 925-10-0744-6. [Google Scholar]
  43. Doorenbos, J.; Kassam, A.H. Yield Response to Water 1. Irrig. Agric. Dev. 1986, 33, 257–280. [Google Scholar] [CrossRef]
  44. Steduto, P.; Hsiao, T.C.; Fereres, E. On the conservative behavior of biomass water productivity. Irrig. Sci. 2007, 25, 189–207. [Google Scholar] [CrossRef] [Green Version]
  45. Steduto, P.; Hsiao, T.C.; Raes, D.; Fereres, E. AquaCrop-The FAO crop model to simulate yield response to water: I. Concepts and underlying principles. Agron. J. 2009, 101, 426–437. [Google Scholar] [CrossRef] [Green Version]
  46. FAO. Crop yield response to water. In FAO Irrigation and Drainage Paper No. 66; Steduto, P., Hsiao, T.C., Raes, D., Eds.; FAO of UN: Rome, Italy, 2012; ISBN 978-92-5107274-5. [Google Scholar]
  47. Kontoyiannis, H.; Jacovides, C.P. Statistical procedures for the evaluation of evapotranspiration computing models. Agric. Water Manag. 1995, 27, 365–371. [Google Scholar] [CrossRef]
  48. Jamieson, P.D.; Porter, J.R.; Wilson, D.R. A test of the computer simulation model ARCWHEAT1 on wheat crops grown in New Zealand. Fields Crops Res. 1991, 27, 337–350. [Google Scholar] [CrossRef]
  49. Nash, J.E.; Sutcliffe, J.V. River flow forecasting through conceptual models. J. Hydrol. 1970, 10, 282–290. [Google Scholar] [CrossRef]
  50. Smith, M. CROPWAT: A Computer Program for Irrigation Planning and Management; FAO of UN: Rome, Italy, 1992; pp. 69–73. ISBN 92-5-103106-1. [Google Scholar]
  51. Nie, T.; Zhang, Z.; Qi, Z.; Chen, P.; Sun, Z.; Liu, X.C. Characterizing Spatiotemporal Dynamics of CH4 Fluxes from Rice Paddies of Cold Region in Heilongjiang Province under Climate Change. Int. J. Environ. Res. Public Health 2019, 16, 692. [Google Scholar] [CrossRef] [PubMed] [Green Version]
  52. Nie, T.Z.; Zhang, Z.; Lin, Y.; Chen, P.; Sun, Z. Spatial and Temporal Distribution Characteristics of Maize Water Requirement in Heilongjiang Province during 1959–2015. T Chin. Soc. Mach. 2018, 49, 218–227. (In Chinese) [Google Scholar]
  53. Gao, X.; Wang, C.; Zhang, J.; Xue, X. Crop water requirement and temporal-spatial variation of drought and flood disaster during growth stages for maize in Northeast during past 50 years. Trans. CSAE 2012, 28, 101–109. (In Chinese) [Google Scholar]
  54. Akhavan, S.; Kanani, E.; Dehghanisanij, H. Assessment of different reference evapotranspiration models to estimate the actual evapotranspiration of corn (Zea mays L.) in a semiarid region (case study, Karaj, Iran). Theor. Appl. Climatol. 2018, 137, 1403–1419. [Google Scholar] [CrossRef]
  55. Sun, Y.; Gao, S.; Cao, Y.; Xu, J.Q.; Wang, Z. Study on the suitability of maize planting in Heilongjiang Province based on precipitation. J. Northeast Agric. Univ. 2017, 48, 33–41. (In Chinese) [Google Scholar]
  56. Hu, X.; Chen, M.; Liu, D.; Li, D.; Luo, Y. Reference evapotranspiration change in Heilongjiang Province, China from 1951 to 2018: The role of climate change and rice area expansion. Agric. Water Manag. 2021, 253, 106912. [Google Scholar] [CrossRef]
  57. Wang, Z.; Ye, A.; Wang, L.; Liu, K.; Cheng, L. Spatial and temporal characteristics of reference evapotranspiration and its climatic driving factors over China from 1979–2015. Agric. Water Manag. 2019, 213, 1096–1108. [Google Scholar] [CrossRef]
  58. Irmak, S.; Djaman, K.; Rudnick, D.R. Effect of full and limited irrigation amount and frequency on subsurface drip-irrigated maize evapotranspiration, yield, water use efficiency and yield response factors. Irrig. Sci. 2016, 34, 271–286. [Google Scholar] [CrossRef]
Figure 1. Map of the study area and distribution of meteorological stations in Heilongjiang Province.
Water 13 02665 g001
Figure 2. Simulated and measured accumulated ETc (E + Tr) during the growing season in Harbin, 2014. ET: soil evaporation, Tr: crop transpiration, same as below.
Water 13 02665 g002
Figure 3. Simulated and measured accumulated ETc (E + Tr) and ETa (E + Tr) from model verification during the growing seasons in (a) Harbin (2015), (b) Zhaozhou (2014), and (c) Zhaozhou (2017).
Water 13 02665 g003
Figure 4. Calibration for (a) Harbin (2014) and verification of the measured and simulated ETc for (b) Harbin (2015) and Zhaozhou (2014); (c) ETa for Zhaozhou (2017) under the irrigation and rainfed scenarios. ETc: crop water requirements, ETa: actual crop evapotranspiration, same as below.
Water 13 02665 g004
Figure 5. Calibration and verification results for the measured and simulated yields in all years (Zhaozhou (2014), Harbin (2014–2015), and Zhaozhou (2017).
Water 13 02665 g005
Figure 6. Spatial distribution of ETa and ETc in extremely dry years (a,e), dry years (b,f), normal years (c,g), and wet years (d,h) under rainfed and irrigation scenarios.
Water 13 02665 g006
Figure 7. Spatial distribution of Ir in extremely dry years (a), dry years (b), normal years (c), and wet years (d) under irrigation scenario.
Water 13 02665 g007
Figure 8. Spatial distribution of yield in extremely dry years (a,e), dry years (b,f), normal years (c,g), and wet years (d,h) under the rainfed and irrigation scenario.
Water 13 02665 g008
Figure 9. Spatial distribution of WUE in extremely dry years (a,e), dry years (b,f), normal years (c,g), and wet years (d,h) under the rainfed and irrigation scenarios.
Water 13 02665 g009
Table 1. Crop management data obtained from three field experiments conducted in Heilongjiang Province, China, and used in the AquaCrop model calibration and verification.
1st Experiment2nd Experiment3rd Experiment
Location(126°36′35″ E, 45°43′09″ N)(125°35′10″ E, 45°17′31″ N)(125°17′57″ E, 45°42′57″ N)
Year29 April–27 September 201428 April–24 September 201528 April–27 September 20143 May–27 September 2017
TreatmentIrrigation 1Irrigation 1Irrigation 2Rainfed 3
Irrigation periodSeedling stageSeedling stageTasseling stage
Milk ripening stage
Jointing stage
None
Jointing stageJointing stage
Tasseling stageTasseling stage
Milk ripening stageMilk ripening stage
Irrigation limitation (%)80 FC 480 FCnone0
Irrigation ceiling (%)100 FC100 FCnone0
Irrigation quota (mm)300~400300~4004000
Data used in AquaCropCalibrationVerificationVerificationVerification
1 Irrigation: when the maize soil water content reached 80% field capacity, with 100% field capacity achieved by the end of the day. 2 Irrigation: only irrigated three times during the maize growth period. 3 Rainfed: the growth of maize depended on precipitation. 4 FC: field capacity.
Table 2. Default and calibrated maize parameters for Aquacrop used in this study.
ParameterDefaultCalibrated
Conservative
Base temperature (°C)5.55.5
Cut off temperature (°C)3030
Canopy cover per seedling (cm2 plant−1)6.56.5
Crop transpiration (KcTr)1.101.10
Canopy expansion stress coefficient (Pupper)0.250.25
Canopy expansion stress coefficient (Plower)0.60.6
Crop water productivity (WP*)1732
Initial canopy cover (CC0)1.20.36
Maximum canopy cover (%)8090
Reference harvest index5040
Non-conservative
Time from sowing to emergence (day)515
Time from sowing to max canopy cover (day)7080
Time from sowing to flowering (day)8799
Time from sowing to senescence (day)120134
Maximum effective rooting depth (cm)1.01.0
Plant density (plants ha−1)185,00056,000
Table 3. The goodness-of-fit indexes from the growing-season model simulation: yields in 2014, 2015, and 2017.
Location (Year)The Goodness-of-Fit Parameters
RMSE (mm)NRMSE (%)EFd
CalibrationHarbin (2014)19.5614.250.870.67
VerificationHarbin (2015)15.7911.590.920.94
Zhaozhou (2014)19.8524.51−0.660.66
Zhaozhou (2017)16.7022.080.600.64
Publisher’s Note: MDPI stays neutral with regard to jurisdictional claims in published maps and institutional affiliations.

