
Economic and Sustainability Inequalities and Water Consumption of European Union Countries


1
Economics and Business Sciences Department, Universidade Autónoma de Lisboa, R. de Santa Marta, 56, 1169-023 Lisboa, Portugal
2
Department of General Economics, University of Cadiz, Avenue Enrique Villegas Velez, 2, 11002 Cádiz, Spain
3
Doctoral School of Economics and Regional Sciences, Hungarian University of Agriculture and Life Science, 2100 Gödöllő, Hungary
*
Author to whom correspondence should be addressed.
Water 2021, 13(19), 2696; https://0-doi-org.brum.beds.ac.uk/10.3390/w13192696
Submission received: 5 September 2021
/
Revised: 24 September 2021
/
Accepted: 25 September 2021
/
Published: 29 September 2021
(This article belongs to the Section Water Resources Management, Policy and Governance)
Abstract
:Water scarcity is becoming a global concern for many reasons as its consumption increases. This research aimed to analyze sustainability inequalities in the water consumption of EU countries. Descriptive statistics using data for four AQUASTAT periods (2002, 2007, 2012, and 2017), and quotients for the AQUASTAT 2017 period, were calculated using a proposed econometric model. The main results were that countries with high GPD and population showed high water stress and total water withdrawal. Countries with lower industry-value-added-to-GDP quotients were among those with higher industrial water use efficiency, while low water-services-use-efficiency quotients were associated with high services value added to GDP. Suggestions for policymakers are provided and formula application guidelines for regional-level comparisons are described.
1. Introduction
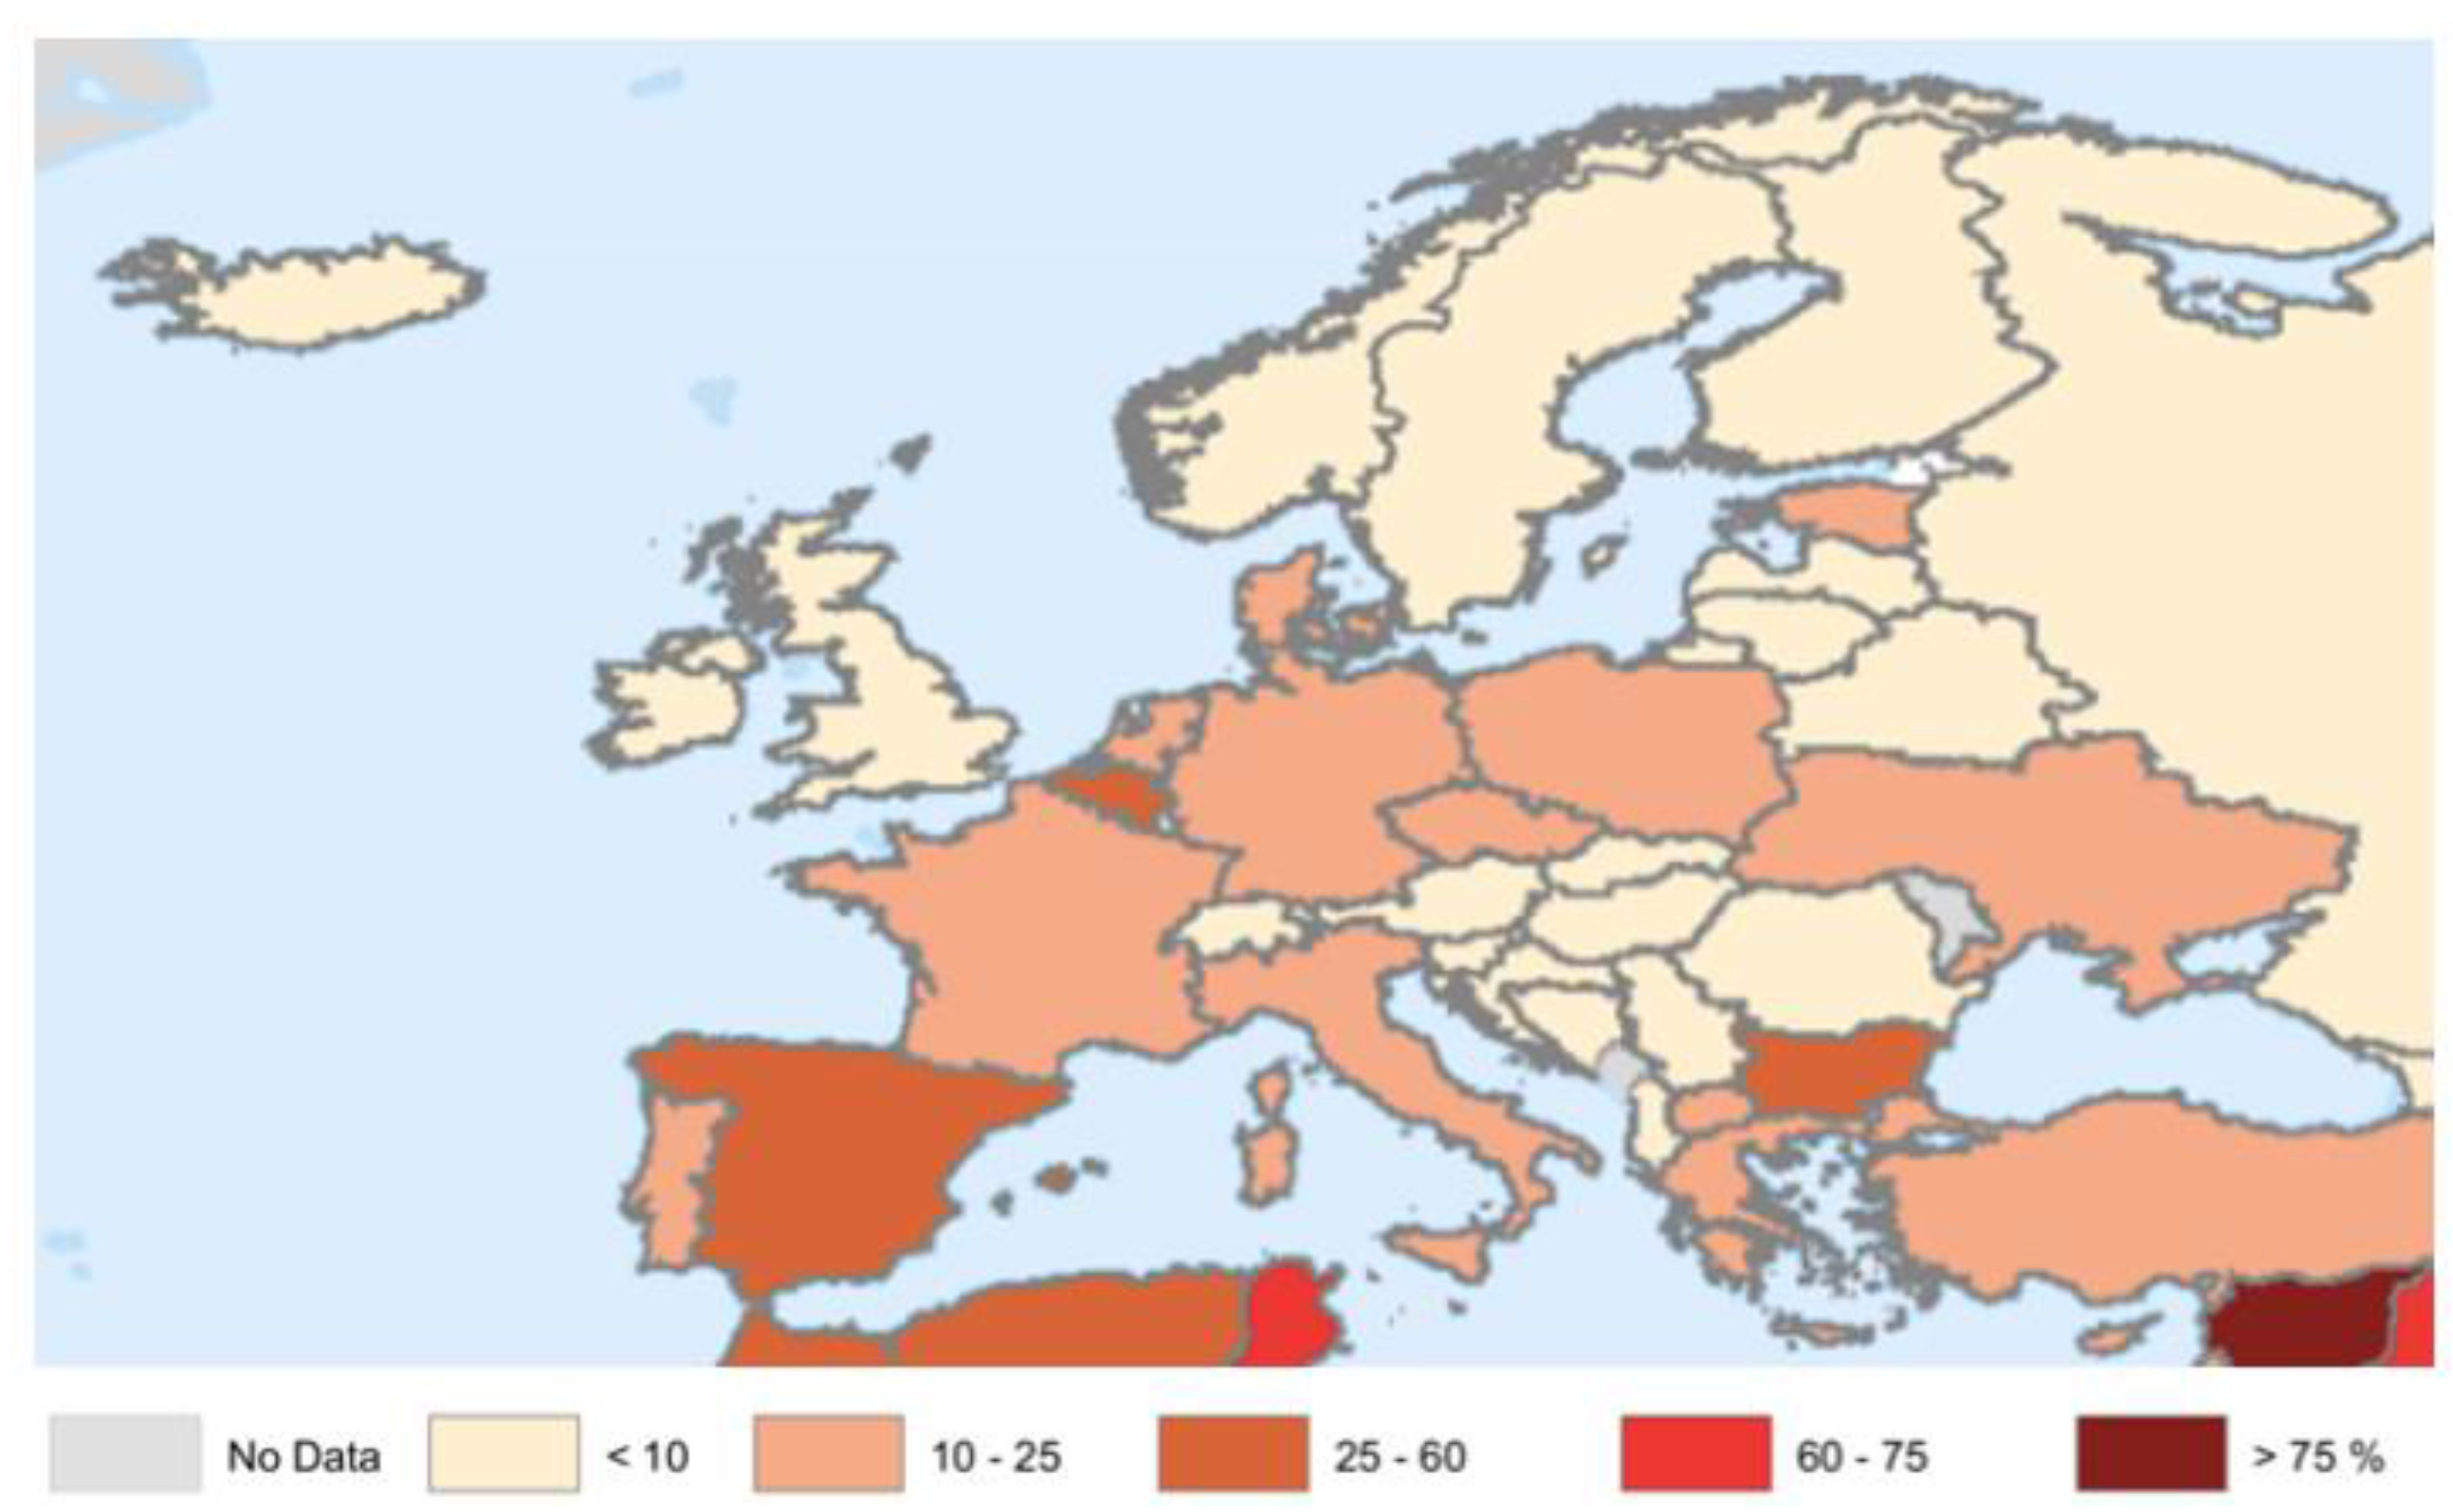
One of the main issues in economics is how to balance the infinite demands from the market with the finite resources of the planet. Water was, and is, a concern for many countries since it is the life-sustaining natural resource [1]. Its scarcity is already felt in many regions of the world, associated with its use and consumption [2], and the consequences of climate change [3]. The renewable water resources withdrawn in the European Union (EU) are already significant, with withdrawal rates from 25% to 60% in Spain, Belgium, and Bulgaria, and from 10% to 25% in ten other EU countries (Figure 1).
The approval of the 2030 Agenda at the historic sustainable development summit in 2015 provided a plan with 17 sustainable development goals (SDGs) for universal application to govern countries’ efforts to achieve a sustainable world by 2030. Specifically, Goal 6 aims to ensure the availability and sustainable management of water, and sanitation for all. Despite progress, 2.2 billion people lack safely managed drinking water, and 4.2 billion people lack safely managed sanitation. These problems were aggravated due to the effects of the COVID-19 pandemic because 3 billion people worldwide lack water for basic disease prevention, such as handwashing and sanitation facilities in the home, evidencing the challenge of accessing water to improve lives and health [4].
Water consumption equality can be fostered by a comprehensive understanding of water use inequality and its underlying causes. There has never been a single factor that has been dominant in causing water consumption inequality. Furthermore, the effects of various factors have changed over time. It is nearly impossible to reduce water consumption inequality through policy changes to a variety of factors. As a result, economic development cannot reduce water consumption inequality, and more targeted policies and efforts are required to reduce water consumption inequalities [5].
Understanding water use and economic development is critical for addressing the causes of environmental degradation. Sustainable solutions are needed to boost economic growth while also lowering water consumption and pollution. It is critical to consider the impact of economic development and water resource consumption on renewable water resources and their effect on water quality [6]. A study in the north-western China arid region investigated water resource utilization and economic development. This research established a relative decoupling with a weak negative association between water quantity and quality and economic development. The study established a limited dependency between water resources and economic development. Water efficiency had not been improved since water shortage remained a serious issue affecting life and economic activity. The study concluded that improving water quality and quantity can lead to the sustainable development of water use, and economic development [7].
Global water consumption for domestic and manufacturing use quadrupled from 1950 to 2010, with higher rates observed in the period from the 2000s [8]. In agriculture, in the period 1971–2000, 85% of ‘blue’ water taken from rivers, lakes, and aquifers was used for crop production, representing an average of 7200 km3/year [9]. Beyond the need of water for agriculture, the problem of poor water utilization is significant, as evidenced by industrial and domestic wastewater discharge. Governments need to focus on wastewater treatment, strengthening water conservation awareness, and using stepped pricing standards to reasonably control water use [10]. In another study on water consumption in the Yangtze River economic belt (YREB) between 2004 to 2017, Kong et al. [10] applied the water footprint (WF) method using Moran’s I index. While WF is an indicator of water use in relation to its consumption by people [11], Moran’s I index helps to test whether there is spatial autocorrelation in a targeted indicator (in this case, WF) [10]. An overall increasing trend was observed with huge disparities among the provinces with respect to their WFs. Therefore, it is essential to reduce the WF, as the economy grows, to achieve sustainable development and a balanced use of natural resources.
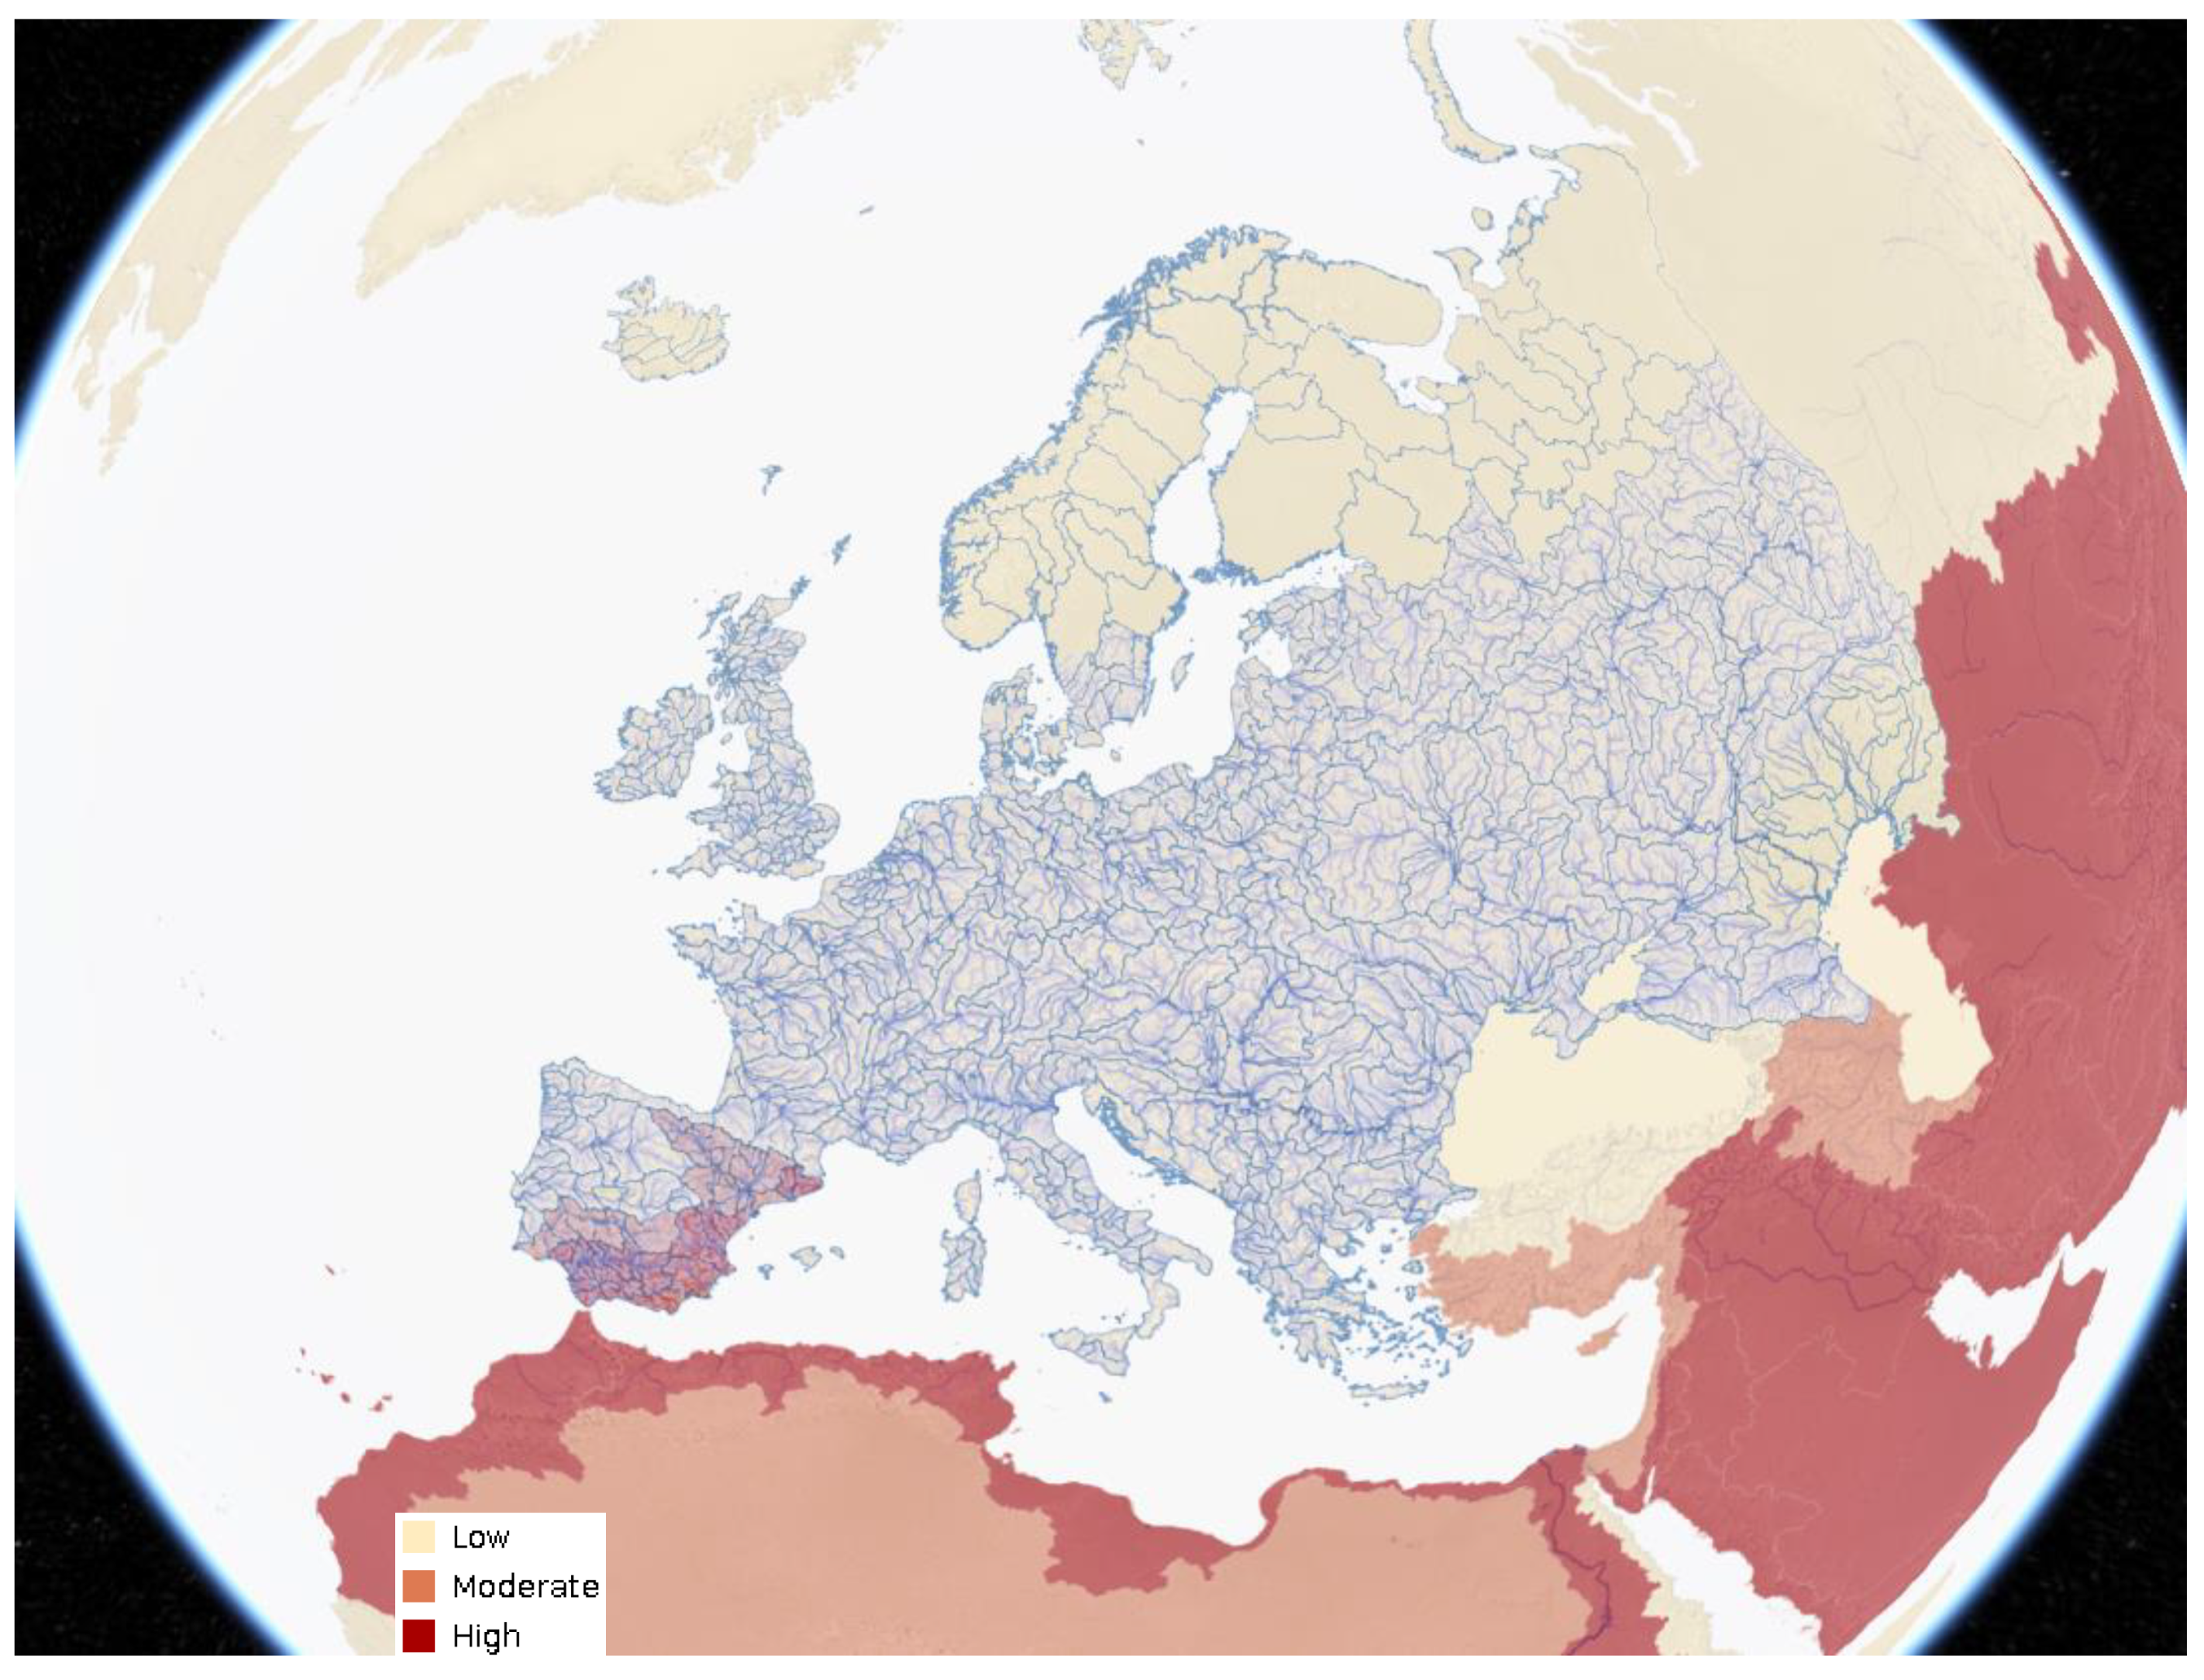
The Food and Agriculture Organization (FAO) AQUASTAT map (Figure 2) shows variations in the consumption of water for irrigation as a result of evapotranspiration and renewable freshwater resources consumed by plants. The map also shows the rivers and hydrological basins of EU countries, evidencing that these countries are supplied by extensive freshwater from renewable sources. However, several geographic characteristics and climate change influences associated with unbalanced water withdrawal can result in water scarcity. Though scarcity exists in arid regions, like deserts, growing scarcity levels (moderate to high) are already observed also in south and south-eastern Spain and the south of Portugal, presenting a warning to other EU countries.
Many contributions to the testing of models are available from previous studies. The iterative micro-macro-economic modelling framework of Parrado et al. [13] was proposed to assess agricultural water management policies. The integrated model of Ke et al. [14] was proposed to assess trade-offs between economic growth, water use, and environmental protection. The water-energy-food (WEF) nexus was proposed by Markantonis et al. [15] to integrate the assessment of synergies/trade-offs from different industries to focus the development of water management policies towards sustainability. The vector-error correlation model of Bao and He [16] was used to identify the indicators associated with water crisis. Katz [17] applied the environmental Kuznets curves to predict water use and economic growth.
Despite the relevant contributions of the existing models, understanding economic and sustainability inequalities and water consumption requires broader analyses because several factors influence water consumption and scarcity. Therefore, it is intended to advance the field of research by proposing a contextual analysis of three sets of indicators in order to identify comparable quotients and more effectively targeted public policies for balancing water consumption and the impacts of human and economic activities on the environment.
Considering the current scenario, it has become critical to analyze water consumption using an economic and sustainability inequalities approach with the purpose of providing feasible pathways to attain the desired level of decoupling and achievement of the SDGs, specifically Goal 6. Having identified the lack in the literature of a tool that could aid policymakers in comparing country-level inequalities concerning economic and sustainability indicators related to water consumption, this research has as its goal to analyze the sustainability inequalities in water consumption of EU countries.
Our research contributes to the existing body of literature in several ways. Firstly, this research focused on AQUASTAT descriptive data from EU countries for the period of 1998–2017, by comparing different indicators based on a formula previously created to analyze locational quotient, and that was adapted for the exploration of economic and sustainability inequalities of EU countries. Secondly, the results of this study can help policymakers to better address water resources at national and regional levels to overcome water scarcity, reduce wastewater, and raise awareness of its use by agriculture, manufacturers, and citizens living in municipalities. Thirdly, this research proposes an easy-to-use econometric model for determining the QESW related to different indicators available from the AQUASTAT database. Fourthly, the QESW provides a methodology for comparing benchmark countries regarding renewable water resources, and underlines which indicators need more effort with a view to achieving a balanced use of water according to specific country-level characteristics. Finally, QESW is more effective than other indexes because it allows policymakers to perform flexible comparisons of specific indices and to compare cross-country ranking in order to better direct public policies and actions towards sustainability in water consumption.
Although several regions of the world are already facing the effects of water scarcity, reflecting the characteristics of each region, the focus of this research concentrates on the consumption and use of water and their economic and sustainability inequalities in EU countries. This research seeks to assist policymakers by providing comparative and longitudinal analyses using AQUASTAT indicators, and identifying the countries that show greater inequalities regarding water consumption and use and the environmental and economic impacts caused.
The rest of the paper is structured as follows: Section 2 is dedicated to reviewing the literature on water consumption and its effects, and on possible solutions; next, in Section 3, the materials and methods section presents descriptive statistics and the economic and sustainability inequalities and water consumption econometric model; the results and discussion are presented in Section 4; the paper ends with a Section 5 followed by cited references.
2. Literature Review
Water Consumption, Its Effects, and the Solutions to the Imbalances of Its Consumption and Economic Growth
Despite the great importance of water scarcity, water consumption is impacted by economic activities, as identified in previous studies. Wang and Wang [6] explored the relation between water consumption and economic activities and found that the balance of these two areas is the main challenge for achieving sustainability, particularly in developing countries. Wang and Wang [6] also found that economic level and population size are positively associated with water consumption, and that technologies for water-saving in the industrial sector, as well as the consideration of sustainable water use (according to the Agenda 2030 for sustainable development) are key for policy-makers. Other research [18] on water consumption and economic growth has reported that an effective decoupling of water consumption occurs in secondary and tertiary industries. This research also reported that economic development is positively associated with water consumption changes.
A relationship between municipal water consumption and economic development has not been reported. Pastor and Fullerton [19] identified no relation between municipal water use and real personal income. Despite no relationship being found by Pastor and Fullerton [19], Wang and Li [20] observed that water consumption in urban areas faces the same issues as in rural areas, the need for a balance between water consumption and economic development. The authors [20] found that in countries with high population density, the balance between water consumption and economic development was challenging.
In the energy sector, water scarcity is influenced by energy generation due to water withdrawal for energy production. Yang et al. [21] recommended that water consumption should be separated from the energy system to guarantee environmental sustainability and energy security.
Economic growth has been the focus of several studies due to its widely recognized impact on water consumption. This is because water resources impose constraints on economic growth at regional level [22]. Water conservation in agriculture, improved technical efficiency, and reducing the dependency of economic growth on water resources, can each help enhance water sustainability. One way that governments may foster a water consumption balance is by supporting the development of tertiary industry. In one study [22], the authors found that water resources impact economic growth in countries that show an increase in labor indicator values. Similarly, Duarte et al. [23] argued that population growth and economic growth are critical factors for increasing water use. Hao et al. [24] reported that industrial water use impacted water use, while non-industrial water consumption and per capita GDP are nonlinearly associated. Studying water pollution and economic growth associations allowed Liu et al. [25] to conclude that wastewater emissions rise with economic growth.
The impacts of water consumption in the industrial sector have also been studied previously. Li et al. [26] analyzed textile industry impacts on water consumption and found that industrial scale and water use efficiency are critical for water consumption. Li et al. [27] reported that the textile industry produced large amounts of wastewater and that this was decoupled from economic growth in the periods analyzed. An investigation by Chen et al. [28] on economic growth, industrial structure, and water quality, revealed an autocorrelation of pollutant concentration. Gu et al. [29] found an inverted U-shaped curve relationship between per capita industrial water use and GDP.
In agriculture, Abdul-Rahim et al. [30] suggested that soil and water conservation can positively contribute to reducing poverty and promoting economic growth. In the study by Parrado et al. [13], application of a micro-macro-economic model indicated that water conservation could be achieved with lower economic losses.
Population also affects and is affected by water consumption. In urban areas, the study of Wang et al. [31] analyzed the economic growth and water usage of Chinese megacities, concluding that the most balanced was Guangzhou. This study [31] demonstrated that decoupling of water use from economic growth is more evident in urban areas than in rural areas. In the study of Zhao et al. [32], population is one of the most influential factors for water use and economic growth. Similarly, research conducted by Bao et al. [33] revealed that urbanized areas contributed to 30% of Chinese economic growth, and provided evidence of water consumption according to industrial activity and population concentration. Bao et al. [16] suggested that high urbanization over the short-term, as is occurring in China, might lead to a water crisis.
Concerns about water conservation increase with increased economic and social impacts. The study of Liu et al. [34] showed that soil and water conservation (SWC) is affected by local economic structure, and suggested that country governments need to balance the nexus of ecological protection and economic growth. Kyei et al. [35] also recommended that economic and environmental balance regarding water use and pollution is needed, considering what might be achieved with a tax regime on polluted water. Similarly, Tao [36] identified a decoupling when studying economic growth and pressure on water use, evidencing that industrial structure transition and investments in science and technology (S&T) can facilitate pollution prevention and increase environmental quality. Barbier [37] suggested that freshwater utilization is not constraining the growth of most economies, although Ordos (China), Ke et al. [14] emphasized that water supply plans can maximize reclaimed water through sewage treatment technologies and adequate water allocation. Markantonis et al. [15] reported that the Mediterranean region is vulnerable to water scarcity, and that water consumption and economic growth must take into account sustainability when considering trade-offs in different industries.
Water scarcity is under study by scholars seeking to identify potential contributions from technology and renewable water resources. Qiao et al. [38] found that water technologies have been shown to increase GDP growth, even though current water technologies are inadequate to overcome the major constraints imposed by water resources. Esen, et al. [39] studied water stress, reporting that, in nine European countries, growth rate above a threshold increased water resources stress.
3. Materials and Methods
3.1. Descriptive Statistics
The dataset was formed from available data retrieved from AQUASTAT. Four different periods were chosen for longitudinal analyses: 2002 (representing data from 1998 up to 2002), 2007 (2003 to 2007), 2012 (2008 to 2012), and 2017 (2013 to 2017). The selected AQUASTAT indicators comprised the analysis frame for 27 countries of the EU: Austria, Belgium, Bulgaria, Croatia, Cyprus, Czechia, Denmark, Estonia, Finland, France, Germany, Greece, Hungary, Ireland, Italy, Latvia, Lithuania, Luxembourg, Malta, the Netherlands, Poland, Portugal, Romania, Slovakia, Slovenia, Spain, and Sweden.
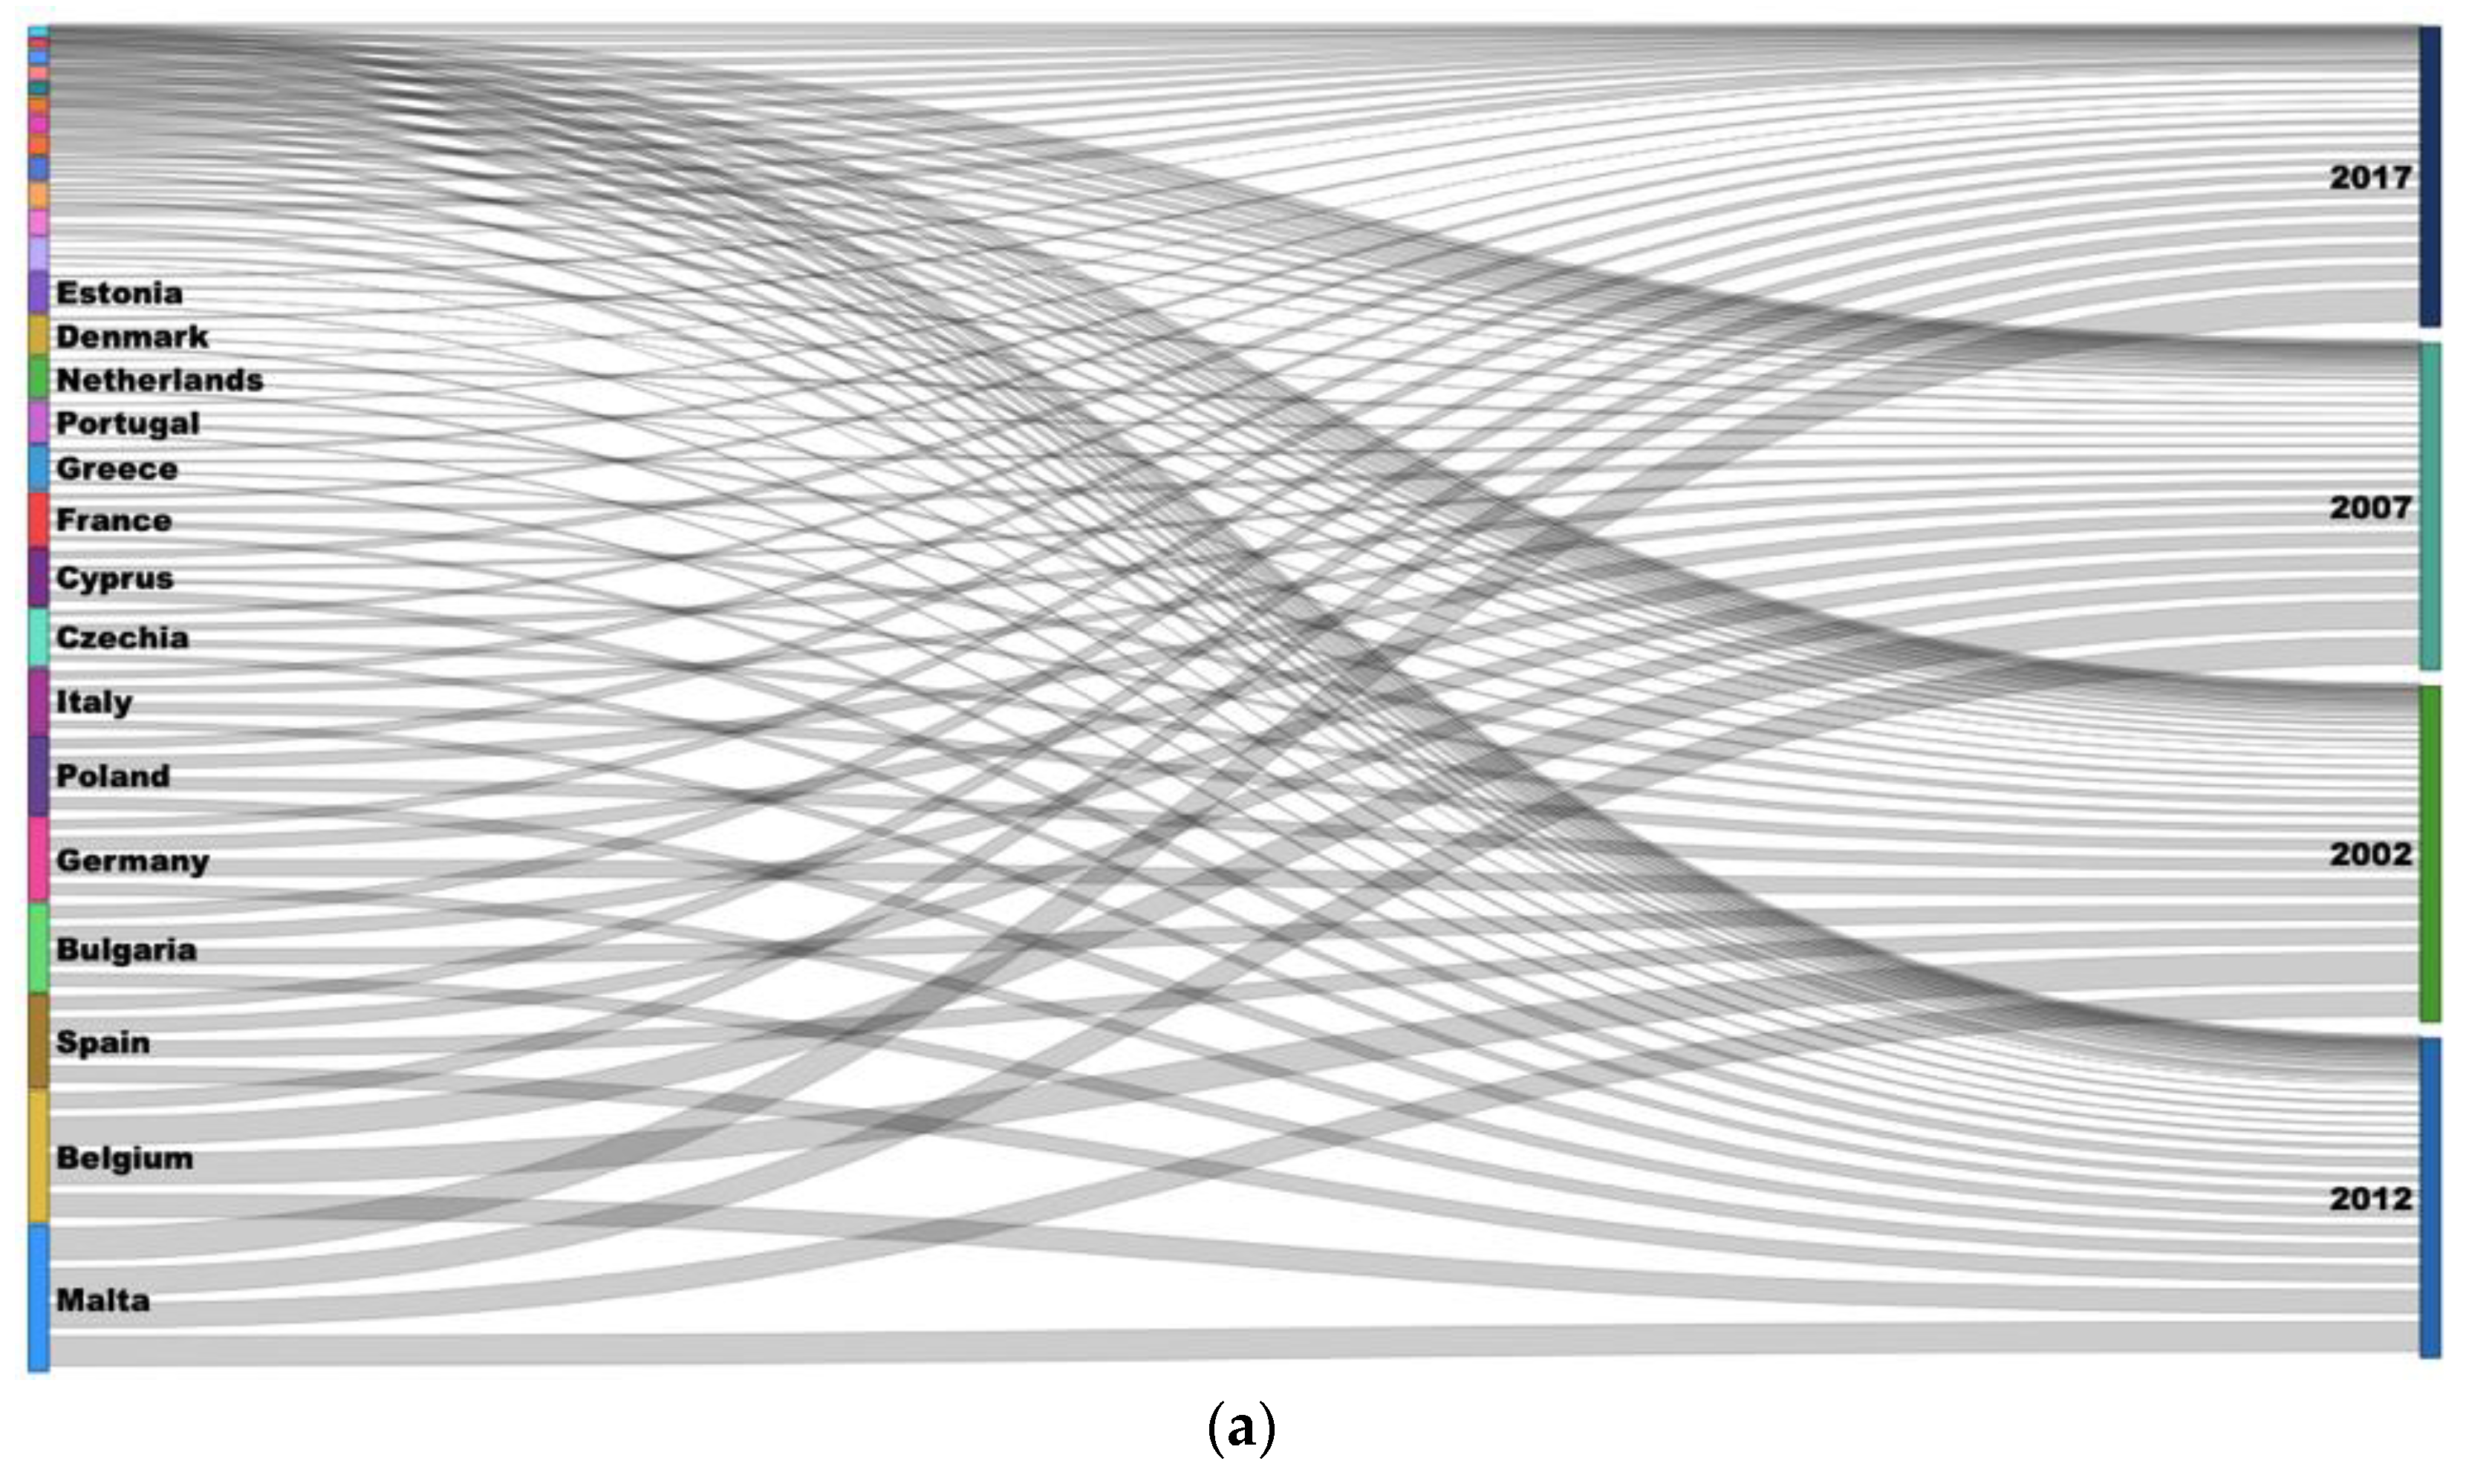
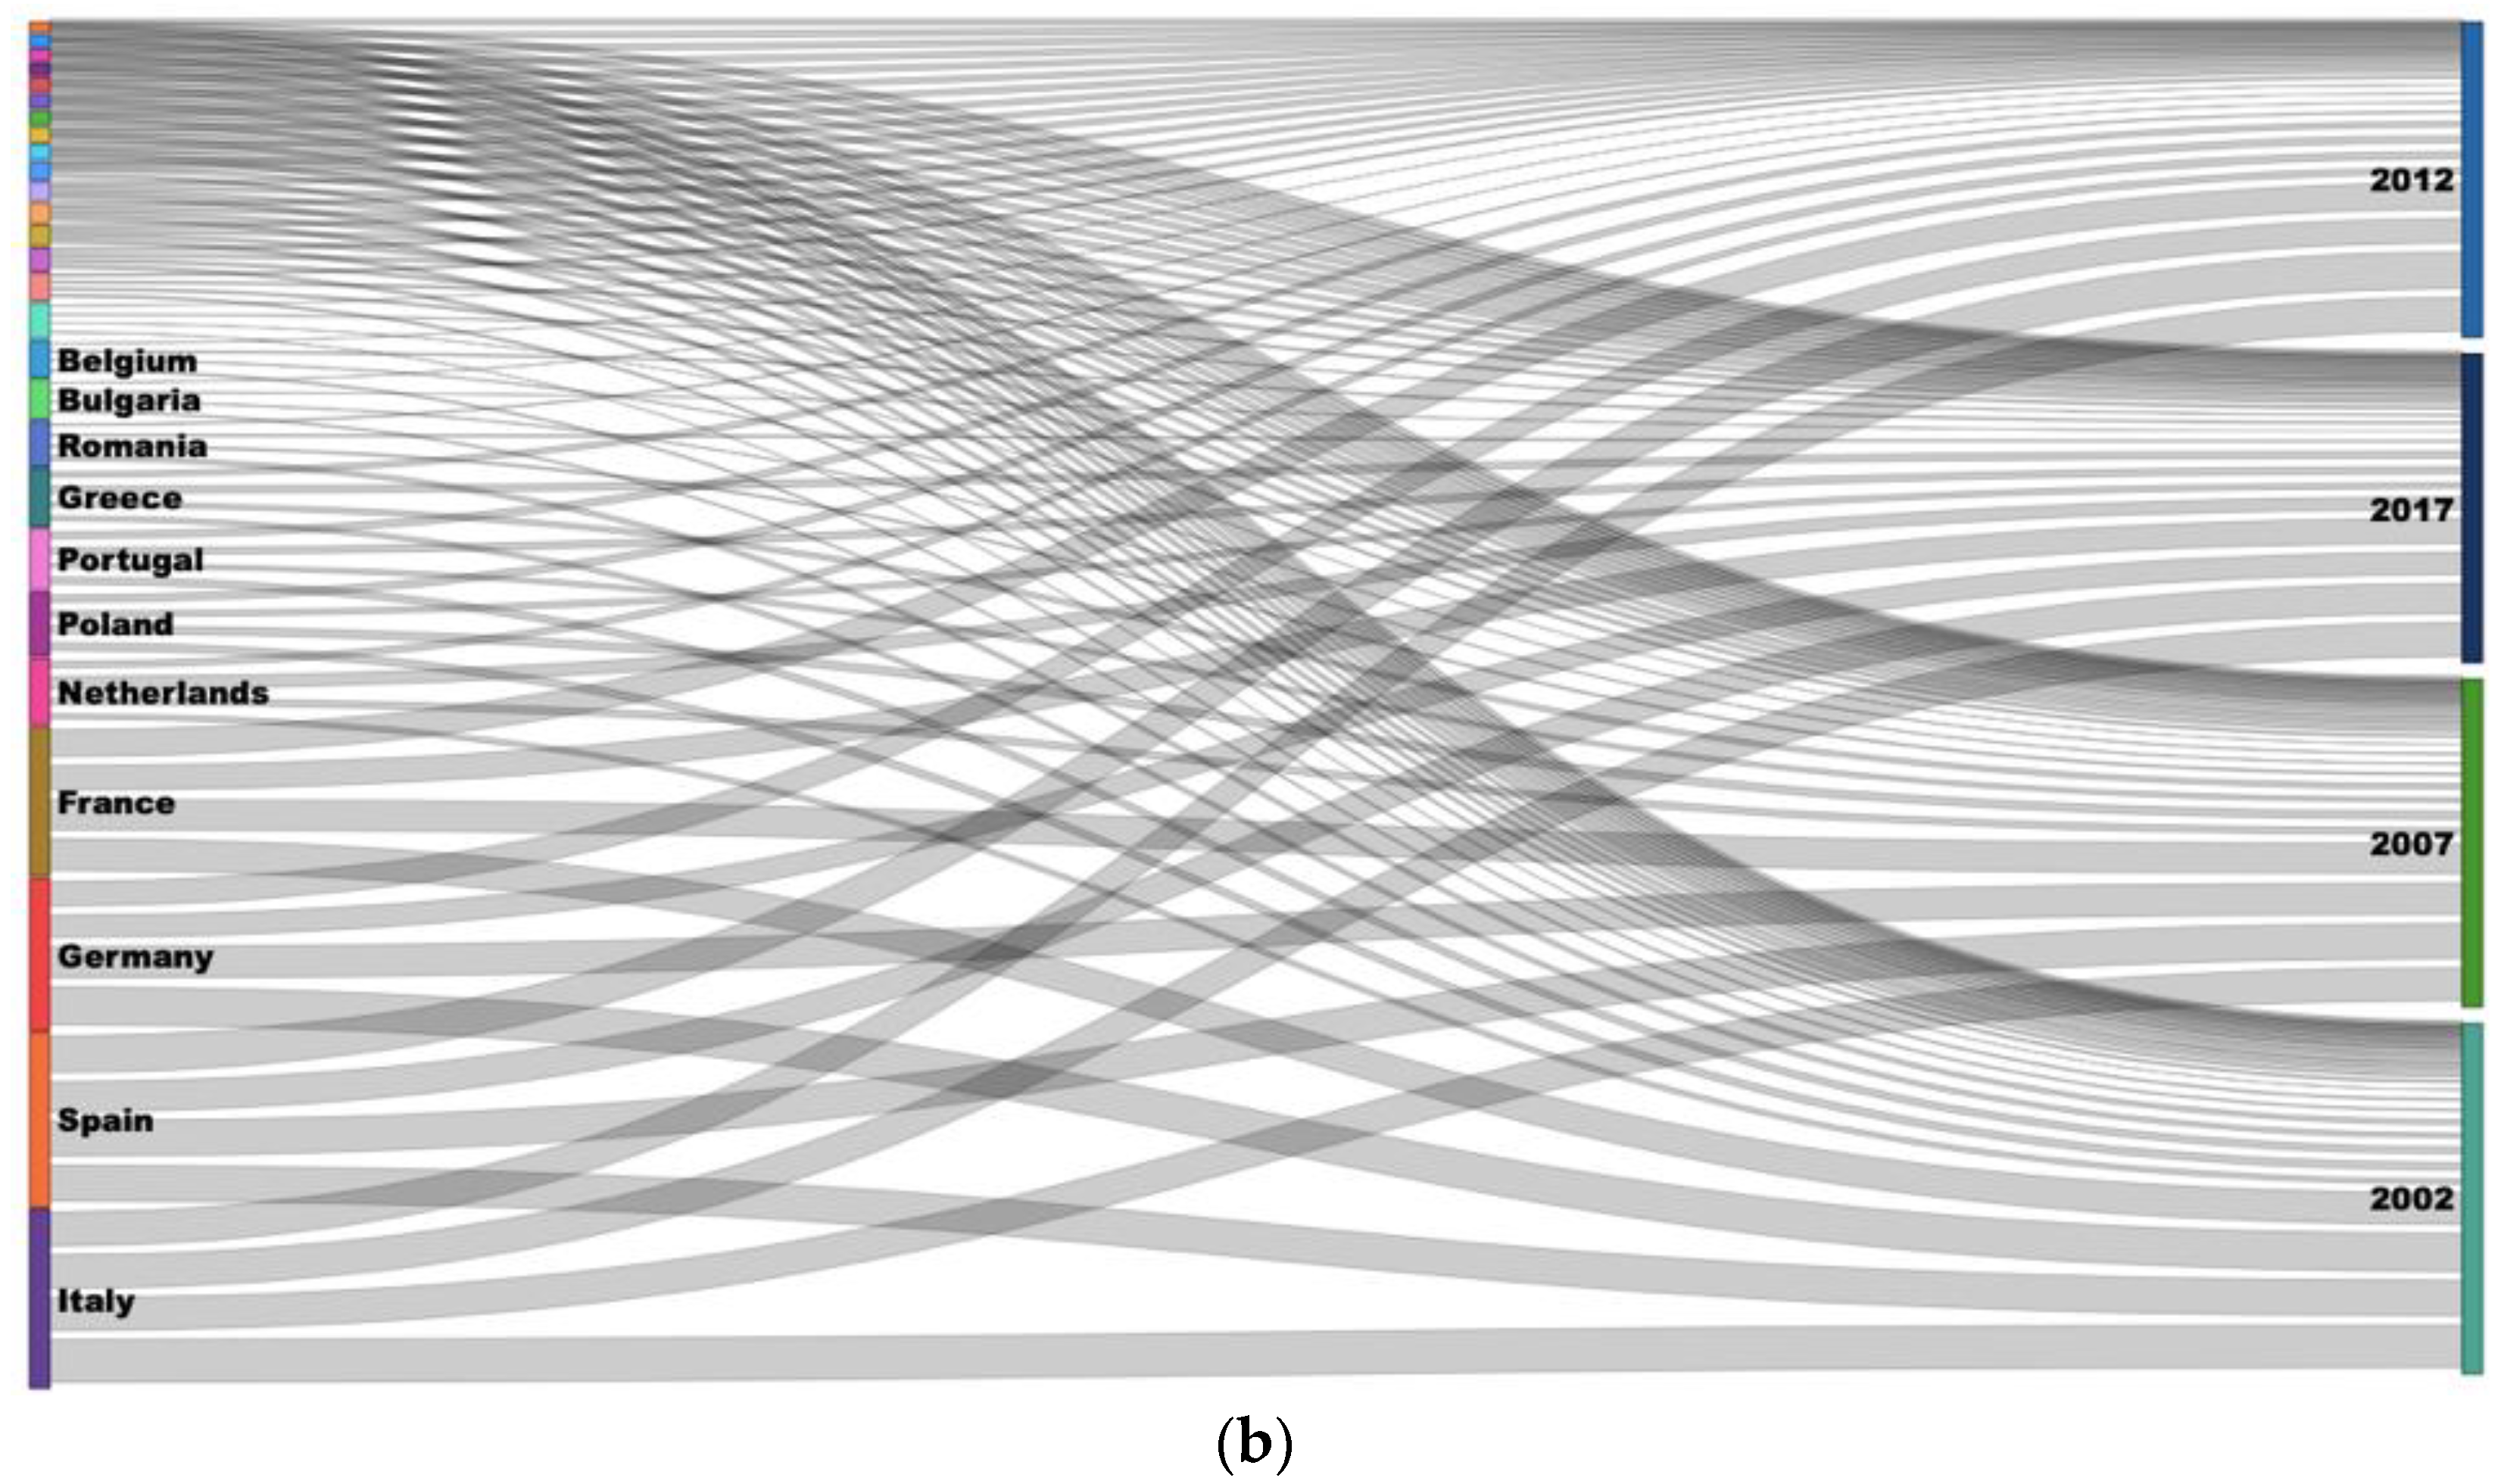
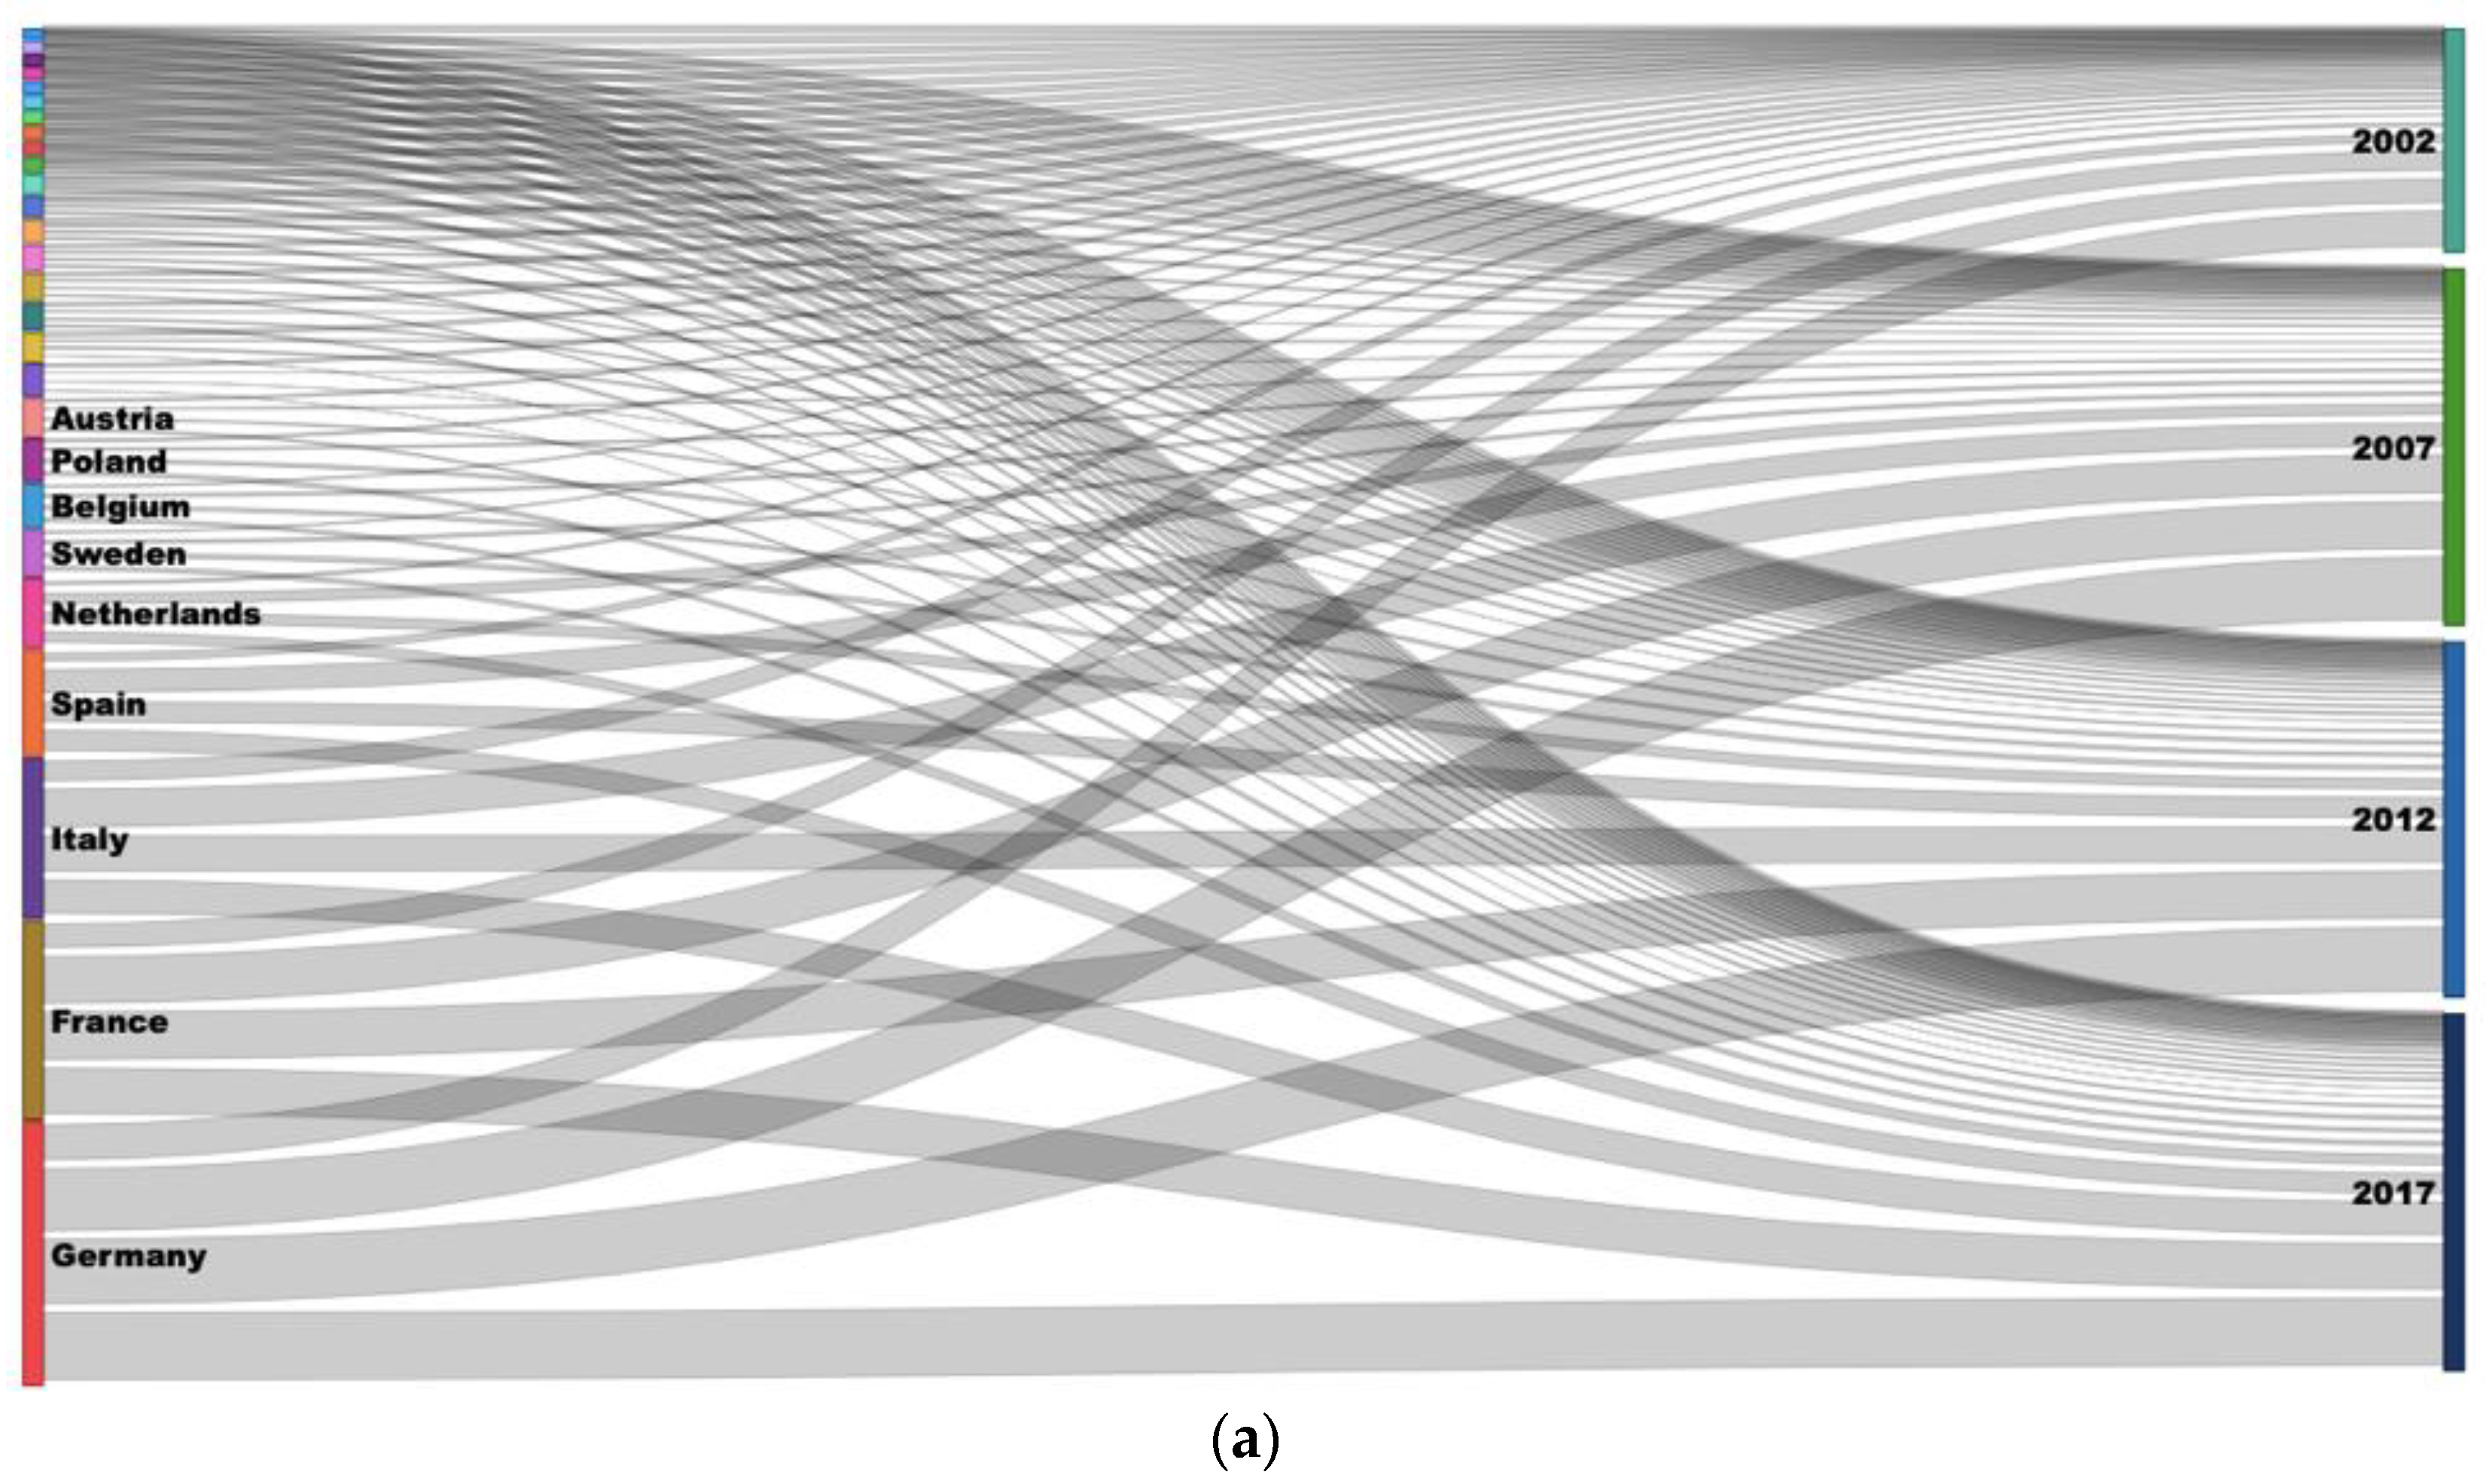
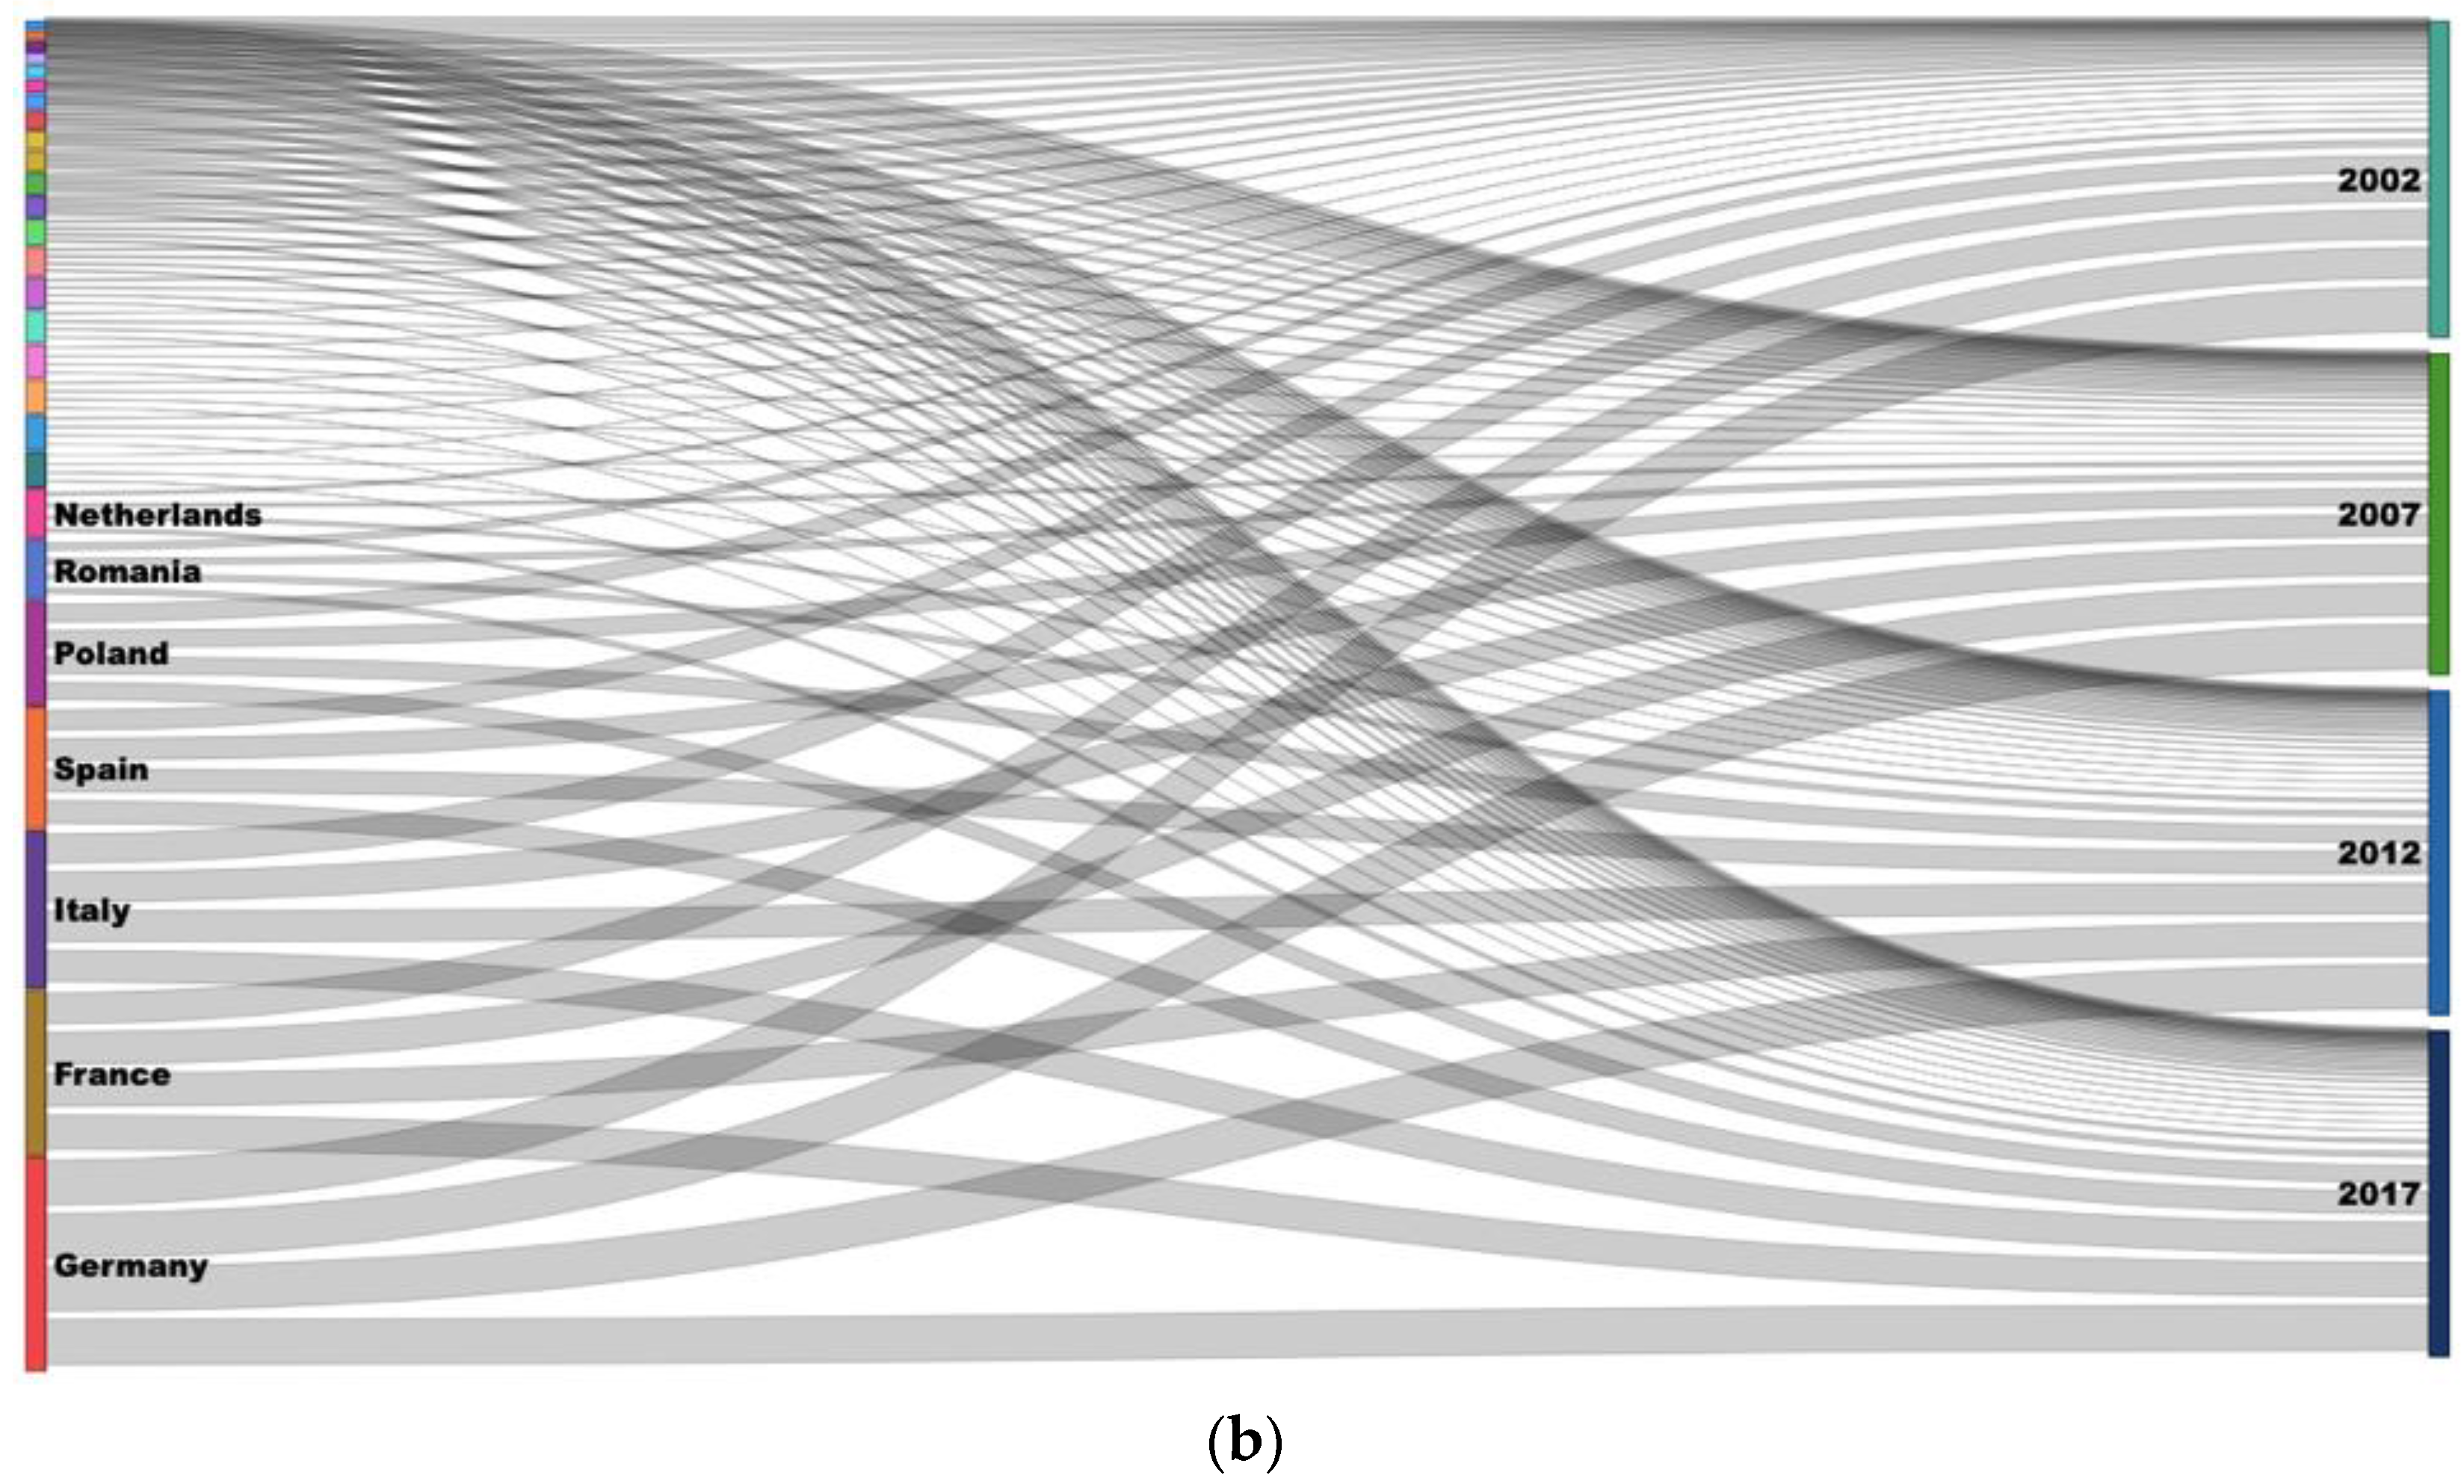
Aiming to identify the economic and sustainability inequalities of water consumption related to these countries, a longitudinal comparison was performed by using the Sankey diagrams [40] of four main AQUASTAT indicators related to economic inequalities (GDP and total population), and sustainability inequalities (total water withdrawal and water stress), for descriptive purposes. These longitudinal analyses allowed the identification of the most representative countries per subject and per analyzed period. Sankey diagrams were chosen since this method of data visualization allows the identification of the statistical compositions of countries and periods in the same image. Sankey diagrams were generated with the Microsoft Power BI software and the results are presented in Figure 3 and Figure 4.
3.2. The Economic and Sustainability Inequalities and Water Consumption Econometric Model
This research departed from the locational quotient (LQ) created by Paiva [41] for determining regional specialization of regions in a country by analyzing employability indicators. This econometric model was conceived to identify which specialties stand out and which remain behind in a given region. This tool aids policymakers in determining which economic sectors are well-developed and which ones need further support through incentives or public policies creation. The LQ was successfully applied by Ferasso [42] when studying the five macro-regions of the Brazilian state of Santa Catarina according to their economic base and employees per sector and per region.
Departing from this LQ [41], the adapted formula and the results of Ferasso’s work [42], we proposed the formula named the quotient of economic and sustainability inequalities and water consumption (QESW). Considering the different indicators made available from AQUASTAT for the most recent period (2017, representing data from 2013 to 2017), this study provides within-country and cross-country comparisons of EU countries related to economic and sustainability inequalities and water consumption. The proposed econometric model is presented in Equation (1), where indicator X in the formula refers to different indicators to be considered (as shown in Table 1).
The AQUASTAT indicators were selected according to three different criteria for analysis, as shown in Table 1. Considering the need to select comparable indicators, i.e., the total of a given indicator and its component parts (e.g., total population = rural population + urban population), 16 indicators were chosen. Five indicators corresponding to two AQUASTAT indicators groups (population; economy, development, and food security) were classified as economic inequality indicators: urban population; rural population; services, value added to GDP; agriculture, value added to GDP; and industry, value added to GDP. Concerning sustainability inequalities indicators, the following three groups of AQUASTAT indicators (total renewable water resources, exploitable water resources and dam capacity, and pressure on water resources including data for SDG 6.4) were classified in this category; indicators included: total renewable surface water, total renewable groundwater, exploitable surface water, total renewable surface water, SDG 6.4.1. services water use efficiency, SDG 6.4.1. irrigated agriculture water use efficiency, and SDG 6.4.1. industrial water use efficiency. Finally, the category of water consumption indicators was formed by the following two AQUASTAT indicator groups (water withdrawal by sector, and water withdrawal by source) including: agricultural water withdrawal, industrial water withdrawal, municipal water withdrawal, fresh surface water withdrawal, and fresh groundwater withdrawal.
4. Results and Discussion
4.1. Descriptive Analyses
Figure 3 presents the results of Sankey diagrams related to water stress (SDG 6.4.2. water stress %), and total water withdrawal (109 m3/year), respectively. The countries that showed the greatest water stress (Figure 3a) did not vary in the four analyzed periods. However, it is possible to see that the period of 2012 (2008 to 2012) was the highest water stress period for all EU countries, followed by the period of 2002 (1998 to 2002). Malta had the highest water stress levels, showing a trend of water stress increase during the periods (2002: 67.33; 2007: 72.87; 2012: 79.4; 2017: 85.15), followed by Belgium, even though this country showed a decrease in water stress for period 2017 when compared to the previous three periods, and then Spain, the third ranked country in terms of water stress levels. Curiously, Bulgaria was ranked the fourth country in water stress, though this country showed a decreasing trend during the four analyzed periods. Germany appears in the fifth position, following the decreasing trend of Bulgaria. The countries that presented the least water stress in the analyzed periods were Latvia, Croatia, and Lithuania, ranked first, second and third respectively. Slovakia and Sweden were in the top five ranked countries more recently, having presented better indicators on water stress than Ireland and Luxembourg in the later analyzed periods.
Analyzing the total water withdrawal (Figure 3b), it is evident that the same period of 2002 (1998 to 2002) was also the period with the highest total scores for EU countries, followed by 2007 (2003 to 2007). This is, in part, explained by the water scarcity crisis (moderate water shortage/moderate water stress) that occurred in the 2000s, affecting the results for both water stress and total water withdrawal of EU countries [43]. Four countries were in the top five ranking for all analyzed periods of higher total water withdrawal. The first is Italy, even though this country showed a decrease in the total water withdrawal in period 2002 compared with the later three periods; however, the later three periods showed scores between 33.6 (2007) and 34.19 (2017). The second country in total water withdrawal is Spain, even though it showed the lowest score for the analyzed period 2017 (31.21); however, the previous periods showed scores between 35.7 (2007) and 36.64 (2012). In third place was Germany, following the same trend of decrease for the periods of 2017 (24.43) and 2012 (26.31), a decrease if compared to 2007 (32.3) and 2002 (37.75). France was fourth also showing a trend of decrease during the periods, from 32.36 in 2002, falling to 26.43 in 2017. In fifth place, the Netherlands passing Poland in the later period, showing 16.07 for 2017; while Poland was fifth country in total water withdrawal for the periods between 2002 and 2012. Among the top five countries that showed the lowest scores for total water withdrawal, three remained in unchanging positions, first Luxembourg (with decreased scores from 0.06 in 2002 to 0.04 in 2017), second Malta, and third Latvia. The fourth position was most recently for Lithuania (with 0.25 total water withdrawal in 2017), followed by Cyprus (0.31 in 2017). Other countries appeared in former periods such as Slovakia in 2012 (with 0.66), Denmark in 2007 (with 0.57), and Croatia in 2002 (with 0.57).
In Figure 4, the GDP (current USD) and total population (1000 inhab.) of EU countries are presented. Both indicators showed a trend of growth in all analyzed periods. Regarding GDP (Figure 4a), the top five countries for all periods included Germany (ranging from USD2.068 trillion in 2002 to USD3.665 trillion in 2017), France (from USD1.494 trillion in 2002 to USD2.683 trillion in 2012, with a slight decrease in 2017 to USD2.592 trillion), Italy (varying from USD1.270 trillion in 2002 up to USD2.210 trillion in 2007), Spain (also varying from USD705 billion in 2002 to USD1.472 trillion in 2007), and the Netherlands (presenting some stability in the last three periods of approximately USD830 to USD840 billion). On the other hand, the countries that showed the lowest GDPs remained also the same top five countries headed by Malta (varying from USD4.467 billion in 2002 to USD12.780 billion in 2017), Cyprus (from USD11.383 billion in 2002 to USD24.978 billion in 2012), Estonia (that more than doubled its GDP of 2002 in the three later periods to USD26.859 billion in 2017), Latvia (with the same trend as Estonia, presenting a GDP of USD30.274 billion in 2017), and Lithuania (more than tripling the GDP of 2002 in 2017, resulting in USD47.750 billion).
Total population (Figure 4b) showed a trend of growth across the three analyzed periods in EU countries. Leading countries with the highest number of people among EU countries were Germany (ranging from 81.53 million in 2002 to 82.658 million in 2017), France (from 59.803 million in 2002 to 64.842 million in 2017), Italy (from 57.182 million in 2002 to 60.673 million in 2017), Spain (varying from 41.919 million in 2002 to a maximum of 47.063 million in 2012), and Poland (presenting some stable scores in the former three periods at about 38 million, and a decrease in 2017 to 37.953 million). Among the less populated countries, Malta was in the first place (from 398.72 thousand in 2002 to 437.93 thousand in 2017), followed by Luxembourg (from 443.73 thousand in 2002 to 591.91 thousand in 2017), Cyprus (from 976.96 thousand in 2002 to 1.179 million in 2017), Estonia (presenting a slight decrease trend from 1.382 million in 2002 to 1.319 million in 2017), and Slovenia (for the former three periods ranging from 1.987 million in 2002 to 2.057 million in 2012), being passed by Latvia in 2017 (with 1.951 million).
After cross-analyzing the EU countries in relation to these four indicators, it was possible to see that Germany, with the highest GDP in the EU, also possessed the highest total population and was among the top five countries in water stress and total water withdrawal. France, with the second highest GDP and total population in the EU, was among the top five countries in total water withdrawal. Italy, the third EU country in GDP and total population, was the highest country in total water withdrawal. Spain, the fourth EU country in GDP and total population, was among the top five countries in water stress, being the first of the top five countries in GDP and total population to appear in the top five of water stress. The Netherlands, the fifth country in GDP, was among the top five countries in total water withdrawal. These results are consistent with the findings of Wang and Wang [6] and Duarte, Pinilla and Serrano [23] concerning economic level, population size, and water consumption, and with Wang and Li [20] on water consumption and economic development imbalance.
Even though Malta was ranked first among the lower GDP and total population, this country was in the first place for higher water stress among EU countries, and in second place amongst the lowest countries in total water withdrawal. Belgium and Bulgaria, not ranked among the top five countries either in higher/lower GDP or total population, appeared among the top five countries for higher water stress rates. Poland was among the top five EU countries that possessed the highest total water withdrawal, and was also in fifth position in terms of population.
Some interesting facts came from the EU countries that showed the lowest GDP and total population scores. Cyprus, the second lowest GDP and third in total population, was ranked among the countries in fifth position of lowest total water withdrawal. Latvia, the fourth lowest GDP and in total population, showed the lowest water stress score and third lowest total water withdrawal. Lithuania, similar to Latvia, showed the fifth lowest GDP, but the third lowest water stress score and fourth lowest score in total water withdrawal. Interesting findings came from Croatia, in second place in lower water stress, and in fifth position in lowest total water withdrawal. Slovakia followed the trend of Croatia, appearing as the fourth EU country with the lowest water stress score, and fifth position in lowest total water withdrawal. Another interesting finding came from Luxembourg that showed the second lowest total population among EU countries, but was ranked in fifth for lower water stress and first in lowest total water withdrawal. Countries like Sweden and Ireland appeared in fifth position in some analyzed periods regarding lowest water stress; while Denmark was also in fifth position in some analyzed periods for the lowest scores in total water withdrawal.
4.2. Quotients Analyses
The AQUASTAT indicators (Table 1) were considered for the calculation of different quotients according to the elaborated QESW Equation (1).
The results of the three categories (economic inequalities, sustainability inequalities, and water consumption) are now presented and discussed. Appendix A presents all the calculated quotients and Figure 5 presents the data concerning the economic inequalities indicators.
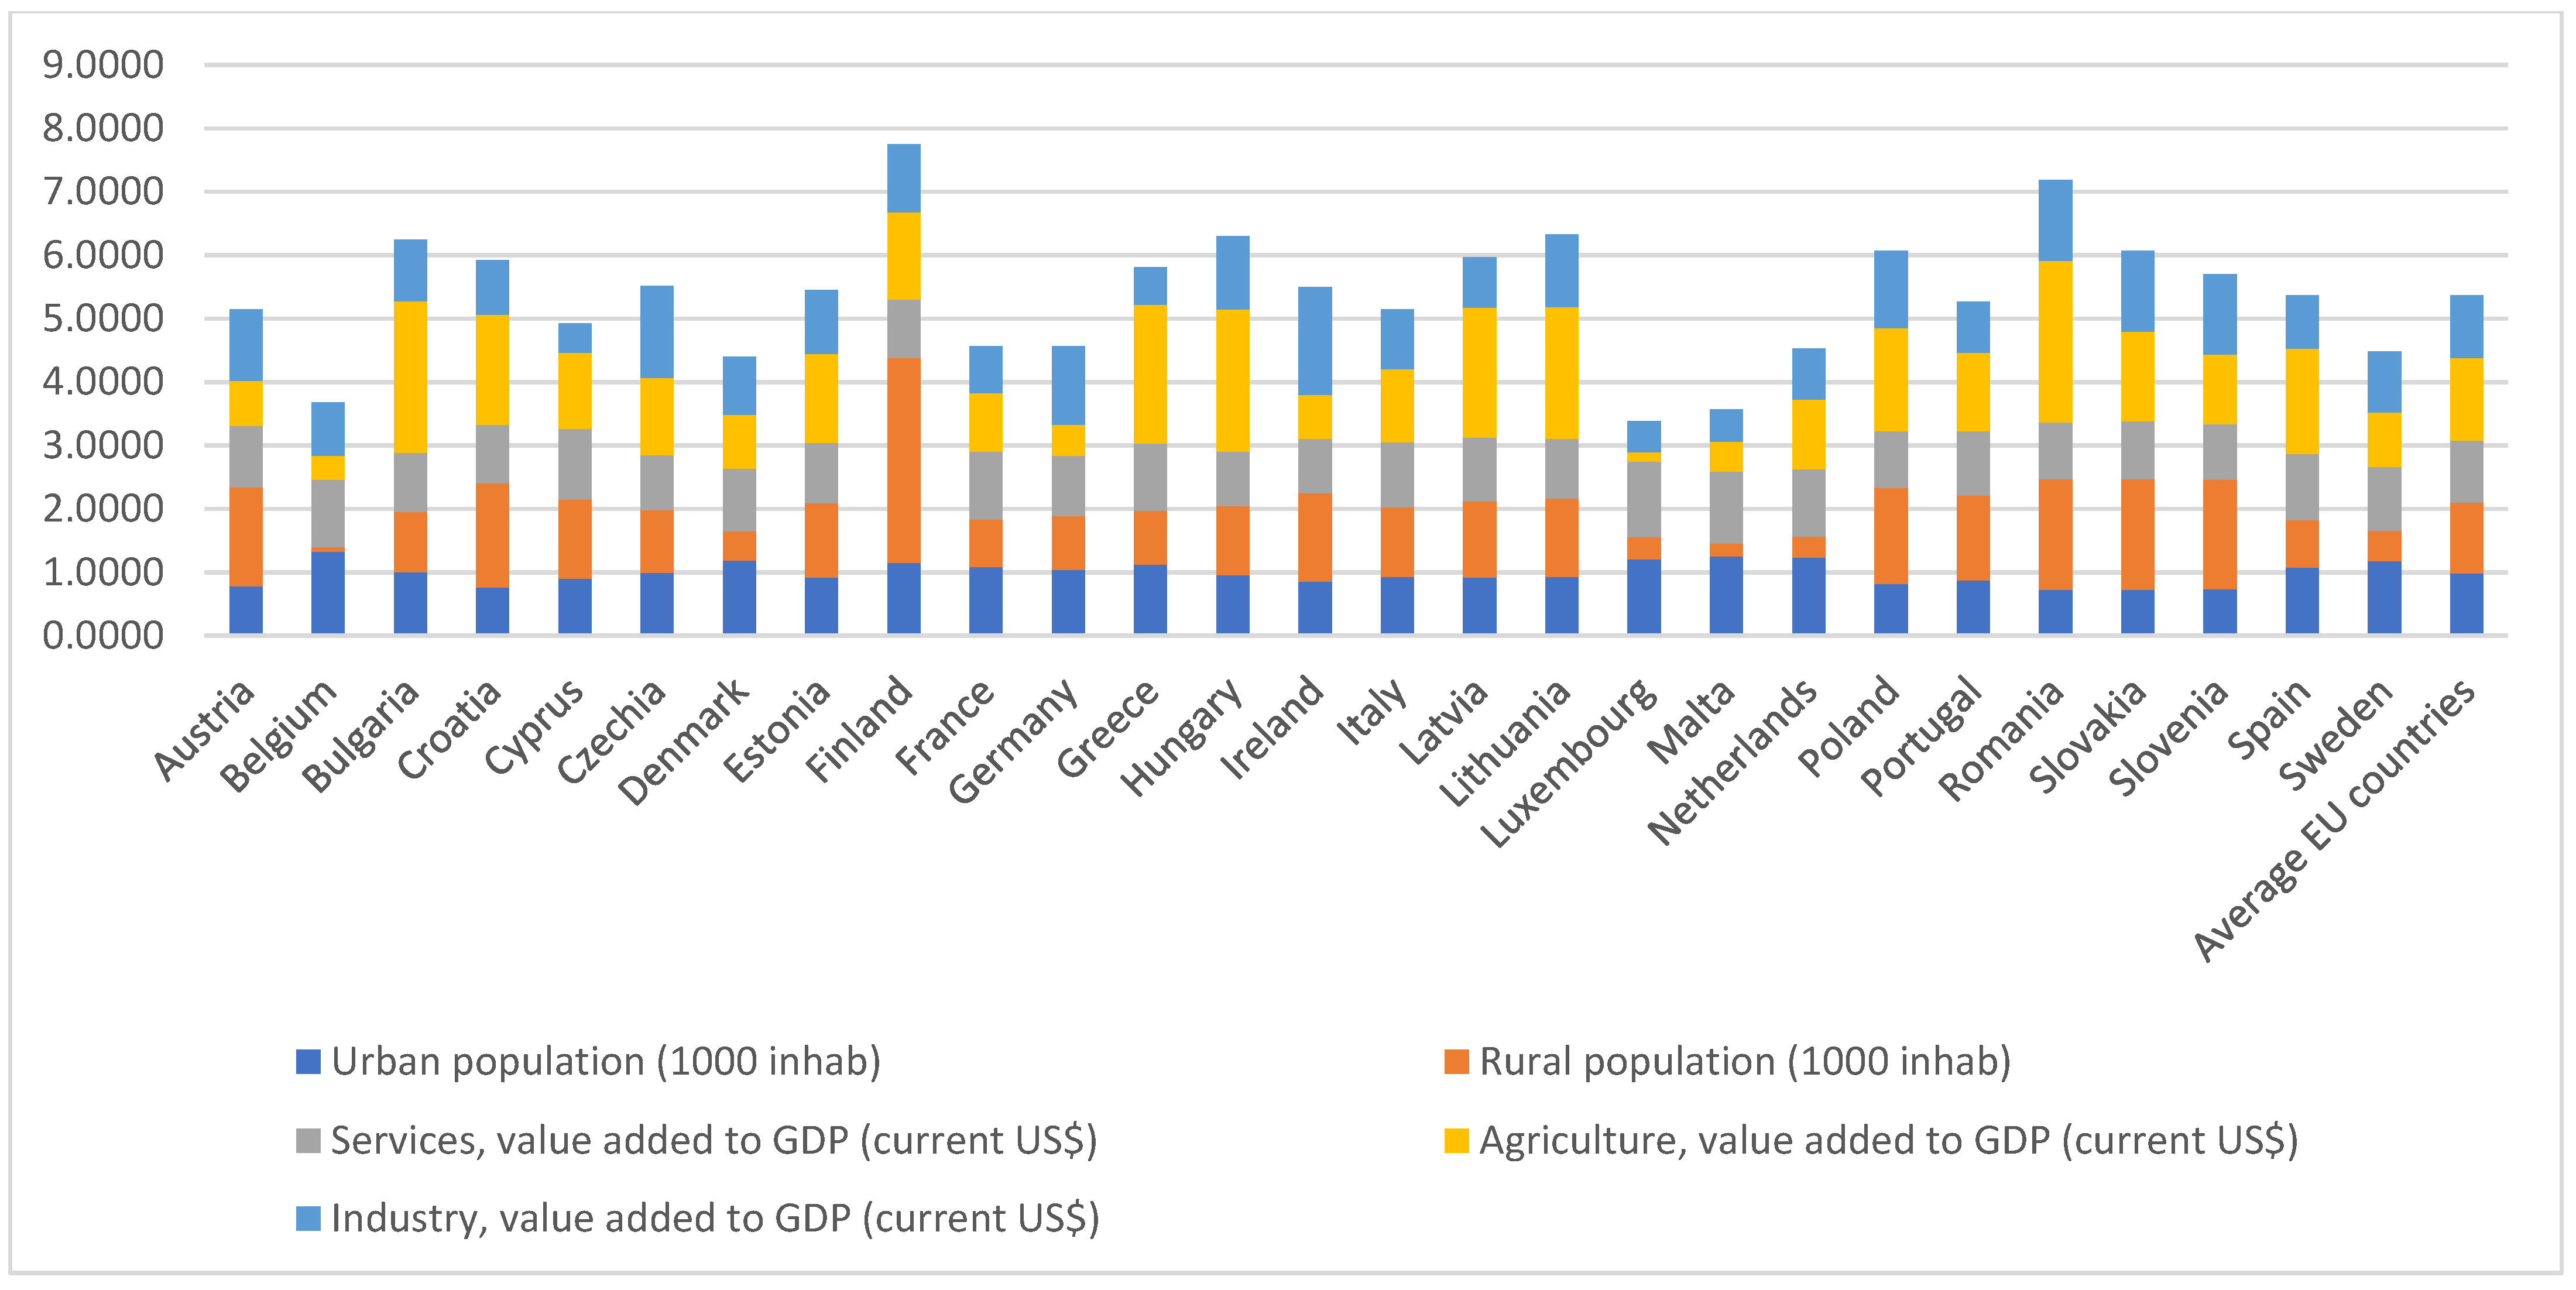
The set of economic inequalities indicators (Figure 5) related to EU countries allowed cross-country comparisons. The quotients of different indicators are not cumulative in each country, the selected indicators were grouped in the same Figure for within- and cross-country comparisons. Analyzing the urban population, the top five countries that showed higher quotients were Belgium (1.324), Malta (1.256), the Netherlands (1.231), Luxembourg (1.208), and Denmark (1.185). By comparison, the top five countries with the least quotients related to urban population were Slovakia (0.726), Romania (0.729), Slovenia (0.734), Croatia (0.766) and Austria (0.777). Managing water resources in urban areas is more critical than in rural areas [31], which implies that greater attention would be devoted to urban areas by the policy-makers of identified countries. This is also associated with the fact that population is one of most critical factor when assessing water use [32,33].
Regarding the rural population, of the countries that showed the highest quotients, Finland stands out (3.222), followed by Slovakia (1.742), Romania (1.738), Slovenia (1.726) and Croatia (1.635); while the countries with the lowest quotients of rural population were Belgium (0.077), Malta (0.202), the Netherlands (0.336), Luxembourg (0.344), and Denmark (0.461). The results evidenced that the countries in which people were most concentrated in urban areas are Belgium, Malta, the Netherlands, Luxembourg, and Denmark, while the countries in which people are mostly living in rural areas are headed by Finland, and then Slovakia, Romania, Slovenia, and Croatia. Even though Finland is considered one of the most rural countries among OECD countries, this rural population has decreased over the decades due to the aging of this part of the Finish population [44]. The, results showed that the countries with the most concentrated populations had the highest levels of water consumption [6,20,23].
With respect to the economic sectors that contribute to the GDP of EU countries, the service, agriculture, and industry sectors were analyzed respectively. The countries that were leading in the EU with respect to services were Luxembourg (1.194), Malta (1.132), Cyprus (1.116), France (1.1074) and Greece (1.064), while this economic sector added least value to the GDP of Hungary (0.852), Ireland (0.856), Czechia (0.863), Slovenia (0.881), and Poland (0.895). The economy of Luxembourg was based approximately 78% on services, represented by financial services, communications, and media services [45]. Malta’s GDP was also based largely on services at 76% of GDP of this country in 2017, mostly due to communication, transportation, and financial services [46].
Agriculture forms the primary basis of GDP for the following countries: Romania (2.552), Bulgaria (2.388), Hungary (2.247), Greece (2.191), and Lithuania (2.076), while it contributes least to GDP in Luxembourg (0.145), Belgium (0.377), Malta (0.469), Germany (0.492), and Ireland (0.694). Romania was considered the largest harvest producer in the EU in 2018, producing about 28% of maize in the EU [47], while Luxembourg and Malta are the countries in which agriculture was the less significant for GPD (these countries are at the top positions in the services sector).
With respect to the industry value added to GPD of EU countries, Ireland lead with 1.697, followed by Czechia (1.454), Romania (1.269), Slovakia (1.269), and Slovenia (1.264). The countries that presented the least industry value added to GDP were Cyprus (0.464), Luxembourg (0.497), Malta (0.514), Greece (0.589), and France (0.743). The analysis of quotients showed that the GDP of Luxembourg and Malta were more concentrated in the services sector, that Romania’s GDP was more concentrated in agriculture and industry sectors, and that Greece’s was concentrated in agriculture and services. The GDPs of Czechia and Slovenia were more based on industry, at the same time that these countries showed the lower quotients in the services sector. After analyzing three industries (services, agriculture, and industry), the countries with GDP based on secondary and tertiary industries are those that showed better decoupling of water consumption from economic growth [18,22]. Industry is still one of the economic sectors that impacts water resources [24,33], emphasizing the need for increasing water use efficiency [26], and decreasing wastewater and water pollution [27].
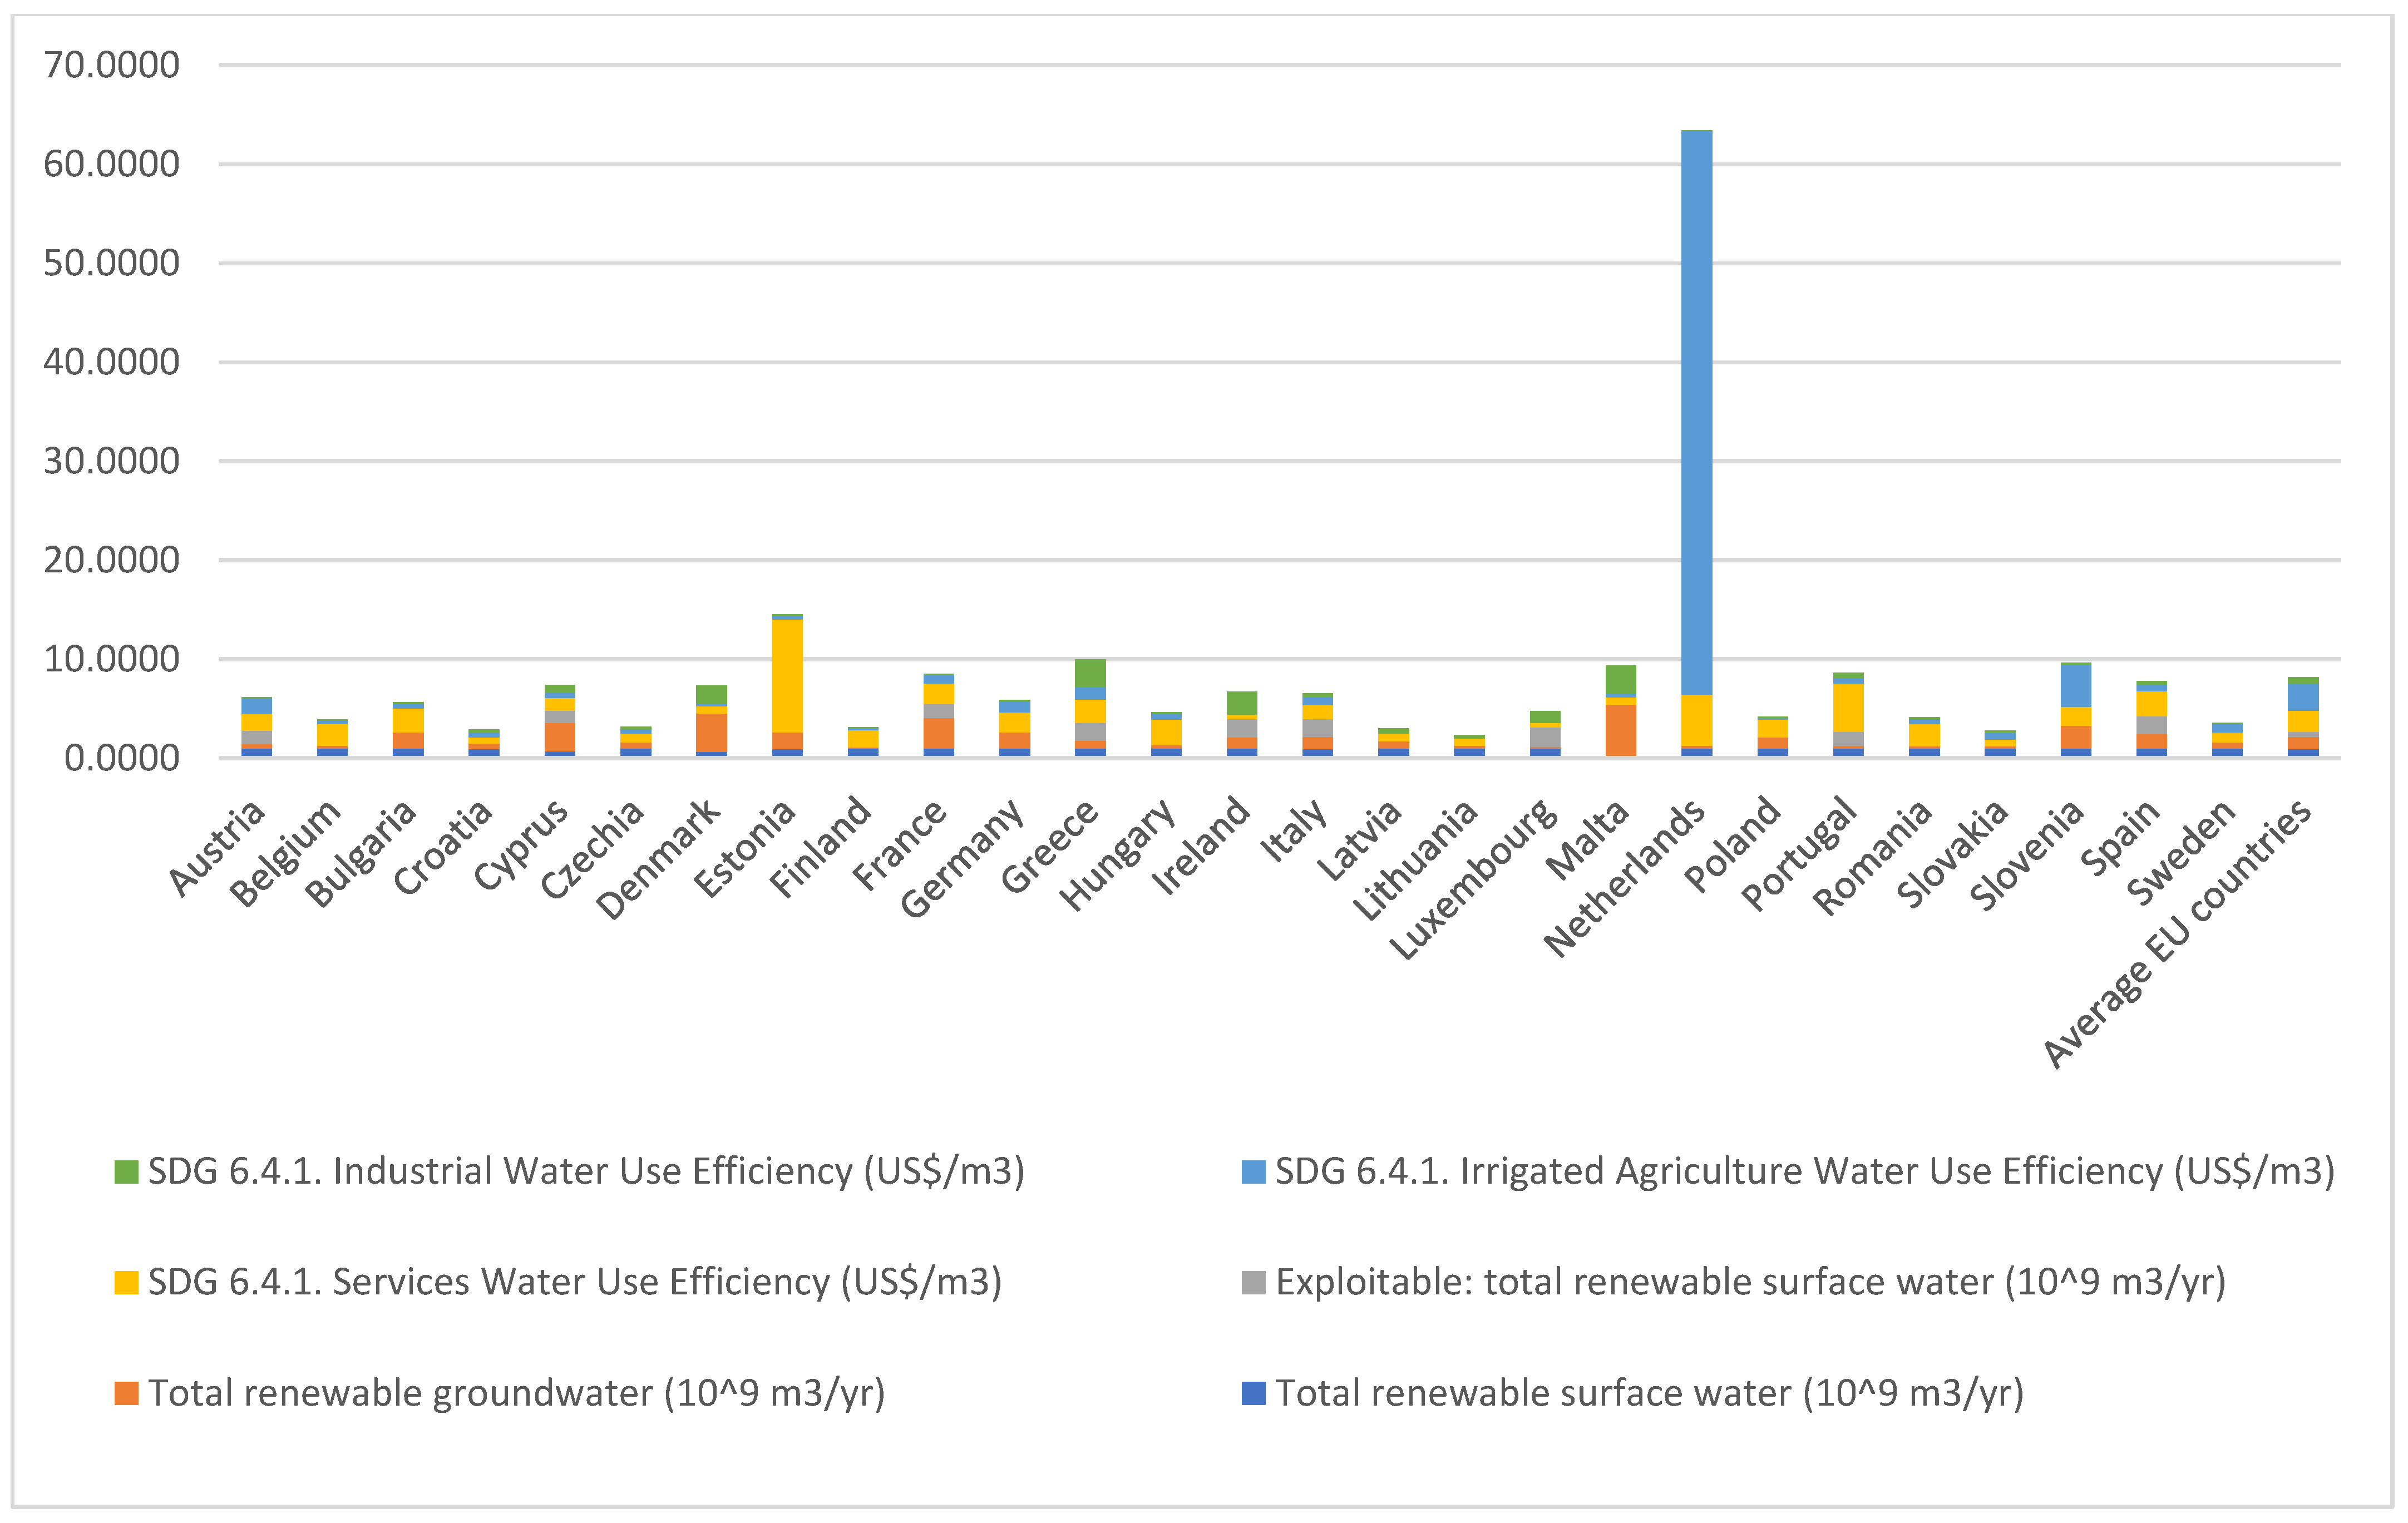
The second set of indicators to be analyzed were those grouped in the sustainability inequalities category (Figure 6). In order to analyze water use efficiency, three indicators were selected. Starting with the industrial water use efficiency of EU countries, Malta presented the highest quotient of 2.804, followed by Greece (2.761), Ireland (2.316), Denmark (1.800), and Luxembourg (1.165), while the lowest quotients were for the Netherlands (0.074), Belgium (0.088), France (0.092), Estonia (0.092), and Austria (0.124). Comparing the value added to GDP and water use efficiency of the industrial sector in different countries, it is possible to see that the countries that presented the lower quotients of value added to GDP are also listed with those that possessed higher quotients of industrial water use efficiency (e.g., Malta, Luxembourg), while France had a low quotient for both value added to GDP and industrial water use efficiency. Only Ireland had higher quotients of industrial water use efficiency and value added to GDP. Water use in the industrial sector is critical, not only due to pollutants and wastewater [28,29,33], but also with respect to the need for transition in the industrial structure [36].
With respect to the irrigated agriculture water use efficiency of EU countries the Netherlands ranked first with a quotient that is exceptional (56.886). This country is followed by Slovenia (4.271), Austria (1.474), Greece (1.280), and Germany (1.151). Among the top five countries with the lowest irrigated agriculture water efficiency quotients were Latvia (0.005), Lithuania (0.010), Ireland (0.012), Finland (0.144), and Poland (0.153). No data were made available for Luxembourg for this indicator. Greece is the country among the top five countries both in value added to GDP and irrigated agriculture water use efficiency. However, even though Germany was among the better quotients for irrigated agriculture water use efficiency, it was among the lower group of countries related to value added to GDP. The quotients for Ireland positioned this country among the lowest countries in both irrigated agriculture water use efficiency and value added to GDP, while Lithuania was the country that showed a high quotient of value added to GDP but was among the countries with the lowest irrigated agriculture water use efficiency. Therefore, countries with less irrigated agricultural water use efficiency need to consider water-saving, technical efficiency, and water sustainability [22], not least because water use in agriculture is greater than that in secondary and tertiary industries [18].
Concerning water use efficiency for services, Estonia was ranked first among the higher quotients (11.404), followed by the Netherlands (5.162), Portugal (4.907), Hungary (2.562), and Spain (2.553). The countries with the lowest quotients were Ireland (0.428), Luxembourg (0.465), Croatia (0.614), Slovakia (0.669), and Lithuania (0.727). Comparing the services water use efficiency and value added to GDP between countries, it is noted that Luxembourg, the first country in value added to GDP, was in the second position with respect to low water use efficiency. Hungary had among the highest quotients of water use efficiency but was in last position for services value added to GDP. Ireland was in second position for the low value added to GDP and first in low services water use efficiency. Among the three indicators, the Netherlands was among the top five countries for water use efficiency related to services and irrigated agriculture, while Ireland and Lithuania were among the lowest for water use efficiency related to services and irrigated agriculture. The countries in which GDP was more based on secondary and tertiary industries were those that showed less water consumption [18]. Tertiary industry enabled reduction in the dependency of economic growth on water resources [22], even though impacts on water resources were observed with regard to increase in labor.
The exploitable total renewable surface water of EU countries was calculated on the basis of available data from selected countries. There was no available data for Belgium, Bulgaria, Croatia, Czechia, Denmark, Estonia, Finland, Germany, Hungary, Latvia, Lithuania, the Netherlands, Poland, Romania, Slovenia, Slovakia or Sweden. Luxembourg was the country with the highest total renewable surface water quotient (1.992) followed by Ireland (1.853), Spain (1.799), Greece (1.786), and Italy (1.782). The countries that showed the lowest quotients were Malta (0.053), Cyprus (1.255), Austria (1.328), Portugal (1.379), and France (1.395). Comparing the quotients of total renewable surface water and exploitable total renewable surface water for different countries, Luxembourg was among the top five countries with the highest scores, while Malta and Cyprus were the countries with the lowest quotients for both indicators.
Concerning the total renewable groundwater, the countries that had the highest quotients were Malta (5.356), Denmark (3.877), France (3.077), Cyprus (2.844) and Slovenia (2.292), while the countries that showed the lowest quotients were Finland (0.108), Luxembourg (0.124), Slovakia (0.187), Romania (0.216), and Lithuania. The total renewable surface water top five countries (with the same quotient, 1.019) were Austria, Belgium, Czechia, Hungary, and Luxembourg. The countries that had the lowest quotients in total renewable surface water were Malta (0.010), Denmark (0.628), Cyprus (0.732), Croatia (0.917), and Estonia (0.940). Comparing the quotients of renewable surface water and groundwater, it can be seen that most of the renewable water of Luxembourg came from the surface, while for Denmark and Cyprus, the main source was groundwater. In the literature, it has been suggested that water conservation can be guaranteed with lower economic losses [13] when the economic structures target ecological protection and economic growth [34,35]. This balance can be achieved through the transition of industrial structure and investing in science and technology [36,38], even though freshwater utilization is not currently constraining most economies [37].
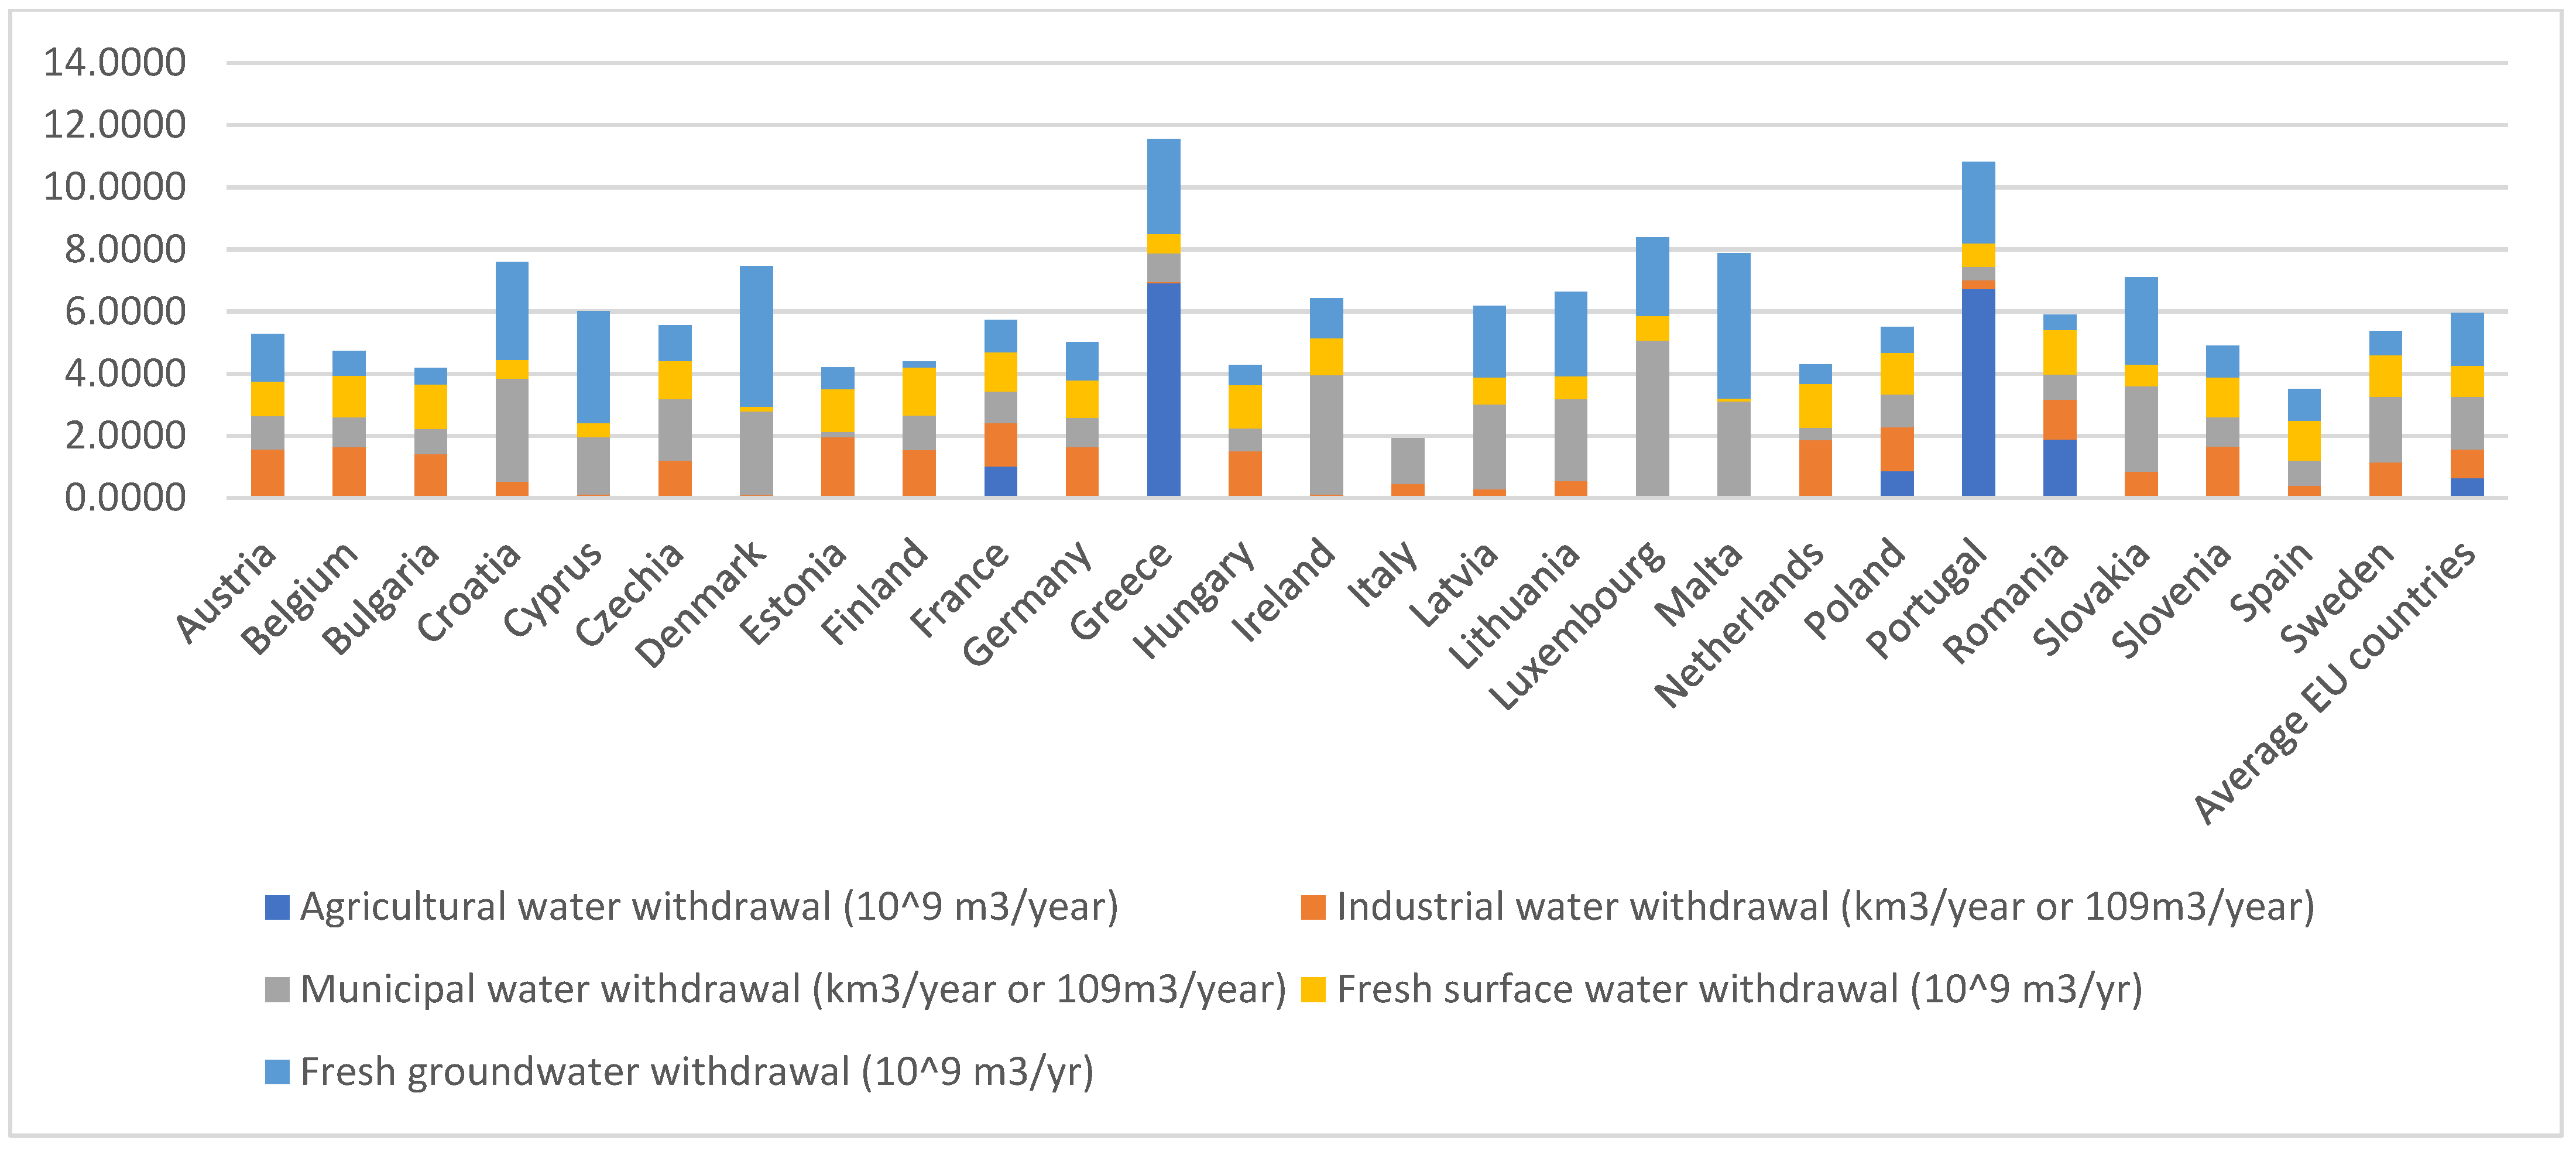
Figure 7 presents the group of indicators that relate to the water consumption of EU countries. Analyzing the agricultural water withdrawal, the obtained quotients for this indicator showed that Greece was ranked first (6.909), followed by Portugal (6.737), Romania (1.891), France (1.011), and Poland (0.867). From available data (no data was available for Austria, Belgium, Czechia, Estonia, Finland, Germany, Luxembourg, the Netherlands, Slovakia, Slovenia, and Sweden), the lowest quotients of agricultural water withdrawal among EU countries were for Croatia, Hungary, and Bulgaria, each with the same score (0.001), followed by Ireland and Lithuania (with a quotient score of 0.002 each). Although Greece is the country that possessed the highest quotient for agricultural water withdrawal, it was among the top five countries that presented the best scores for irrigated agriculture water use efficiency. This was not the case for Poland, being the fifth-ranked country in agricultural water withdrawal, and among the countries that presented low irrigated agriculture water use efficiency. Lithuania and Ireland are countries that had low quotients for irrigated agriculture water use efficiency and agricultural water withdrawal.
The industrial water withdrawal indicators showed that the countries that presented the highest quotients were Estonia (1.957), the Netherlands (1.861), Slovenia (1.652), Germany (1.641), and Belgium (1.632), while the lowest quotients were for Malta (0.032), Greece (0.038), Luxembourg (0.071), Denmark (0.090), and Cyprus (0.111). Considering the quotients for industrial water use efficiency, it can be seen that Malta, Greece, Luxembourg, and Denmark are among the top five countries that present the lowest quotients of industrial water withdrawal and the highest water use efficiency. This is explained because the economies (by value added to GDP) of Malta and Luxembourg are based on services, and the Greek economy is based on services and agriculture. It is interesting to note that even though Denmark was not among the top five countries with the highest industry value added to GDP, or among the most efficient countries in industrial water use, that this country was among those that presented the lowest quotients of water withdrawal for the industrial sector. On the other hand, among the top countries in industrial water withdrawal were Estonia, the Netherlands and Belgium, the same countries among the top five with the lowest industrial water use efficiency. These countries can guarantee a balance in economic growth and water conservation [36] by investing in science and technology, and by considering the trade-offs for specific industries [15,39] according to their impacts on water consumption [13].
Regarding municipal water withdrawal, Luxembourg (5.003) was ranked first among the higher quotients, followed by Ireland (3.835), Croatia (3.330), Malta (3.068), and Slovakia (2.761). The lower quotients were found for Estonia (0.174), the Netherlands (0.410), Portugal (0.428), Hungary (0.726), and Romania (0.810). Since the relationship between municipal water use and economic indicators is not well understood [19], further research is needed to interpret these correlations.
Among the countries that presented the higher quotients of fresh surface water withdrawal were Finland (1.533), Romania (1.445), Bulgaria (1.433), the Netherlands (1.401), and Hungary (1.390), and the countries that showed the lower quotients were Malta (0.097), Denmark (0.150), Cyprus (0.451), Croatia (0.589), and Greece (0.623). The countries that presented the highest scores for fresh groundwater withdrawal were Malta (4.686), Denmark (4.530), Cyprus (3.588), Croatia (3.155), and Greece (3.049), while the countries that showed the lowest quotients were Finland (0.201), Romania (0.478), Bulgaria (0.514), the Netherlands (0.616), and Hungary (0.648). Italy had no available data for this indicator. All the countries that presented the lowest scores of fresh surface water withdrawal were the same as those having the highest quotients of fresh groundwater withdrawal, indicating that these countries were more dependent on groundwater withdrawal. The opposite is true for all the countries that depended more on fresh surface water, i.e., Finland, Romania, Bulgaria, the Netherlands, and Hungary.
Finland was among the countries with the highest surface freshwater withdrawal and among the countries with the lower irrigated agriculture water use efficiency; Romania was also among the highest quotients for fresh surface water withdrawal and was among the lower quotients of municipal water withdrawal. The Netherlands had among the highest quotients of fresh surface water withdrawal and had the highest irrigated agriculture, industrial, and services water withdrawal, but had among the lowest municipal water withdrawal quotients. Hungary was also among the top five countries in fresh surface water withdrawal, but among the lowest for municipal water withdrawal and had the best quotient for services water use efficiency.
Malta was the top country in fresh groundwater withdrawal, while also among the top five highest quotients for municipal water withdrawal and lowest industrial water withdrawal. Denmark had a high quotient of fresh groundwater withdrawal and low quotient of industrial water withdrawal. Cyprus also had a high quotient of fresh groundwater withdrawal and a low quotient for industrial water withdrawal. Croatia had high quotients for fresh groundwater withdrawal and municipal water withdrawal; while Greece showed a high quotient for fresh groundwater withdrawal, but a high quotient on irrigated agriculture water use efficiency, and a low quotient for industrial water withdrawal. Attention must be paid to the industries that are consuming different volumes of water, and policymakers must address the basis of each economic sector of the country/region to better address support for a transition to more sustainable economic activities [6,13,18,20,22,23].
5. Conclusions
This paper has had as its goal to analyze the sustainability inequalities in water consumption of EU countries. After proposing the equation (Equation (1)) for calculating quotients of three different groups of indicators made available from AQUASTAT database, i.e., economic inequalities, sustainability inequalities and water consumption (Table 1), results were analyzed and compared.
Among the descriptive findings, it was observed that, across the four analyzed periods, Germany, with the highest GDP, and the most populated country, was also the EU country in the top five for water stress and total water withdrawal, followed by France, Italy, Spain, and the Netherlands. Malta was the country with highest water stress but second for lowest total water withdrawal and had low GDP and population scores.
Regarding the quotient analyses, the results proved to be rich. Considering the set of economic inequalities indicators, it was found that the countries in which the populations were the most urban were Belgium, Malta, the Netherlands, Luxembourg, and Denmark, while those populations that were more rural were Finland, Slovakia, Romania, Slovenia, and Croatia. The added value to GDP of three analyzed sectors allowed for the identification of the countries that were more based on services, which were Luxembourg, Malta, Cyprus, France, and Greece, and those more based on agriculture, which were Romania, Bulgaria, Hungary, Greece, and Lithuania. For the industry sector, Ireland, Czechia, Romania, Slovakia, and Slovenia stand out.
The second set of indicators, the sustainability inequalities, allowed the identification of water use efficiency for three sectors. For the industry sector, the countries that showed lower industry value added to GDP are listed among those with higher industrial water use efficiency (e.g., Malta and Luxembourg), explained due to the economy of these two countries being based on services. In the irrigated agriculture sector, the highest water use efficiency is credited to Greece with a high agriculture value added to GDP. In services, Luxembourg was first in services value added to GDP, but among the lowest for service water use efficiency. The Netherlands stands out in cross-comparisons of these three indicators, being in the top five in services and irrigated agriculture water use efficiency. The country that showed the highest quotients related to total renewable surface water and exploitable total renewable surface water was Luxembourg. When comparing renewable surface water and groundwater, most renewable water is accounted for in Luxembourg by surface water, while for Denmark and Cyprus it is accounted for by groundwater.
Analyzing the third group of inequalities indicators, water consumption, it was seen that Greece had the highest quotient for agricultural water withdrawal and the best quotient for irrigated agriculture water use efficiency. Denmark was ranked among the top countries in industry value added to GDP, and ranked among the most efficient countries in industrial water use efficiency. Estonia, the Netherlands, and Belgium were among the countries that presented the highest industrial water withdrawal quotients and the lowest industrial water use efficiency quotients. The countries that showed the highest fresh surface water withdrawal were Finland and Romania, while the Netherlands had the highest quotients for fresh surface water withdrawal and irrigated agriculture, industrial, and services water withdrawal. With respect to groundwater withdrawal, Malta was the top country, and both Denmark and Cyprus among the top positions.
The calculated quotients allowed the cross-country comparisons of the selected indicators made available by the AQUASTAT database. These comparisons revealed a mosaic of inequalities with respect to the countries that are at the top positions regarding economic and sustainability indicators and water consumption. The proposed formula (Equation (1)) enabled a better understanding of the rankings of EU countries. As water scarcity and consumption are not geographically delimited, and considering that water resources impose constraints on economic growth at regional level [22], countries may apply the formula to compare regions within a country with the country quotients. That is possible by considering the following formula (Equation (2)).
This research also had some limitations. The first is the selection of AQUASTAT indicators according to the available data, the second is the numerousness of results to be compared within- and cross-country. A third limitation could be considered to be the lack of comparisons with other regions in the world over the same periods for the analyses conducted. A fourth limitation is related to the use of GDP in current USD, that may be viewed by policymakers as a problem due to inflation, and may cause some bias in interpretation of production changes over time. We therefore suggest that policymakers replace the indicators related to GDP in current USD by other available data, such as GDP per capita, GDP in PPS, or GDP in constant prices.
For further research, it is recommended that regions within a country are evaluated by the application of Equation (2) to assist policymakers with the development of databases that can inform the focusing of policies towards water protection and renewable actions to avoid water scarcity, enabling forecasting of this environmental issue using the econometric model proposed by this research.
Author Contributions
Conceptualization, M.F., D.O. and L.B.; methodology, M.F.; software, M.F.; validation, M.F. and L.B.; formal analysis, M.F. and L.B.; investigation, D.O., M.F. and L.B.; resources, D.O. and M.B.; data curation, M.F. and L.B.; writing—original draft preparation, M.B., M.F., D.O. and L.B.; writing—review and editing, M.B., M.F., D.O. and L.B.; visualization, L.B.; supervision, M.F.; project administration, L.B. All authors have read and agreed to the published version of the manuscript.
Funding
This research was partially funded by the budget of the Contrato Programa 2020 of the Department of General Economics (University of Cadiz).
Institutional Review Board Statement
Not applicable.
Informed Consent Statement
Not applicable.
Data Availability Statement
AQUASTAT—FAO’s Global Information System on Water and Agriculture. http://www.fao.org/aquastat/en/databases/maindatabase/.
Acknowledgments
Marcos Ferasso thanks to Gabriel Bandeira for his help with Sankey diagrams.
Conflicts of Interest
The authors declare no conflict of interest.
Appendix A. Quotients of Economic Indicators of EU Countries
| Countries | Urban Population (1000 inhab) | Rural Population (1000 inhab) | Services, Value Added to GDP (Current USD) | Agriculture, Value Added to GDP (Current USD) | Industry, Value Added to GDP (Current USD) |
| Austria | 0,777 | 1,564 | 0,965 | 0,712 | 1,131 |
| Belgium | 1,324 | 0,077 | 1,060 | 0,377 | 0,843 |
| Bulgaria | 1,006 | 0,952 | 0,928 | 2,388 | 0,974 |
| Croatia | 0,766 | 1,635 | 0,924 | 1,737 | 0,857 |
| Cyprus | 0,902 | 1,249 | 1,116 | 1,196 | 0,464 |
| Czechia | 0,993 | 0,990 | 0,863 | 1,218 | 1,454 |
| Denmark | 1,185 | 0,461 | 0,991 | 0,845 | 0,919 |
| Estonia | 0,921 | 1,170 | 0,948 | 1,403 | 1,006 |
| Finland | 1,155 | 3,222 | 0,925 | 1,374 | 1,071 |
| France | 1,085 | 0,748 | 1,074 | 0,918 | 0,743 |
| Germany | 1,036 | 0,851 | 0,953 | 0,492 | 1,229 |
| Greece | 1,122 | 0,846 | 1,064 | 2,191 | 0,589 |
| Hungary | 0,959 | 1,089 | 0,852 | 2,247 | 1,151 |
| Ireland | 0,851 | 1,398 | 0,856 | 0,694 | 1,697 |
| Italy | 0,926 | 1,101 | 1,020 | 1,162 | 0,934 |
| Latvia | 0,918 | 1,202 | 1,004 | 2,053 | 0,795 |
| Lithuania | 0,926 | 1,244 | 0,935 | 2,076 | 1,146 |
| Luxembourg | 1,208 | 0,344 | 1,194 | 0,145 | 0,497 |
| Malta | 1,256 | 0,202 | 1,132 | 0,469 | 0,514 |
| The Netherlands | 1,231 | 0,336 | 1,058 | 1,098 | 0,809 |
| Poland | 0,816 | 1,512 | 0,895 | 1,629 | 1,216 |
| Portugal | 0,876 | 1,337 | 1,013 | 1,240 | 0,797 |
| Romania | 0,729 | 1,738 | 0,897 | 2,552 | 1,269 |
| Slovakia | 0,726 | 1,742 | 0,913 | 1,418 | 1,269 |
| Slovenia | 0,734 | 1,726 | 0,881 | 1,096 | 1,264 |
| Spain | 1,074 | 0,746 | 1,050 | 1,658 | 0,840 |
| Sweden | 1,177 | 0,485 | 1,003 | 0,854 | 0,966 |
Appendix B. Quotients of Sustainability Indicators of EU Countries
| Countries | Total Renewable Surface Water (109 m3/year) | Total Renewable Groundwater (109 m3/year) | Exploitable: Total Renewable Surface Water (109 m3/year) | SDG 6.4.1. Services Water Use Efficiency (USD/m3) | SDG 6.4.1. Irrigated Agriculture Water Use Efficiency (USD/m3) | SDG 6.4.1. Industrial Water Use Efficiency (USD/m3) |
| Austria | 1,019 | 0,418 | 1,328 | 1,794 | 1,474 | 0,124 |
| Belgium | 1,019 | 0,266 | 0,000 | 2,183 | 0,331 | 0,088 |
| Bulgaria | 0,976 | 1,625 | 0,000 | 2,437 | 0,512 | 0,126 |
| Croatia | 0,917 | 0,564 | 0,000 | 0,614 | 0,484 | 0,311 |
| Cyprus | 0,732 | 2,844 | 1,255 | 1,249 | 0,554 | 0,740 |
| Czechia | 1,019 | 0,588 | 0,000 | 0,878 | 0,501 | 0,208 |
| Denmark | 0,628 | 3,877 | 0,000 | 0,758 | 0,264 | 1,800 |
| Estonia | 0,940 | 1,690 | 0,000 | 11,404 | 0,414 | 0,092 |
| Finland | 1,017 | 0,108 | 0,000 | 1,733 | 0,144 | 0,125 |
| France | 1,009 | 3,077 | 1,395 | 2,112 | 0,864 | 0,092 |
| Germany | 1,014 | 1,605 | 0,000 | 2,008 | 1,151 | 0,127 |
| Greece | 0,982 | 0,815 | 1,786 | 2,367 | 1,280 | 2,761 |
| Hungary | 1,019 | 0,312 | 0,000 | 2,562 | 0,613 | 0,142 |
| Ireland | 1,003 | 1,124 | 1,853 | 0,428 | 0,012 | 2,316 |
| Italy | 0,955 | 1,216 | 1,782 | 1,401 | 0,826 | 0,349 |
| Latvia | 1,007 | 0,728 | 0,000 | 0,776 | 0,005 | 0,507 |
| Lithuania | 1,015 | 0,243 | 0,000 | 0,727 | 0,010 | 0,367 |
| Luxembourg | 1,019 | 0,124 | 1,992 | 0,465 | 0,000 | 1,165 |
| Malta | 0,010 | 5,356 | 0,053 | 0,749 | 0,401 | 2,804 |
| The Netherlands | 1,019 | 0,268 | 0,000 | 5,162 | 56,886 | 0,074 |
| Poland | 1,010 | 1,118 | 0,000 | 1,766 | 0,153 | 0,153 |
| Portugal | 1,019 | 0,280 | 1,379 | 4,907 | 0,509 | 0,520 |
| Romania | 1,017 | 0,216 | 0,000 | 2,264 | 0,467 | 0,175 |
| Slovakia | 1,019 | 0,187 | 0,000 | 0,669 | 0,669 | 0,260 |
| Slovenia | 1,014 | 2,292 | 0,000 | 1,921 | 4,271 | 0,136 |
| Spain | 1,003 | 1,451 | 1,799 | 2,553 | 0,611 | 0,369 |
| Sweden | 1,013 | 0,622 | 0,000 | 0,965 | 0,853 | 0,146 |
Appendix C. Quotients of Water Consumption of EU Countries
| Countries | Agricultural Water Withdrawal (109 m3/year) | Industrial Water Withdrawal (km3/year or 109 m3/year) | Municipal Water Withdrawal (km3/year or 109 m3/year) | Fresh Surface Water Withdrawal (109 m3/year) | Fresh Groundwater Withdrawal (109 m3/year) |
| Austria | 0,000 | 1,567 | 1,079 | 1,111 | 1,521 |
| Belgium | 0,000 | 1,632 | 0,968 | 1,344 | 0,791 |
| Bulgaria | 0,001 | 1,414 | 0,816 | 1,433 | 0,514 |
| Croatia | 0,001 | 0,522 | 3,330 | 0,589 | 3,155 |
| Cyprus | 0,005 | 0,111 | 1,851 | 0,451 | 3,588 |
| Czechia | 0,000 | 1,204 | 1,979 | 1,236 | 1,133 |
| Denmark | 0,004 | 0,090 | 2,694 | 0,150 | 4,530 |
| Estonia | 0,000 | 1,957 | 0,174 | 1,377 | 0,692 |
| Finland | 0,000 | 1,541 | 1,121 | 1,533 | 0,201 |
| France | 1,011 | 1,394 | 1,024 | 1,265 | 1,041 |
| Germany | 0,000 | 1,641 | 0,940 | 1,208 | 1,220 |
| Greece | 6,909 | 0,038 | 0,927 | 0,623 | 3,049 |
| Hungary | 0,001 | 1,514 | 0,726 | 1,390 | 0,648 |
| Ireland | 0,002 | 0,120 | 3,835 | 1,184 | 1,295 |
| Italy | 0,004 | 0,457 | 1,452 | 0,000 | 0,000 |
| Latvia | 0,003 | 0,282 | 2,728 | 0,861 | 2,305 |
| Lithuania | 0,002 | 0,546 | 2,635 | 0,731 | 2,710 |
| Luxembourg | 0,000 | 0,071 | 5,003 | 0,795 | 2,511 |
| Malta | 0,003 | 0,032 | 3,068 | 0,097 | 4,686 |
| The Netherlands | 0,000 | 1,861 | 0,410 | 1,401 | 0,616 |
| Poland | 0,867 | 1,417 | 1,053 | 1,332 | 0,830 |
| Portugal | 6,737 | 0,272 | 0,428 | 0,760 | 2,621 |
| Romania | 1,891 | 1,269 | 0,810 | 1,445 | 0,478 |
| Slovakia | 0,000 | 0,844 | 2,761 | 0,701 | 2,806 |
| Slovenia | 0,000 | 1,652 | 0,952 | 1,271 | 1,020 |
| Spain | 0,006 | 0,388 | 0,820 | 1,270 | 1,024 |
| Sweden | 0,000 | 1,150 | 2,104 | 1,352 | 0,768 |
References
- United Nations. Goal 6: Ensure availability and sustainable management of water and sanitation for all. Target 2020, 41, 100. [Google Scholar]
- Yang, H.; Pfister, S.; Bhaduri, A. Accounting for a scarce resource: Virtual water and water footprint in the global water system. Curr. Opin. Environ. Sustain. 2013, 5, 599–606. [Google Scholar] [CrossRef]
- Durán-Romero, G.; López, A.M.; Beliaeva, T.; Ferasso, M.; Garonne, C.; Jones, P. Bridging the gap between circular economy and climate change mitigation policies through eco-innovations and Quintuple Helix Model. Technol. Forecast. Soc. Chang. 2020, 160, 120246. [Google Scholar] [CrossRef]
- AQUASTAT Database. Available online: http://www.fao.org/aquastat/en/databases/maindatabase/ (accessed on 4 February 2021).
- Wang, Q.; Wang, X. Does economic growth help reduce inequality of water consumption? Insight from evolution and drivers of inequality in water consumption in China. Environ. Sci. Pollut. Res. 2021, 28, 37338–37353. [Google Scholar] [CrossRef]
- Wang, Q.; Wang, X. Moving to economic growth without water demand growth—A decomposition analysis of decoupling from economic growth and water use in 31 provinces of China. Sci. Total Environ. 2020, 726, 138362. [Google Scholar] [CrossRef]
- Gao, X.; Wang, K.; Lo, K.; Wen, R.; Mi, X.; Liu, K.; Huang, X. An Evaluation of Coupling Coordination between Rural Development and Water Environment in Northwestern China. Land 2021, 10, 405. [Google Scholar] [CrossRef]
- Flörke, M.; Kynast, E.; Bärlund, I.; Eisner, S.; Wimmer, F.; Alcamo, J. Domestic and industrial water uses of the past 60 years as a mirror of socio-economic development: A global simulation study. Glob. Environ. Chang. 2013, 23, 144–156. [Google Scholar] [CrossRef]
- Rost, S.; Gerten, D.; Bondeau, A.; Lucht, W.; Rohwer, J.; Schaphoff, S. Agricultural green and blue water consumption and its influence on the global water system. Water Resour. Res. 2008, 44, 6331. [Google Scholar] [CrossRef] [Green Version]
- Kong, Y.; He, W.; Yuan, L.; Zhang, Z.; Gao, X.; Zhao, Y.e.; Mulugeta Degefu, D. Decoupling economic growth from water consumption in the Yangtze River Economic Belt, China. Ecol. Indic. 2021, 123, 107344. [Google Scholar] [CrossRef]
- Chapagain, A.K.; Hoekstra, A.Y. Water Footprints of Nations; UNESCO-IHE Institute for Water Education: Delft, The Netherlands, 2004; Volume 16. [Google Scholar]
- FAO. Distribution of Physical Water Scarcity by Major Hydrological Basin (Global); FAO: Rome, Italy, 2021. [Google Scholar]
- Parrado, R.; Pérez-Blanco, C.D.; Gutiérrez-Martín, C.; Gil-García, L. To charge or to cap in agricultural water management. Insights from modular iterative modeling for the assessment of bilateral micro-macro-economic feedback links. Sci. Total Environ. 2020, 742, 140526. [Google Scholar] [CrossRef]
- Ke, W.; Sha, J.; Yan, J.; Zhang, G.; Wu, R. A Multi-Objective Input–Output Linear Model for Water Supply, Economic Growth and Environmental Planning in Resource-Based Cities. Sustainability 2016, 8, 160. [Google Scholar] [CrossRef] [Green Version]
- Markantonis, V.; Reynaud, A.; Karabulut, A.; El Hajj, R.; Altinbilek, D.; Awad, I.M.; Bruggeman, A.; Constantianos, V.; Mysiak, J.; Lamaddalena, N.; et al. Can the Implementation of the Water-Energy-Food Nexus Support Economic Growth in the Mediterranean Region? The Current Status and the Way Forward. Front. Environ. Sci. 2019, 7, 84. [Google Scholar] [CrossRef]
- Bao, C.; He, D. The Causal Relationship between Urbanization, Economic Growth and Water Use Change in Provincial China. Sustainability 2015, 7, 16076–16085. [Google Scholar] [CrossRef] [Green Version]
- Katz, D. Water use and economic growth: Reconsidering the Environmental Kuznets Curve relationship. J. Clean. Prod. 2015, 88, 205–213. [Google Scholar] [CrossRef]
- Hu, M.; Hu, Y.; Yuan, J.; Lu, F. Decomposing the decoupling of water consumption and economic growth in Jiangxi, China. J. Water Reuse Desalin. 2018, 9, 94–104. [Google Scholar] [CrossRef]
- Pastor, D.J.; Fullerton, T.M. Municipal Water Consumption and Urban Economic Growth in El Paso. Water 2020, 12, 2656. [Google Scholar] [CrossRef]
- Wang, S.; Li, R. Toward the Coordinated Sustainable Development of Urban Water Resource Use and Economic Growth: An Empirical Analysis of Tianjin City, China. Sustainability 2018, 10, 1323. [Google Scholar] [CrossRef] [Green Version]
- Yang, L.; Yang, Y.; Lv, H.; Wang, D.; Li, Y.; He, W. Water usage for energy production and supply in China: Decoupled from industrial growth? Sci. Total Environ. 2020, 719, 137278. [Google Scholar] [CrossRef]
- Zhang, Y.; Liu, W.; Zhao, M. The Drag Effect of Water Resources on China’s Regional Economic Growth: Analysis Based on the Temporal and Spatial Dimensions. Water 2020, 12, 266. [Google Scholar] [CrossRef] [Green Version]
- Duarte, R.; Pinilla, V.; Serrano, A. Looking backward to look forward: Water use and economic growth from a long-term perspective. Appl. Econ. 2014, 46, 212–224. [Google Scholar] [CrossRef] [Green Version]
- Hao, Y.; Hu, X.; Chen, H. On the relationship between water use and economic growth in China: New evidence from simultaneous equation model analysis. J. Clean. Prod. 2019, 235, 953–965. [Google Scholar] [CrossRef]
- Liu, Y.; Yang, L.; Jiang, W. Qualitative and quantitative analysis of the relationship between water pollution and economic growth: A case study in Nansi Lake catchment, China. Environ. Sci. Pollut. Res. 2020, 27, 4008–4020. [Google Scholar] [CrossRef]
- Li, Y.; Luo, Y.; Wang, Y.; Wang, L.; Shen, M. Decomposing the Decoupling of Water Consumption and Economic Growth in China’s Textile Industry. Sustainability 2017, 9, 412. [Google Scholar] [CrossRef] [Green Version]
- Li, Y.; Shen, J.; Lu, L.; Luo, Y.; Wang, L.; Shen, M. Water environmental stress, rebound effect, and economic growth of China’s textile industry. PeerJ 2018, 6, e5112. [Google Scholar] [CrossRef] [Green Version]
- Chen, X.; Yi, G.; Liu, J.; Liu, X.; Chen, Y. Evaluating Economic Growth, Industrial Structure, and Water Quality of the Xiangjiang River Basin in China Based on a Spatial Econometric Approach. Int. J. Environ. Res. Public Health 2018, 15, 2095. [Google Scholar] [CrossRef] [Green Version]
- Gu, A.; Zhang, Y.; Pan, B. Relationship between Industrial Water Use and Economic Growth in China: Insights from an Environmental Kuznets Curve. Water 2017, 9, 556. [Google Scholar] [CrossRef] [Green Version]
- Abdul-Rahim, A.S.; Sun, C.; Noraida, A.W. The Impact of Soil and Water Conservation on Agricultural Economic Growth and Rural Poverty Reduction in China. Sustainability 2018, 10, 4444. [Google Scholar] [CrossRef] [Green Version]
- Wang, Q.; Jiang, R.; Li, R. Decoupling analysis of economic growth from water use in City: A case study of Beijing, Shanghai, and Guangzhou of China. Sustain. Cities Soc. 2018, 41, 86–94. [Google Scholar] [CrossRef]
- Zhao, X.; Fan, X.; Liang, J. Kuznets type relationship between water use and economic growth in China. J. Clean. Prod. 2017, 168, 1091–1100. [Google Scholar] [CrossRef]
- Bao, C.; Chen, X. The driving effects of urbanization on economic growth and water use change in China: A provincial-level analysis in 1997–2011. J. Geogr. Sci. 2015, 25, 530–544. [Google Scholar] [CrossRef] [Green Version]
- Liu, L.; Di, B.; Zhang, M. The tradeoff between ecological protection and economic growth in China’s county development: Evidence from the soil and water conservation projects during 2011–2015. Resour. Conserv. Recycl. 2020, 156, 104745. [Google Scholar] [CrossRef]
- Kyei, C.; Hassan, R. Managing the trade-off between economic growth and protection of environmental quality: The case of taxing water pollution in the Olifants river basin of South Africa. Water Policy 2019, 21, 277–290. [Google Scholar] [CrossRef] [Green Version]
- Tao, A. Decoupling Analysis of Water Environmental Pressure and Economic Growth in Shanghai. E3S Web Conf. 2019, 136, 2546. [Google Scholar] [CrossRef]
- Barbier, E.B. Water and Economic Growth. Econ. Rec. 2004, 80, 1–16. [Google Scholar] [CrossRef]
- Qiao, N.; Fang, L.; Mu, L. Evaluating the impacts of water resources technology progress on development and economic growth over the Northwest, China. PLoS ONE 2020, 15, 9571. [Google Scholar] [CrossRef]
- Esen, Ö.; Yıldırım, D.Ç.; Yıldırım, S. Threshold effects of economic growth on water stress in the Eurozone. Environ. Sci. Pollut. Res. 2020, 27, 31427–31438. [Google Scholar] [CrossRef]
- Riehmann, P.; Hanfler, M.; Froehlich, B. Interactive Sankey diagrams. In Proceedings of the IEEE Symposium on Information Visualization, Minneapolis, MN, USA, 23–25 October 2005; pp. 233–240. [Google Scholar]
- Paiva, C.A.N. Como Identificar e Mobilizar o Potencial de Desenvolvimento Endógeno de Uma Região; FEE: Porto Alegre, Brazil, 2004. [Google Scholar]
- Ferasso, M. The environmental impact of economic activities: The case of the five economic macroregions of the State of Santa Catarina/Brazil. Int. J. Environ. Sustain. Dev. 2007, 6, 436–450. [Google Scholar] [CrossRef]
- Kummu, M.; Guillaume, J.H.A.; de Moel, H.; Eisner, S.; Flörke, M.; Porkka, M.; Siebert, S.; Veldkamp, T.I.E.; Ward, P.J. The world’s road to water scarcity: Shortage and stress in the 20th century and pathways towards sustainability. Sci. Rep. 2016, 6, 38495. [Google Scholar] [CrossRef] [Green Version]
- Hart, T. Finland’s vanishing rural population. Geographical 2015, 14, 256. [Google Scholar]
- O’Neill, A. Luxembourg: Distribution of gross domestic product (GDP) across economic sectors from 2010 to 2020. Statista 2021, 23, 142. [Google Scholar]
- O’Neill, A. Malta: Share of economic sectors in gross domestic product (GDP) from 2010 to 2020. Statista 2021, 24, 241. [Google Scholar]
- Dragan, A. Record year for agriculture in 2018: Romania ranks first in EU for maize and sunflower production. Bus. Rev. 2019, 45, 236. [Google Scholar]
Figure 1.
Proportion of renewable water resources withdrawn by EU members (2015). Source: AQUASTAT maps database [4].
Figure 1.
Proportion of renewable water resources withdrawn by EU members (2015). Source: AQUASTAT maps database [4].

Figure 2.
Distribution of physical water scarcity by major hydrological basin (global), and rivers and hydrological basins of EU countries (2021). Source: AQUASTAT maps [12].
Figure 2.
Distribution of physical water scarcity by major hydrological basin (global), and rivers and hydrological basins of EU countries (2021). Source: AQUASTAT maps [12].

Figure 3.
Water stress and total water withdrawal of EU countries. Note: (a) water stress, (b) total water withdrawal. Source: built based on AQUASTAT data [4].
Figure 3.
Water stress and total water withdrawal of EU countries. Note: (a) water stress, (b) total water withdrawal. Source: built based on AQUASTAT data [4].


Figure 4.
GDP and total population of EU countries. Note: (a) GDP, (b) Total population. Source: built based on AQUASTAT data [4].
Figure 4.
GDP and total population of EU countries. Note: (a) GDP, (b) Total population. Source: built based on AQUASTAT data [4].


Figure 5.
Economic inequalities indicators of EU countries.

Figure 6.
Sustainability inequalities indicators of EU countries.

Figure 7.
Water consumption indicators of EU countries.


Table 1.
AQUASTAT indicators and their descriptions according to the categories used in QESW. Source: adapted from AQUASTAT database [4].
Table 1.
AQUASTAT indicators and their descriptions according to the categories used in QESW. Source: adapted from AQUASTAT database [4].
| Category | Sub-Category (AQUASTAT Classification) | Indicator (Unit) | Description and Calculation Criteria |
|---|---|---|---|
| Economic inequalities indicators | Population | Urban population (1000 inhab) | Population residing in urban areas defined according to national census definitions. |
| Rural population (1000 inhab) | Obtained by subtracting the urban population from the total population. The urban and rural population estimates in this domain are based on the varying national definitions of urban areas. | ||
| Total population (1000 inhab) | Present-in-area (de facto) population within geographical boundaries of countries at the mid-point of the reference period. | ||
| Economy, development, and food security | Services, value added to GDP (current USD) | Gross value added by the services (ISIC E and ISIC G-T based on rev. 4). For the purpose of SDG 6.4.1, the ISIC coding E (‘Water Supply’) is included in service sector. The gross value added by services is calculated as the net output of the sector after adding up all outputs and subtracting intermediate inputs. It is calculated without making deductions for depreciation of fabricated assets or depletion and degradation of natural resources. | |
| Agriculture, value added to GDP (current USD) | Gross value added by agriculture (excluding river and marine fisheries and forestry), in ISIC rev. 4 “agriculture” corresponds to ISIC A (Divisions 01–03: crops and animal production, forestry, and fishing). For the purpose of SDG 6.4.1 in agriculture, freshwater fishing, marine fishing, and forestry should be excluded, but all nurseries and aquaculture are included. The gross value added by agriculture (GVAa) is calculated by adding up all agricultural outputs and subtracting intermediate inputs, but without making deductions for depreciation of fixed assets or depletion and degradation of natural resources. | ||
| Industry, value added to GDP (current USD) | Gross value added MIMEC (including energy), that is ISIC B, C, D and F based on rev. 4. The gross value added by MIMEC is computed by summing the value added for each of the four MIMEC sections as defined in the ISIC coding. For each section, it is calculated as the net output of the sector after adding up all outputs and subtracting intermediate inputs. It is calculated without making deductions for depreciation of fabricated assets or depletion and degradation of natural resources. | ||
| Gross domestic product (GDP) (current USD) | GDP at purchasers’ prices is the sum of gross value added by all resident producers in the economy plus any product taxes and minus any subsidies not included in the value of the products. It is calculated without making deductions for depreciation of fabricated assets or for depletion and degradation of natural resources. | ||
| Sustainability inequalities indicators | Water resources, total renewable water resources | Total renewable surface water (109 m3/year) | Sum of the internal renewable surface water resources and the total external renewable surface water resources. Calculation criteria: [total renewable surface water] = [surface water: total external renewable] + [surface water produced internally] |
| Total renewable groundwater (109 m3/year) | Sum of the internal renewable groundwater resources and the total external renewable groundwater resources. Calculation criteria: [total renewable groundwater] = [groundwater produced internally] + [groundwater: accounted inflow] | ||
| Total renewable water resources (109 m3/year) | Total renewable water resources (TRWR): The sum of internal renewable water resources (IRWR) and external renewable water resources (ERWR). It corresponds to the maximum theoretical yearly amount of water available for a country at a given moment. Calculation criteria: [total renewable water resources] = [total renewable surface water] + [total renewable groundwater] − [overlap between surface water and groundwater] | ||
| Water resources, Exploitable water resources and dam capacity | Exploitable: total renewable surface water (109 m3/year) | Calculation criteria: [exploitable: total renewable surface water] = [exploitable: regular renewable surface water] + [exploitable: irregular renewable surface water] | |
| Total exploitable water resources (109 m3/year) | Exploitable water resources (also called manageable water resources or water development potential) are considered to be available for development, taking into consideration factors such as: the economic and environmental feasibility of storing floodwater behind dams, extracting groundwater, the physical possibility of storing water that naturally flows out to the sea, and minimum flow requirements (navigation, environmental services, aquatic life, etc.). Methods to assess exploitable water resources vary from country to country. Calculation criteria: [total exploitable water resources] = [exploitable: total renewable surface water] + [exploitable: regular renewable groundwater] | ||
| Water use, Pressure on water resources (includes data for SDG 6.4) | SDG 6.4.1. Services water use efficiency (USD/m3) | Services sector value added (ISIC E and ISIC G-T based on rev. 4) divided by water used for distribution by the water collection, treatment, and supply industry (ISIC 36), expressed in USD/m3 with services including all the service sectors. Calculation criteria: [SDG 6.4.1. services water use efficiency] = (([services, value added to GDP]/[GDP deflator (2015)] × 100)/[municipal water withdrawal])/1,000,000,000 | |
| SDG 6.4.1. Irrigated agriculture water use efficiency (USD/m3) | Agricultural value added per unit of water used for the agriculture sector, expressed in USD/m3 with agriculture including livestock, aquaculture and irrigated crops. Calculation criteria: [SDG 6.4.1. irrigated agriculture water use efficiency] = ((([agriculture, value added to GDP]/[GDP deflator (2015)] × 100) × [% of agricultural GVA produced by irrigated agriculture]/100)/[agricultural water withdrawal])/10,000,000 | ||
| SDG 6.4.1. Industrial water use efficiency (USD/m3) | MIMEC value added per unit of water used for the MIMEC sector, expressed in USD/m3 with MIMEC including mining and quarrying; manufacturing; electricity, gas, steam and air conditioning supply; constructions (ISIC B, C, D and F). Calculation criteria: [SDG 6.4.1. industrial water use efficiency] = (([industry, value added to GDP]/[GDP deflator (2015)] × 100)/[industrial water withdrawal])/1,000,000,000 | ||
| SDG 6.4.1. Water use efficiency (USD/m3) | Value added per unit of water used expressed in USD/m3 Calculation criteria: [SDG 6.4.1. water use efficiency] = ([SDG 6.4.1. irrigated agriculture water use efficiency] × [agricultural water withdrawal as % of total water withdrawal]/100) + ([SDG 6.4.1. industrial water use efficiency] × [industrial water withdrawal as % of total water withdrawal]/100) + ([SDG 6.4.1. services water use efficiency] × [municipal water withdrawal as % of total withdrawal]/100) | ||
| Water consumption indicators | Water use, water withdrawal by sector | Agricultural water withdrawal (109 m3/year) | Annual quantity of self-supplied water withdrawn for irrigation, livestock, and aquaculture purposes. It can include water from renewable freshwater resources, as well as water from over-abstraction of renewable groundwater or withdrawal from fossil groundwater, direct use of agricultural drainage water, direct use of (treated) wastewater, and desalinated water. Water for the dairy and meat industries and industrial processing of harvested agricultural products is included under industrial water withdrawal. |
| Industrial water withdrawal (km3/year or 109 m3/year) | Annual quantity of self-supplied water withdrawn for industrial uses. It can include water from renewable freshwater resources, as well as water from over-abstraction of renewable groundwater or withdrawal from fossil groundwater, direct use of agricultural drainage water, direct use of (treated) wastewater, and desalinated water. This sector refers to self-supplied industries not connected to the public distribution network. The ratio between net consumption and withdrawal is estimated at less than 5%. It includes water for the cooling of thermoelectric and nuclear power plants, but it does not include hydropower. Water withdrawn by industries that are connected to the public supply network is generally included in municipal water withdrawal. | ||
| Municipal water withdrawal (km3/year or 109 m3/year) | Annual quantity of water withdrawn primarily for the direct use by the population. It can include water from renewable freshwater resources, as well as water from over-abstraction of renewable groundwater or withdrawal from fossil groundwater, direct use of agricultural drainage water, direct use of (treated) wastewater, and desalinated water. It is usually computed as the total water withdrawn by the public distribution network. It can include that part of the industries and urban agriculture, which is connected to the municipal network. The ratio between the net consumption and the water withdrawn can vary from 5 to 15% in urban areas and from 10 to 50% in rural areas. | ||
| Total water withdrawal (109 m3/year) | Annual quantity of water withdrawn for agricultural, industrial, and municipal purposes. It can include water from renewable freshwater resources, as well as water from over-abstraction of renewable groundwater or withdrawal from fossil groundwater, direct use of agricultural drainage water, direct use of (treated) wastewater, and desalinated water. It does not include in-stream uses, which are characterized by a very low net consumption rate, such as recreation, navigation, hydropower, inland capture fisheries, etc. Calculation criteria: [total water withdrawal] = [municipal water withdrawal] + [industrial water withdrawal] + [agricultural water withdrawal] | ||
| Water use, water withdrawal by source | Fresh surface water withdrawal (109 m3/year) | Annual gross amount of water extracted from rivers, lakes, and reservoirs. | |
| Fresh groundwater withdrawal (109 m3/year) | Annual gross amount of water extracted from aquifers. It can include withdrawal of renewable groundwater, as well as water from over-abstraction of renewable groundwater or withdrawal from fossil groundwater. | ||
| Total freshwater withdrawal (109 m3/year) | This is the sum of surface water withdrawal, that is extracted from extracted from rivers, lakes and reservoirs, and groundwater withdrawal extracted from aquifers. Calculation criteria: [total freshwater withdrawal] = [total water withdrawal] − [desalinated water produced] − [direct use of treated municipal wastewater] − [direct use of agricultural drainage water] |
Publisher’s Note: MDPI stays neutral with regard to jurisdictional claims in published maps and institutional affiliations. |
© 2021 by the authors. Licensee MDPI, Basel, Switzerland. This article is an open access article distributed under the terms and conditions of the Creative Commons Attribution (CC BY) license (https://creativecommons.org/licenses/by/4.0/).
Share and Cite
MDPI and ACS Style
Ferasso, M.; Bares, L.; Ogachi, D.; Blanco, M. Economic and Sustainability Inequalities and Water Consumption of European Union Countries. Water 2021, 13, 2696. https://0-doi-org.brum.beds.ac.uk/10.3390/w13192696
AMA Style
Ferasso M, Bares L, Ogachi D, Blanco M. Economic and Sustainability Inequalities and Water Consumption of European Union Countries. Water. 2021; 13(19):2696. https://0-doi-org.brum.beds.ac.uk/10.3390/w13192696
Chicago/Turabian StyleFerasso, Marcos, Lydia Bares, Daniel Ogachi, and Miguel Blanco. 2021. "Economic and Sustainability Inequalities and Water Consumption of European Union Countries" Water 13, no. 19: 2696. https://0-doi-org.brum.beds.ac.uk/10.3390/w13192696
Note that from the first issue of 2016, this journal uses article numbers instead of page numbers. See further details here.