Article

Filtering Effect of Rhinogobio cylindricus Gut Microbiota Relieved Influence of the Three Gorges Dam on the Gut Microbiota Composition

1
Key Laboratory of Ministry of Water Resources for Ecological Impacts of Hydraulic-Projects and Restoration of Aquatic Ecosystem, Institute of Hydroecology, Ministry of Water Resources and Chinese Academy of Sciences, Wuhan 430079, China
2
Dongguan Key Laboratory of Medical Bioactive Molecular Developmental and Translational Research, Guangdong Medical University, Dongguan 523808, China
3
Research and Development Center, Guangdong Meilikang Bio-Science Ltd., Dongguan 523808, China
*
Author to whom correspondence should be addressed.
Submission received: 27 August 2021 / Revised: 23 September 2021 / Accepted: 24 September 2021 / Published: 29 September 2021
(This article belongs to the Special Issue Biology and Ecology of Threatened Freshwater Fish)

Abstract

:
Fish gut microbiota were potentially influenced by habitat changes. However, the fish gut has been shown to have a filtering effect on habitat microorganisms. Here, we hypothesized that the filtering of fish gut microbiota could counteract the effect of dam construction on the gut microbiota composition. To test this hypothesis, we collected water and Rhinogobio cylindricus individuals from four sampling sites located upstream of the Three Gorges Dam (TGD) and analyzed the microbiota composition in the water samples (n = 48) and R. cylindricus gut samples (n = 89) by high-throughput sequencing of the 16S rRNA gene. A total of 6,772,720 (49,435.91 ± 3762.80) high-quality sequences were obtained from 137 samples. The microbiota in the water environment was significantly more diverse than that in the gut of R. cylindricus. The β-diversity of microbiota in the water was significantly lower than that in the gut of R. cylindricus. The water microbiota composition varied greatly according to the distribution of the sampling sites upstream of the TGD, but the gut microbiota of R. cylindricus did not show the same pattern. Rather, the gut microbiota of R. cylindricus were not significantly affected by the TGD. This consistency in the internal tract of R. cylindricus is presumedly a result of a filtering effect on the water microorganisms. Our study furthers our understanding of the stabilization mechanism of the gut microbiota composition of fish and the impact of dams on river ecosystems.

1. Introduction

Changes in the global fossil energy supply and global climate have increased the importance of the use of hydropower (and the associated construction of stations) as a way to solve the contradiction between meeting the global increase in energy demand and the urgency for environmental protection. Hydropower is also the main form of green energy production in China [1]. Dams also regulate the flow and prevent downstream flooding [2]. However, the construction of dams can greatly impact the surrounding environment and its inhabitants, e.g., alter the hydrology, water environment, and aquatic habitats, which result in obvious changes to the structure and function of the river ecosystem [2,3,4]. For example, our recent study showed that the construction of dams significantly altered the composition of microbiota in the upstream water and significantly increased the relative abundance of Cyanobacteria, especially harmful cyanobacteria blooms from the genus Synechococcus, but significantly decreased the relative abundance of Proteobacteria [3].
Gut microbiota play important roles in fish growth, development, immunity, and health [5,6,7,8]. However, fish gut microbiota can be affected by numerous factors, such as host development, food composition, feeding habit, habitat, and other internal and external factors [9,10,11,12]. Although only a few studies have assessed the gut microbiota of fish, changes in the gut microbiota have been confirmed to have direct and indirect health implications in mammals and humans [13,14,15]. Dam construction may potentially change the gut microbiota of fish and thus affect the stability and function of fish populations in the river ecosystem; however, no studies have assessed the impact of dams on fish gut microbiota. Considering the roles of gut microbiota in various fish physiological processes, it is important to determine the impact of dam construction on fish gut microbiota.
The Three Gorges Dam (TGD), located in the upper Yangtze River, is one of the largest hydropower stations worldwide [4]. Since 2003, the TGD has regulated the flow of the Yangtze River, which has modified the flow regime of the river and affected flow-dependent processes, such as the maintenance of wetlands, fish migration, and fish spawning [16]. The impact of the TGD on Yangtze fisheries has been widely studied [16,17]. The effects of the TGD on the hydrological characteristics and microbiota composition of the Yangtze River have also been studied. For instance, the TGD impoundment obviously increased the water level [2], and Wu et al. [18] reported that the species and density of Cladocera in the Three Gorges Reservoir (TGR) area were significantly higher than those in the upstream river area. However, little attention has been paid to the effect of the TGD on the gut microbiota of fish upstream of the TGD. As previously mentioned, fish gut microbiota can be easily affected by numerous factors, including their habitat. The construction of dams obviously changes the habitat of the upstream river, and thus such changes would be expected to affect the gut microbiota of fish. However, habitat microorganisms were filtered by the fish intestinal tract [12,19]. Therefore, we hypothesized that although the construction of the TGD would have altered the water environment and the water microbiota, the fish intestinal tract could counteract the effect of the dam construction on the composition of the gut microbiota in individuals in the upstream water of the TGD through filtering.
To verify our hypothesis, we collected water samples and Rhinogobio cylindricus individuals from four sampling sites located upstream of the TGD and analyzed the microbiota composition in the water and R. cylindricus by high-throughput sequencing of the 16S rRNA gene, as R. cylindricus is an endemic Chinese cyprinid fish that is mainly distributed in the upper reaches of the Yangtze River and its tributaries, and the fishery catch of R. cylindricus has experienced evident reductions in recent years [20].

2. Materials and Methods

2.1. Ethics Approval and Consent to Participate

All experimental protocols were approved by the ethics committee of the Institute of Hydroecology, the Ministry of Water Resources, and the Chinese Academy of Sciences (approved No. IHE[2019]030001). The fishing for studies was approved by the local fishery administrations-Department of Agriculture Affairs of Sichuan Province and Chongqing City. The study was carried out in compliance with the ARRIVE guidelines [21], and all methods were carried out in accordance with relevant guidelines and regulations.

2.2. Sampling Area and Sample Collection

Samples were collected from four sites: Fengdu (29.874° N, 107.731° E), Mudong (29.577° N, 106.843° E), Jiangjin (29.348° N, 106.429° E), and Hejiang (28.805° N, 105.843° E) in June and July 2019. Fengdu and Mudong are located in the tail area of the TGR and are influenced by the operation of the TGR, and Jiangjin and Hejiang are in the upper reach of the TGR and are not influenced by the operation of the TGR (Figure 1). Individuals of R. cylindricus were collected using the gill net technique. All collected individuals were measured (total length, TL; standard length, SL, measured to the nearest 0.1 cm) and weighed (body weight, BW, measured to the nearest 0.1 g). The degree of digestive obturation was analyzed as described by Zhang [22]. Fish guts were then collected and stored in plastic vials at −20 °C until further analysis.
Approximately 500 mL of water from each sample was filtered using glass fiber (GF/C) with a 0.22 μm aperture for extracting microbial genomic DNA [23].

2.3. Determination of Water Physicochemical Factors

Water physicochemical factors, including water temperature (WT), dissolved oxygen (DO), total dissolved solids (TDS), conductivity, and pH were measured in situ using the YSI 6600 monitoring system (YSI Inc., Yellow Springs, OH, USA). Transparency was measured using a monochrome plate. The velocity of water flow (m/s) was measured using an LGY II flow meter (Nanjing Shengrong Instrument and Equipment Inc., Nanjing, China).

2.4. DNA Extraction and High-Throughput Sequencing

Microbial DNA in the water and gut content samples was extracted using a PowerSoil DNA isolation kit (QIAGEN, Hilden, Germany), as previously described [3,15]. The V4–V5 hypervariable region of the prokaryotic 16S rRNA gene was amplified using the primers 515F and 909R, as previously described [3,24,25]. The polymerase chain reaction was performed, and the amplicons were sequenced using a HiSeq system at Guangdong Meilikang Bio-Science, Ltd. (Dongguan, China), as previously described [3,15].
The raw sequences were merged using FLASH version 1.2.8 [26] and processed using the QIIME version 1.9.0 [27], as previously described [25,28]. The chimeric sequences were identified and removed using UCHIME version 4.2.40 [29]. The remaining high-quality sequences were clustered into OTUs at 97% sequence identity using UPARSE version 7.0.1090 [30]. Taxonomic assignment of each OTU was conducted using the RDP classifier version 2.2 [31] with the Greengene gg_13_8 dataset.

2.5. Data Analysis

The results for each parameter were presented as means ± standard errors for each group. The Kruskal-Wallis test was used to test whether the environmental factors differed significantly between different sampling sites. PCoA was conducted using QIIME version 1.9.0 [27]. Non-parametric PerMANOVA [32] was applied to test the significance of differences between three or more groups using the R vegan package [33]. Principal component analysis and canonical correspondence analysis were conducted using the R vegan package. A standard non-parametric Kruskal-Wallis test with a Tukey-Kramer post hoc test was conducted to detect the statistical significance of dominant OTUs and the alpha-diversity indices of different sampling sites by using statistical analysis of metagenomic profiles (STAMP) software [34]. Box plots were drawn using the ggpubr R package. Correlation analysis was also conducted using the R vegan package. The microbial source tracking analysis was conducted using the SourceTracker [35]. Results with p-values < 0.05 were considered statistically significant.

3. Results

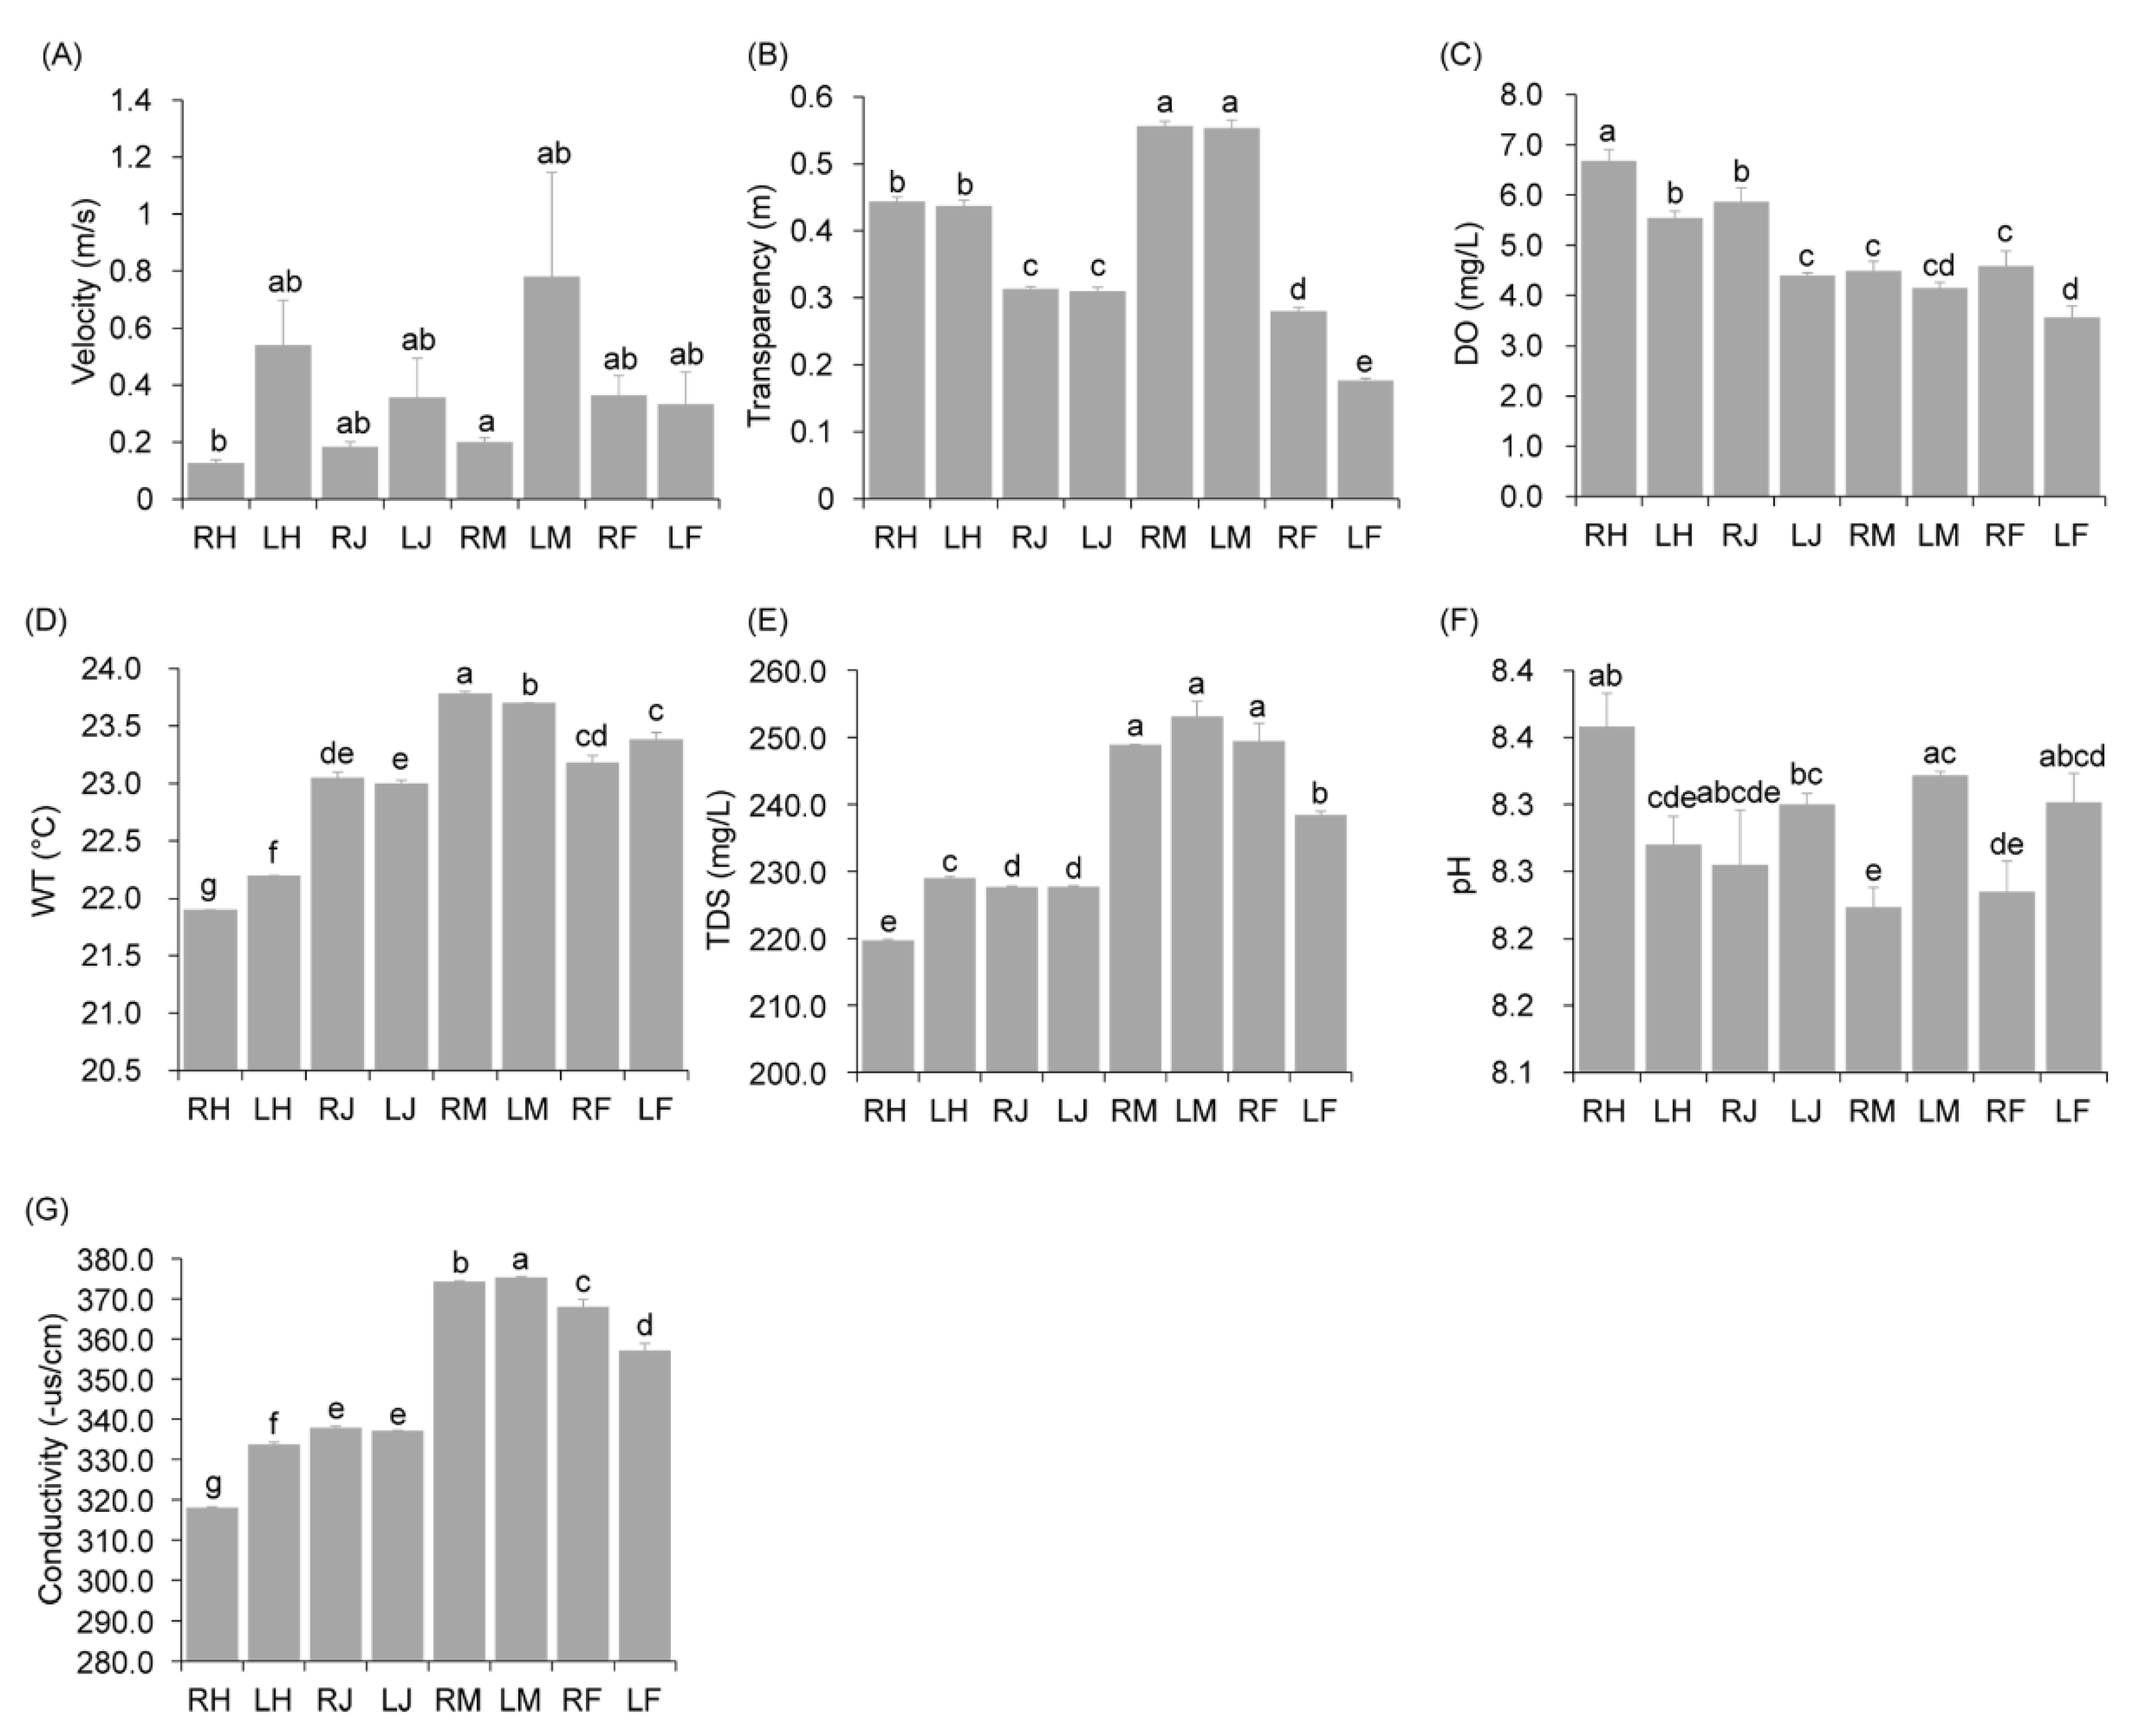
3.1. Changes in Water Physicochemical Indexes in Various Sampling Sites and Fish Biological Indexes

Except for the velocity, for which only significant differences were detected between the right bank of Hejiang (RH) and the right bank of Mudong (RM), significant differences were detected for all other physicochemical indexes (transparency, water temperature (WT), dissolved oxygen (DO), conductivity, total dissolved solids (TDS), and pH) among the sampling sites (Kruskal-Wallis test, p < 0.05; Figure 2A–G). The WT, DO, conductivity, and TDS at the Jiangjin and Hejiang sites (upstream of the TGR) were significantly different from those at the Fengdu and Mudong sites (located in the tail area of the TGR) (Wilcoxon test, p < 0.05; Figure 2C–E,G). Transparency and pH did not show significant changes (Wilcoxon test, p > 0.05; Figure 2B,F).
Even though there were significant differences in the whole length, body length, and body weight of fish among different sampling sites (Kruskal-Wallis rank sum test, p < 0.05), only body length was detected significant differences in pairwise comparisons (Wilcoxon test, p < 0.05; Figure S1).

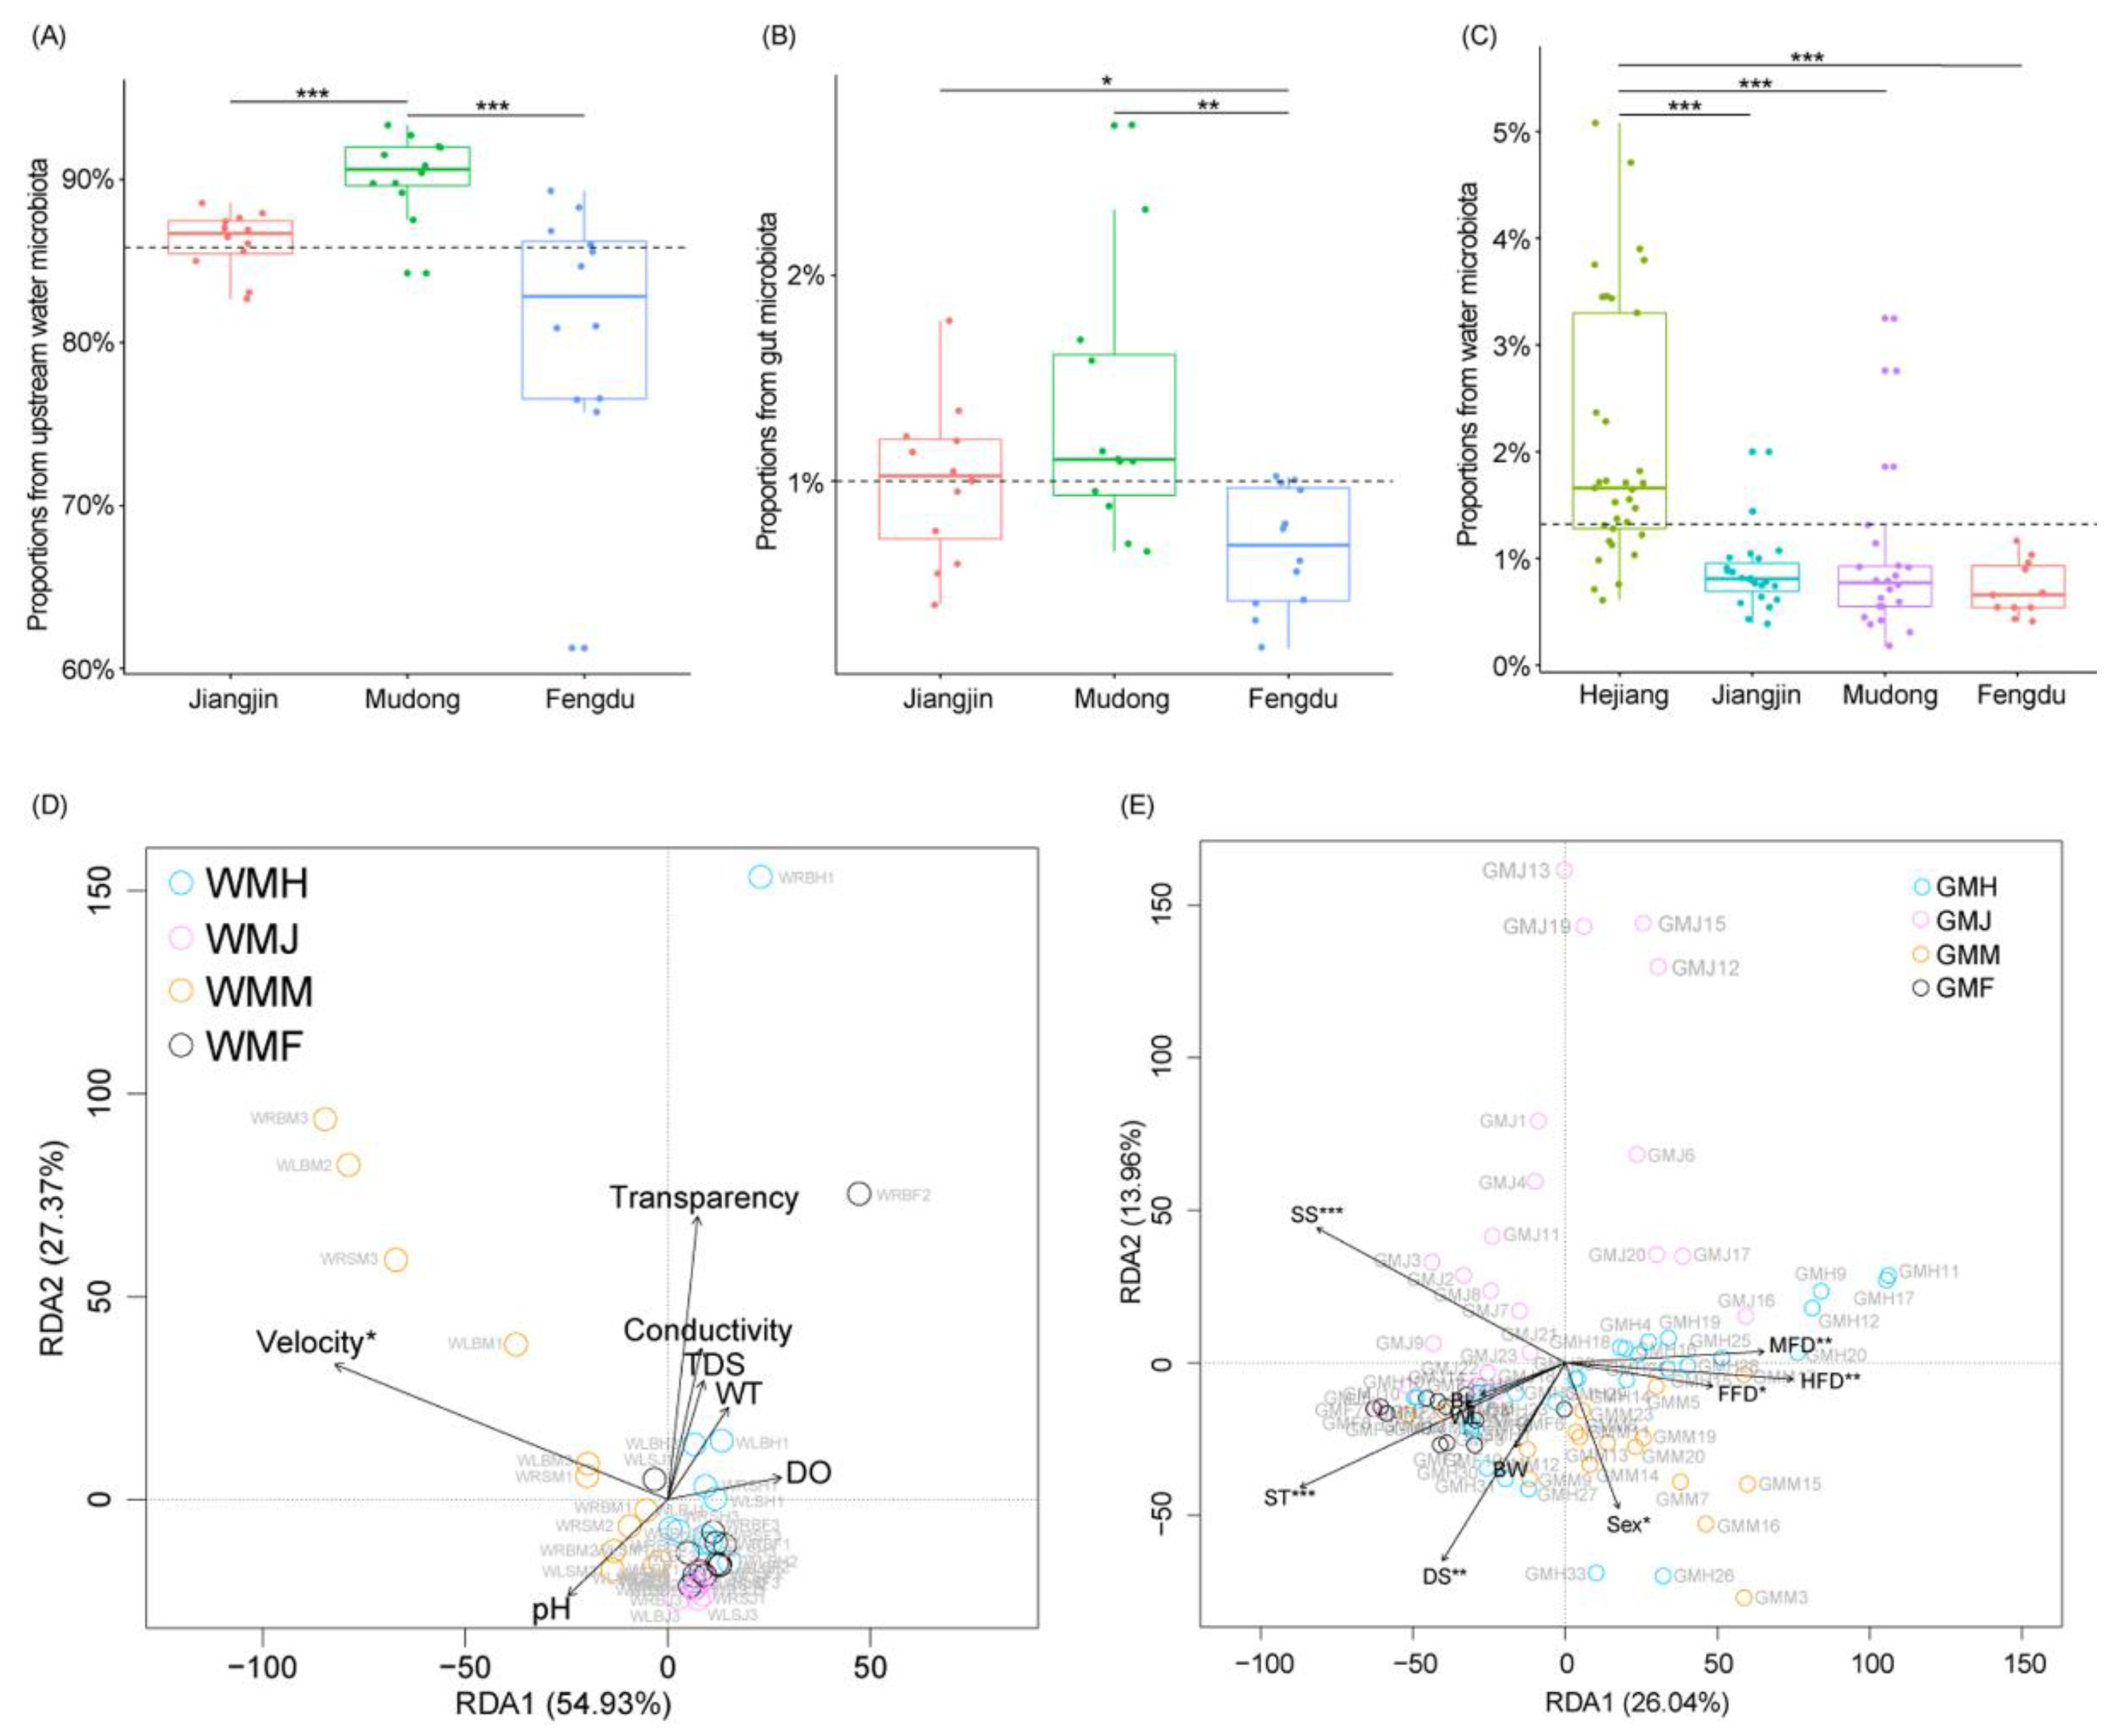
3.2. Changes in Water and R. cylindricus Gut Microbiota Compositions

A total of 6,772,720 (49,435.91 ± 3762.80) high-quality sequences were obtained from 137 samples (water: n = 48, fish gut: n = 89; Table S1). To exclude the influence of sequencing depth on subsequent analysis, 25,101 high-quality sequences were randomly selected from all samples for subsequent analysis. Based on a 97% sequence similarity, 21,885 operational taxonomic units (OTUs) were obtained using the de novo method.
The α-diversity indices, calculated based on the OTU structure, revealed that the microbiota in the water environment were significantly more diverse than that in the gut of R. cylindricus (Kruskal-Wallis test, p < 0.05; Figure 3A–D). Therefore, the coverage of microbiota in the gut of R. cylindricus was significantly higher than that in the water (Kruskal–Wallis test, p < 0.05; Figure 3E). These results indicated that the microbiota of R. cylindricus gut had a filter for the microorganisms from the surrounding environment.
The weighted UniFrac distances at the OTU level showed that the β-diversity of microbiota in the water was significantly lower than that in the gut of R. cylindricus (Kruskal-Wallis H test with Kruskal–Wallis test, p < 0.05; Figure 3F and Figure S2). Principal coordinate analysis (PCoA) revealed that the gut microbiota of R. cylindricus were significantly different to environmental water microbiota (Figure S2). The composition of the water microbiota differed in relation to the distance from the TGD (Figure 3G), and that the microbiota composition differed significantly between sites (PerMANOVA, F = 7.36, p = 0.005). Although the PCoA analysis of the gut microbiota of R. cylindricus did not show obvious changes in relation to the distance from the TGD, the gut microbiota compositions of R. cylindricus also showed significant differences between sampling sites (PerMANOVA, F = 8.33, p = 0.005; Figure 3H).
The detected OTUs were from 73 phyla (3 Archaea phyla and 70 Bacteria phyla) that were dominated by Proteobacteria (47.93 ± 0.65%), Actinobacteria (24.84 ± 0.58%), Bacteroidetes (12.40 ± 0.30%), Cyanobacteria (3.03 ± 0.12%), Firmicutes (2.42 ± 0.70%), Verrucomicrobia (1.65 ± 0.10%), Planctomycetes (1.60 ± 0.07%), Chlorobi (1.51 ± 0.12%), Chloroflexi (1.38 ± 0.07%), Acidobacteria (0.95 ± 0.06%), and Thermi (0.21 ± 0.08%) dominated the water microbiota, and Proteobacteria (63.64 ± 2.49%), Firmicutes (18.98 ± 2.13%), Tenericutes (5.75 ± 1.19%), Actinobacteria (2.29 ± 0.42%), Cyanobacteria (1.82 ± 0.34%), Bacteroidetes (1.22 ± 0.28%), Fusobacteria (0.62 ± 0.15%), Planctomycetes (0.42 ± 0.08%), Chloroflexi (0.27 ± 0.06%), and Thermi (0.10 ± 0.04%) in the gut microbiota of R. cylindricus (Figure 4 and Figure S3). The relative abundance of all dominant phyla differed significantly between the water and gut microbiota (Wilcoxon rank-sum test, p < 0.05; Figure 4A). Although the relative abundances of the most dominant phyla in the water microbiota were significantly different between different sampling sites, only the relative abundances of Acidobacteria (Wilcoxon test, p < 0.001) and Chlorobi (Wilcoxon test, p < 0.001) in the water microbiota from the upstream sampling sites (Hejiang and Jiangjin) were significantly reduced compared with those at the sites from the tail area of TGR (Fengdu and Mudong). The relative abundance of Bacteroidetes was significantly increased (Wilcoxon test, p < 0.001; Figure 4C and Figure S4). However, the gut microbiota of R. cylindricus did not exhibit this regular pattern, despite showing significant differences in the relative abundances of the most dominant phyla between the different sampling sites (Wilcoxon test, p < 0.05; Figure 4B).
To further analyze the differences in microbial communities among sampling sites, we used the Kruskal-Wallis H test with Tukey-Kramer post hoc test to screen OTUs with significant differences among different sampling sites. A total of 311 significantly different OTUs were detected in the water microbiota (Table S2), of which 138 OTUs were accurately divided into genus or species levels. These OTUs were from Proteobacteria, Bacteroidetes, Firmicutes, Actinobacteria, Cyanobacteria, Verrucomicrobia, Planctomycetes, Nitrospirae, and Thermi. The OTUs exhibited a clustering trend according to the sampling sites, and their relative abundances differed significantly among different sampling sites (Kruskal-Wallis H test with Tukey-Kramer post hoc test, p < 0.05; Figure S5). A total of 488 significantly different OTUs were detected from the gut microbiota of R. cylindricus, among the sampling sites (Kruskal-Wallis H test with Tukey-Kramer post hoc test, p < 0.05; Table S3), on which 233 OTUs were accurately divided into genus or species level. These OTUs were from Proteobacteria, Firmicutes, Fusobacteria, Actinobacteria, Cyanobacteria, and Crenarchaeota. Although these OTUs showed significant differences among the sampling sites (Kruskal-Wallis H test with Tukey-Kramer post hoc test, p < 0.05), these OTUs could not be clustered according to their relative abundances (Figure S6). Interestingly, Escherichia coli was significantly enriched in the gut microbiota of R. cylindricus compared with that in the water environment (Kruskal-Wallis H test with Tukey-Kramer post hoc test, p < 0.05; Figures S5 and S6).

3.3. Factors That Influence R. cylindricus Gut Microbiota

To analyze which factors significantly affected the gut microbiota of R. cylindricus, we first conducted microbial source tracking analysis. Our results showed that more than 80% of the water bacterial OTUs were from the upstream water microbiota in Jiangjin and Mudong but were significantly reduced in Fengdu (Kruskal-Wallis H test with Tukey–Kramer post hoc test, p < 0.001; Figure 5A). Although the proportion of water bacteria from the gut microbiota of R. cylindricus was very small (less than 3%), it also showed the same pattern (Kruskal-Wallis H test with Tukey-Kramer post hoc test, p < 0.05; Figure 5B). Only less than 5% of the bacterial OTUs of the gut microbiota of R. cylindricus were from the water microbiota, but they exhibited a declining trend closer to the TGD (Figure 5C). These results implied that the TGR reduced the proportion of bacterial OTUs of the water microbiota in the gut microbiota of R. cylindricus, while R. cylindricus reduced the influence of the operation of TGR on their gut microbiota through filtering.
The redundancy analysis results showed that, among the physicochemical indexes, only the velocity had a significant effect on the water microbiota composition (Monte Carlo permutation test, p < 0.05; Figure 5D), while the sampling site, sampling time, developmental stage, midgut filling degree, hindgut filling degree, foregut filling degree, and sex of R. cylindricus significantly affected the gut microbiota composition of R. cylindricus (Monte Carlo permutation test, p < 0.05; Figure 5E).
Dispersal limitation is considered to be an important factor that influences the β-diversity of microbiota and is mainly reflected in the fact that the difference in microbiota increases with the increase in the geographical distance [36,37,38]. Here, we analyzed the variation in the β-diversity of the water and R. cylindricus gut microbiota with geographical distance by using the regression relationship between the UniFrac distances of the microbiota with geographical distance along the Yangtze River. Our results showed that there was a slight but significant positive correlation between the UniFrac distances of water microbiota and the geographical distance (F = 6.148, p = 0.013; Figure 6B). However, no significant correlation was found between the UniFrac distances of the gut microbiota of R. cylindricus and the geographical distance (F = 1.171, p = 0.279; Figure 6A).

4. Discussion

Since the impoundment of the TGR in 2003, the impact of the TGD on the ecosystem, especially the aquatic biological resources, has been extensively studied [4,16,18,39]. Previous studies have shown that the construction of the TGD has substantially affected the abundance of indigenous fish in the Yangtze River [17,40]. Researchers have attributed this decline in fish resources to the destruction of fish migration channels and spawning grounds by the TGD and to the change in the flow pattern of the Yangtze River and fish spawning time [39]. R. cylindricus also has experienced evident reductions after TGR impoundment [20,40,41]. Disruption of its main habitat by the TGD was considered the major reason that causes the reductions [41,42]. However, more detailed biological effects of the TGD on fish, such as the effect on the composition of gut microbiota, have not yet been assessed. Our results showed that there were significant differences in the water microbiota composition at all four sampling sites upstream of the TGD, and they showed characteristics of regular alternation. However, the gut microbiota of R. cylindricus did not exhibit this regular alternation among sampling sites, despite showing significant differences among sampling sites. These differences are presumedly the result of habitat differences among the sampling sites. Despite the widespread effects of habitat differences on gut microbiota [10,11], our results showed that the gut microbiota of R. cylindricus were not significantly affected by the TGD.
Xu et al. [43] investigated the natural reproduction of fish producing drifting eggs in the lower reaches of the Wujiang River before and after the impoundment of the Yin-pan hydropower station. Their results showed that the impoundment of the hydropower station damaged the spawning grounds of fish producing drifting eggs in the upper reaches, and significantly reduced the annual spawning of the fish producing drifting eggs, including R. cylindricus. The above results implied that the fish such as R. cylindricus were affected by the hydrological characteristics changes of the habitat. However, the gut microbiota of R. cylindricus in the Wujiang River are not investigated. Therefore, we did not analyze the influence of the Yin-pan hydropower station on the gut microbiota of R. cylindricus. Moreover, impoundment of the TGD significantly changed the hydrological characteristics of the upstream (Figure 2), which may also be the reason for the changes in water microbiota compositions in the Yangtze River.
Environmental selection is considered to be an important factor that affects microbial community composition in specific habitats [44,45,46]. Although a large number of microorganisms can be detected in the intestinal tract, the intestinal tract also has a filter for external microorganisms [12,19]. The number of OTUs in fish gut microbiota is significantly lower than those in environmental water microbiota [47]. Considering the sampling time, our results showed that the number of OTUs in R. cylindricus gut microbiota was obviously less than that of largemouth bass (Micropterus salmoides) cultured in ponds [47]. Our results, based on microbial source tracking analysis, showed that only a very small portion (0% to 5%) of the gut microbiota of R. cylindricus was derived from the surrounding water microbiota (Figure 5C), which is consistent with the findings of a previous study [46]. This result indicated that the intestinal tract of R. cylindricus has a filter for water microorganisms in the surrounding environment, which partly explains why the gut microbiota of R. cylindricus did not change in relation to the changes among the sampling sites (Figure 3H). Considering R. cylindricus has experienced evident reductions after TGD completed [20,40,41], our results also implied that the evident reductions of R. cylindricus was not due to the change of their gut microbiota composition caused by TGD, but was likely to be caused by other ways, such as the destruction of spawning grounds. Another possible cause of the evident reductions of R. cylindricus was that the “less flexible” gut microbiota composition of R. cylindricus reduced the ability of R. cylindricus to adapt to the changes in the surrounding environment. However, these conjectures need to be confirmed by further study.
Dispersal limitation is considered an important factor that influences the β-diversity of microbiota, which is mainly reflected in the fact that the distance of microbiota increases with the increase in the geographical distance [36,37,38]. Gut microbiota also exhibit dispersal limitation patterns in various hosts [48,49,50]. Our results showed that the habitat water exhibited a weak dispersal limitation pattern (Figure 6B), while the gut microbiota of R. cylindricus did not show a dispersal limitation pattern (Figure 6A), despite the fish gut microbiota having been considered to be an ideal model for studying the dispersal limitation of microorganisms [49]. This discrepancy may be attributable to the fact that R. cylindricus is a small migratory fish, and its migration behavior offsets the geographical distribution of their gut microbiota.
As previously reported [9,11,51], multiple biological indicators of R. cylindricus substantially affected the composition of the gut microbiota (Figure 5E). Most of these biological factors were independent of the microbial community in the water habitat. Therefore, changes in the microbial community in the water, caused by the TGD, did not affect the changes in the gut microbiota of R. cylindricus.

5. Conclusions

The TGD operation significantly changed the hydrological characteristics of the upstream. Based on the sequencing analysis of the microbiota from 48 water samples and 89 R. cylindricus gut samples collected from four sampling sites upstream of the TGD, we found that the water microbiota composition changed regularly according to the distribution of sampling sites upstream of the TGD, but the internal microbiota of R. cylindricus did not show the same pattern. This difference is presumedly due to the filtering imposed by the internal tract of R. cylindricus on the microorganisms from the surrounding aquatic environment. Our study offers new insights into the stabilization mechanism of the gut microbiota composition in fish and the impact of dams on river ecosystems and provides important reference information for future studies and to inform decision-makers.

Supplementary Materials

The following are available online at https://0-www-mdpi-com.brum.beds.ac.uk/article/10.3390/w13192697/s1, Figure S1: Whole length (A), body length (B), and body weight (C) of the R. cylindricus samples, Figure S2: Principal coordinate analysis profile based on weighted UniFrac distances of water and gut microbiota of R. cylindricus, Figure S3: Dominant phylum compositions of each microbial community, Figure S4: Relative abundance differences of Acidobacteria (A), Chlorobi (B), and Bacteroidetes (C) in the river water microbiota, Figure S5: Heatmap profile of dominant OTUs in the water microbiota, Figure S6: Heatmap profile of dominant OTUs in the gut microbiota of R. cylindricus, Table S1: Sample information, Table S2: Significantly different OTUs in the water microbiota, Table S3: Significantly different OTUs in the gut microbiota of R. cylindricus.

Author Contributions

Conceptualization, X.C. and J.N.; methodology, X.C.; software, Q.Z. and J.N.; validation, Z.Y. and N.Z.; formal analysis, X.C. and Q.Z.; investigation, X.C., Q.Z., Z.Y. and H.S.; resources, X.C.; data curation, Q.Z.; writing—original draft preparation, X.C.; writing—review and editing, J.N.; visualization, Q.Z., Z.Y. and N.Z.; supervision, H.S.; project administration, X.C.; funding acquisition, X.C. All authors have read and agreed to the published version of the manuscript.

Funding

This research was funded by the National Natural Science Foundation of China, grant number 51879171.

Institutional Review Board Statement

The study was conducted according to the guidelines of the Declaration of Helsinki, and approved by the Institutional Ethics Committee of Insitute of Hydroecology, MWR&CAS (approved No. IHE[2019]030001, 12 March 2019).

Informed Consent Statement

Not applicable.

Data Availability Statement

The merged sequences were submitted to the Genome Sequence Archive database (GSA, https://bigd.big.ac.cn/gsa/, accessed on 5 November 2020) under the accession number CRA003384.

Acknowledgments

We would thank Zhanjing Li, a technician at Guangdong Meilikang Bio-Science Ltd. (China) for assistance with data analysis.

Conflicts of Interest

J. Ni is an employee of Guangdong Meilikang Bio-Sciences, Ltd., China. Other authors declare there are no competing interests.

References

  1. National Bureau of Statistics. China Statistical Yearbook 2020; China Statistics Press: Beijing, China, 2020. (In Chinese)
  2. Zhang, X.; Dong, Z.; Gupta, H.; Wu, G.; Li, D. Impact of the three gorges dam on the hydrology and ecology of the yangtze river. Water 2016, 8, 590. [Google Scholar] [CrossRef]
  3. Chen, X.; He, D.; Zhou, L.; Cao, Y.; Li, Z. Influence of hydropower stations on the water microbiota in the downstream of Jinsha River, China. PeerJ 2020, 8, e9500. [Google Scholar] [CrossRef]
  4. Wu, J.; Huang, J.; Han, X.; Gao, X.; He, F.; Jiang, M.; Jiang, Z.; Primack, R.B.; Shen, Z. The Three Gorges Dam: An ecological perspective. Front. Ecol. Environ. 2004, 2, 241–248. [Google Scholar] [CrossRef]
  5. Galindo-Villegas, J.; García-Moreno, D.; de Oliveira, S.; Meseguer, J.; Mulero, V. Regulation of immunity and disease resistance by commensal microbes and chromatin modifications during zebrafish development. Proc. Natl. Acad. Sci. USA 2012, 109, 2605–2614. [Google Scholar] [CrossRef] [PubMed] [Green Version]
  6. Pérez, T.; Balcázar, J.L.; Ruiz-Zarzuela, I.; Halaihel, N.; Vendrell, D.; de Blas, I.; Múzquiz, J.L. Host–microbiota interactions within the fish intestinal ecosystem. Mucosal Immunol. 2010, 3, 355–360. [Google Scholar] [CrossRef]
  7. Stagaman, K.; Burns, A.; Guillemin, K.; Bohannan, B.J. The role of adaptive immunity as an ecological filter on the gut microbiota in zebrafish. ISME J. 2017, 11, 1630–1639. [Google Scholar] [CrossRef]
  8. Xiong, J.; Nie, L.; Chen, J. Current understanding on the roles of gut microbiota in fish disease and immunity. Zool. Res. 2019, 40, 70–76. [Google Scholar] [CrossRef] [Green Version]
  9. Li, X.; Zhou, L.; Yu, Y.; Ni, J.; Xu, W.; Yan, Q. Composition of gut microbiota in the gibel carp (Carassius auratus gibelio) varies with host development. Microb. Ecol. 2017, 74, 239–249. [Google Scholar] [CrossRef]
  10. Ni, J.; Yu, Y.; Zhang, T.; Gao, L. Comparison of intestinal bacterial communities in grass carp, Ctenopharyngodon idellus, from two different habitats. Chin. J. Oceanol. Limnol. 2012, 30, 757–765. [Google Scholar] [CrossRef]
  11. Ni, J.; Yan, Q.; Yu, Y.; Zhang, T. Factors influencing the grass carp gut microbiome and its effect on metabolism. FEMS Microbiol. Ecol. 2013, 87, 704–714. [Google Scholar] [CrossRef]
  12. Yan, Q.; Li, J.; Yu, Y.; Wang, J.; He, Z.; Van Nostrand, J.D.; Kempher, M.L.; Wu, L.; Wang, Y.; Liao, L.; et al. Environmental filtering decreases with fish development for the assembly of gut microbiota. Environ. Microbiol. 2016, 18, 4739–4754. [Google Scholar] [CrossRef]
  13. D’Aversa, F.; Tortora, A.; Ianiro, G.; Ponziani, F.R.; Annicchiarico, B.E.; Gasbarrini, A. Gut microbiota and metabolic syndrome. Intern. Emerg. Med. 2013, 8, 11–15. [Google Scholar] [CrossRef] [PubMed]
  14. Fukuda, S.; Toh, H.; Hase, K.; Oshima, K.; Nakanishi, Y.; Yoshimura, K.; Tobe, T.; Clarke, J.M.; Topping, D.L.; Suzuki, T.; et al. Bifidobacteria can protect from enteropathogenic infection through production of acetate. Nature 2011, 469, 543–547. [Google Scholar] [CrossRef]
  15. Ni, J.; Huang, R.; Zhou, H.; Xu, X.; Li, Y.; Cao, P.; Zhong, K.; Ge, M.; Chen, X.; Hou, B.; et al. Analysis of the relationship between the degree of dysbiosis in gut microbiota and prognosis at different stages of primary hepatocellular carcinoma. Front. Microbiol. 2019, 10, 1458. [Google Scholar] [CrossRef] [PubMed]
  16. Cheng, L.; Opperman, J.J.; Tickner, D.; Speed, R.; Guo, Q.; Chen, D. Managing the Three Gorges Dam to implement environmental flows in the Yangtze River. Front. Environ. Sci. 2018, 6, 64. [Google Scholar] [CrossRef] [Green Version]
  17. Xie, S.G.; Li, Z.J.; Liu, J.S.; Murphy, B.R. Fisheries of the Yangtze River show immediate impacts of the Three Gorges Dam. Fisheries 2007, 32, 343–344. [Google Scholar]
  18. Wu, H.; Yao, J.; Liu, Y.; Xue, J.; Cai, Q.; Liu, J. Seasonal variation and longitudinal distribution characters of cladocerans in the Three Gorges Reservoir. Biodiv. Sci. 2009, 17, 512–517. [Google Scholar]
  19. Näpflin, K.; Schmid-Hempel, P. Host effects on microbiota community assembly. J. Anim. Ecol. 2017, 87, 331–340. [Google Scholar] [CrossRef]
  20. Shao, K.; Yan, S.; Zhao, Y.; Xiong, M.; Xu, N.; Zhu, B.; Shi, F. Seventeen microsatellite loci isolated from Rhinogobio cylindricus (Gunther), and their cross-amplification in six Gobioninae species. Conserv. Genet. Resour. 2012, 5, 339–342. [Google Scholar] [CrossRef]
  21. Kilkenny, C.; Browne, W.J.; Cuthill, I.C.; Emerson, M.; Altman, D.G. Improving bioscience research reporting: The ARRIVE guidelines for reporting animal research. PLoS Biol. 2010, 8, e1000412. [Google Scholar] [CrossRef]
  22. Zhang, T. Life history strategy, trophic patterns and community structure of fishes in Biandantang Lake. Ph.D. Thesis, University of Chinese Academy of Sciences, Beijing, China, 2005. [Google Scholar]
  23. Ni, J.; Yu, Y.; Feng, W.; Yan, Q.; Pan, G.; Yang, B.; Xiang, Z.; Xuemei, L. Impacts of algal blooms removal by chitosan-modified soils on zoo-plankton community in Taihu Lake, China. J. Environ. Sci. 2010, 22, 1500–1507. [Google Scholar] [CrossRef]
  24. Huang, R.; Li, T.; Ni, J.; Bai, X.; Gao, Y.; Li, Y.; Zhang, P.; Gong, Y. Different Sex-Based Responses of Gut Microbiota During the Development of Hepatocellular Carcinoma in Liver-Specific Tsc1-Knockout Mice. Front. Microbiol. 2018, 9, 1008. [Google Scholar] [CrossRef] [PubMed]
  25. Xiang, J.; He, T.; Wang, P.; Xie, M.; Xiang, J.; Ni, J. Opportunistic pathogens are abundant in the gut of cultured giant spiny frog (Paa spinosa). Aquac. Res. 2018, 49, 2033–2041. [Google Scholar] [CrossRef]
  26. Magoč, T.; Salzberg, S. FLASH: Fast length adjustment of short reads to improve genome assemblies. Bioinformatics 2011, 27, 2957–2963. [Google Scholar] [CrossRef] [PubMed]
  27. Caporaso, J.G.; Kuczynski, J.; Stombaugh, J.; Bittinger, K.; Bushman, F.D.; Costello, E.K.; Fierer, N.; Peña, A.G.; Goodrich, J.K.; Gordon, J.I.; et al. QIIME allows analysis of high-throughput community sequencing data. Nat. Methods 2010, 7, 335–336. [Google Scholar] [CrossRef] [PubMed] [Green Version]
  28. Ni, J.; Li, X.; He, Z.; Xu, M. A novel method to determine the minimum number of sequences required for reliable microbial community analysis. J. Microbiol. Methods 2017, 139, 196–201. [Google Scholar] [CrossRef]
  29. Edgar, R.C.; Haas, B.J.; Clemente, J.C.; Quince, C.; Knight, R. UCHIME improves sensitivity and speed of chimera detection. Bioinformatics 2011, 27, 2194–2200. [Google Scholar] [CrossRef] [Green Version]
  30. Edgar, R.C. UPARSE: Highly accurate OTU sequences from microbial amplicon reads. Nat. Methods 2013, 10, 996–998. [Google Scholar] [CrossRef]
  31. Wang, Q.; Garrity, G.M.; Tiedje, J.M.; Cole, J.R. Naïve Bayesian classifier for rapid assignment of rRNA sequences into the new bacterial taxonomy. Appl. Environ. Microbiol. 2007, 73, 5261–5267. [Google Scholar] [CrossRef] [Green Version]
  32. Anderson, M.J. A new method for non-parametric multivariate analysis of variance. Austral. Ecol. 2001, 26, 32–46. [Google Scholar]
  33. Dixon, P. VEGAN, a package of R functions for community ecology. J. Veg. Sci. 2003, 14, 927–930. [Google Scholar] [CrossRef]
  34. Parks, D.H.; Beiko, R.G. Identifying biologically relevant differences between metagenomic communities. Bioinformatics 2010, 26, 715–721. [Google Scholar] [CrossRef] [Green Version]
  35. Knights, D.; Kuczynski, J.; Charlson, E.S.; Zaneveld, J.; Mozer, M.C.; Collman, R.G.; Bushman, F.D.; Knight, R.; Kelley, S.T. Bayesian community-wide culture-independent microbial source tracking. Nat. Methods 2011, 8, 761–763. [Google Scholar] [CrossRef] [PubMed] [Green Version]
  36. Cao, P.; Wang, J.-T.; Hu, H.-W.; Zheng, Y.-M.; Ge, Y.; Shen, J.-P.; He, J.-Z. Environmental filtering process has more important roles than dispersal limitation in shaping large-scale prokaryotic beta diversity patterns of grassland soils. Microb. Ecol. 2016, 72, 221–230. [Google Scholar] [CrossRef] [PubMed] [Green Version]
  37. Eisenlord, S.D.; Zak, D.R.; Upchurch, R.A. Dispersal limitation and the assembly of soil Actinobacteria communities in a long-term chronosequence. Ecol. Evol. 2012, 2, 538–549. [Google Scholar] [CrossRef]
  38. Logares, R.; Deutschmann, I.M.; Junger, P.C.; Giner, C.R.; Krabberød, A.K.; Schmidt, T.S.B.; Rubinat-Ripoll, L.; Mestre, M.; Salazar, G.; Ruiz-González, C. Disentangling the mechanisms shaping the surface ocean microbiota. Microbiome 2020, 8, 55. [Google Scholar] [CrossRef] [Green Version]
  39. Stone, R. China’s environmental challenges: Three Gorges Dam: Into the Unknown. Science 2008, 321, 628–632. [Google Scholar] [CrossRef]
  40. Cheng, F.; Li, W.; Castello, L.; Murphy, B.R.; Xie, S. Potential effects of dam cascade on fish: Lessons from the Yangtze River. Rev. Fish Biol. Fish. 2015, 25, 569–585. [Google Scholar] [CrossRef]
  41. Fu, C.; Wu, J.; Chen, J.; Wu, Q.; Lei, G. Freshwater fish biodiversity in the Yangtze River basin of China: Patterns, threats and conservation. Biodivers. Conserv. 2003, 12, 1649–1685. [Google Scholar] [CrossRef]
  42. Huang, F.; Xia, Z.; Zhang, N.; Lu, Z. Does hydrologic regime affect fish diversity? -A case study of the Yangtze Basin (China). Environ. Boil. Fishes 2011, 92, 569–584. [Google Scholar] [CrossRef]
  43. Xu, W.; Yang, Z.; Wan, L.; Tang, H.; Chen, X. Natural reproduction status of fish species producing pelagic eggs before and after impoundment of Yin-pan hydropower station in the lower Wujiang River. J. Hydroecol. 2019, 40, 8–15. [Google Scholar]
  44. Ruff, S.E.; Biddle, J.F.; Teske, A.P.; Knittel, K.; Boetius, A.; Ramette, A. Global dispersion and local diversification of the me-thane seep microbiome. Proc. Natl. Acad. Sci. USA 2015, 112, 4015–4020. [Google Scholar] [CrossRef] [PubMed] [Green Version]
  45. Zha, Y.; Lindström, E.S.; Eiler, A.; Svanbäck, R. Different roles of environmental selection, dispersal, and drift in the assembly of intestinal microbial communities of freshwater fish with and without a stomach. Front. Ecol. Evol. 2020, 8, 152. [Google Scholar] [CrossRef]
  46. Zhou, J.; Yang, H.; Tang, F.; Koide, R.; Cui, M.; Liu, Y.; Sun, Q.; Insam, H.; Zhang, Q. Relative roles of competition, environmental selection and spatial processes in structuring soil bacterial communities in the Qinghai-Tibetan Plateau. Appl. Soil Ecol. 2017, 117–118, 223–232. [Google Scholar] [CrossRef]
  47. Liu, Q.; Lai, Z.; Gao, Y.; Wang, C.; Zeng, Y.; Liu, E.; Mai, Y.; Yang, W.; Li, H. Connection between the gut microbiota of largemouth bass (Micropterus salmoides) and microbiota of the pond culture environment. Microorganisms 2021, 9, 1770. [Google Scholar] [CrossRef] [PubMed]
  48. Moeller, A.H.; Suzuki, T.A.; Lin, D.; Lacey, E.A.; Wasser, S.K.; Nachman, M.W. Dispersal limitation promotes the diversification of the mammalian gut microbiota. Proc. Natl. Acad. Sci. USA 2017, 114, 13768–13773. [Google Scholar] [CrossRef] [Green Version]
  49. Ni, J.; Yan, Q.; Yu, Y.; Zhang, T. Fish gut microecosystem: A model for detecting spatial pattern of microorganisms. Chin. J. Oceanol. Limnol. 2013, 32, 54–57. [Google Scholar] [CrossRef] [Green Version]
  50. Pastor, H.J.B.; Gordon, D.M. Effects of dispersal limitation in the face of intense selection via dietary intervention on the faecal microbiota of rats. Environ. Microbiol. Rep. 2015, 8, 187–195. [Google Scholar] [CrossRef]
  51. Li, J.; Ni, J.; Wang, C.; Yu, Y.; Zhang, T. Different response patterns of fish foregut and hindgut microbiota to host habitats and genotypes. Appl. Ecol. Environ. Res. 2020, 18, 7369–7378. [Google Scholar] [CrossRef]
Figure 1. Distribution of sampling sites along the Yangtze River, China. The black dots indicate the cities, and the red dots indicate the sampling sites.
Water 13 02697 g001
Figure 2. Histogram profiles of water physical and chemical factors in the sampling sites. (A), average water velocity in the sampling sites; (B), average water transparency in the sampling sites; (C), average dissolved oxygen (DO) of the water in the sampling sites; (D), average water temperature (WT) in the sampling sites; (E), average total dissolved solids (TDS) of the water in the sampling sites; (F), average water pH value in the sampling sites; (G), average water conductivity in the sampling sites. RH, right bank at Hejiang; LH, left bank at Hejiang. RJ, right bank at Jiangjin; LJ, left bank at Jiangjin; RM, right bank at Mudong; LM, left bank at Mudong; RF, right bank at Fengdu; LF, left bank at Fengdu. The different lowercase letters above the bars show the significant differences among the groups (p < 0.05).
Water 13 02697 g002
Figure 3. The changes in alpha diversity indexes (AE), Weighted UniFrac distances (F), and water microbiota compositions (G) and Rhinogobio cylindricus gut microbiota compositions (H) as revealed by PCoA profiles, based on weighted UniFrac distance matrices at the operational taxonomic unit level. The different lowercase letters above the boxplots show the significant differences among the groups (p < 0.05). GMH, gut microbiota of R. cylindricus collected at Hejiang; GMJ, gut microbiota of R. cylindricus collected at Jiangjin; GMM, gut microbiota of R. cylindricus collected at Mudong; GMF, gut microbiota of R. cylindricus collected at Fengdu; WMH, water microbiota collected at Hejiang; WMJ, water microbiota collected at Jiangjin; WMM, water microbiota collected at Mudong; WMF, water microbiota collected at Fengdu; WLBF, water microbiota collected from the bottom of left bank at Fengdu; WLBH, water microbiota collected from the bottom of left bank at Hejiang; WLBJ, water microbiota collected from the bottom of left bank at Jiangjin; WLBM, water microbiota collected from the bottom of left bank at Mudong; WLSF, water microbiota collected from the surface of left bank at Fengdu; WLSH, water microbiota collected from the surface of left bank at Hejiang; WLSJ, water microbiota collected from the surface of left bank at Jiangjin; WLSM, water microbiota collected from the surface of left bank at Mudong; WRBF, water microbiota collected from the bottom of right bank at Fengdu; WRBH, water microbiota collected from the bottom of right bank at Hejiang; WRBJ, water microbiota collected from the bottom of right bank at Jiangjin; WRBM, water microbiota collected from the bottom of right bank at Mudong; WRSF, water microbiota collected from the surface of right bank at Fengdu; WRSH, water microbiota collected from the surface of right bank at Hejiang; WRSJ, water microbiota collected from the surface of right bank at Jiangjin; WRSM, water microbiota collected from the surface of right bank at Mudong.
Water 13 02697 g003
Figure 4. Phylum-level compositions of dominant water and Rhinogobio cylindricus gut microbiota. (A) Relative abundances of the dominant phyla of water and R. cylindricus gut microbiota. (B) Relative abundances of the dominant phyla of R. cylindricus gut microbiota among different sampling sites. (C) Relative abundances of the dominant phyla in the water microbiota among different sampling sites. GM, gut microbiota; WM, water microbiota; GMH, gut microbiota of R. cylindricus collected at Hejiang; GMJ, gut microbiota of R. cylindricus collected at Jiangjin; GMM, gut microbiota of R. cylindricus collected at Mudong; GMF, gut microbiota of R. cylindricus collected at Fengdu; WMH, water microbiota collected at Hejiang; WMJ, water microbiota collected at Jiangjin; WMM, water microbiota collected at Mudong; WMF, water microbiota collected at Fengdu. *, p < 0.05; **, p < 0.01; ***, p < 0.001.
Water 13 02697 g004
Figure 5. Proportions of bacteria from the upstream water body (A) and Rhinogobio cylindricus intestine (B) in the downstream water and the proportion of fish intestinal microbiota from the microbiota in the surrounding aquatic environment (C). The redundancy analysis profiles show the effect of water physical and chemical indicators on the composition of water microbiota (D) and the impact of the R. cylindricus biological index on the intestinal microbiota (E). MFD, midgut filling degree; FFD, foregut filling degree; HFD, hindgut filling degree; BW, body weight; DS, developmental stage; ST, sampling time; SS, sampling site; WL, whole length; BL, body length; DO, dissolved oxygen; WT, water temperature; TDS, total dissolved solids. *, p < 0.05; **, p < 0.01; ***, p < 0.001.
Water 13 02697 g005
Figure 6. Changes in the UniFrac distances of the water microbiota (A) and Rhinogobio cylindricus gut microbiota (B) with geographical distance (km). The geographical distance represents the distance along the Yangtze River, not the straight-line distance. Geographic distances were converted into logarithm before the regression analysis.
Water 13 02697 g006
Publisher’s Note: MDPI stays neutral with regard to jurisdictional claims in published maps and institutional affiliations.

