
Evaluation on the Internal Public Space Quality in Affordable Housing Based on Multi-Source Data and IPA Analysis


1
Department of Urban Planning, School of Urban Design, Wuhan University, Wuhan 430072, China
2
Department of Graphics and Digital Technology, School of Urban Design, Wuhan University, Wuhan 430072, China
*
Author to whom correspondence should be addressed.
Land 2021, 10(10), 1000; https://0-doi-org.brum.beds.ac.uk/10.3390/land10101000
Submission received: 19 July 2021
/
Revised: 14 September 2021
/
Accepted: 17 September 2021
/
Published: 23 September 2021
(This article belongs to the Special Issue Reinvigorating Research on Housing Inequalities and Housing Price Mechanism Using Emerging Data and Technologies)
Abstract
:Much affordable housing has poor accessibility to external urban public space facilities because of its suburb location, which makes the residents’ daily life and social activities mainly depend on the internal public space of the community. Such affordable housing needs urgent upgrading of the internal public space based on the thorough understanding of the low-income residents’ demand ranking. The internal spaces’ transformation will significantly improve the living environment and the quality of residents’ life, and it also provides a way to promote social equity and sustainable urban development. By using the multi-source data and the two-step floating catchment area method, this paper selects typical affordable housing, which has poor accessibility to external urban public space, as our case study. After establishing the evaluation index system, IPA (Importance and Performance Analysis) is used to calculate the quadrant value of each index so as to clarify the upgrading urgency indexes from the residents’ demand for internal public space of affordable housing. Studies have shown that tables, chairs and pavilions, pedestrian systems, retail commercial facilities, medical and health facilities, and recreational space have the strongest urgency for upgrading; fitness facilities, exercise space, barrier-free access, guidance signs and parking lot design are the next most urgent indexes; Recreational facilities, entrances/exits of the residential area, green space in front of t residential buildings, and cultural facilities all have general urgency for upgrading.
1. Introduction
With the rapid progress of global urbanization, a large number of people from villages and towns flock to cities to work. However, due to limited income, high housing prices and soaring living expenses, it is difficult for them to settle down in big cities, eventually forming a unique rural-urban migration flow [1,2]. Moreover, the original low-income groups in the city are affected by this phenomenon, making it increasingly difficult for them to support themselves. Therefore, governments have started to build affordable housing, so that the low-income groups can live a higher-quality of life [3,4]. However, the early-built affordable housing generally has problems such insufficient provision of external public space, limited scale, insufficient types of internal public space, poor maintenance, and poor management. The lack of public space has a negative impact on residents’ health and interaction [5,6,7]. Therefore, affordable housing usually faces problems such as low sense of community identity, lack of vitality, dissatisfaction of residents with the living environment, and the absence of cultural and humanistic ambience [8]. Therefore, in order to improve the social equity and justice of affordable housing residents’ living space, strengthening the quality of public space for affordable housing residents has become an important means of affordable housing renewal and an important research goal of the planning profession.
Most of the existing studies on internal public space of affordable housing can be divided into two types. One is using the satellite images of recognition technology to distinguish the structure, shape and function of existing internal public space so the spatial characteristics and potential can be analyzed and improved by green space, traffic entrances and exits, and public service facilities [9,10,11,12]. Another is based on the evaluation of the public space use [13,14]. A large number of studies have used satisfaction evaluation or post-use evaluation of environment (POE) to build a public space evaluation index system for livable communities from different perspectives [15,16]. These studies collected the residents’ satisfaction scores on all indicators through field research, and finally interpreted the scores of different elements to determine the needs for upgrading public spaces [17,18].
Some of the studies have taken the inter-generational relationship of the residents into account and pointed out that the upgrading of internal public space should focus on the actual usage needs and activity characteristics of different user groups (elderly, young adults and children) [19,20], with particular attention to the improvement of pedestrian environments, recreational and leisure or fitness and sports facilities and public space on the open floors of buildings [21,22,23,24]. Some studies proposed to eliminate the mixed affordable housing’s spatial boundaries to avoid social space fragmentation and focus on the spatial design to promote equity and openness as well as reflect group self-esteem in order to enhance the sense of community identity of affordable housing residents [25,26,27].
However, both satisfaction and POE evaluations only have a single dimension. Because of the actual construction status, the corresponding evaluation differences are obtained, while the actual needs of residents for these spatial index elements are hidden.
In recent years, IPA analysis has been used in the research of public space in affordable housing by some scholars. Compared with the traditional satisfaction studies, IPA analysis is able to integrate importance and satisfaction in a two-dimensional matrix and compare the mean value of satisfaction and importance [28,29]. Moreover, it can identify the differences between residents’ expectation and actual construction of internal public space and visualize the priority of each index element for improvement and clarify the direction and the urgency of subsequent upgrading [30,31]. Thus, it can establish the ultimate goal of efficiently improving the quality of public space in affordable housing by means of “micro-upgrading” [32,33,34].
Therefore, the present studies employed multi-source data, the two-step floating catchment area method and heat maps in the selection stage of typical affordable housing areas. After several rounds of screening, the more frequently used internal public spaces of the affordable housing were taken as the typical research objects. Based on the construction of the public space service quality index system in the residential area, we analyzed the average satisfaction-importance threshold of each secondary index element by IPA (Importance-Performance analysis) to identify the improvement needs and priorities of this type of affordable housing internal public space. Finally, based on the evaluation results, we propose management suggestions and strategies to improve the quality of public space service and fine-tune the internal public space of affordable housing, so as to provide a basis and support in the new round of affordable housing planning and the living environment renewal, and promote the rational planning of internal public space of affordable housing. In this way, the first step of “micro-upgrading” of public spaces in built affordable housing can be realized.
2. Materials and Methods
2.1. Research Scheme Design and Data Collection
2.1.1. Research Scheme Design
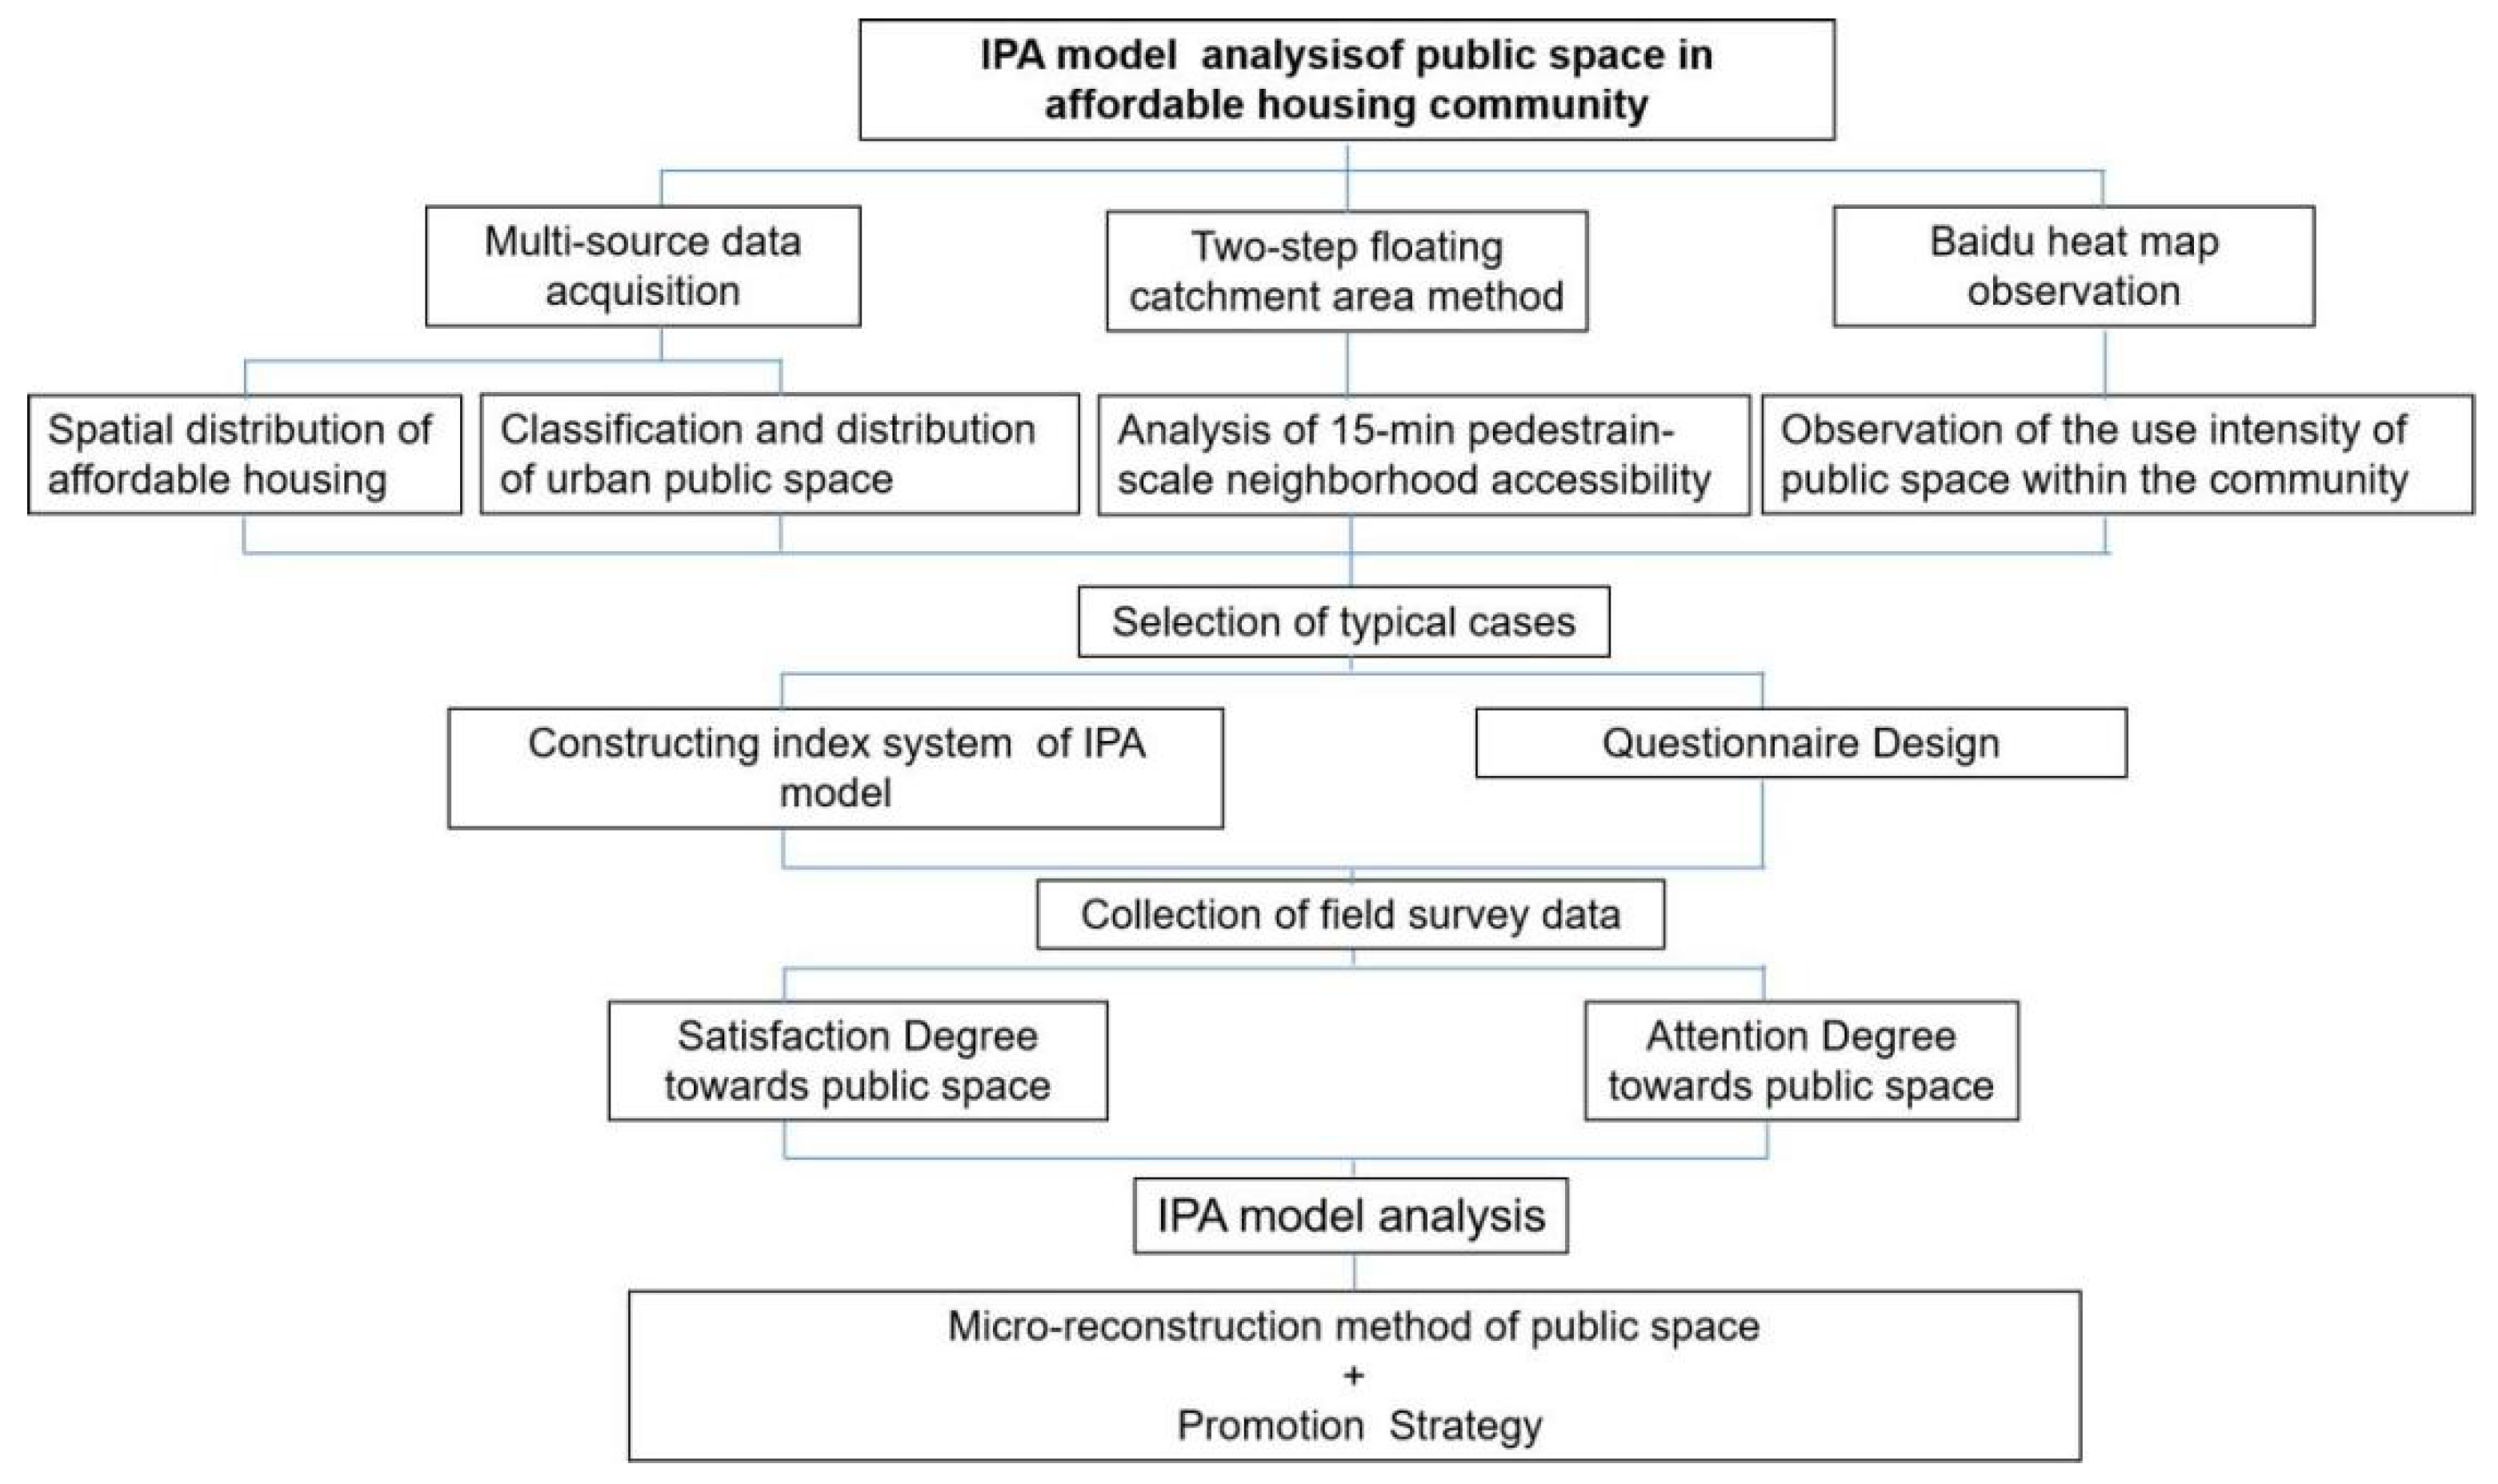
This paper evaluates the satisfaction-importance degree of affordable housing residents on the use of internal public space in three steps.
First of all, we selected typical residential areas from all built affordable housing in Wuhan for the survey. The selection principle is that the dependence and the use frequency of the internal public space on weekdays and non-weekdays are both high, which make the field survey results of the internal public space evaluation more reliable. Then, we set the index system and questionnaire of the internal public space evaluation based on the IPA analysis. The questionnaire should be designed to cover all indexes of the importance-satisfaction. Finally, we analyzed statistical results of the questionnaire through a field survey (See Figure 1).
2.1.2. Data Collection and Graphing
The data in this paper mainly includes two parts. The first part is the multi-source data collection, including the spatial distribution of general residential areas and affordable housing built by 2020, as well as the POI data of public green spaces (as parks, street squares, large commercial places, etc.) in Wuhan. POI (point of interest) is a point data with geographical space and attribute information, which can be extracted from the open internet access as many element types, such as restaurants, stores, traffic stations, educational facilities, banks, residential areas, and pharmacies etc. POI data has many advantages compared to traditional data with larger scale, higher accuracy, better classification, and faster update.
The second part is the questionnaire data collection, including personal attributes, the degree of importance-satisfaction of all indexes, etc. (See Table 1).
2.2. Analysis Preparation
2.2.1. Research Case Selection
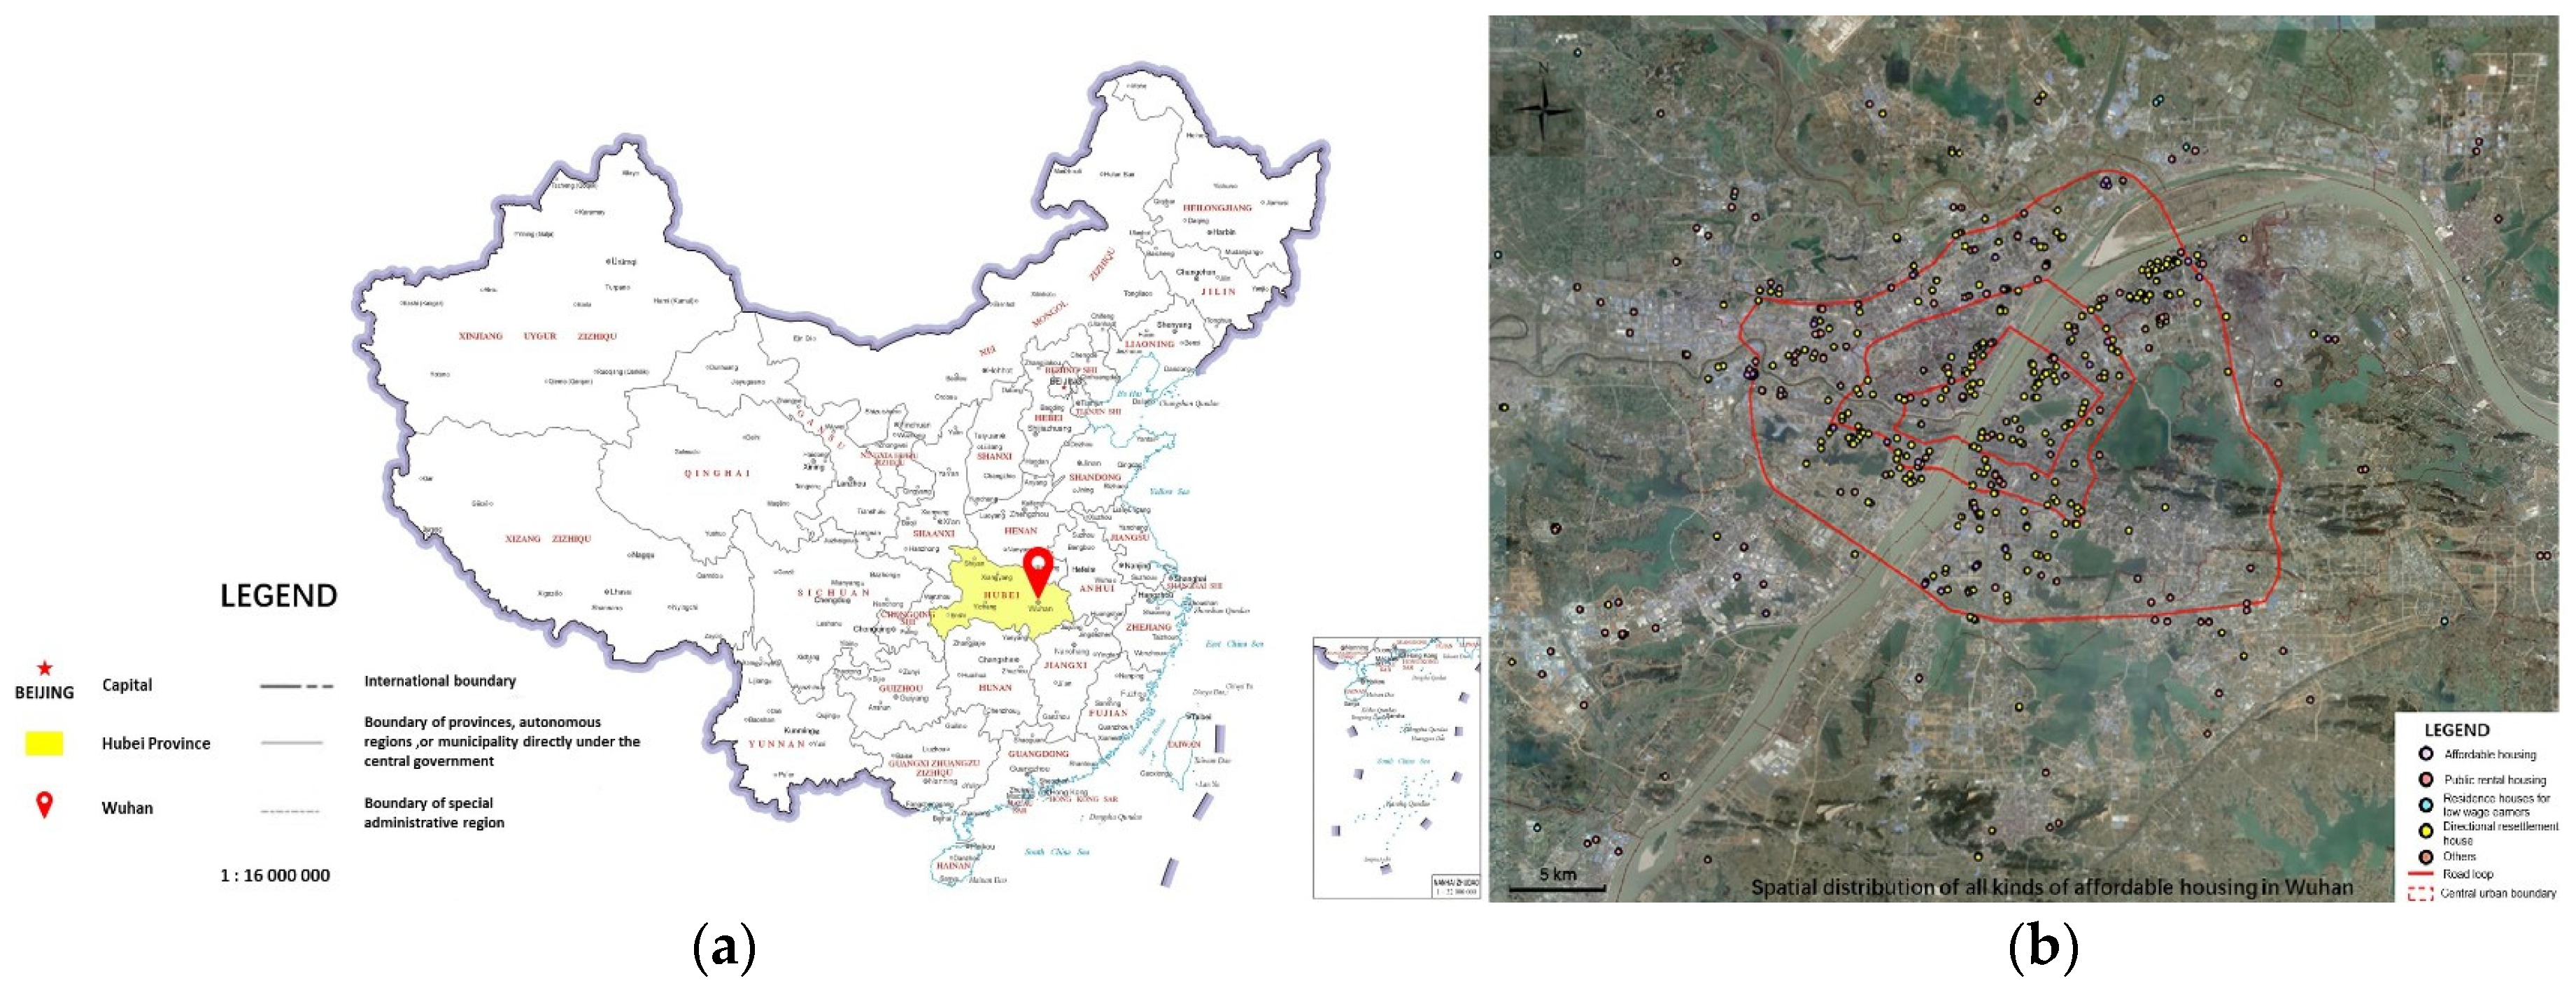
Wuhan, the capital of Hubei Province, is located in Central China (Figure 2a). From 2011 to 2020, 493 affordable communities and 454,419 houses have been built in Wuhan (Figure 2b). They are mainly concentrated between the first ring road and the third ring road in spatial distribution. In terms of housing construction scale, there are 9% of all affordable housing within the first ring road, 15% between the first ring road and the second ring road, 47% between the second ring road and the third ring road, and 29% outside the third ring road. In this paper, we take all types of affordable housing in Wuhan as the research sample.
By the end of 2019, there have been 764 green public spaces in main urban area of Wuhan. According to the “Classification standard of urban green space (CJJ/T85-2017)”, there are 109 urban comprehensive parks which cover an area of 4046.8 hectares, accounting for 77% of total space. There are 291 community-level park green spaces which cover an area of 1077.85 hectares, accounting for 20%, and there are 364 other public green spaces which cover an area of 137 hectares, accounting for 3% (see Table 2). The result proves that the area of large-scale comprehensive parks in Wuhan accounts for a large proportion, while other small public green spaces have the largest numbers, but the area proportion is the least, and these are geometrically different from the scale of the comprehensive parks. Therefore, Wuhan still needs to focus on the planning and construction of other small public green spaces.
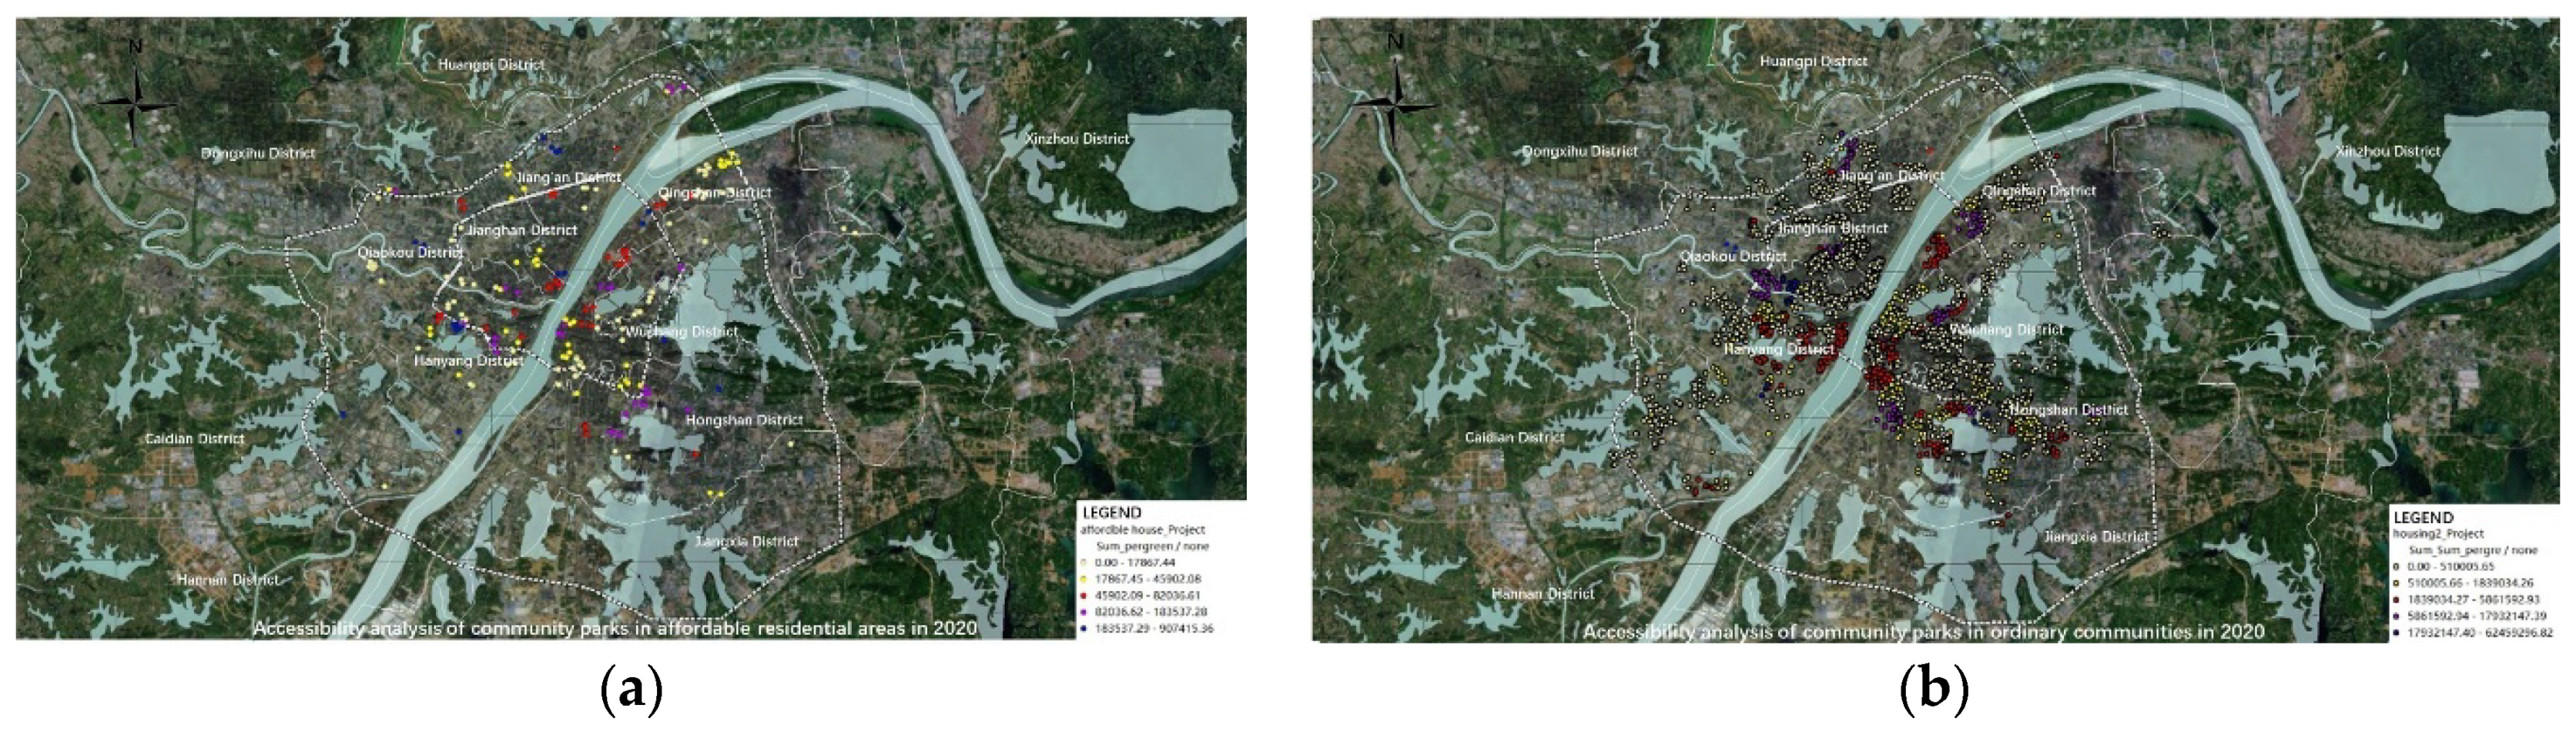
In this paper, all urban public green spaces outside the residential community are defined as external public space, and all the green and activity spaces inside the affordable housing are defined as internal public space. The dependence of affordable housing residents on the use of internal public space is the key to the selection of typical residential areas. Therefore, the 2SFCA (Two-step floating catchment area method) was used, and the accessibility service standard of urban public space was constructed by referring to the 15-min pedestrian-scale neighborhood [35]. Through 2SFCA, the results of the accessibility of different scale urban green public space in affordable residential areas and general residential areas are as follows (see Figure 3, Figure 4 and Figure 5), (a) is the results of the accessibility between external public space and affordable housing, (b) is the results of the accessibility between external public space and general housing. The legend ranking value indicates the external public space scale obtained by each residential area (square meters per community).
We selected 30 affordable housing units with significantly lower quantitative levels of spatial accessibility in the list and collected heat maps of 2-h interval nodes on weekdays and non-weekdays. Then we compared the frequency and intensity of internal public space use in each affordable housing unit during the same period of time. After excluding the influence of the surrounding environment (e.g., clinics, primary and secondary schools), 10 typical affordable housing areas were targeted for the field questionnaire survey.
Relatively speaking, whether it is an affordable residential area or general residential area, the accessibility of urban comprehensive parks has superior performance, which is better than community-level parks and other public green spaces.
The accessibility of each external public space classification of affordable housing is much less than the general residential area. Most of affordable housings’ accessibility value is in the low-medium range, while most of the general residential areas’ accessibility value is in the high range. As can be seen, the large-scaled and high-density affordable housings that are gathered in the urban suburbs have lower accessibility value and higher dependence on the internal public space.
2.2.2. Index System Construction
According to the construction characteristics of affordable housing and the characteristics of the residents, the criteria layer of the internal public space is defined as public activity space and public service facilities. At the same time, the existing evaluation indexes, regulations and literature at home and abroad were referenced to further determine the primary indicators. The six primary indicators of the service evaluation index system of internal public space were initially summarized, and 20 secondary indicators were summarized by combining the actual design and usage status of public spaces in different types of completed affordable housing at different stages, as shown in Table 3.
2.2.3. Questionnaire Design and Statistics
The questionnaire for evaluating the use of internal public space in this study consists of two parts. The first part is the basic demographic information of the sample, covering age, gender, marital status, education, income, etc. The second part is the satisfaction-importance evaluation of the internal public space. In the form of a “five-point Likert scale”, the satisfaction and importance of 20 secondary indicators in the index system are assigned by level, where 5 indicates very satisfied/very important, 4 indicates satisfied/important, 3 indicates generally satisfied/generally important, 2 indicates dissatisfied/unimportant, and 1 indicates very unsatisfactory/very unimportant.
For the study, 585 questionnaires were distributed, and 491 valid questionnaires were collected, with a validity rate of 84%. The statistical analysis of the research data was conducted by SPSS 26, including reliability analysis, descriptive analysis and IPA analysis.
Through the survey on the sample residents’ gender, age, marriage, education level and monthly income, the statistical results of the effective questionnaire are shown in Table 4.
Among the sample respondents, 58% were male, 35% were 30–60 years old, and 44% were 60–80 years old. The proportion of in-service respondents was less than 25%, and the proportion of retired and unemployed residents was about 75%. The income of most affordable housing residents is between 1000 yuan and 3000 yuan, and the proportion of people with junior and senior high school education is more than 50%. In comparing the results of the questionnaire with the per capita data of Hubei Province in 2020, which includes monthly income per capita (2323 yuan/person), education level (76.48% of the population with primary school education or above), employment level (66.88% of the employment rate) and aging rate (20.42% of the population is over 60 years old), we can conclude that people in affordable housing have low income levels, low education levels, are largely unemployed, are of advanced age, and have high demand for daily activities in public spaces within the community.
2.3. IPA Analysis Model
The IPA analysis model evaluates the sample population’s experience of a specific space or event by comparing the expectation value before experience (importance I) with the actual perception after experience (satisfaction P), so as to clarify the difference between the experience expectation and actual perception (P-I) of the space or event in each index element. The specific formula for comprehensive satisfaction evaluations of internal public space is as follows (see Formula (1)):
In Formula (1), Ii is the number of effective comments of single element divides the total number of effective comments; Pi is the mean value of each element satisfaction, which can be calculated by the sum value of single element satisfaction divides the effective comment of single element satisfaction, and n is the total number of evaluation elements.
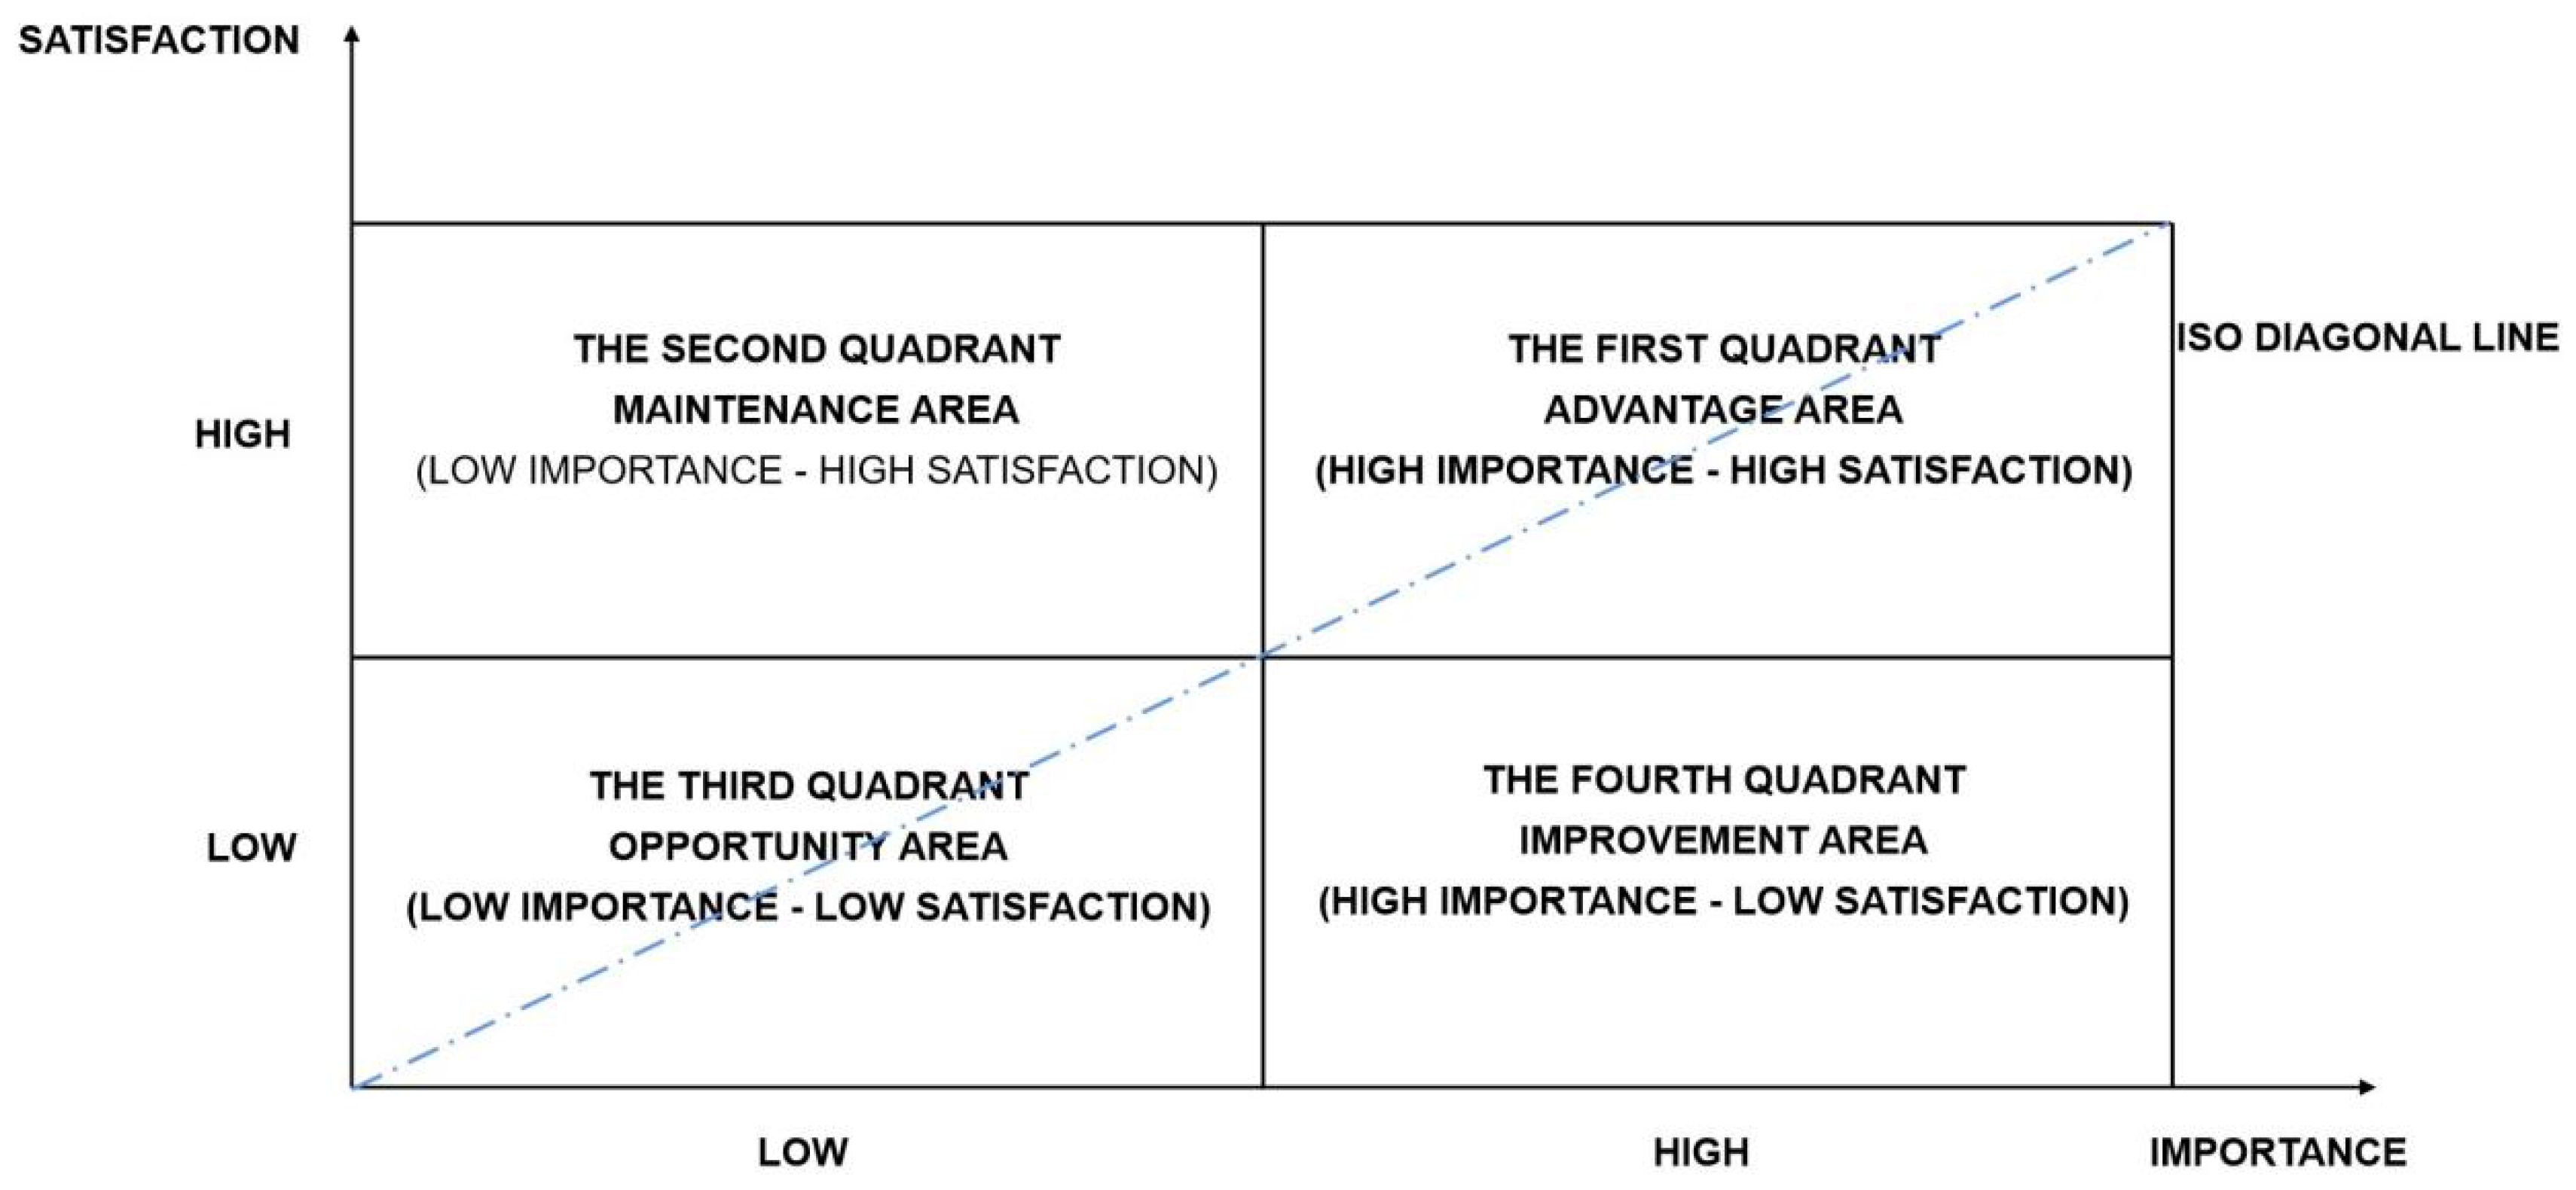
Among them, the major index elements can be matched to the two-dimensional matrix quadrant according to the IPA analysis (see Figure 6). The four quadrant diagrams have different degrees of urgency in the transformation of the index elements.
The first quadrant is the dominant zone, where the satisfaction and importance of the index elements are high. The sample population perceives these elements as important and is satisfied with them, and these indexes need to be maintained on an ongoing basis. Funding or construction efforts should be maintained so that the sample population can be continuously attracted to these elements.
The elements in the second quadrant are the maintenance zone, where the index elements have higher satisfaction but lower importance. The sample population does not pay enough attention to these elements, but they are relatively satisfied with them. Therefore, these elements are the ones that can be appropriately adjusted in resource allocation, and the attention and productive resources should be moderately allocated to index elements in other zones.
The elements in the third quadrant are the opportunity zone, and the indexes in this area are characterized by low satisfaction and low importance. These elements are considered by the sample population to be less important in themselves and have limited satisfaction. Therefore, they have a negative impact on the overall goal and can be classified as secondary upgrading priorities.
The elements in the fourth quadrant are the improvement zone, in which the index elements are of low satisfaction and high importance. The sample population thinks that these elements are very important to the use experience, but they are very dissatisfied with the existing presentation form of the elements, which has a great impact on the satisfaction of the overall goal. Therefore, managers need to pay great attention to these indexes, focus on improving the environmental disadvantages caused by them, make up the deficiencies, and guide the comprehensive and coordinated development of the target environment.
In the process of interpretation, many studies incorporated Carnot’s three-factor theory into the four quadrants of IPA evaluation findings in order to change the causal correlation between satisfaction and importance [36]. Some studies used partial correlation coefficients to analyze the correlation between each influence factor in the IPA evaluation index system and overall satisfaction. In order to reflect the importance evaluation conclusion of each variable more realistically, objectively and accurately [37], Esmailpour J combined exploratory factor analysis (EFA), cluster analysis (CA) and IPA analysis to improve the validity and reliability of the analysis conclusion [38]. Abalo et al. added ISO diagonals to the IPA two-dimensional matrix and found that all points on the diagonals had the same priority for improvement [39]. This interpretation method further enhanced the performance of the traditional quadrant method.
Few studies have applied IPA analysis to public spaces [40]. Compared with the traditional satisfaction studies, IPA is able to integrate importance and satisfaction in a two-dimensional matrix and compare the mean value of satisfaction and importance [41,42,43]. Moreover, it can identify the difference between residents’ expectation and actual construction of public space in a residential area [44,45,46] and visualize the priority of each index element for improvement and clarify the direction of subsequent upgrading and the urgency of upgrading works [47,48]. Thus, it can establish the ultimate goal of efficiently improving the quality of public space in a residential area by means of “micro-upgrading”.
3. Results
3.1. Reliability Determination of the Questionnaire on Public Spaces in Affordable Housing
In order to ensure the reliability and consistency of the questionnaire database, the reliability coefficient (α) of the scale was tested by using SPSS 26 for the satisfaction and importance of each secondary indicator in the index system. When α is greater than 0.9, it indicates that the scale has high reliability. When α is greater than 0.8 but less than 0.9, it indicates that the reliability of the scale is acceptable. When α is greater than 0.7 but less than 0.8, it indicates that the reliability of the scale needs to be adjusted and some factors need to be corrected. When α is less than 0.7, it indicates that the reliability of the scale is low and some factors need to be discarded.
The internal consistency of the 20 secondary index factors was tested, and the α value of the overall questionnaire scale was 0.926, indicating that this scale has high reliability. The sig value of Bartlett’s sphericity test was significant, indicating that the validity test was good and the data had high reliability (see Table 5).
3.2. IPA-Based Quality Evaluation of Public Space within Affordable Housing
Table 6 shows the importance and satisfaction means, mean differences and paired sample tests (T) of the 20 indicator elements of internal public space for typical affordable housing residents.
In terms of the ranking of the mean value of importance, elements above the mean value of 4.0 include public green space in the residential area, activity centers at the residential level, gathering space at the neighborhood level, fitness facilities, retail and commercial facilities and medical and health facilities, indicating that these facilities are more important in residents’ perceptions. More attention should be paid to the layout and scale of these spaces at the planning level. In terms of the mean value of satisfaction, only five indexes have a mean value of more than 3.0, indicating that the overall satisfaction of affordable housing residents with public spaces in their neighborhood’s is low. The top five index elements include public green space in residential areas, green space in front of houses, residential-level activity centers, recreational facilities and retail commercial facilities. The last five elements included barrier-free access, tables, chairs and pavilions, parking spaces, pedestrian systems and recreational space. From the analysis of the difference values of indexes (P-I), the difference values of all 20 indexes are negative, indicating that the satisfaction of residents with public space is significantly lower than the expected value, and there is much room for improvement.
In many IPA evaluations and analyses of service performance, there are either scale-centered or data-centered interpretations. The relative causality between the importance and satisfaction of selected elements of service quality of public space in residential areas should be avoided because it may lead to the “ceiling effect” of the scale-centered interpretation, resulting in the dispersion of the allocation of scarce resources or the disorder of fine-tuning and rectifying the space. In this paper, we adopt the “data-centered” and “diagonal” approaches to interpret the results of IPA analysis on the quality of public space services in affordable housing areas.
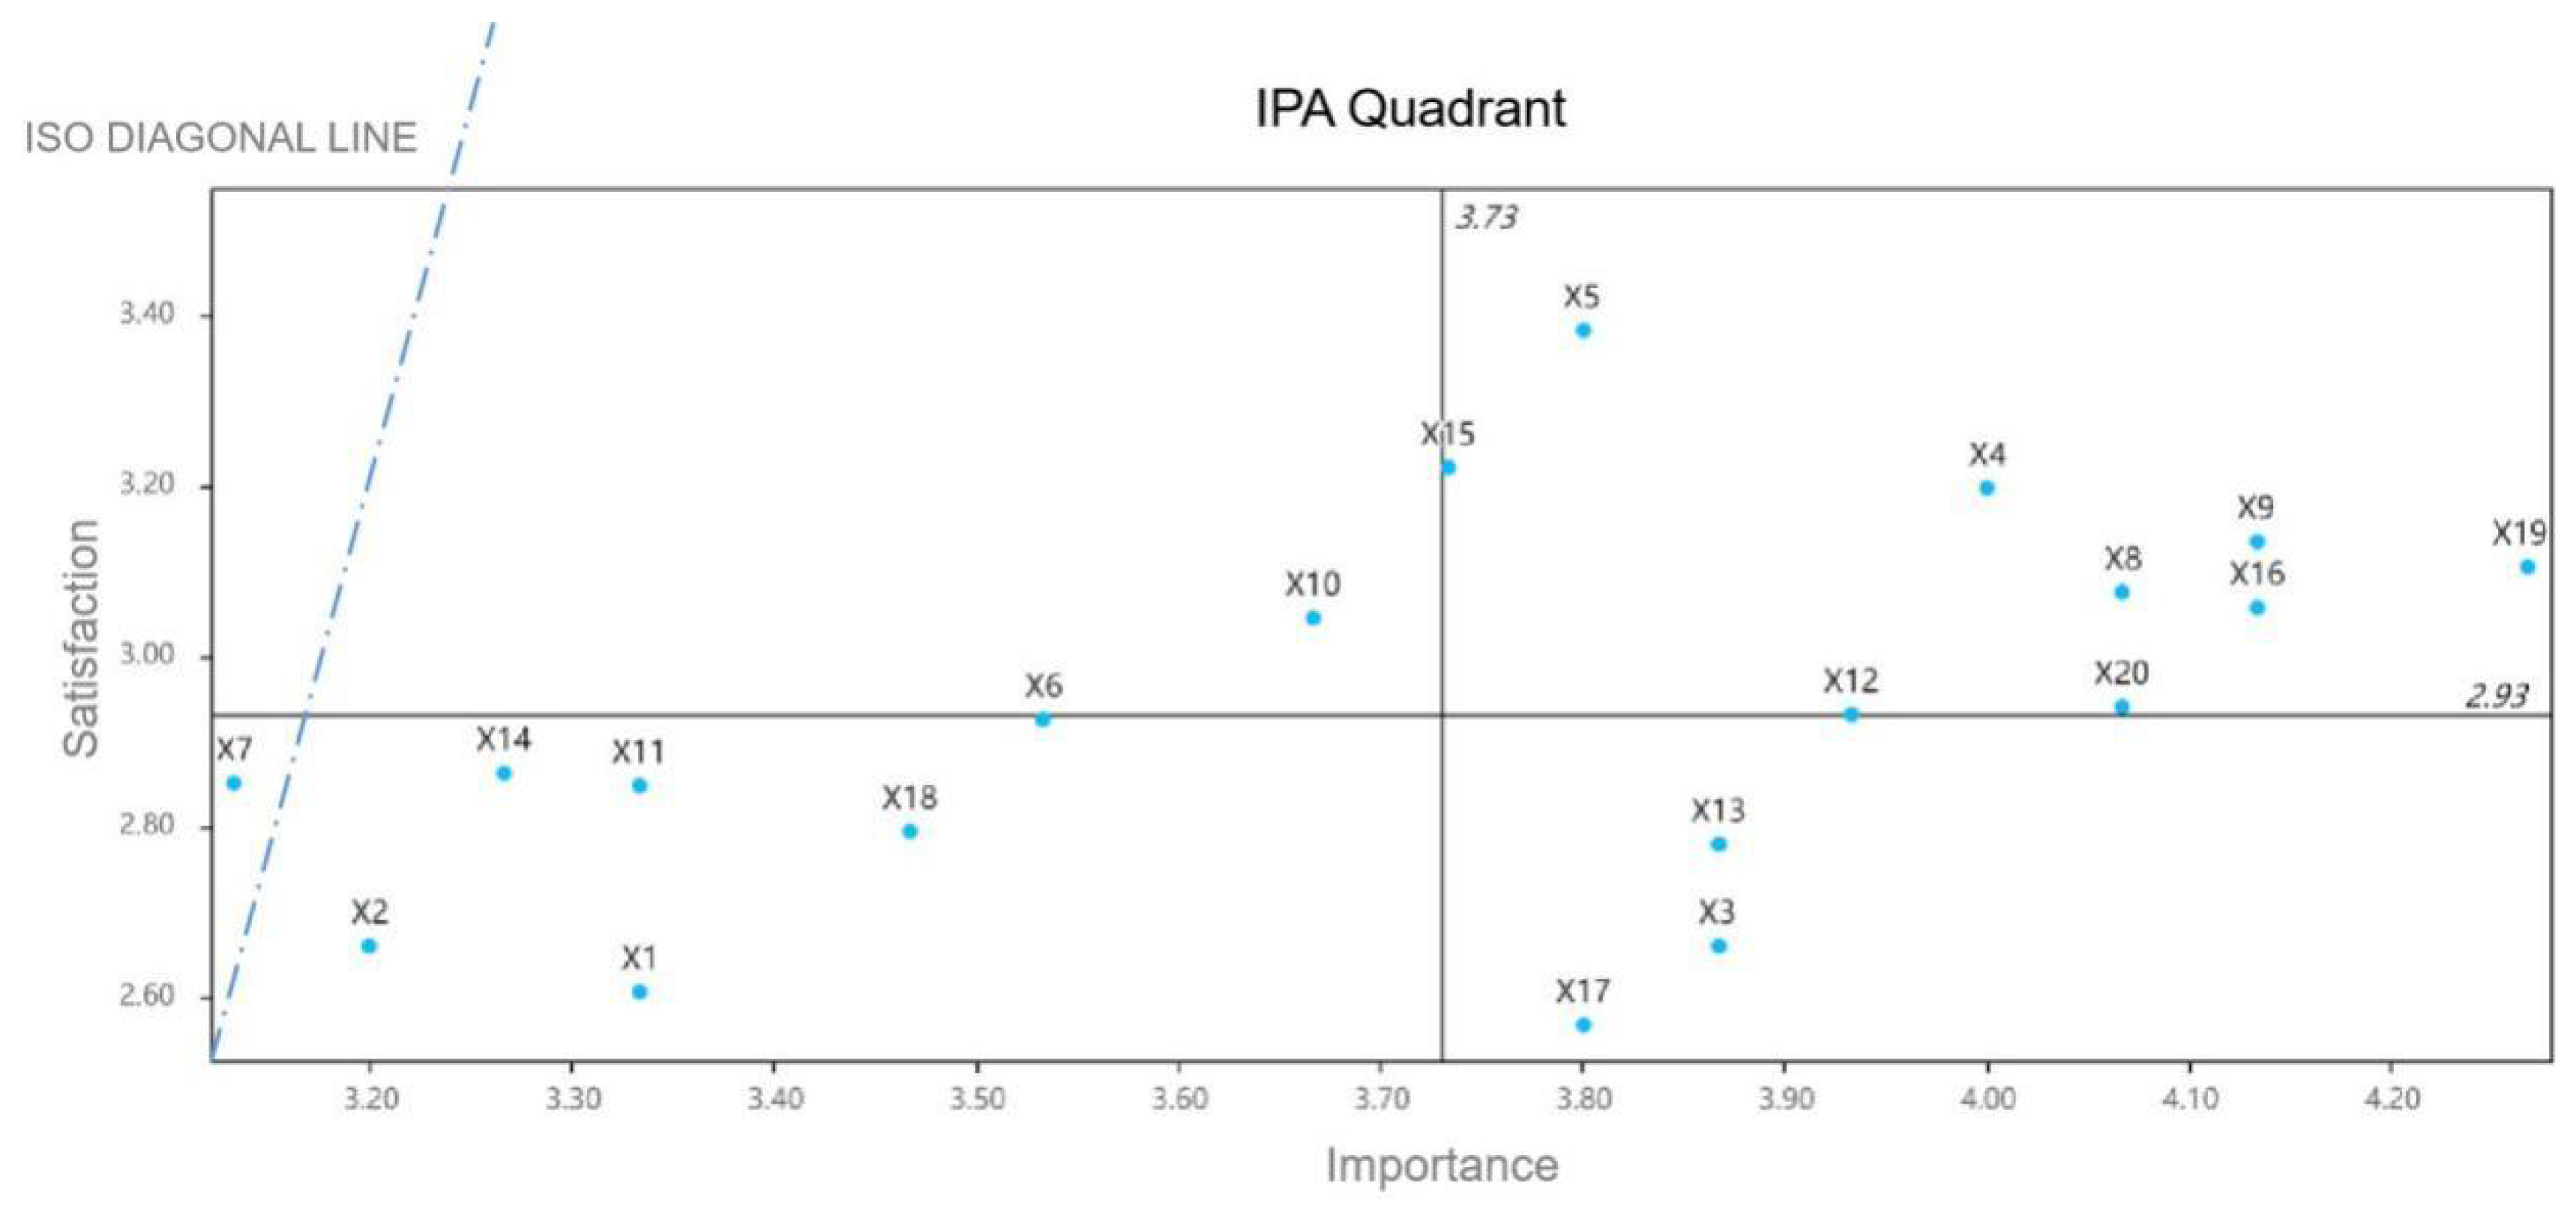
In this study, the 20 indexes were coded into dimensions X1–X20, and the IPA analysis matrix was constructed with the overall mean values of importance and satisfaction (3.73, 2.93) as the coordinate origin, with importance as the X-axis and satisfaction as the Y-axis. Eventually, the P/I values of the 20 indexes were located in four quadrants (see Figure 7).
The first quadrant is the double-high dominance zone, including green space in front of the residential building, neighborhood public green space, neighborhood-level activity centers, neighborhood-level gathering spaces, fitness facilities, retail and commercial facilities, health facilities, and recreational facilities. Among them, the satisfaction level of green space in front of the residential building is the highest, and the difference with the importance level is the lowest. The satisfaction level of medical and health facilities and retail and commercial facilities is moderately high, but the difference with the importance level is the largest. It shows that the affordable housing residents are satisfied with the existing green space in front of the residential building and have low willingness to upgrade it. They are less satisfied with the existing medical and health facilities and more willing to upgrade them, and more satisfied with the existing retail and commercial facilities, but still more willing to upgrade them. It also reflects that affordable housing residents have a high demand for public services and public spaces that are necessary for their daily life at a high level within the residential area. On the other hand, it is noteworthy that the mean value of satisfaction of indexes in the first quadrant is significantly lower than the mean value of importance, and there is still much room for improvement. In particular, the satisfaction level of exercise space and medical and health facilities is close to the mean value of 2.93, which may slip easily into the dissatisfaction zone.
The second quadrant is the area of low importance and high satisfaction, including open space, and the ratio of soft and hard space. It indicates that affordable housing residents do not care much about these two indicators or believe that the existing size and quantity of open space and the ratio of hard and soft space can meet the needs of daily life activities, and they only need to be enhanced on the basis of maintaining the status quo.
The third quadrant is a double-low vulnerable area with low importance and low satisfaction, including barrier-free access, a parking area, diversity of plant species, cultural facilities, and guidance signs. Indexes in this region account for 25% of all evaluation indexes, indicating that the residents’ expectations of these elements are not high, but the satisfaction level is still significantly different from their expectations, confirming that the spaces represented by these indexes still need to be improved. The difference between the importance and satisfaction of the diversity of plant species, cultural facilities, and entrances and exits to residential areas is small, indicating that these elements are less urgent than guidance signs, barrier-free access, and parking lots.
The fourth quadrant is the area of high importance and low satisfaction, including pedestrian systems, recreational space and tables, chairs and pavilions and other indicators. The difference between the importance and satisfaction of tables, chairs and pavilions is very high, reflecting the strong demand of affordable housing residents for stay facilities in the residential area. In addition, there is a great lack of such spaces in the current internal public space, or the quality of construction and maintenance is very poor. The importance of pedestrian systems and recreational space is similar, but there is a large difference in satisfaction. In view of the mixed pedestrian and vehicular traffic in affordable housing areas, and the lack of parking space, motor vehicles often occupy non-motorized lanes and pedestrian walkways, causing significant safety risks to residents, especially the elderly who have difficulty walking. Therefore, although indexes in the fourth quadrant account for only 15% of the total, the need for space improvement is extremely urgent. We should focus on upgrading according to the needs of residents and improve the satisfaction level of space usage as soon as possible.
The diagonal method was used to obtain the mean-differentiated ranking (the mean value of importance minus the mean value of performance, I-P) of the indexes for upgrading (see Table 7). From the ranking, it can be seen that tables, chairs and pavilions, pedestrian systems, retail commercial facilities, medical and health facilities and recreational space have the strongest urgency for upgrading and are ranked in the first echelon. Fitness facilities, exercise space, neighborhood-level, residential-level public space and residential public green space are the next most urgent, in the second echelon. Barrier-free access, guidance signs, open space, soft and hard space ratio, and parking lot design are in the third echelon. The final echelon is playground facilities, entrance/exit of the residential area, green space in front of the residential building, cultural facilities and diversity of plant species.
4. Discussion
In the previous section, we analyzed the main focus of public space upgrading in affordable housing through IPA analysis.
Based on the analysis, the following conclusions can be obtained:
The most upgradingurgent indexes of internal public space include tables, chairs and pavilions, pedestrian systems, and commercial service facilities, etc. Most of them are used to ensure residents’ daily necessary behaviour and social associations. Many studies have pointed out that the affordable housing residents have poor mobility and a faster aging rate than that of general residential areas in recent years, the demand for socially used internal public space with stay facilities, such as tables, chairs and pavilions is high [49,50]. The existing facilities are either without design or in poor management and maintenance; the road system of affordable housing is mostly people and vehicle mixed, and the pedestrian space is fragmented. The commercial service facilities and medical and health services are in serious lack which leads to the situation of “minor diseases however difficult to treat”. Meanwhile, some micro-upgrading studies have the similar most urgent upgrading indexes results with this pape [51,52,53].
The higher upgrading-urgent indexes of internal public space include barrier-free access, guidance sign and parking lots, etc. Many studies have shown that barrier-free access and parking lots are not only the space elements that should be upgrading urgently, but also the crucial elements to ensure residents’ personal safety which are seriously lacking in large-scale affordable housing built in earlier years [54,55]. However, in this survey, most of the residents who participated believe that the above ground parking lot can basically meet the present needs for parking (on account of the small number of residents who have cars). Relatively speaking, the elderly people in the sample consider that the pedestrian should be upgraded by building new pedestrian system as soon as possible for the serious car occupation. The middle-aged people, on the other hand, do not think that occupied parking is too much of a problem. Therefore, they do not have a strong demand for parking lot upgrading. At the same time, most of the residents who participated in the study are capable of independent mobility or have not yet reached the point where they have a need for assistive devices such as wheelchairs. Therefore, they have limited demand for barrier-free access. Moreover, as most of the people in the survey samples have lived in the residential area for more than five years, the guidance sign is also not an urgent problem for them.
The ordinary upgrading-urgent indexes of internal public space include playground and cultural facilities for children, which indicates that the proportion of children in affordable housing is limited and that the general education level of the residents is low. Many studies on the satisfaction of low-income residential areas based on POE have demonstrated this point, which the public education service facilities in and around low-income residential areas are extremely short, and the affordable housing residents are lack of basic learning initiative, therefore the regional “depression” are easily to happen in those areas. In addition, this forms inter-generational continuity among the low-income group [56,57]. Therefore, many scholars believe that even if cultural facilities are not considered to be in need of urgent upgrading by users of low-income residential areas, they should still be taken into account in the upgrading process, and more efforts should be made to improve their provision [58].
Therefore, this study puts forward the following suggestions on the basis of the previous research:
- (1)
- Advocating and promoting the construction of small-scale mixed housing and all-age friendly communities
To achieve sustainable maintenance of affordable housing, we should avoid the construction of large-scale suburban affordable housing and enhance the access to urban living resources for affordable housing residents. By eliminating the sense of isolation of affordable housing, we can improve the psychological health of residents, avoid confining all activities, and reduce the pressure on the internal public spaces. At the same time, we should pay attention to the age ratio of the residents and promote the construction of an all-age friendly community as well as the openness of public space and the inter-generational mutual assistance space in future affordable housing, as well as maximizing the efficient use of the internal public space, so as to realize the inter-generational circulation of affordable housing.
- (2)
- Focusing on the functional mix and quality of internal public spaces
The upgrading of public space in the built-up stock of affordable housing areas should not only focus on the scale but on the mix of functions and quality improvement according to the requirements. On the basis of understanding the actual needs of residential residents, the service content and service focus of the public space in the residential area should be redefined, such as the needs of the aging group for resting and gathering, and the needs of pedestrian and vehicular traffic separation. Moreover, complex functions should be displayed in various public spaces, such as setting up cultural facilities in pavilions, tables and chairs in small open spaces or small amusement facilities. Only by scientifically strengthening the spatial function mix can we enhance the use efficiency of public space and thus improve the maintenance level of public space and service facilities.
- (3)
- Strengthening the management of affordable housing, and attempting to change the norms of access for residents of affordable housing
In addition to improving the physical and internal public space of affordable housing, it is also necessary to strengthen community and household management. Certain practices should be avoided, such as social vehicles from non affordable housing residents occupying the roads for long periods of time, the piling up of miscellaneous objects in the hallways of residential buildings, and the vandalizing or damaging of facilities in the public space for no reason. At the same time, we should try to change the threshold of affordable housing residents by the way of access by work to fully utilize the advantages of affordable housing. For families whose members are willing to clean or manage public areas in the community for a long time, families whose members have certain qualifications or work experience, and families whose members can serve the community for more than 20 h per week, they will be given preferential access to affordable housing. By changing the “income-based” norms of affordable housing allocation, new culture and vitality should be introduced into the management and maintenance of public space in affordable housing communities, thus realizing a sustainable cycle of affordable housing renewal.
5. Conclusions
This study uses IPA analysis to evaluate the quality of public space inside affordable housing so as to identify the demand ranking for the upgrading of space among affordable housing communities. Therefore, it can be used as a reference for the government to improve the quality of the living environment of affordable housing communities during the implementation phase of the stock plan.
In response to the limitations of this study, future research on the quality improvement of public space in affordable housing can be carried out from two aspects. On one hand, the supply and lack of public space of general communities and affordable housing in different regions should be analyzed based on the specific population and attributes of each urban community, and supplementary provisions can be made by adding external space. On the other hand, the public space upgrading inside affordable housing should give priority to residents behavioural characteristics of their everyday lives. We should continue to explore the daily living patterns, communication methods and physical exercise practices of affordable housing residents and enhance the internal public spaces related to them.
Author Contributions
Conceptualization, J.Z. and L.L.; methodology, J.Z. and L.L.; investigation, J.Z.; software, J.Z. and Y.Y. (Yan Yu); validation, Y.Y. (Yang Yu) and L.L.; data curation, J.Z.; writing—original draft preparation, J.Z.; writing—review and editing, J.Z., L.L. and Z.P.; supervision, Z.P., L.L. and Y.Y. (Yang Yu). All authors have read and agreed to the published version of the manuscript.
Funding
This research was funded by National Natural Science Foundation Youth Fund of China (No. 51708425); National Natural Science Foundation of China (No. 52078390); National Natural Science Foundation of China (No. 51978535).
Informed Consent Statement
Informed consent was obtained from all subjects involved in the study.
Data Availability Statement
Data sharing not applicable.
Conflicts of Interest
The authors declare no conflict of interest.
References
- Satterthwaite, D. Small Urban Centres and Large Villages: The Habitat for Much of the World’s Low-Income Population; Routledge: London, UK; Routledge: New York, NY, USA, 2018; ISBN 9781315800486. [Google Scholar]
- Hernández, D.; Jiang, Y.; Carrión, D.; Phillips, D.; Aratani, Y. Housing hardship and energy insecurity among native-born and immigrant low-income families with children in the United States. J. Child. Poverty 2016, 22, 77–92. [Google Scholar] [CrossRef] [PubMed]
- Sengupta, U.; Salama, A.M. Editorial- Changing paradigms in Affordable Housing, Quality and Lifestyle Theories (with A Salama). Open House Int. 2011, 36, 4–6. [Google Scholar]
- El Menshawy, A.; Shafik, S.; Khedr, F. Affordable Housing as a Method for Informal Settlements Sustainable Upgrading. Procedia-Soc. Behav. Sci 2016, 223, 126–133. [Google Scholar] [CrossRef] [Green Version]
- Paris, D.E.; Kangari, R. Multifamily Affordable Housing: Residential Satisfaction. J. Perform. Constr. Facil. 2005, 19, 138–145. [Google Scholar] [CrossRef]
- Reid, C.K. Rethinking “Opportunity” in the Siting of Affordable Housing in California: Resident Perspectives on the Low-Income Housing Tax Credit. Hous. Policy Debate 2019, 29, 645–669. [Google Scholar] [CrossRef]
- Wei, L.; Li, Z. Housing Dilemma of Urban Poor in China and Its Problem-solving Pattern. Urban Plan. Forum 2006, 2, 53–58. [Google Scholar] [CrossRef]
- Abdul-Chani, M.M.; Moreno, C.P.; Reeder, J.A.; Zuckerman, K.E.; Lindly, O.J. Perceived community disability stigma in multicultural, low-income populations: Measure development and validation. Res. Dev. Disabil. 2021, 115, 103997. [Google Scholar] [CrossRef]
- Agunbiade, M.; Rajabifard, A.; Bennett, R. Modes of housing production in developing countries: The contemporary role of land, labour, and capital in Lagos, Nigeria. J. Hous. Built Environ. 2013, 28, 363–379. [Google Scholar] [CrossRef]
- Austin, P.M.; Gurran, N.; Whitehead, C.M.E. Planning and affordable housing in Australia, New Zealand and England: Common culture; different mechanisms. J. Hous. Built Environ. 2014, 29, 455–472. [Google Scholar] [CrossRef]
- Welch, T.F. Equity in transport: The distribution of transit access and connectivity among affordable housing units. Transp. Policy 2013, 30, 283–293. [Google Scholar] [CrossRef]
- Mueller, E.J.; Tighe, J.R. Making the Case for Affordable Housing: Connecting Housing with Health and Education Outcomes. J. Plan. Lit. 2007, 21, 371–385. [Google Scholar] [CrossRef]
- Standards, I. Construction and the Use of Design Evaluation and Diagnostic System of Public Space: A Study on Construction of Quality Chart Evaluation/Diagnostic System (4). Bull. Jpn. Soc. Sci. Des. 2010, 57, 25–34. [Google Scholar] [CrossRef]
- Mehta, V. Evaluating Public Space. J. Urban Des. 2014, 19, 53–88. [Google Scholar] [CrossRef]
- Riazi, M.; Emami, A. Residential satisfaction in affordable housing: A mixed method study. Cities 2018, 82, 1–9. [Google Scholar] [CrossRef]
- Azemati, H.; Pourbagher, S.; Rostami, V. Evaluating the Satisfaction Rate in Affordable Housing Case Study: Ardabil Mehr Housing in Ardabil Province of Iran. J. Arch. Eng. Technol. 2017, 6, 1–6. [Google Scholar] [CrossRef]
- Cavalheiro, D.D.C.; Abiko, A. Evaluating slum (favela) resettlements: The case of the Serra do Mar Project, São Paulo, Brazil. Habitat Int. 2015, 49, 340–348. [Google Scholar] [CrossRef] [Green Version]
- Tibesigwa, B.M.; Hao, L.; Karumuna, B.V. The concept of spatial quality and its challenges on exercised affordable housing design typology in Dar es Salaam–Tanzania. Habitat Int. 2017, 59, 44–59. [Google Scholar] [CrossRef]
- Lange, L. Elderly People of Aboriginal Origin in Winnipeg: Their Struggle to Secure Safe and Affordable Housing. 2010. Available online: http://hdl.handle.net/1993/4091 (accessed on 3 September 2010).
- Childrenyouth, P. Waiting in Line: Low Income Families and the Search for Housing. Watching Out for Children in Changing Times; Philadelphia Citizens for Children and Youth: Philadelphia, PA, USA, 2001. [Google Scholar]
- Jia, M.; Peng, W.; Zhou, Y. Community Public Space Under the Background of Relief: A Comparative Study on Three Types of Communities in Beijing. Urban Rural Dev. 2019, 8, 48–52. [Google Scholar]
- Lu, Y. Design Strategy Improvement for Public Space in Affordable Housing Settlements in Guangzhou Based on the Needs of the Residence; South China University of Technology: Guangzhou, China, 2013. [Google Scholar]
- Wei, Z.; Zhang, Y.; Zhang, Y.; Zhai, Q. Evaluation and Optimization of Quality of Living Environment in Affordable Housing Estates. Planners 2017, 33, 30–38. [Google Scholar]
- Qian, L. Study of Relationship Between Public Space and Activity Behaviors in Large Affordable Housing Community—A Case in Nanjing Daishan Newtown; Soochow University: Suzhou, China, 2019. [Google Scholar]
- Tan, Y. Design Strategy of Affordable Housing Residential Space in Public Perspective; South China University of Technology: Guangzhou, China, 2012. [Google Scholar]
- Tang, B.-S. Is the distribution of public open space in Hong Kong equitable, why not? Landsc. Urban Plan. 2017, 161, 80–89. [Google Scholar] [CrossRef]
- Ajayi, O.O.; Faremi, O.J.; Dele Roger, S.; Uwaje, A. Affordable Housing For Low-Income Masses: A Case Study of A Densely Populated Area in Lagos Metropolis. CSID J. Infrastruct. Dev. 2020, 3, 64–74. [Google Scholar] [CrossRef]
- Kim, S.-H.; Moon, J.-W.; Kim, J.-H. A Study on the Improvement of National Rental Housing for Elderly through the Importance-Performance Analysis-Focused on National Rental Housing for Elderly in Ha-dong, Kim-Jae. J. Korean Hous. Assoc. 2010, 21, 1–10. [Google Scholar] [CrossRef] [Green Version]
- Simpson, G.D.; Parker, J. Data for an Importance-Performance Analysis (IPA) of a Public Green Infrastructure and Urban Nature Space in Perth, Western Australia. Data 2018, 3, 69. [Google Scholar] [CrossRef] [Green Version]
- Liang, C.; Zeng, J. Research on Optimization of Walking Environment in Historical District Based on Importance-performance Analysis: A Case Study of the Five Avenues, Tianjin. Mod. Urban Res. 2019, 2, 54–59. [Google Scholar] [CrossRef]
- Kim, H.-Y.; Jun, C.-M. Classification Analysis of Road Network-Based Land Use Considering Spatial Structure. J. Korean Assoc. Geogr. Inf. Stud. 2014, 17, 24–34. [Google Scholar] [CrossRef]
- Ostanska, A. Evolution of Spaces between Buildings in Polish Mass Housing Estates in the Eyes of the Inhabitants. In IOP Conference Series: Materials Science and Engineering; IOP Publishing: Bristol, UK, 2017; Volume 245, p. 52044. [Google Scholar]
- Wu, S.; Wu, P. Reviews and Prospects from Multi-Entities Viewpoint about Urban Old Community Public Space in China on the Background of Aging Society. Archit. Cult. 2019, 5, 69–71. [Google Scholar]
- Francis, J.; Giles-Corti, B.; Wood, L.; Knuiman, M. Creating sense of community: The role of public space. J. Environ. Psychol. 2012, 32, 401–409. [Google Scholar] [CrossRef]
- Wang, F.; Luo, W. Assessing spatial and nonspatial factors for healthcare access: Towards an integrated approach to defining health professional shortage areas. Health Place 2005, 11, 131–146. [Google Scholar] [CrossRef]
- Atzori, R.; Shapoval, V.; Murphy, K.S. Measuring Generation Y consumers’ perceptions of green practices at Starbucks: An IPA analysis. J. Foodserv. Bus. Res. 2016, 21, 1–21. [Google Scholar] [CrossRef]
- Deng, W. Using a revised importance–performance analysis approach: The case of Taiwanese hot springs tourism. Tour. Manag. 2007, 28, 1274–1284. [Google Scholar] [CrossRef]
- Esmailpour, J.; Aghabayk, K.; Vajari, M.A.; De Gruyter, C. Importance-Performance Analysis (IPA) of bus service attributes: A case study in a developing country. Transp. Res. Part A Policy Pract. 2020, 142, 129–150. [Google Scholar] [CrossRef]
- Bacon, D.R. A Comparison of Approaches to Importance-Performance Analysis. Int. J. Mark. Res. 2003, 45, 1–15. [Google Scholar] [CrossRef]
- Liu, Q.; Pan, Y.; Zhang, Z.; Wang, X. Recreational Satisfaction of Typical Riverfront Public Spaces in Shanghai Based on IPA Analysis. J. Chin. Urban For. 2021, 19, 29–34. [Google Scholar]
- Zhang, R.; Zhang, J. Perception of Tourism Image of Chenshan Botanical Garden in Shanghai Based on Web Text Analysis and IPA model. Chin. Landsc. Archit. 2019, 35, 83–87. [Google Scholar]
- Li, Z.; Sun, Y. Research on tourist satisfaction of tourism public service under the COVID-19 epidemic based on IPA analysis. J. Tianjin Univ. Commer. 2020, 40, 17–34. [Google Scholar]
- Cao, J.; Cao, X. Comparing importance-performance analysis and three-factor theory in assessing rider satisfaction with transit. J. Transp. Land Use 2017, 10, 65–68. [Google Scholar] [CrossRef] [Green Version]
- Rial, A.; Rial, J.; Varela, J.; Real, E. An application of importance-performance analysis (IPA) to the management of sport centres. Manag. Leis. 2008, 13, 179–188. [Google Scholar] [CrossRef]
- Boley, B.B.; McGehee, N.G.; Hammett, A.T. Importance-performance analysis (IPA) of sustainable tourism initiatives: The resident perspective. Tour. Manag. 2017, 58, 66–77. [Google Scholar] [CrossRef]
- Zheng, Q.; Zhang, P. Evaluation and Improvement of Public Sports Facilities in the Region of Counties—An Empirical Analysis Based on IPA. J. Shanghai Univ. Sport 2015, 39, 11–27. [Google Scholar]
- Kou, J.; Wu, H.; Lin, Z. An Empirical Study on Service Quality Evaluation and Improvement of National Fitness Path Based on IPA Analysis. J. Hebei Sport Univ. 2018, 32, 35–41. [Google Scholar]
- Lee, E. Indoor environmental quality (IEQ) of LEED-certified home: Importance-performance analysis (IPA). Build. Environ. 2019, 149, 571–581. [Google Scholar] [CrossRef]
- Aptekar, S. Visions of Public Space: Reproducing and Resisting Social Hierarchies in a Community Garden. Sociol. Forum 2015, 30, 209–227. [Google Scholar] [CrossRef]
- Lu, W. Building Compound Community Public Space for the Aged. Huazhong Archit. 2005, 5, 94–115. [Google Scholar]
- Anderson, J.; Ruggeri, K.; Steemers, K.; Huppert, F. Lively Social Space, Well-Being Activity, and Urban Design: Findings from a Low-Cost Community-Led Public Space Intervention. Environ. Behav. 2016, 49, 685–716. [Google Scholar] [CrossRef]
- Yu, Y.; Lin, N.; Gong, K. Urban Community Public Space Micro-renewal Environmental Planning—Take Datang Xiang Community as an Example. In IOP Conference Series: Earth and Environmental Science; IOP Publishing: Bristol, UK, 2021; Volume 1. [Google Scholar]
- Hong, M.A.; Ying, K. Micro-regeneration of Community Public Space Exploring Approaches to Community Building in the Context of Organic Urban Regeneration in Shanghai. Time Archit. 2016, 4, 10–17. [Google Scholar]
- Rossini, F.; Yiu, M.H.-L. Public open spaces in private developments in Hong Kong: New spaces for social activities? J. Urban. Int. Res. Placemaking Urban Sustain. 2021, 14, 237–261. [Google Scholar] [CrossRef]
- Mehta, V.; Bosson, J.K. Revisiting Lively Streets: Social Interactions in Public Space. J. Plan. Educ. Res. 2021, 41, 160–172. [Google Scholar] [CrossRef]
- Arman, M.; Zuo, J.; Wilson, L.; Zillante, G.; Pullen, S. Challenges of responding to sustainability with implications for affordable housing. Ecol. Econ. 2009, 68, 3034–3041. [Google Scholar] [CrossRef]
- McGuirk, P.; Argent, N. Population Growth and Change: Implications for Australia’s Cities and Regions. Geogr. Res. 2011, 49, 317–335. [Google Scholar] [CrossRef] [Green Version]
- Tighe, J.R. Public Opinion and Affordable Housing: A Review of the Literature. J. Plan. Lit. 2010, 25, 3–17. [Google Scholar] [CrossRef] [Green Version]
Figure 1.
Research structure and procedure.

Figure 2.
The location of Wuhan city and the spacial distribution of affordable housing of 2020.

Figure 3.
Accessibility analysis between urban comprehensive parks and affordable housing/general community.
Figure 3.
Accessibility analysis between urban comprehensive parks and affordable housing/general community.

Figure 4.
Accessibility analysis between community parks and affordable housing/general community.

Figure 5.
Accessibility analysis between other public space and affordable housing/general community.
Figure 5.
Accessibility analysis between other public space and affordable housing/general community.

Figure 6.
IPA two-dimensional matrix quadrant.

Figure 7.
Quadrant of importance and satisfaction of public space within affordable housing community.
Figure 7.
Quadrant of importance and satisfaction of public space within affordable housing community.


Table 1.
Overview of spatial distribution evaluation data of affordable residential areas in 2020.
| No. | Data Type | Data Used | Time | Data Source |
|---|---|---|---|---|
| 1 | Traditional basic data | Spatial distribution of affordable housing | 2020 | Urban Construction Statistical Yearbook of China |
| 2 | Functional partition in urban planning and current land use data | 2017.2 | The Master Planning of Wuhan | |
| 3 | Existing road network data | 2017.2 | ‘OneMap’ of Wuhan urban regulatory planning | |
| 4 | Network open data | Spatial distribution of general district | 2019.12 | Baidu POI |
| 5 | Road and public transportation data | 2019.12 | Gaode Map | |
| 6 | Public green space data | 2019.12 | Baidu POI |
Table 2.
Total scale and per capita scale of green space at all levels in Wuhan.
| Number | Total Scale (Hectare) | Proportion | Scale of Public Green Space Per Capita (Square Meters Per Person) | |
|---|---|---|---|---|
| urban comprehensive parks | 109 | 4046.8 | 77% | 4.84 |
| community-level parks | 291 | 1077.85 | 20% | 1.29 |
| other public green spaces | 364 | 137 | 3% | 0.16 |
| Total amount | 764 | 5261.65 | 100% | 6.29 |
Table 3.
The evaluation index system of internal public space by the residents in affordable housing areas.
Table 3.
The evaluation index system of internal public space by the residents in affordable housing areas.
| Primary Indicators | Secondary Indicators | Content |
|---|---|---|
| Road space | Barrier-free access setting | Access routes for residents with limited mobility or disabilities, mainly at pedestrian paths or building entrances and exits in the residential area, and at locations with large indoor height differences |
| Parking lot design | Surface or underground parking space for vehicles belonging to residents in the residential area | |
| Pedestrian system design | Pedestrian-vehicle separation areas or additional pedestrian trails | |
| Residential public green space | Residential (cluster) level public green space | |
| Green space | green space in front of the residential building | Green space in front of residential buildings |
| Soft and hard space ratio | Scale ratio of green space and hard paved areas (squares, etc.) in the residential area | |
| Variety of plant species | Types and scale of greenery in the residential area | |
| Residence-level public space | Residential-level gathering places | |
| Activity space | Neighborhood public space | Cluster-level gathering open space |
| Open Space | Open green space or small hard square space between residential buildings | |
| Residential entrances and exits | Vehicular/pedestrian entrances and exits in residential areas | |
| Exercise space | Sports and exercise areas (e.g., basketball, badminton, table tennis, etc.) within the residential area | |
| Recreational space | Small-scale spaces for residents to gather and communicate along the roads in the residential area | |
| Cultural facilities | Cultural facilities in the residential area, such as bulletin boards, calligraphy and painting display boards, etc. | |
| Activity facilities | Amusement facilities | Play facilities for young children in the residential area, such as sandboxes, slides, swings, etc. |
| Fitness facilities | Small-scale fitness facilities in the residential area, such as stepping machines, etc. | |
| Environmental facilities | Tables, chairs and pavilions | Tables, chairs and pavilions for residents in the area |
| Guidance signs | Guidance signs along roads and buildings in the residential area | |
| Service facilities | Retail and commercial facilities | Retail stores (fresh fruits and vegetables, department stores, hardware, beauty salons, medical care) for daily needs in the residential area |
| Medical and health facilities | Community health centers (clinics), pharmacies in or around the residential area, etc. |
Table 4.
Questionnaire on residents’ attributes of affordable housing.
| Attributes | Number | Proportion | |
|---|---|---|---|
| Gender | male | 286 | 58.3 |
| female | 205 | 41.7 | |
| Age | 18–30 | 94 | 19.1 |
| 30–60 | 174 | 35.5 | |
| 60–80 | 215 | 43.7 | |
| over 80 years old | 8 | 1.7 | |
| Occupation | occupied | 122 | 24.8 |
| retired | 191 | 39 | |
| unemployed | 178 | 36.2 | |
| Monthly income | Under 1000 | 249 | 50.7 |
| 1000–3000 | 210 | 42.8 | |
| over 3000 | 32 | 6.5 | |
| Education level | primary school | 154 | 31.4 |
| Junior high/high school | 261 | 53.2 | |
| university | 73 | 14.9 | |
| Master degree or above | 2 | 0.5 | |
Table 5.
The validity test of questionnaire.
| Cronbach’s Alpha | No. |
|---|---|
| 0.926 | 20 |
Table 6.
IPA analysis results of internal public space within typical affordable housing (n = 491).
| Primary Indicators | Secondary Indicators | D | Importance | Performance | Paired Sample t Test | p Value | ||||
|---|---|---|---|---|---|---|---|---|---|---|
| Mean Value | Standard Deviation | Sequencing | Mean Value | Standard Deviation | Sequencing | T | p | |||
| Road space | Barrier-free access setting | X1 | 3.3333 | 0.785 | 16 | 2.6064 | 0.746 | 19 | 4.361 | 0 |
| Parking lot design | X2 | 3.2 | 0.986 | 19 | 2.6593 | 1.035 | 17 | 5.671 | 0 | |
| Pedestrian system design | X3 | 3.8667 | 1.025 | 8 | 2.6593 | 0.946 | 18 | 12.663 | 0 | |
| Residential public green space | X4 | 4 | 0.825 | 6 | 3.1955 | 0.752 | 3 | 7.106 | 0 | |
| Green space | green space in front of the living building | X5 | 3.8 | 0.825 | 10 | 3.3823 | 0.752 | 1 | 3.689 | 0 |
| Soft and hard space ratio | X6 | 3.5333 | 1.025 | 14 | 2.9244 | 0.752 | 11 | 5.378 | 0 | |
| Variety of plant species | X7 | 3.1333 | 1.125 | 20 | 2.851 | 1.069 | 13 | 1.888 | 0 | |
| Residence-level public space | X8 | 4.0667 | 0.725 | 4 | 3.0729 | 0.969 | 6 | 6.646 | 0 | |
| Activity space | Neighborhood public space | X9 | 4.1333 | 0.912 | 2 | 3.1328 | 0.869 | 4 | 14.514 | 0 |
| Open Space | X10 | 3.6667 | 0.812 | 13 | 3.0448 | 1.069 | 8 | 9.022 | 0 | |
| Residential entrances and exits | X11 | 3.3333 | 1.082 | 16 | 2.8477 | 1.141 | 14 | 2.704 | 0 | |
| Exercise space | X12 | 3.9333 | 0.755 | 7 | 2.9303 | 0.707 | 10 | 5.933 | 0 | |
| Recreational space | X13 | 3.8667 | 0.855 | 9 | 2.7797 | 0.907 | 16 | 6.43 | 0 | |
| Cultural facilities | X14 | 3.2667 | 0.755 | 18 | 2.8634 | 0.814 | 12 | 3.986 | 0 | |
| Activity facilities | Amusement facilities | X15 | 3.7333 | 0.711 | 12 | 3.2203 | 0.714 | 2 | 2.459 | 0 |
| Fitness facilities | X16 | 4.1333 | 0.911 | 3 | 3.0551 | 0.914 | 7 | 5.167 | 0 | |
| Environmental facilities | Tables, chairs and pavilions | X17 | 3.8 | 0.811 | 11 | 2.5659 | 0.714 | 20 | 5.914 | 0 |
| Guidance signs | X18 | 3.4667 | 1.054 | 15 | 2.7943 | 1.094 | 15 | 2.717 | 0 | |
| Service facilities | Retail and commercial facilities | X19 | 4.2667 | 0.913 | 1 | 3.1037 | 0.944 | 5 | 6.834 | 0 |
| Medical and health facilities | X20 | 4.0667 | 0.813 | 5 | 2.9406 | 0.850 | 9 | 6.618 | 0 | |
| Comprehensive evaluation | 3.73 | 2.93 | ||||||||
Table 7.
Mean difference of importance satisfaction of public space within a typical affordable housing community.
Table 7.
Mean difference of importance satisfaction of public space within a typical affordable housing community.
| Primary Indicators | Secondary Indicators | I-P | Sequencing | Echelon |
|---|---|---|---|---|
| Road space | Barrier-free access setting | 0.7269 | 11 | third echelon |
| Parking lot design | 0.5407 | 15 | third echelon | |
| Pedestrian system design | 1.2074 | 2 | first echelon | |
| Residential public green space | 0.8045 | 10 | second echelon | |
| Green space | green space in front of the living building | 0.4177 | 18 | fourth echelon |
| Soft and hard space ratio | 0.6089 | 14 | third echelon | |
| Variety of plant species | 0.2823 | 20 | fourth echelon | |
| Residence-level public space | 0.9938 | 9 | second echelon | |
| Activity space | Neighborhood public space | 1.0005 | 8 | second echelon |
| Open Space | 0.6219 | 13 | third echelon | |
| Residential entrances and exits | 0.4856 | 17 | fourth echelon | |
| Exercise space | 1.003 | 7 | second echelon | |
| Recreational space | 1.087 | 5 | first echelon | |
| Cultural facilities | 0.4033 | 19 | fourth echelon | |
| Activity facilities | Amusement facilities | 0.513 | 16 | fourth echelon |
| Fitness facilities | 1.0782 | 6 | second echelon | |
| Environmental facilities | Tables, chairs and pavilions | 1.2341 | 1 | first echelon |
| Guidance signs | 0.6724 | 12 | third echelon | |
| Service facilities | Retail and commercial facilities | 1.163 | 3 | first echelon |
| Medical and health facilities | 1.1261 | 4 | first echelon |
Publisher’s Note: MDPI stays neutral with regard to jurisdictional claims in published maps and institutional affiliations. |
© 2021 by the authors. Licensee MDPI, Basel, Switzerland. This article is an open access article distributed under the terms and conditions of the Creative Commons Attribution (CC BY) license (https://creativecommons.org/licenses/by/4.0/).
Share and Cite
MDPI and ACS Style
Zhao, J.; Peng, Z.; Liu, L.; Yu, Y.; Yu, Y. Evaluation on the Internal Public Space Quality in Affordable Housing Based on Multi-Source Data and IPA Analysis. Land 2021, 10, 1000. https://0-doi-org.brum.beds.ac.uk/10.3390/land10101000
AMA Style
Zhao J, Peng Z, Liu L, Yu Y, Yu Y. Evaluation on the Internal Public Space Quality in Affordable Housing Based on Multi-Source Data and IPA Analysis. Land. 2021; 10(10):1000. https://0-doi-org.brum.beds.ac.uk/10.3390/land10101000
Chicago/Turabian StyleZhao, Jie, Zhenghong Peng, Lingbo Liu, Yang Yu, and Yan Yu. 2021. "Evaluation on the Internal Public Space Quality in Affordable Housing Based on Multi-Source Data and IPA Analysis" Land 10, no. 10: 1000. https://0-doi-org.brum.beds.ac.uk/10.3390/land10101000
Note that from the first issue of 2016, this journal uses article numbers instead of page numbers. See further details here.