Article

A Life Cycle Assessment of an Energy-Biochar Chain Involving a Gasification Plant in Italy

1
Faculty of Civil and Industrial Engineering, Department of Civil, Constructional and Environmental Engineering (DICEA), Sapienza University of Rome, Via Eudossiana 18, 00184 Rome, Italy
2
Faculty of Civil and Industrial Engineering, Department of Chemical Engineering Materials Environment (DICMA), Sapienza University of Rome, Via Eudossiana 18, 00184 Rome, Italy
*
Author to whom correspondence should be addressed.
Submission received: 14 October 2021 / Revised: 13 November 2021 / Accepted: 15 November 2021 / Published: 17 November 2021

Abstract

:
Life cycle assessment (LCA) is a fundamental tool for evaluating the environmental and energy load of a production cycle. Its application to renewable energy production systems offers the possibility of identifying the environmental benefits of such processes—especially those related to the by-products of production processes (i.e., digestion or biochar). Biochar has received worldwide interest because of its potential uses in bioenergy production, due to its coproducts (bio-oil and syngas), as well as in global warming mitigation, sustainable agriculture, pollutant removal, and other uses. Biochar production and use of soil is a strategy for carbon sequestration that could contribute to the reduction of emissions, providing simultaneous benefits to soil and opportunities for bioenergy generation. However, to confirm all of biochar’s benefits, it is necessary to characterize the environmental and energy loads of the production cycle. In this work, soil carbon sequestration, nitrous oxide emissions, use of fertilizers, and use of water for irrigation have been considered in the biochar’s LCA, where the latter is used as a soil conditioner. Primary data taken from experiments and prior studies, as well as open-source available databases, were combined to evaluate the environmental impacts of energy production from biomass, as well as the biochar life cycle, including pre- and post-conversion processes. From the found results, it can be deduced that the use of gasification production of energy and biochar is an attractive strategy for mitigating the environmental impacts analyzed here—especially climate change, with a net decrease of about −8.3 × 10³ kg CO2 eq. Finally, this study highlighted strategic research developments that combine the specific characteristics of biochar and soil that need to be amended.

1. Introduction

Over recent years, global warming has received attention all around the world. It is predominantly attributable to the increasing atmospheric concentrations of greenhouse gases (GHG), principally caused by human activities, such as energy production. Currently, the world’s major source of energy is still traditional fossil fuels, which cause a high level of carbon dioxide (CO2), methane (CH4), and nitrous oxide (N2O) emissions, which contribute to more than 90% of anthropogenic climate warming [1,2].
In fact, in 2018, the Intergovernmental Panel on Climate Change (IPCC) emphasised the need for carbon dioxide removal technologies to meet the global target of limiting global warming to 1.5 °C [3]. Thus, the search for innovative, sustainable, efficient, and economically attractive solutions is imperitive [4]. Apart from promoting renewable energy and reducing overall energy consumption, the permanent sequestration of CO2 from the atmosphere is one option for addressing the climate change topic [5,6,7,8,9].
Strategies based on the pyrolysis of biomass and subsequent biochar application to soil have been defined as among the most efficient negative emission technologies (NET) in mitigating climate change’s effects. These strategies can subtract carbon from the short-term cycle of agricultural or forest ecosystems and insert it into a long-term cycle, increasing soil organic carbon stocks with a matrix lasting an estimated average residence time of between hundreds and thousands of years [10].
Biomass represents a promising renewable energy source because it is cheap, abundant, and can be replenished on its own over time [11,12]. Biomass is a biological material originally derived from reactions between available atmospheric CO2, water and sunlight via photosynthesis. Biomass can be converted into energy through thermochemical conversion, breaking down chemical bonds of organic matter and converting their intermediates into bio-oil, syngas, and biochar [13,14]. Bio-oil is a pyrolytic condensable liquid product that is mainly used to efficiently produce hydrogen and electricity [15,16]. Syngas is a gaseous fuel consisting, mainly, of H2, CH4 and CO, which can be used as fuel in gas turbines, leading to the production of thermal or/and electrical energy [17,18]. Biochar is a carbon-rich material derived from the thermochemical conversion of biomass in the absence of oxygen [19], which has come to the fore in recent years due to its potential for promoting C sequestration in soil [20,21]. Biochar possesses unique chemical, physical and biological properties, including a large specific surface area, a high pore volume, a high proportion of recalcitrant organic C, abundant oxygen (O)-containing functional groups, a high mineral content, and a high cation exchange capacity (CEC) [22,23,24,25,26].
Biochar is mainly used as a soil supplement to improve soil fertility and properties, increasing crop productivity [27,28,29,30,31,32]. Using biochar as a soil improver can reduce N losses and promote soil organic carbon accumulation [33]; in fact, the IPCC in its latest reports (in particular that of 2019 on Climate Change and Land) has indicated biochar as an effective means of removing carbon permanently [34]. Furthermore, according to the Iowa State University Bioeconomy Institute, a 250 ha. farm using biochar would be able to sequester 1900 tons of carbon per year [35]. Moreover, biochar can restore abandoned agriculture areas, compensating for acidity, low organic carbon, and water retention capacity [36].
Besides agriculture, biochar can be used in other fields. Biochar has been studied as an adsorbent for the removal of inorganic, organic and toxic compounds from soil and water [37,38,39,40,41]. Furthermore, biochar use is currently being expanded to embrace a variety of disciplines such as catalysis, medical uses, supercapacitors, flue gas adsorbent, animal husbandry, fuel cell systems, building materials, and energy/gas storage [36,42]. Although there are disagreements about biochar research, many studies have demonstrated the importance of biochar research from the standpoint of scientific advancement and practical utilizations.
However, to confirm all the benefits related to biochar’s uses and to characterize all positive and negative environmental externalities, it is necessary to conduct analyses on the lifecycle impacts of all the phases of production and uses of biochar. The appropriate tool for undertaking a comprehensive evaluation of emissions, resource consumption, and energy use of biochar systems is the Life Cycle Assessment (LCA).
This publication aims to assess the environmental impacts associated with the biochar life cycle produced by the gasification process as implemented by an Italian company, and to show if it produces a negative environmental impact via its downstream processes and from a cradle-to-grave life cycle perspective.
It is noteworthy that, as far as the authors are aware, this is the first LCA study of this commercial biochar, and one of the first analyses investigating the environmental impacts of downstream processes related to biochar using open-source software and databases.

2. Materials and Methods

2.1. Life Cycle Assessment

The objective of the LCA is to highlight the supply chains, life cycle stages, processes, and elements impacting the most significantly to bio-char’s potential environmental impacts. The results can be used as decision-making support, both at a corporate and political level, to evaluate alternative scenarios and to choose more sustainable solutions.
According to the ISO Standards 14040 and 14044, LCA is defined as an analytical comprehensive tool that evaluates environmental burdens, benefits, and performance in connection to the entire supply chain of a product, process, or service by quantifying energy, resources, and emissions [43,44]. The present study followed the guidelines of the LCA principles, based on the ISO Standards and the ILCD Handbook of the Joint Research Center [45]. The LCA methodology consists of four major iterative steps (Figure 1):
  • Goal and scope definition;
  • Life cycle inventory (LCI);
  • Life cycle impact assessment (LCIA);
  • Interpretation of the results.
The goal and scope definition provides the study framework and explains how and to whom the results should be communicated. This phase describes the questions underlying the case study, the system boundaries considered, and defines the so-called functional unit. The system boundaries for the product are selected by selecting which unit processes will be included in the analysis. The system boundary traces the environmental inputs and outputs that cross the boundary. The functional unit is defined for the product system to provide a way to allocate the consumption of raw materials, energy, emissions, and waste generated during the production of the product and to allow product comparisons [46].
In the LCI phase, the inputs of resources, materials, and energy, as well as the outputs of products and emissions, are examined and listed for each intermediate stage of the production chain. After all incoming and outgoing flows have been calculated, it is possible to identify the number of emissions related to the entire process chain.
LCIA is the part of the LCA where the results of the inventory analysis are associated with specific potential environmental impact categories (e.g., global warming potential, acidification, eutrophication), which are chosen depending on the goal of the study.
The last phase of the LCA is the interpretation phase, where the results from LCI and LCIA are combined and reported to provide a complete, transparent and unbiased account of the study. The object is to reach conclusions and recommendations in line with the defined objective and scope of the study.

2.2. Goal and Scope Definition

A substantial number of LCA studies on biochar systems have been published focusing specifically on biochar’s use as a soil amendment and the valorization of bio-oil and syngas for energy generation [5,9,20,47,48,49,50,51,52,53,54], but most do not refer to full-scale or currently operational plants.
The present study is specifically focused on the environmental assessment of the energy–biochar production process, with the evaluation of the full wood gasification chain of a real plant in Italy, managed by Record Immobiliare S.r.l.
This company has expressed interest in exploring biochar and its ability to reduce atmospheric carbon, so it is important to show that LCA can produce a net effect on global warming without being compared to anything else. Gasification was found to be both the most efficient process for producing energy using the same raw material in comparison to pyrolysis [49], and to be much more sustainable than the complete combustion of biomass [55]. The hypothesis is that this LCA analysis could prove that the gasification chain can contribute to the reduction of greenhouse gas emissions in both the energy and agricultural sectors. The production of energy from biomass can replace the energy produced from fossil sources [56], and thus, gasification can reduce the demand for electricity in the national energy mix [57]. Furthermore, the use of biochar in agriculture can positively contribute to traditional agricultural practices—for example, by reducing the use of fertilizers and water for irrigation and GHG emissions from the soil [58].
This LCA will assess energy and material inputs and outputs associated with the entire biochar and energy production process from a cradle-to-grave perspective. The analysis was carried out using primary and secondary data and with the assumption of conservative hypotheses.
Biochar has many different factors that determine the efficiency of its processes, such as type of feedstock, thermochemical reduction process parameters, utilization of secondary benefits, etc. These factors are explored in other papers; the purpose of this LCA is to show the absolute effects of an energy–biochar production system with subsequent soil application.
The analysis was performed with OpenLCA—open-source, free software for LCA and impact assessment developed by GreenDelta.

2.2.1. Functional Unit

Material flows, energy use and emission data were standardized to the functional unit of 1000 kg packed biochar, which was applied to fields.

2.2.2. Data Quality Requirements

For LCI, technical data from plant operations were used (primary data)—collected through interviews with the company’s service manager in the period between May 2020 and December 2020.
Whenever data was not available from the published literature, internet sources and the free OpenLCA database were used (secondary data). If the data were not available from Italian contexts, data relating to similar contexts were chosen. The LCI data (Supplementary S1: Data used in LCI) were processed using Microsoft Excel software

2.2.3. Case Description

The biochar analyzed was RE-CHAR®, produced by Record Immobiliare S.r.l. (a company belonging to the Moretti Compact group) in Lunano (Italy) from woody biomass (woodchips from deciduous and coniferous wood) through a gasification process conducted under the following operating conditions: ~1000 °C average gasification temperature, ~700 °C effluent gas temperature, and 300 °C inlet air temperature [59].
RE-CHAR® has already been investigated for other purposes by some of the authors [60,61]; currently, following Italian legislation, it is sold and used as a soil improver.
The gasification plant aims at energy production and generates biochar as a solid co-product. Currently, this biochar is used as a soil improver, for which it has received Italian certification (0019841/17, decree 75/2010 “Reorganization and revision of the rules on soil improvers”).
The woody biomass used as a feedstock was produced by forest management activities and was composed of woodchips with a particle size distribution predefined by mechanical treatment. The feedstock complied with the A1/A2 quality classes of the UNI EN ISO 17225-4: 2014 standard.
As far as the production process was concerned, the biomass was transported from the storage tank to the drying phase through mechanical systems using rakes and augers; here, the water content was reduced to about 10% through the insufflation of 8000 m3/h of hot air, using an air handling unit.
Then, the biomass suitable for gasification was selected through screening and automatically loaded to the plant, where it underwent thermochemical conversion in an oxygen-deficient environment. A fraction of the low-temperature steam produced by the turbine was used in the drying process; the remaining part was used in other production processes within the company. Hot biochar was mixed with water to cool it and make it more manageable. The biochar was then packaged and transported to farmers who could apply it to the soil.

2.2.4. System Boundaries

The system boundaries describe the processes included in the analysis. Normally, the system boundaries for any LCA include all processes in the lifecycle of the product under consideration: from raw material acquisition to processing, transportation, use, and disposal. The biochar system process studied was divided into three phases:
  • The upstream process, which includes the feedstock collection and pre-treatment processes;
  • The core process, which consists of the gasification phase of biochar production and energy generation;
  • The downstream process, which includes the transport of the biochar and its final application.
The inflow to the system was thus the use of resources and energy, while outflows were emissions, waste and resource use.
The system boundaries and flowchart, illustrated in Figure 2, show the RE-CHAR® supply chain as used in this analysis. Blocks in the diagram represent process units, while arrows represent flows of biomass, other types of material, or energy. Biochar has many different uses, but for this LCA, the only application considered was biochar as a soil improver [62].
Following the specific product requirements, the next exclusions have been made from the system boundaries and therefore not modeled in this analysis:
  • Human labor;
  • Sale and use of sawdust;
  • End-of-life treatment of the biochar packaging.
It is believed that the materials and flows in the plant would have had a negligible impact on the results of the LCA, considering an expected lifespan of the equipment of about 25 years.
The LCA included expansions of the system for accurate modelling of the benefits of the production process and the effects (positive or negative) of biochar application to soil. The benefits related to the production process were electricity and heat generation, and consequently, the avoidance of emissions associated with the substitution of fossil fuels by bioenergy.
Concerning biochar application to soil, the effects that biochar has on the following processes have been considered in the LCA:
  • Soil carbon sequestration (CO2);
  • Nitrous oxide (N2O) emissions from the soil;
  • Non-use of fertilizers;
  • Use of irrigation.
The effect of biochar application on biomass yield is highly uncertain and is therefore not considered in this study. The values reported in the literature vary by orders of magnitude, and the corresponding hypotheses are consequently associated with high uncertainty.
In the absence of field test data, benefits have been calculated by subtracting the environmental impacts of conventional processes and practices with the help of databases (Supplementary S2: List of OpenLCA free databases used) and literature data.

2.3. Life Cycle Inventory (LCI)

The LCI included all inputs, outputs, and flows relevant to the product system. The following sections describe the structure, content, and assumptions of the inventory, in the order of the supply chain life cycle stages.

2.3.1. Feedstock Production and Logistics

The feedstock that was used in the plant was composed of woodchips from deciduous (80%) and coniferous wood (20%) with a particle size distribution predefined by mechanical treatment (3.15 mm < p < 50 mm, min 80%; fine fraction <1 mm, max 5%; thick fraction >50 mm, max 1%). The feedstock entering the plant had an average moisture content of 20% by weight for deciduous wood and 35% by weight for coniferous wood. The material was produced by forest management activities and complied with the A1/A2 quality classes of the UNI EN ISO 17225-4: 2014 standard. The supplier of the coniferous woodchips was located at about 50 km from the production plant, while that of the deciduous woodchips was located at a distance of about 17 km from the production plant. The purchased biomass was transported by lorry and discharged to the plant, contained in an underground tank of 100 m3. Then, through mechanical systems with rakes and augers, woodchips were collected from the underground tank and transported to the screening stage.
Emission data for the transport processes were taken from the OpenLCA database [63]. A EURO5 16–32 t lorry was selected from the database and regular gasoline was used as the standard fuel type. The unit used for the evaluation of transport flows was ton-kilometer (t×km), which was defined as the transport of one tonne of goods by a defined transport service over one kilometer [64]. When calculating the distances traveled by the trucks during the transfers, both the outward and return journeys were taken into account; this represents a highly conservative approximation, as the fact that the vehicle would travel unloaded during the return journey was not considered. Assessing the distance traveled by the suppliers’ trucks, the total number of journeys in which the woodchips were unloaded at the plant was considered. It was assumed that no biomass losses occured during transport, so the total amounts transported were the same as those indicated for gasification pre-processing.
Starting from the functional unit of the LCA, the total amount of biomass necessary to produce 1 ton of biochar was reconstructed, considering all the inputs and outputs in the processes preceding gasification. The descriptive processes of biomass production were selected from the OpenLCA free databases, choosing those considered to be the best approximations.

2.3.2. Screening and Drying

The particle size of the feedstock, as well as the humidity, have a significant impact on the gasification process and the final product yields. The screening was performed with a vibrating screen (10 mm mesh opening) to separate the biomass suitable for gasification from sawdust and oversized pieces. These by-products have not been considered in the LCA and consequently were located outside the system boundaries.
It is known that sawdust, generated in large quantities, is sold to a riding stable near the plant. The data on the number of oversized pieces were not provided by the company because it was considered negligible. The more humid the feedstock that enters the gasifier, the more energy is needed to pyrolyze the feedstock.
Therefore, it was logical to dry the feedstock before the gasification step, using a lower temperature heat instead of the less cost-efficient high-temperature heat required for gasification.
The drying unit process has the task of reducing the percentage of water content in the biomass, bringing it to about 10% through the insufflation of heat from the gas engine with the aid of an air handling unit of 8000 m3/h; therefore, no fossil fuels were used to dry the feedstock. Before being used for drying, the steam was used for other production lines in the factory.

2.3.3. Gasification and Syngas Combustion

Woodchips were automatically loaded onto the gasification plant, which was composed of two fixed-bed downdraft gasifiers produced by ESPE (an Italian company involved in the renewable energy sector), with the technical parameters shown in Table 1.
Downdraft gasification technology, also called a co-current, was characterized by the feedstocks and gasification air flows having the same direction, descending from the top of the reactor. Gasification, as a biochar processing technology, is a good business proposal because of its high quantity of co-produced energy. In addition, the fixed bed downdraft technique features cleaner syngas (fewer TAR oils).
The ESPE gasifier requires only a very small amount of electrical energy to start the engine, because the system recycles part of the syngas generated to sustain the high-temperature environment needed to maintain the pyrolyzing process, so no additional external fuel source was required. The analysis undertaken here considers a continuous process capable of utilizing a range of woodchips at a rate of 49 kg of dry matter per hour and an operating time of 7500 h per year, for each gasifier.
The solid/gaseous mixture that was generated, after a cooling phase, passed through a cyclonic filter from which there were two outputs: syngas and biochar.
The assumed product yields for biochar and syngas were 5% and 95% of the weight of starting incoming material (on a dry matter basis), respectively. The amount of bio-oil was close to 0% and therefore was not considered in this analysis.
Syngas is a mixture of gases: hydrogen (H2), methane (CH4), carbon monoxide (CO), and carbon dioxide (CO2); it is burned on-site for electricity and heat generation. Electricity produced by gasification is fed into the national electricity grid. Heat is obtained by cooling the gas, which is then conveyed to the engine that produces electricity through the alternator, and further thermal energy is obtained by cooling the engine itself as well as the exhaust gases. Here the heat was used in part for woodchips drying, and in part within the Moretti Compact factories for production (i.e., in the drying booth for drying paints using a thermo-ventilating control unit).
Syngas powers 2 internal combustion engines with the characteristics reported in Table 2.
A detailed description of the physicochemical characteristics of biochar is shown in Table 3.
The net electricity and heat production from the plant were estimated to measure the fossil fuels offset by the energy generated by gasification. The net energy production was calculated by subtracting from the total production the internal consumption of the equipment and processes necessary for the operation of the entire system studied.
Unfortunately, the company did not have data on the electricity consumption of individual appliances, so a total value of internal consumption was entered into the LCI as the input of the gasification step. All the processes together required about 16% of the electric energy generated themselves.
From the elaboration of the data provided by the company, it was deduced that the net production of electricity was equal to 8456.17 kWh per tonne of biochar produced, while that of heat was equal to 12,750.89 kWh.
The LCA included a calculation of avoided emissions and energy consumption due to the energy production from gasification, using the most representative processes selected from the free databases available in OpenLCA.
The emission factors of the electricity replaced by gasification were calculated based on the Ecoinvent processes, available for free in OpenLCA, relating to the market for electricity in Italy.
Conversely, it has been assumed that the net thermal energy produced by gasification and used in its production processes will replace the same amount of thermal energy that would have been produced with natural gas, using the data relating to the European Union available in the Ecoinvent database, available for free in OpenLCA.

2.3.4. Quenching, Packaging and Sale of Biochar

The hot biochar coming from the gasification process was then quenched with water to reduce its temperature and to prevent it from burning when exposed to the air. Furthermore, the material was made more manageable and easier to ship. This process takes place through an atomizer with atomizing nozzles, which was connected to the water mains and started up every 30 min for about 10 s. The company that owns the plant did not supply data regarding the precise amount of water used, as it was not usually accounted for. Considering that the humidity of the final product was greater than 20% and that the raw biochar itself had a humidity of about 1%, a quantity of water equal to 250 kg per 750 kg of raw biochar was assumed. Biochar has an extraordinarily porous structure and can absorb water up to six times its own weight, keeping a constant volume and increasing in density [65].
Biochar was stored in large bags with the following characteristics: dustproof stitching, canvas coupled with internal lining, closed bottom, top opening, a volume of 1 m3, a weight of about 200 kg; it was assumed that the net weight of a largelarge bag was 1 kg.

2.3.5. Biochar Application to Soil

It was assumed that the transport of biochar to agricultural fields was carried out with the same type of truck used for transporting the woodchips. A transport distance of 10 km was considered to describe the average distance between gasification plants and agricultural fields. As with biomass transport, the lorry on the return journey was assumed to be full and it was assumed there were no losses during transport. Increasing the distance would also increase the environmental impacts associated with transport-related emissions, but it was considered that, in order to be sold to farmers at an economically sustainable price, the cost of transporting over high distances would have too much influence on the total selling price of the biochar.
The effects of biochar application to soil were the most uncertain elements in this study. Although effects have been observed in varying degrees, and sometimes not at all, reviews [66,67], a meta-analysis [68], an expert survey [7], and unpublished experiences were drawn upon to generate baseline assumptions.
Another uncertain element was the methodology of the application to soil. Plot-scale experimentation with biochar has relied on mainly quantitatively precise application methods (e.g., hand-spreading), which do not inform appropriate field-scale practice. In the few field-scale case studies, biochar application to soil has been tried out using limer, fertilizer, or manure spreaders, followed by mechanical soil mixing by mouldboard plow plus harrow, disc harrow, or rotary hoe. Surface spreading of biochar may require the least amount of energy and the lowest economic cost compared to all the other possible biochar application methods. The aim of mechanical incorporation and complete mixing of soil and biochar was to achieve maximal physical contact and chemical interactions between soils and biochar [69]. The experience of spreading biochar using conventional equipment has been documented in a practical demonstration in Canada using an agricultural spreader designed to apply lime to an approximately 10 m wide swath [70]. After application, the biochar was incorporated into the soil using a disk harrow. In a field experiment in central Italy, biochar was applied in the inter-row space of a vineyard using a fertilizer spreader and was incorporated into the soil using a chisel plow tiller [71]. Biochar can also be mixed with liquid manure or other soil amendments such as compost or lime before soil application and then applied as a slurry [72].
In this work, it was assumed that biochar soil addition took place using a spreader and that it was then incorporated into the soil using a rotary hoe. Emission data for biochar uses were taken from OpenLCA free databases. The application amount was 25 t/ha, following the average application scenario which can be seen from literature studies.
In the field experiment conducted by Husk and Major (2010) [70], the mass flow calculations related to the agricultural phase were characterized by a 25% loss of biochar due to potential wind, water, and/or soil erosion, while losses during handling were estimated at 2% and losses during transportation at 3%, for a total of 30% estimated losses. They attributed this loss to lateral transport of biochar that remained on the soil surface after application during heavy rain events that resulted in the accumulation of free water on the soil surface. As has been commented, one of the main causes of wind losses is dusting of the biochar, which is applied rough, without first being wet. In this study, since a fair volume of water has been added to the material, which has led it to have about 25% humidity, the loss due to potential wind, water, and/or soil erosion was considered to be lower, equal to 10%, for a total loss of 15%.
The characteristics of the machinery and the other assumptions made are described in Supplementary S1: Data used in LCI.
The effects of 25 t/ha biochar addition to a hypothetical agricultural soil in the Marche region (Italy), used for LCI processing, are summarized in Table 4.
The effects were selected based on meta-analyses when available, or from experimental studies or expected effects otherwise.
Assumptions and arguments, and references for the composition of Table 4 are illustrated in Supplementary S3: Biochar soil effects [9,71,73,74,75,76,77,78,79,80,81,82,83,84,85,86,87,88,89,90,91,92,93,94,95].
Effects were assumed to occur every year to the same extent. For example, a 30% decrease in N2O emissions from soil occurs in the first year after the use of biochar and remains constant throughout the evaluation period, rather than there being a further 30% decrease each year compared to the last. A more comprehensive dynamic modeling approach was not appropriate, given the incomplete knowledge of these processes. Application to soil effects of biochar not considered were: increased biomass yields, biochar liming effect, and suppression of soil CH4 emissions.

2.4. Life Cycle Impact Assessment Method and Categories

The Life Cycle Impact Assessment (LCIA) phase establishes links between the results of the LCI and the potential environmental impacts [96,97]. The LCIA calculates impact indicators, which provide general, but quantifiable, indications of potential environmental impacts. Each impact indicator is a measure of one aspect of a potential impact. Furthermore, each impact indicator value is expressed in units that are not comparable to others, so indicators should not be combined or added.
The CML baseline (v4.4, January 2015) was used as the life cycle impact assessment method [98]. This method was created by the University of Leiden in the Netherlands in 2001 and today it is one of the most used methods for LCA evaluations. This method incorporates the following impact categories, with consideration of the damage done to health and ecosystems, as well as the depletion of resources.

2.4.1. Acidification Potential

Acidifying substances cause a wide range of impacts on soil, groundwater, surface water, organisms, ecosystems, and materials [99,100]. The acidification potential describes the fate and deposition of acidifying substances such as nitric acid, sulfuric acid, sulfur trioxide, hydrogen chloride, hydrogen fluoride, phosphoric acid, and hydrogen sulfide. These substances may cause acid rains that are harmful to terrestrial and aquatic species. Natural sources include volcanic eruptions and ocean emissions, such as volatile sulfur gases, while human sources are primarily fossil fuel combustion, vehicle exhausts, and agriculture. The acidification potential is expressed in kg SO2 eq.

2.4.2. Climate Change

The Intergovernmental Panel on Climate Change (IPCC) has developed a characterization model that is used to evaluate the effects of climate change. Factors are expressed as Global Warming Potential-100 (GWP100), which represents the potential contribution of a substance to the greenhouse effect for a time horizon of 100 years and is expressed in kg carbon dioxide equivalent emissions (kg CO2 eq.) [101,102]. Climate change is closely related to GHG emissions in the air. GHG can increase radiative forcing, affecting the earth’s energy balance, as they absorb solar radiation emitted by the earth’s surface and clouds, thus causing a net warming effect. Negative effects on ecosystem health, human health, and material welfare can result from climate change.

2.4.3. Depletion of Abiotic Resources

This impact category indicator is related to the extraction of minerals “Depletion of abiotic resources—elements, ultimate reserves” and fossil fuels “Depletion of abiotic resources—fossil fuels”, which are inputs into the system, leading to a reduced availability of these resources for future generations [103,104]. For a given resource, the depletion of abiotic resources is defined as the ratio between the quantity of resource extracted and the recoverable reserves of that source. Minerals are expressed in kg antimony equivalent (kg antimony eq.), while fossil fuels are expressed in MJ.

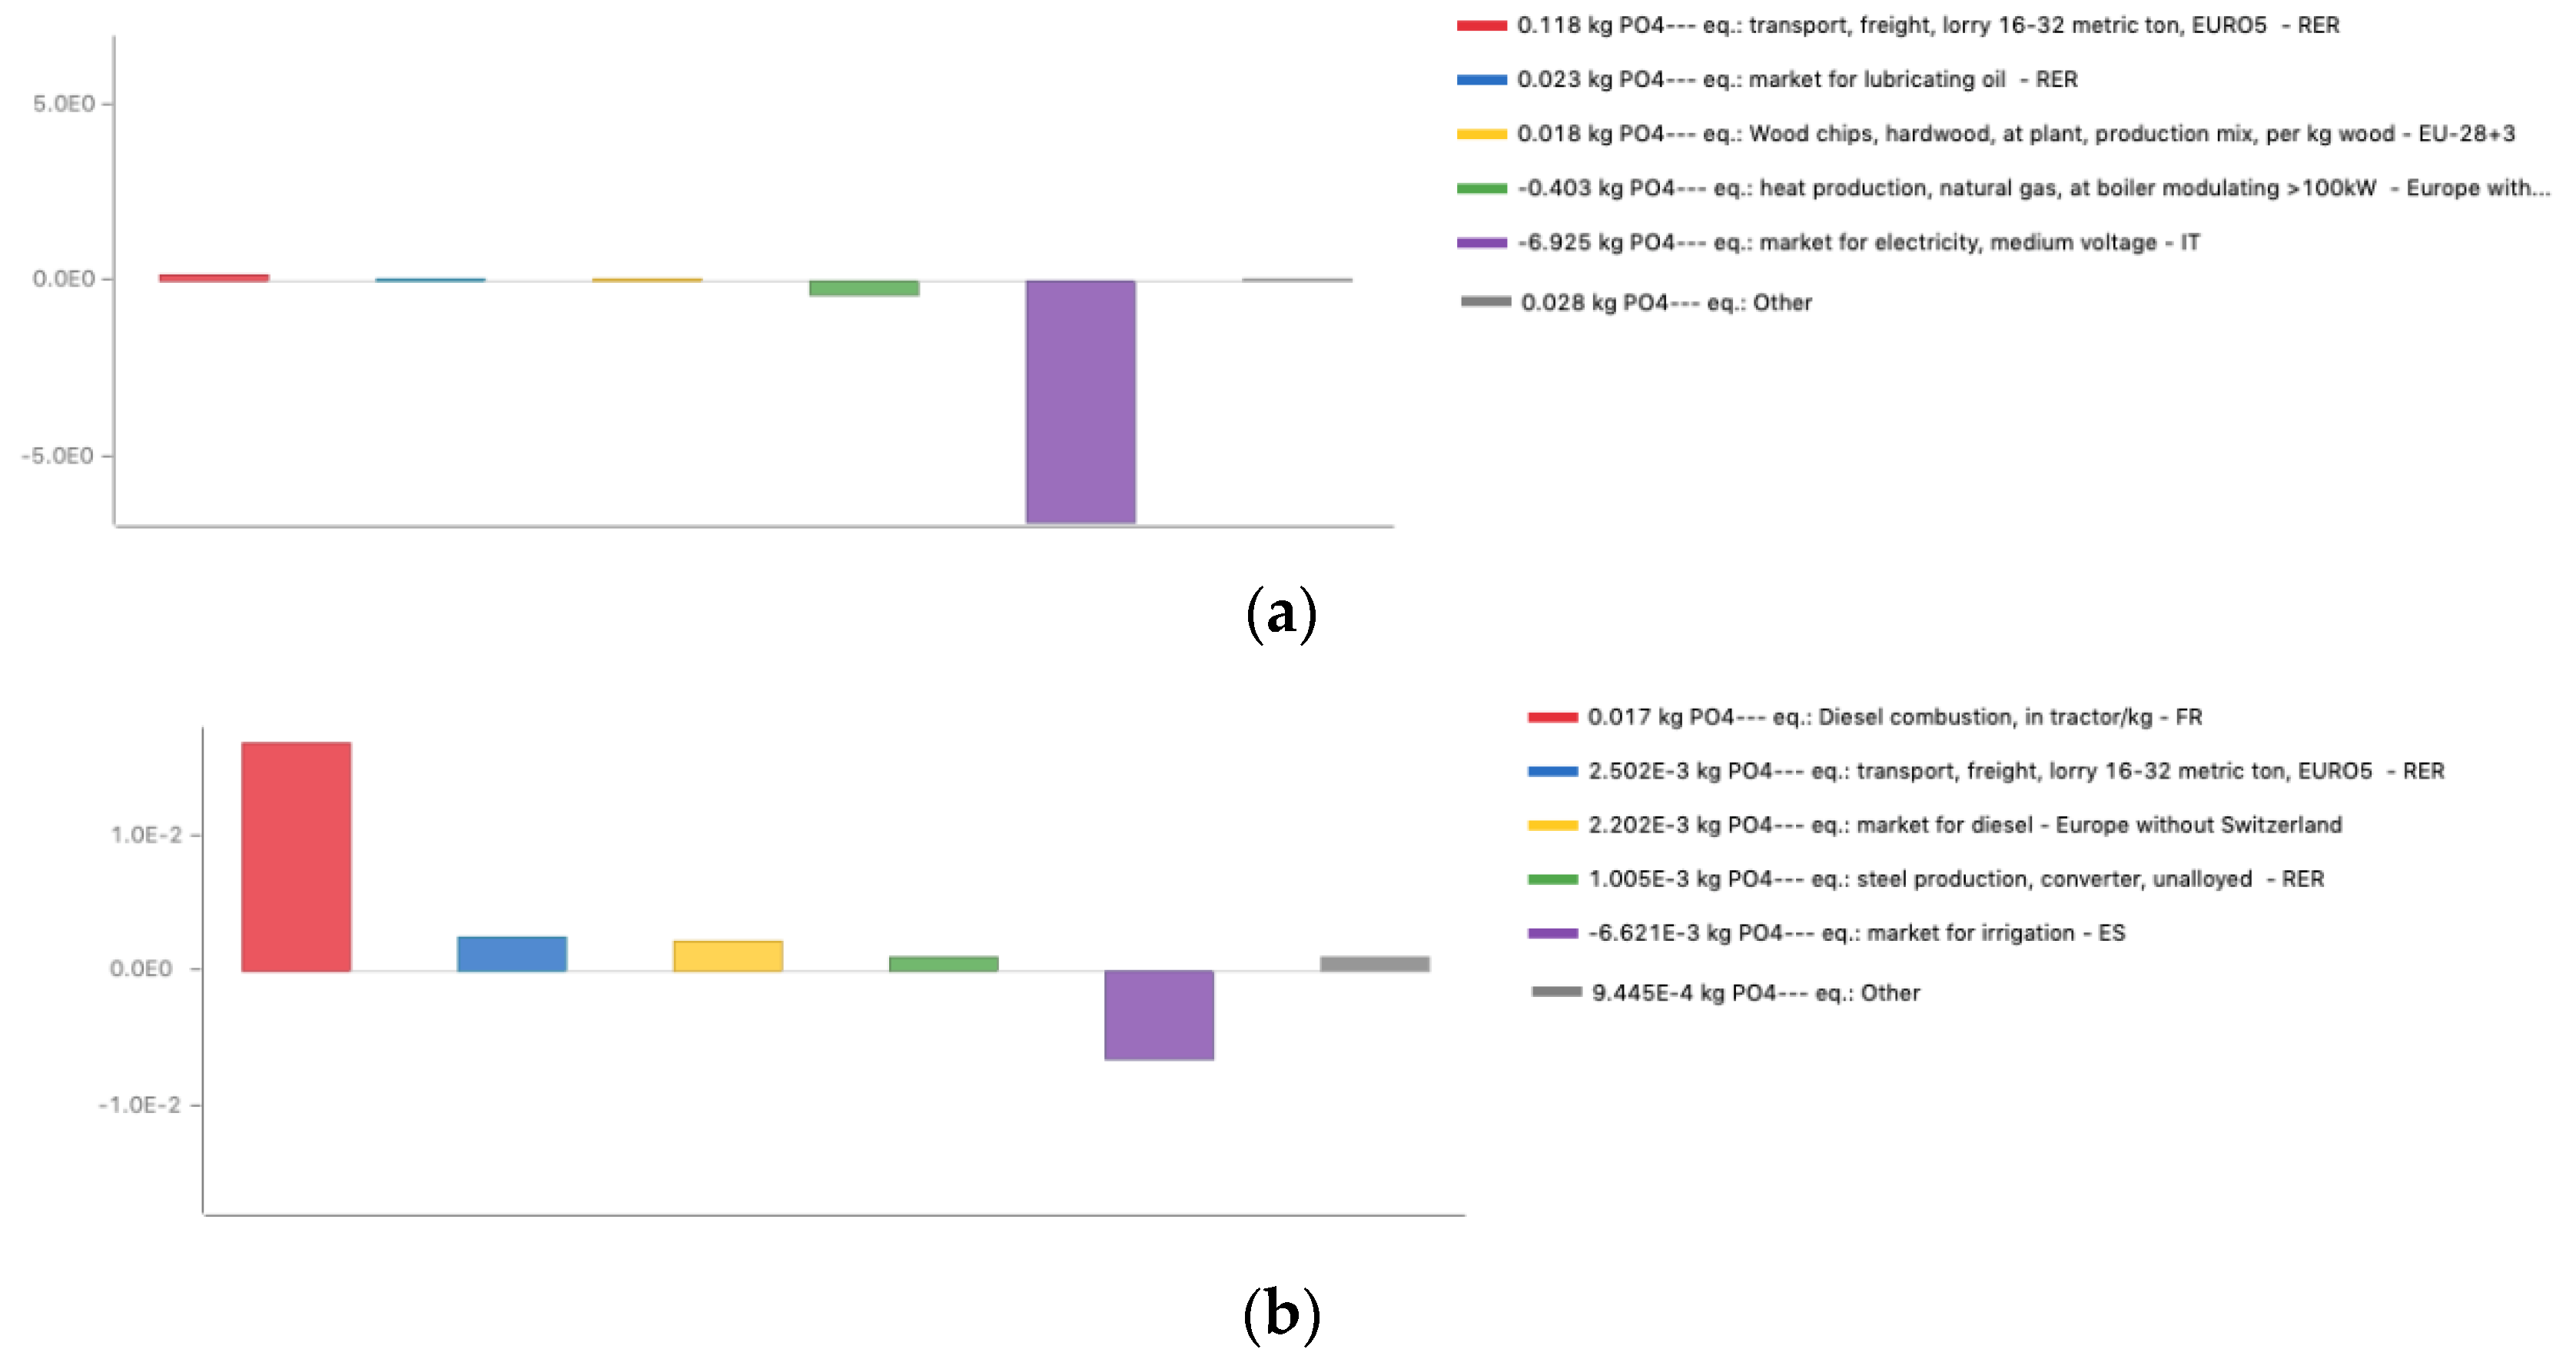
2.4.4. Eutrophication

Eutrophication includes all impacts due to excessive levels of macro-nutrients in the environment caused by emissions of nutrients into the air, water, and soil, which leads to abnormal productivity. This leads to a change in the natural equilibrium and to an overgrowth of plants such as algae in rivers, which causes reductions in water quality and animal populations. Eutrophication is strictly dependent on emissions of ammonia, nitrates, nitrogen oxides, and phosphorus [105,106,107]. A relevant anthropogenic source is the use of synthetic fertilizers. Eutrophication potential (EP) is expressed in kg phosphate equivalents (kg PO43− eq.).

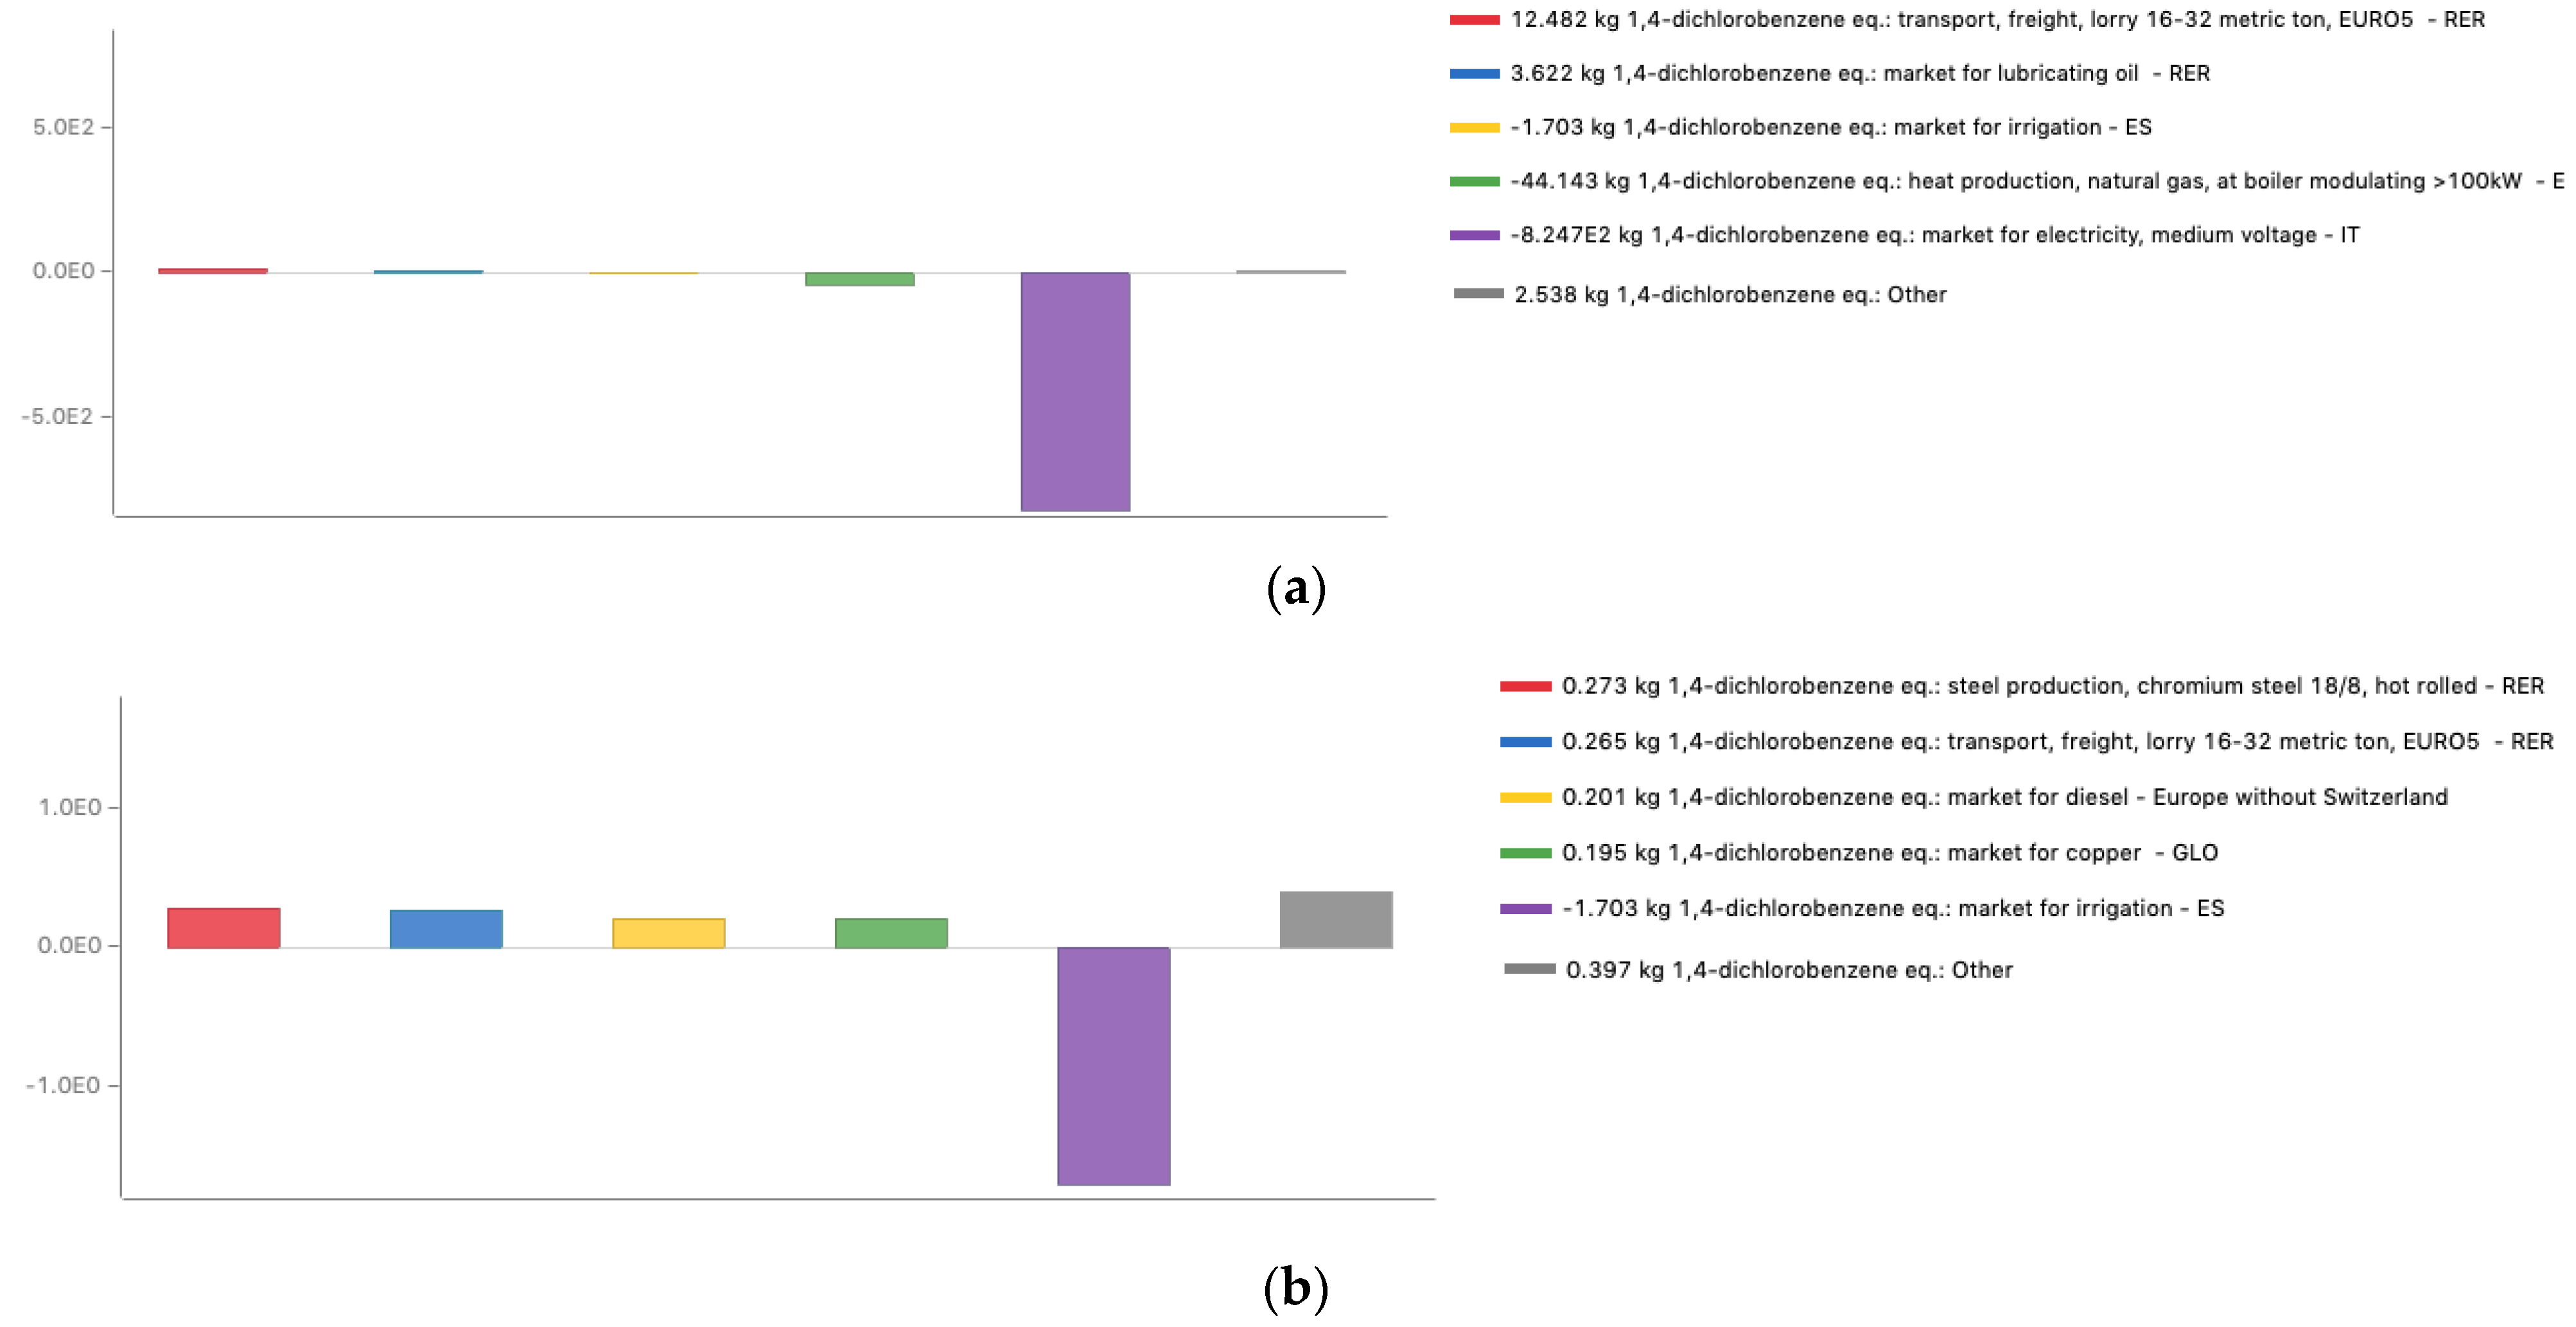
2.4.5. Freshwater Aquatic Ecotoxicity

This impact category indicator considers the impact of emissions of toxic substances into the air, water, and soil on freshwater ecosystems. The freshwater aquatic ecotoxicity potential (FAETP) describes the fate, exposure, and effects of toxic substances [108,109,110]. Results are expressed as kg 1,4-dichlorobenzene equivalents (kg 1,4-dichlorobenzene eq.).

2.4.6. Human Toxicity

Human toxicity concerns the effects of toxic substances on the human environment (with the exclusion of work environments). Human toxicity potentials (HTP) describe fate, exposure, and the effects of toxic substances [111,112]. The impact of a compound is affected by the amount emitted, the mobility of the substance, its persistence, exposure patterns and bioavailability, as well as its intrinsic toxicity. Results for human toxicity are expressed as kg 1,4-dichlorobenzene equivalents (kg 1,4-dichlorobenzene eq.).

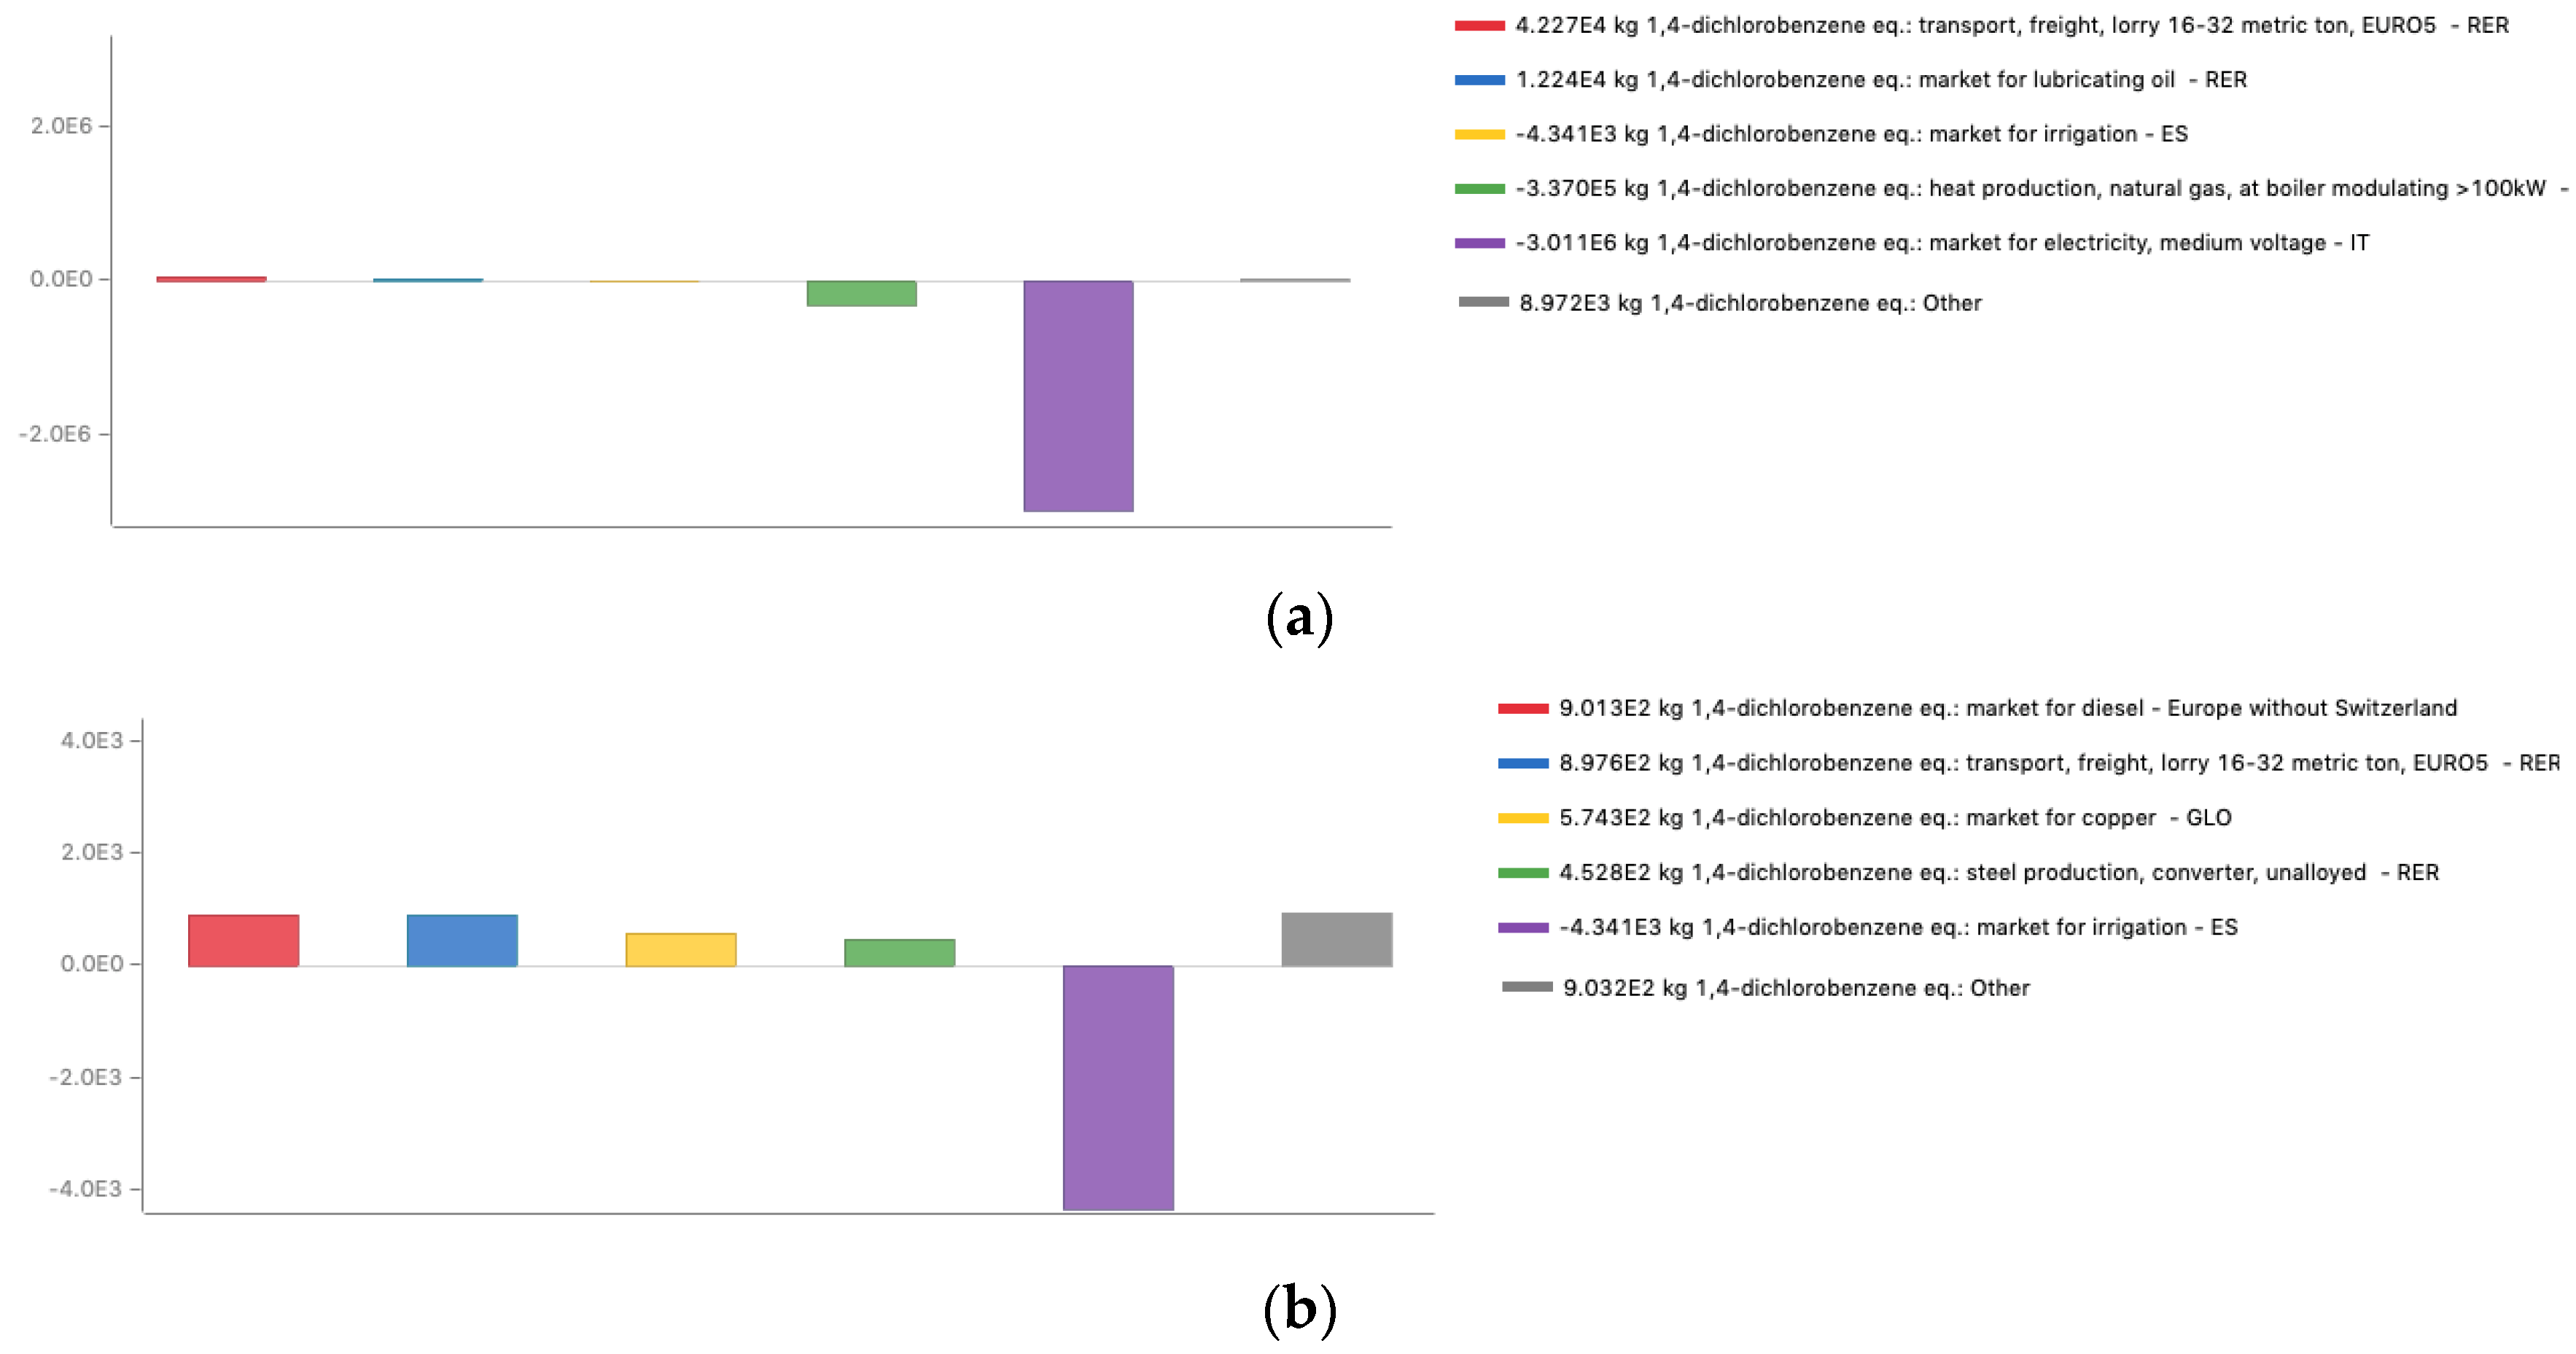
2.4.7. Marine Aquatic Ecotoxicity

This impact category indicator refers to the impacts of toxic substances on marine ecosystems. The impact pathway includes fate, exposure, effect, and severity factors [113]. Marine aquatic ecotoxicity potentials (MAETP) are expressed as kg 1,4-dichlorobenzene equivalents emission (kg 1,4-dichlorobenzene eq.).

2.4.8. Ozone Layer Depletion

The characterization factor for ozone layer depletion (O3) accounts for the destruction of the stratospheric ozone layer by anthropogenic emissions of ozone-depleting substances [114,115].
Chlorofluorocarbons (CFC), halons, and hydrochlorofluorocarbons (HCFC) are the main causes of ozone depletion. Damage to the ozone layer reduces its ability to prevent ultraviolet (UV) radiation from entering the atmosphere, increasing the amount of UV-B radiation reaching the earth’s surface. Long-term exposure to high levels of UV-B threatens human health and damages most animals and plants. Ozone depletion potentials (ODP) are expressed as kg trichlorofluoromethane (CCl3F) equivalent (kg CFC-11 eq.).

2.4.9. Photochemical Oxidation

Ozone is protective in the stratosphere, but on the ground level, it is toxic to humans in high concentrations. Photochemical ozone, also known as “Tropospheric ozone”, is formed by the reaction of volatile organic compounds and nitrogen oxides in the presence of both heat and sunlight [116,117,118]. This impact category depends largely on the amounts of carbon monoxide (CO), sulfur dioxide (SO2), nitrogen oxide (NO), ammonium (NH4+), and NMVOC (non-methane volatile organic compounds) involved. The photochemical ozone creation potential (POCP) for emission of substances into air is expressed using units of kg ethylene (C2H4) equivalent (kg ethylene eq.).

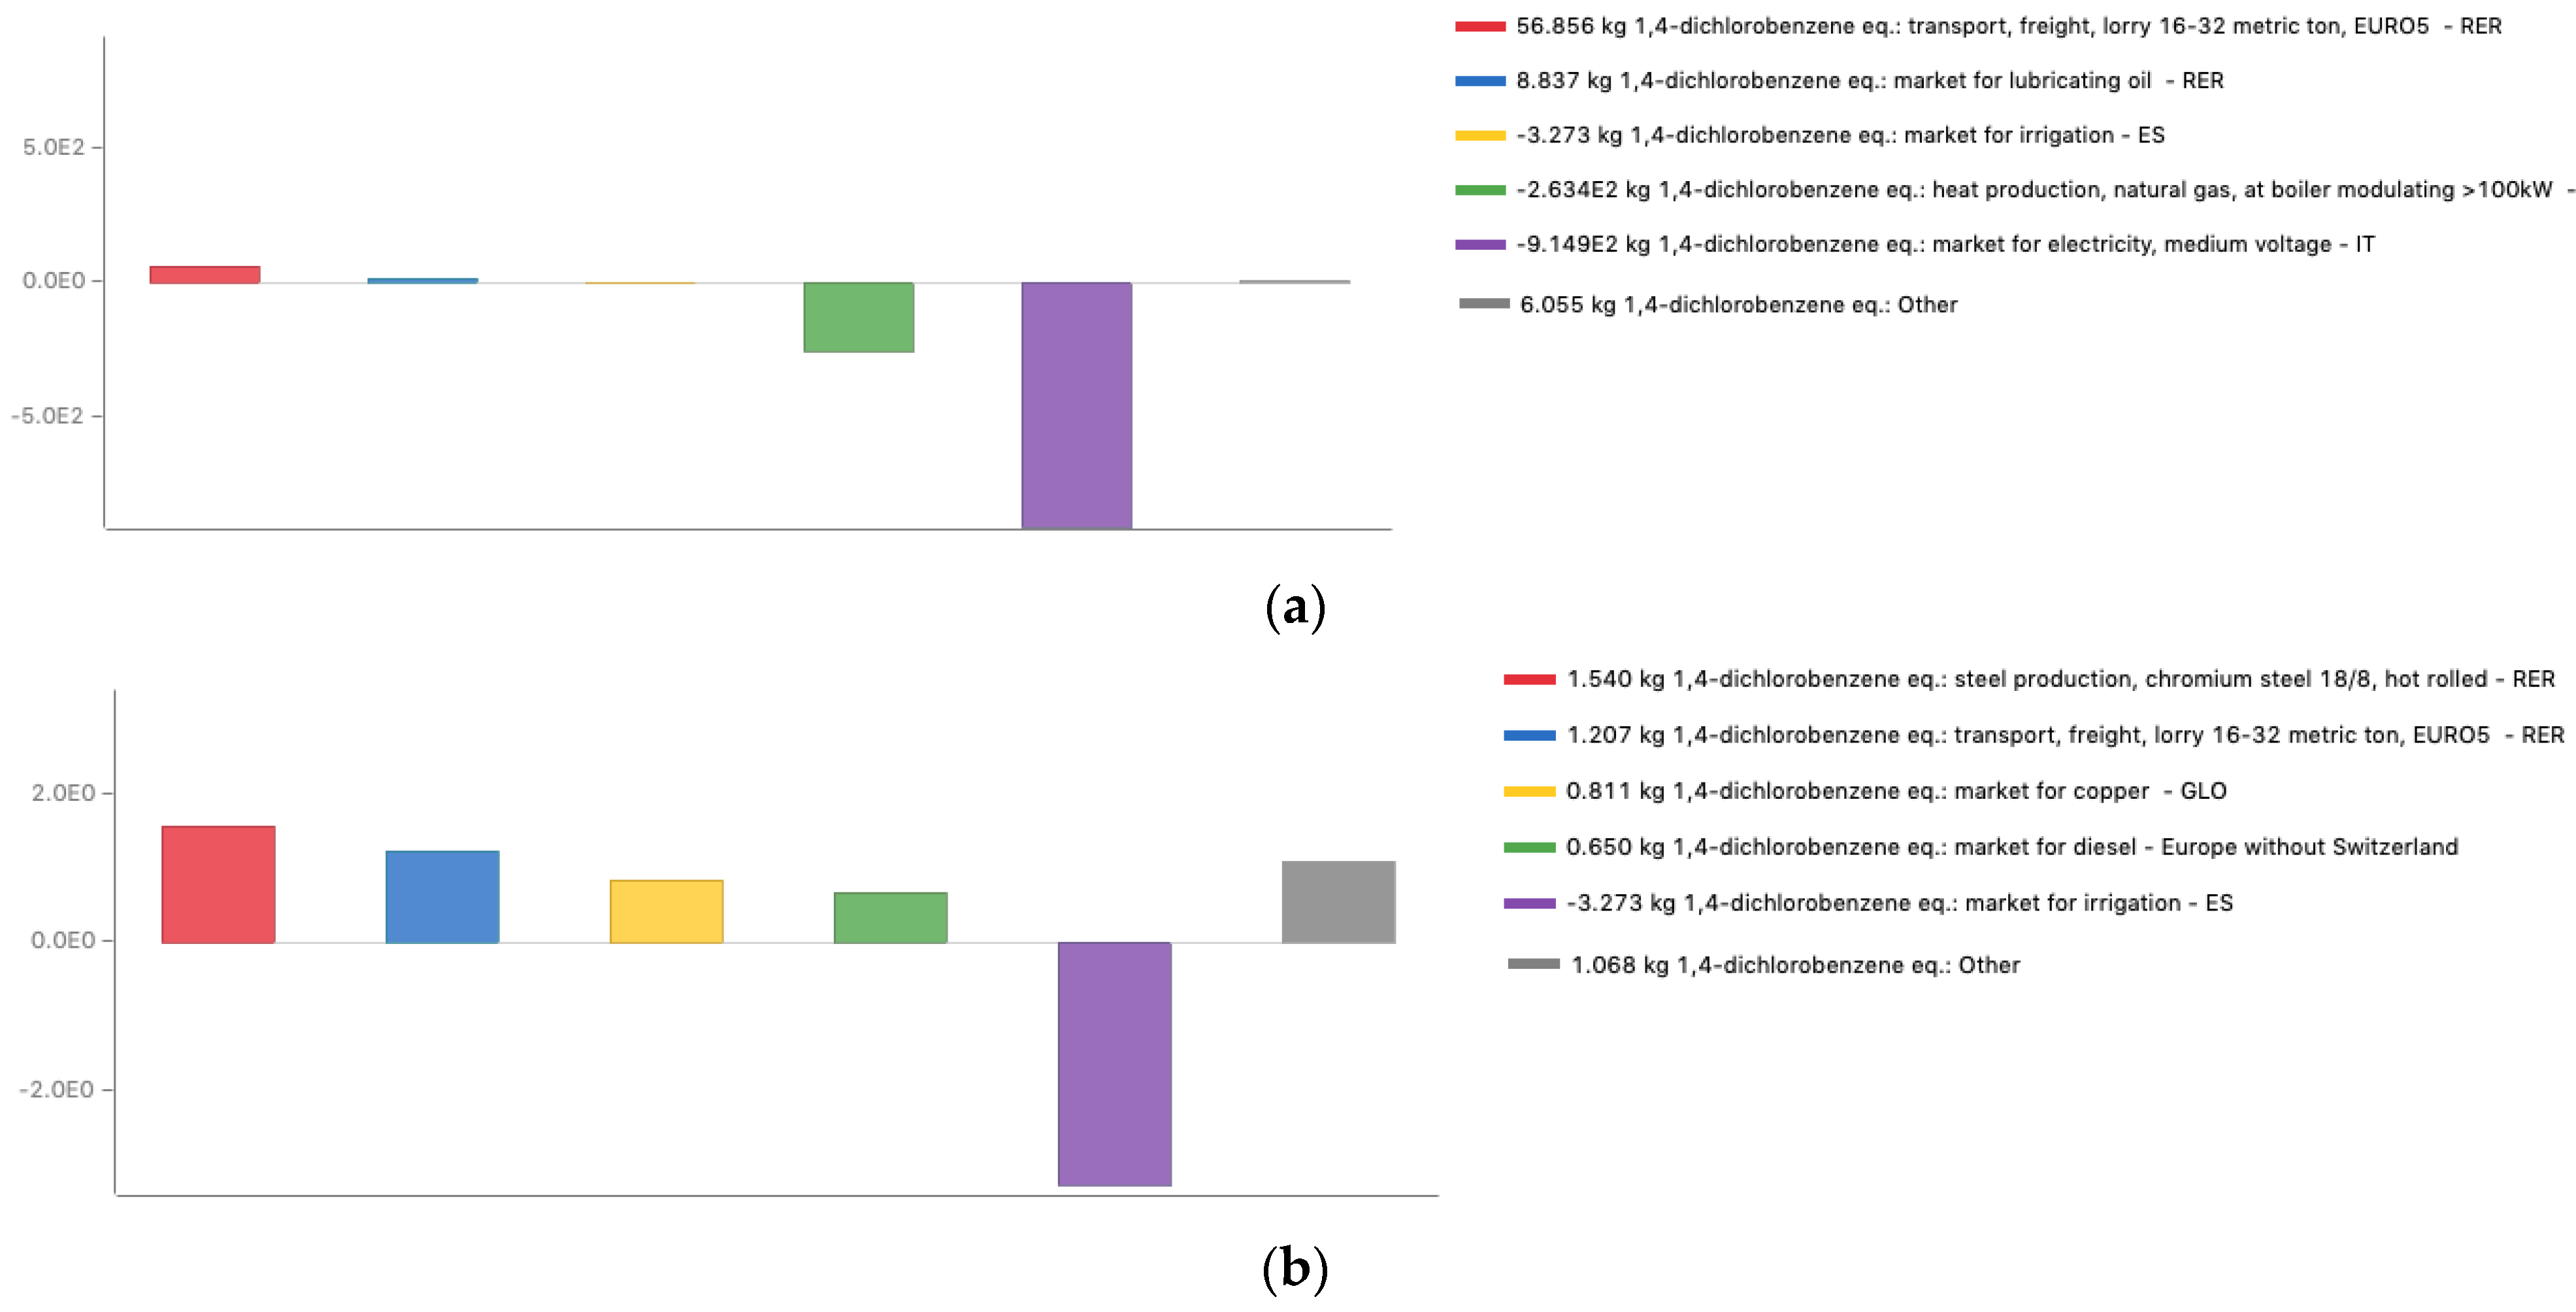
2.4.10. Terrestrial Ecotoxicity

Terrestrial ecotoxicity indicates the impact of toxic compounds such as heavy metals (zinc, lead, nickel, cadmium, and copper) emitted into terrestrial ecosystems (air, water, and soil), affecting humans, flora, and fauna [119,120,121]. The amount emitted, the mobility of the substance, its persistence, exposure patterns, and bioavailability, as well as its toxicity, all influence its impact. The terrestrial ecotoxicity potential (TETP) is expressed as kg of 1,4-dichlorobenzene (C6H4Cl2) equivalents (kg 1,4-dichlorobenzene eq.).

3. Results

To gain a specific view of the emissions released throughout the life cycle (from the cradle to the grave) and from the biochar application to soil alone (a downstream process), the results of the LCIA from a cradle-to-grave and a downstream process perspective are reported in Table 5 in terms of CML baseline categories [98].
Concerning the cradle-to-grave results, the negative values mean that environmental savings were generated by avoiding the use of products during biochar production and its application in soil and thanks to its carbon sequestration and emission mitigation capabilities, while positive values represented a load for the environment. In this evaluation, there were no positive values indicating any benefits related to the biochar studied supply chain.
In general, the largest contribution was mainly attributable to the production of renewable energy (heat and electricity) by gasification and therefore to the replacement of fossil fuels, which was also the main purpose of the plant analyzed in this study. The data on the Italian energy mix for the production of electricity, provided by the Italian energy services manager “GSE”, are reported in Table S9 (Supplementary S1: Data used in LCI) [122].
In the downstream process, only three categories had net negative impacts (Climate change-GWP100, Freshwater, and marine aquatic ecotoxicity), even though the categories with positive impacts had very low values.
The results of the impacts for each category are described and discussed below.

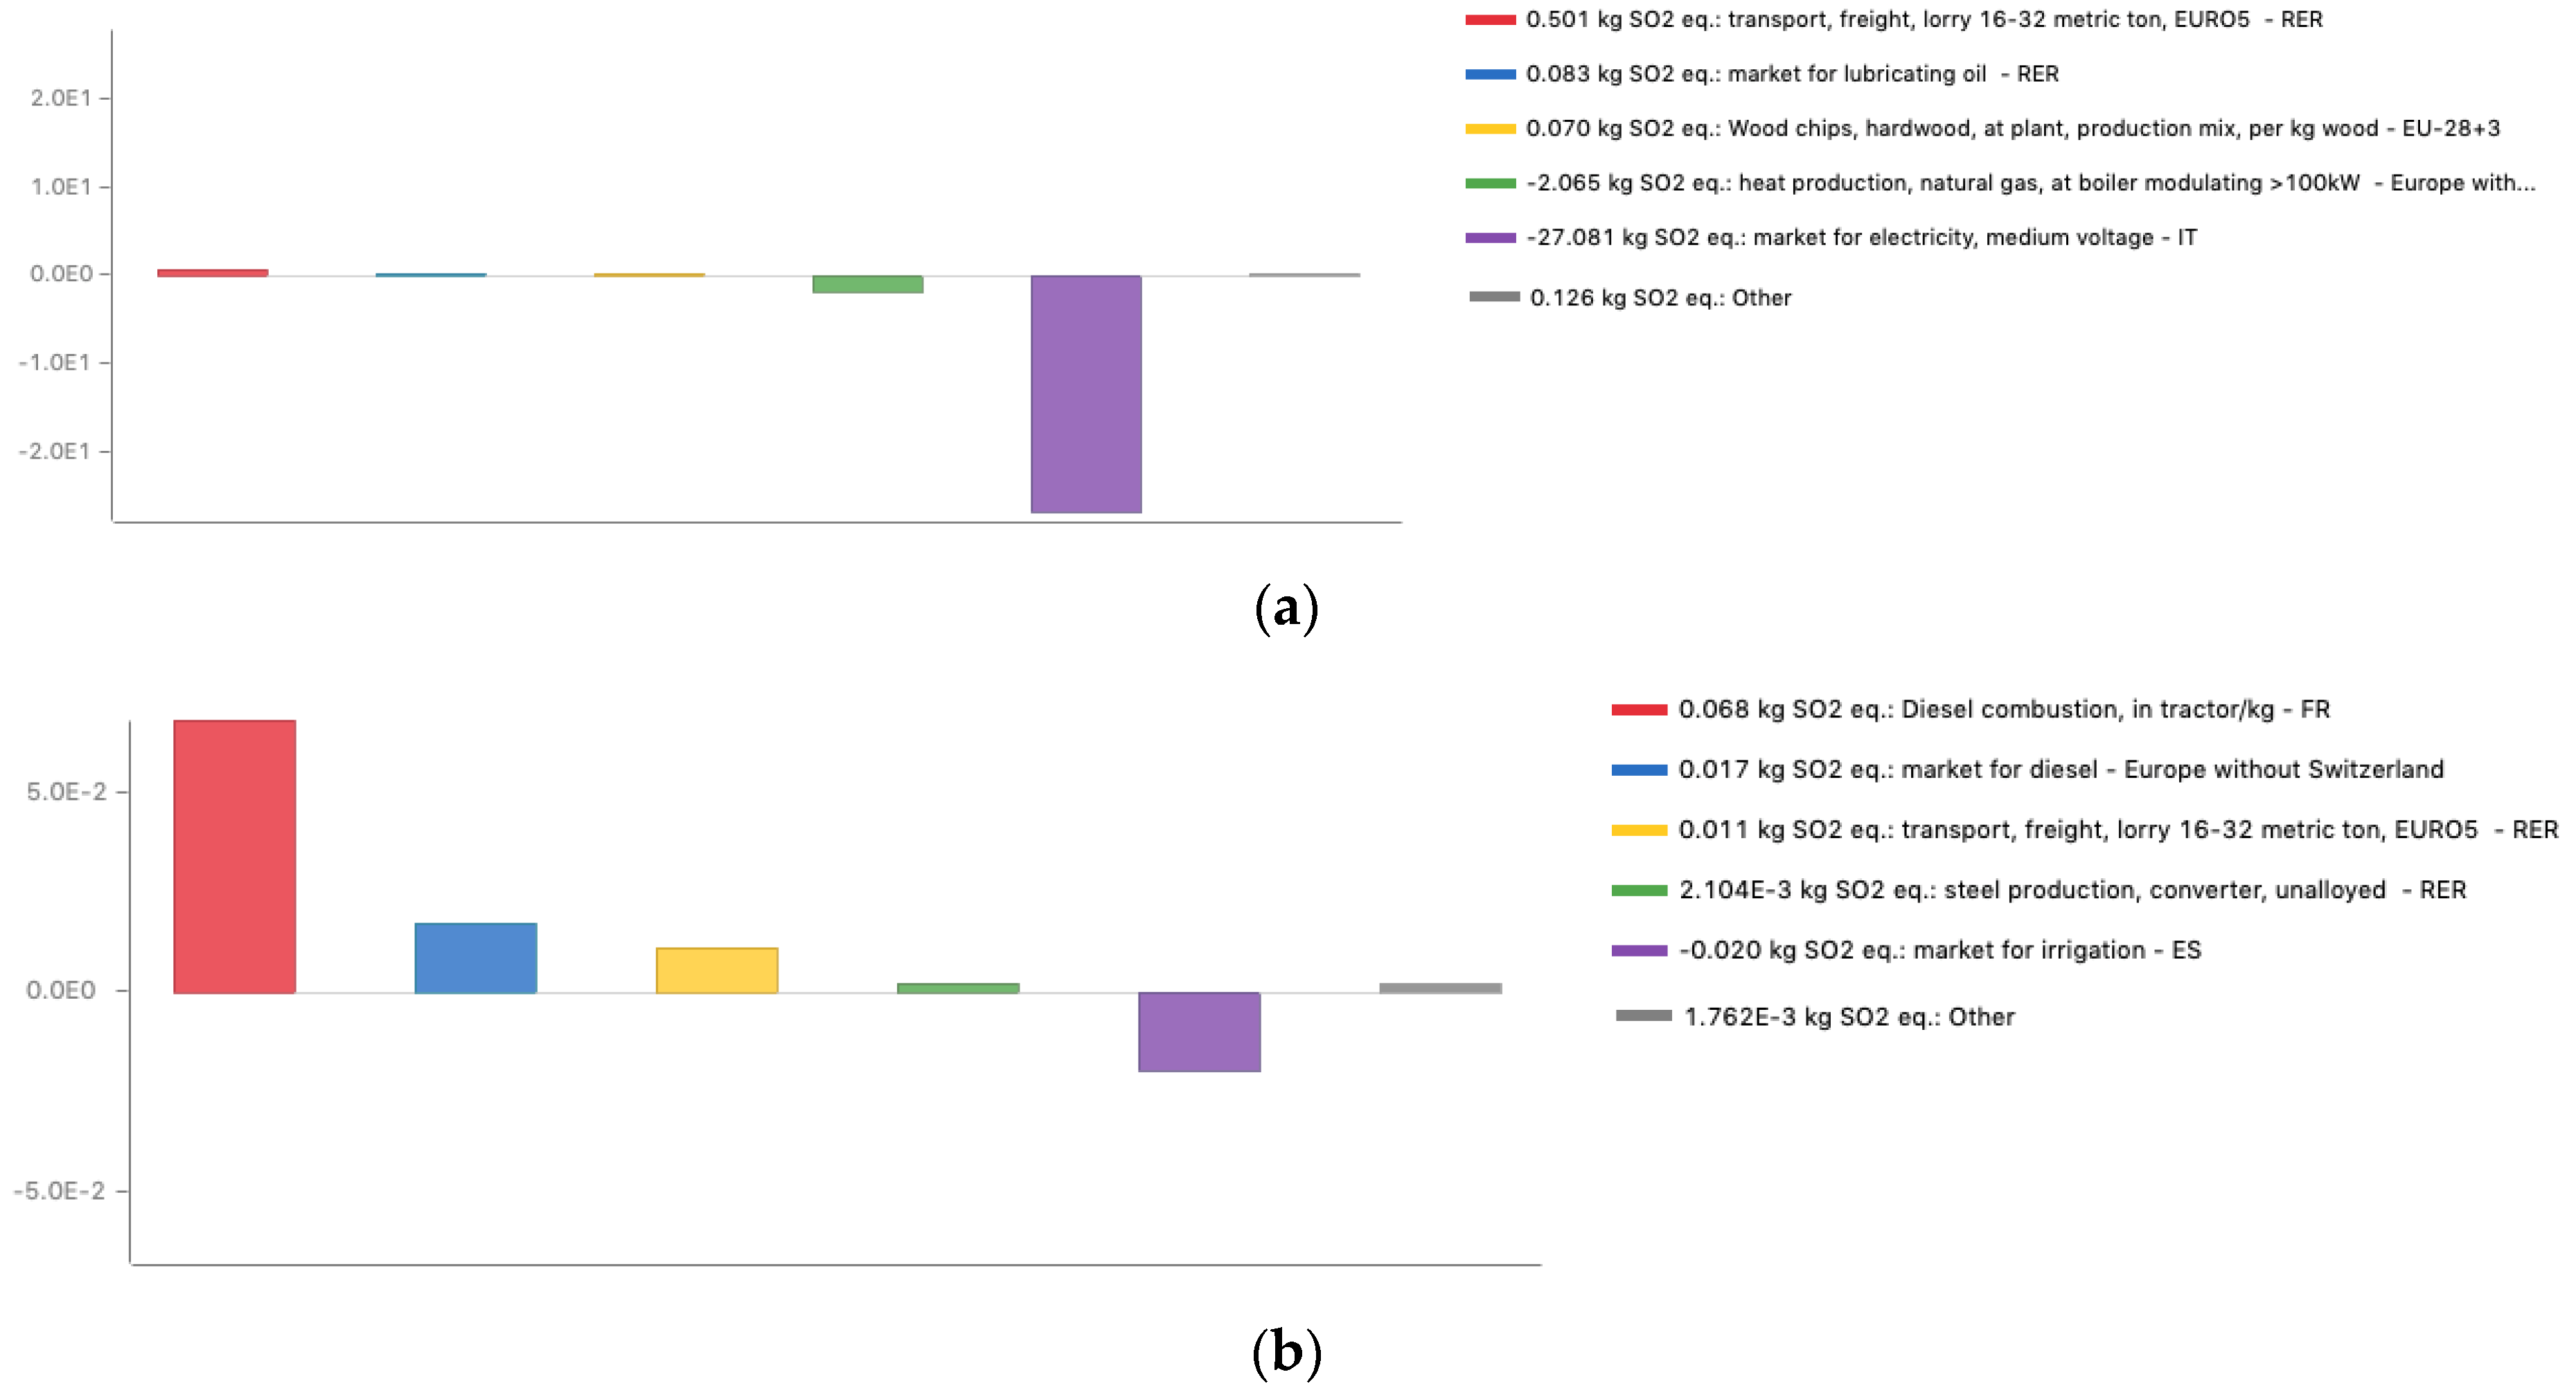
3.1. Acidification Potential

As shown in Figure 3a, the main positive impact in this category was given by the transport (0.50 kg SO2 eq.), which includes that of the biomass, large-bags, and biochar to agricultural fields. The electricity produced by the plant, which replaced that generated with the Italian energy mix, was the main avoided product that ensured the process as well as a negative acidification potential (−27.081 kg SO2 eq.). The electricity mix still contained a significant share of coal electricity (12.34%), associated with high emissions of acidifying substances—mainly sulfur dioxide and nitrous oxides from coal combustion.
Compared with the generated electricity, the avoided natural gas had a much lower relevance for acidification, since the combustion of natural gas is generally associated with low impacts in this category.
As can be seen from the results of the downstream process, shown in Figure 3b, the acidification potential was closely correlated with emissions due to the transport of biochar to agricultural fields as well as the tractors and machinery used for the application (spreader and rotary hoe) of biochar to the soil. The only relevant negative impact was due to a reduction in the practice of field irrigation, thanks to the water-holding capacity of the biochar (0.020 kg SO2 eq.).

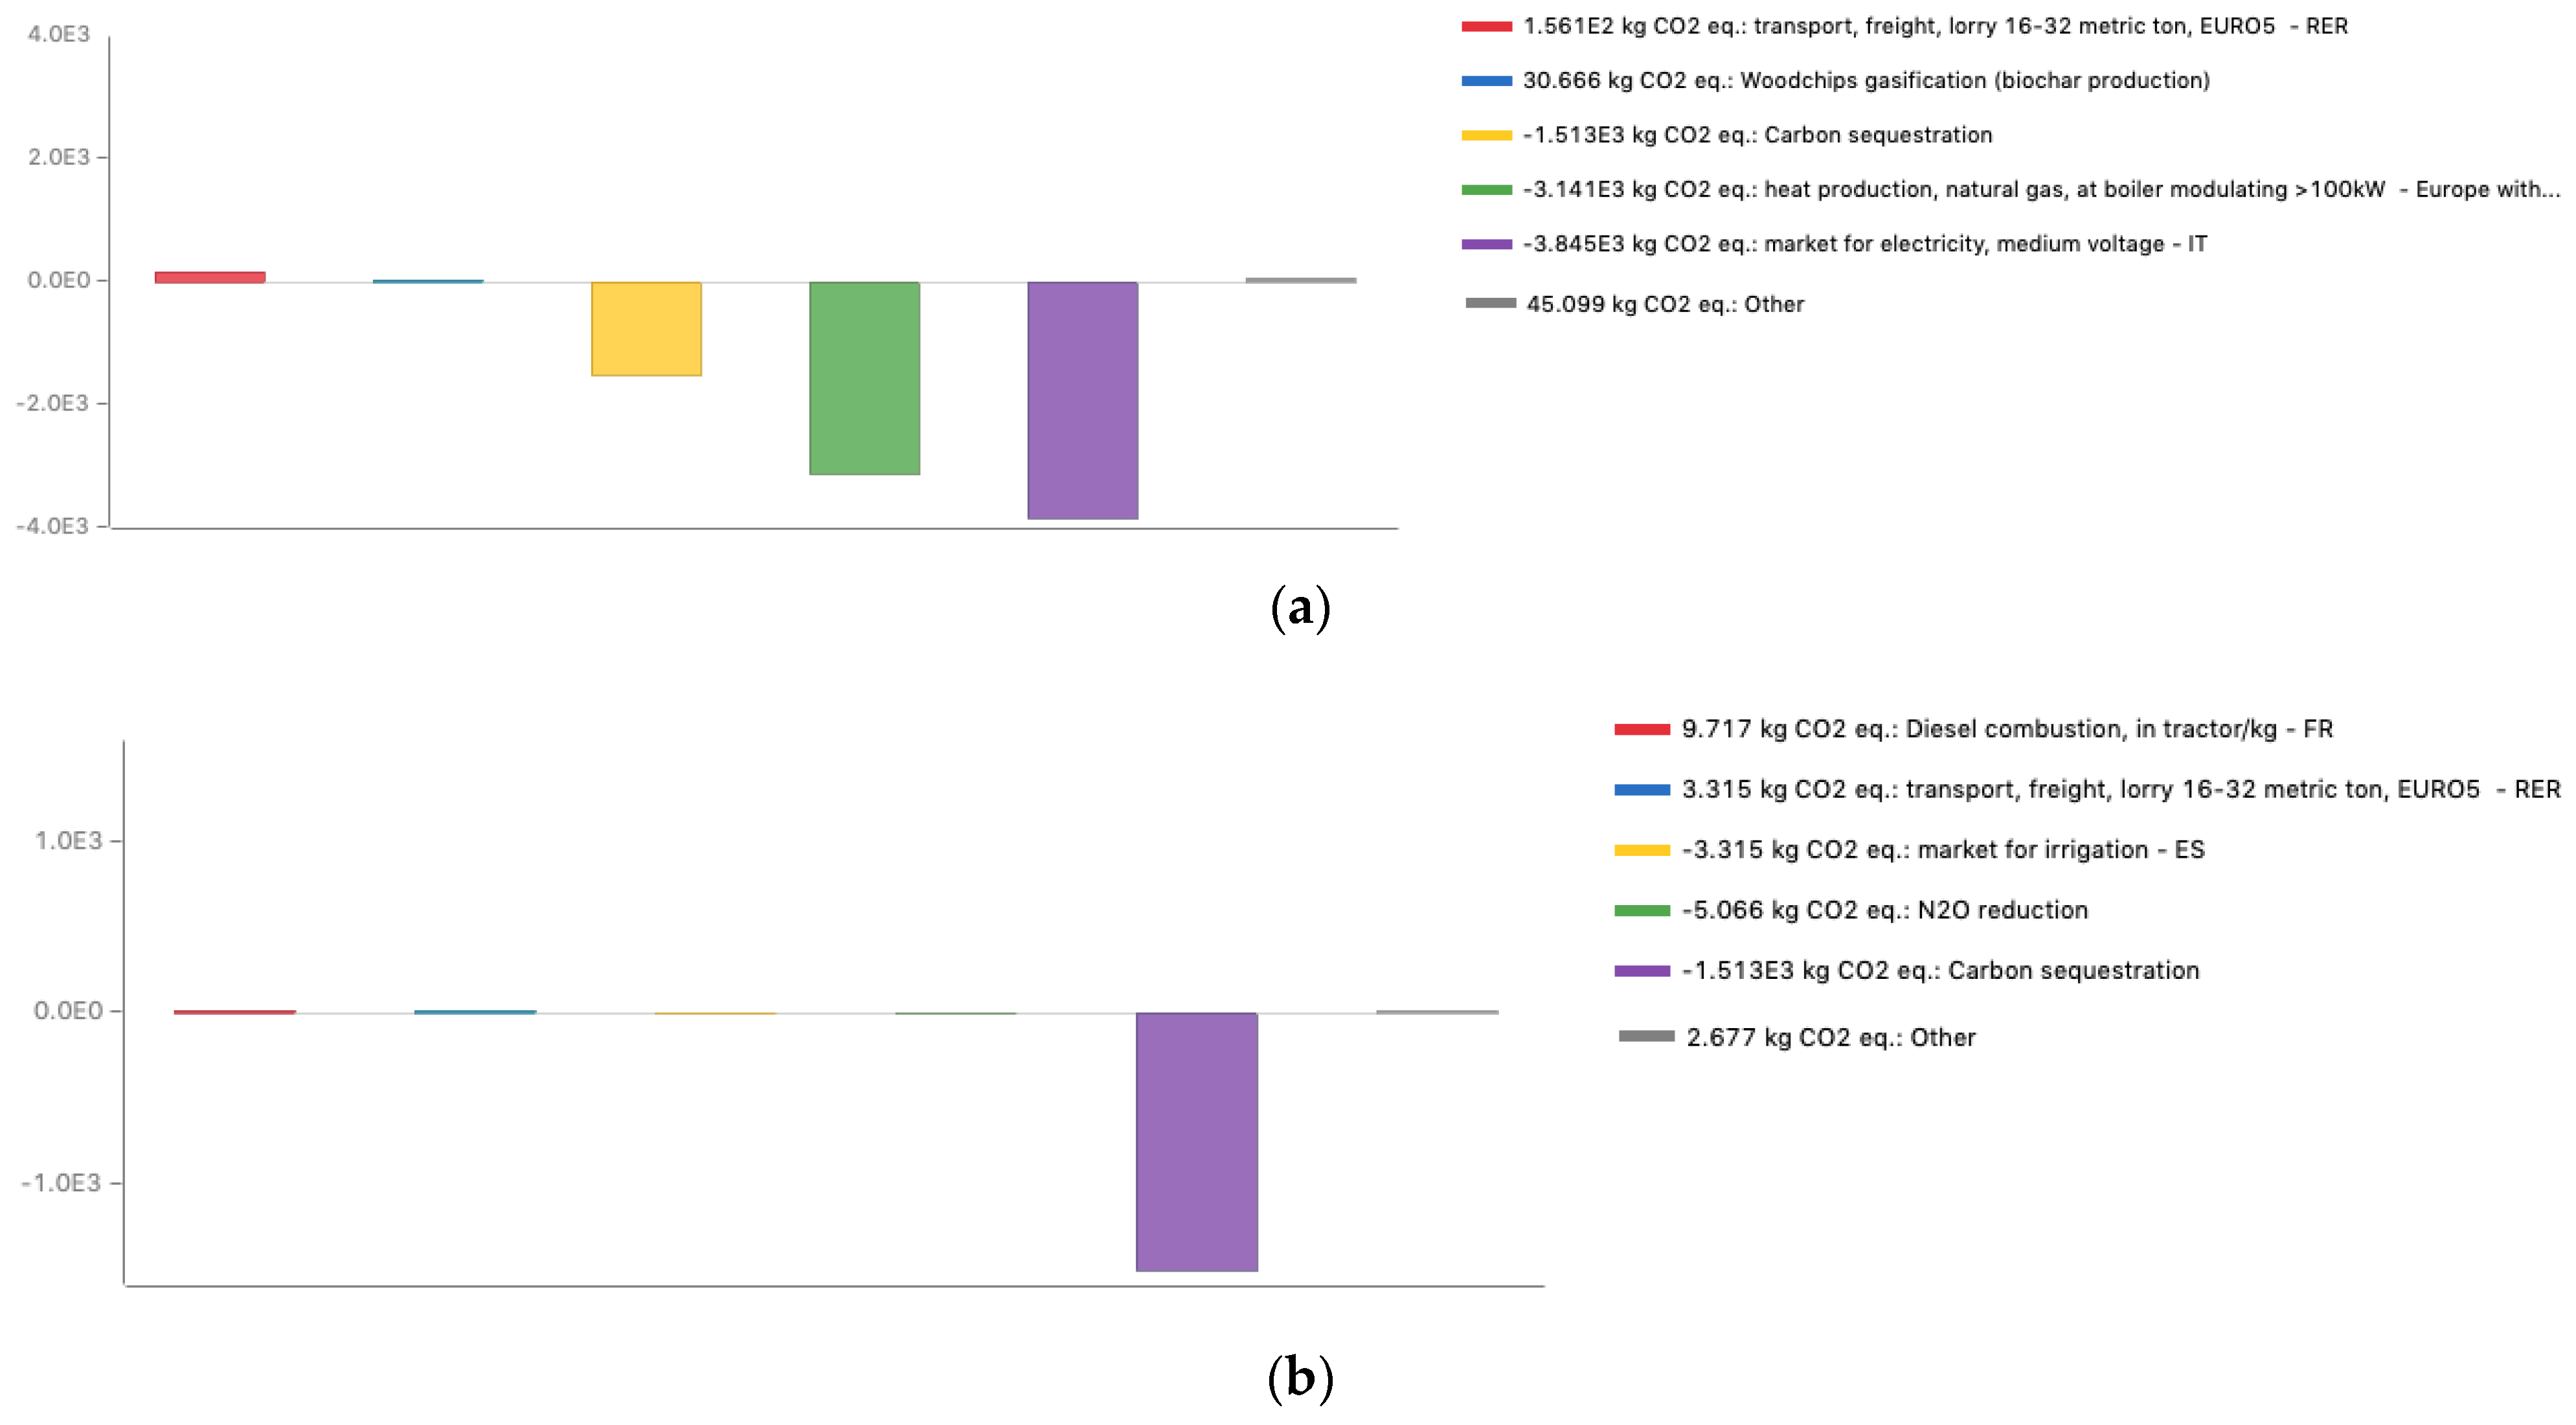
3.2. Climate Change–GWP 100

Under global warming aspects, negative GHG emissions were obtained with the energy-biochar system. This indicates that the supply chain currently adopted by the company had a favorable environmental impact. This cradle-to-grave result, shown in Figure 4a, was due to the production of renewable energy through the woodchip gasification process, which replaced in part energy produced with the use of fossil fuels, with a higher environmental impact. A positive value indicates emissions associated with transport operations, direct emissions from the gasification process itself, and other processes, such as feedstock production.
The largest contribution to climate change was from the avoided emissions from energy production, with values of −3844.940 kg CO2 eq. and −3141.180 kg CO2 eq. for electricity and heat, respectively. The next largest contribution was from the carbon sequestration capacity of biochar (−1513.070 kg CO2 eq.). The net fraction of carbon that may be effectively sequestered depends on the residence time of biochar in the soil, which is known to be very variable depending on the feedstock and the production process. Contributions from the indirect impacts of biochar application to soil, such as lower crop fertilizer requirements, lower soil N2O emissions, and a reduced need for irrigation are irrelevant, due to the low yield of biochar from the gasification process (5%).
On the contrary, as expected in the downstream process, GWP 100 was found to have a negative net value, due to the long-term carbon sequestration by biochar (−1505.741 kg CO2 eq.). Positive impacts were predominantly linked to emissions from transport and agricultural machinery.

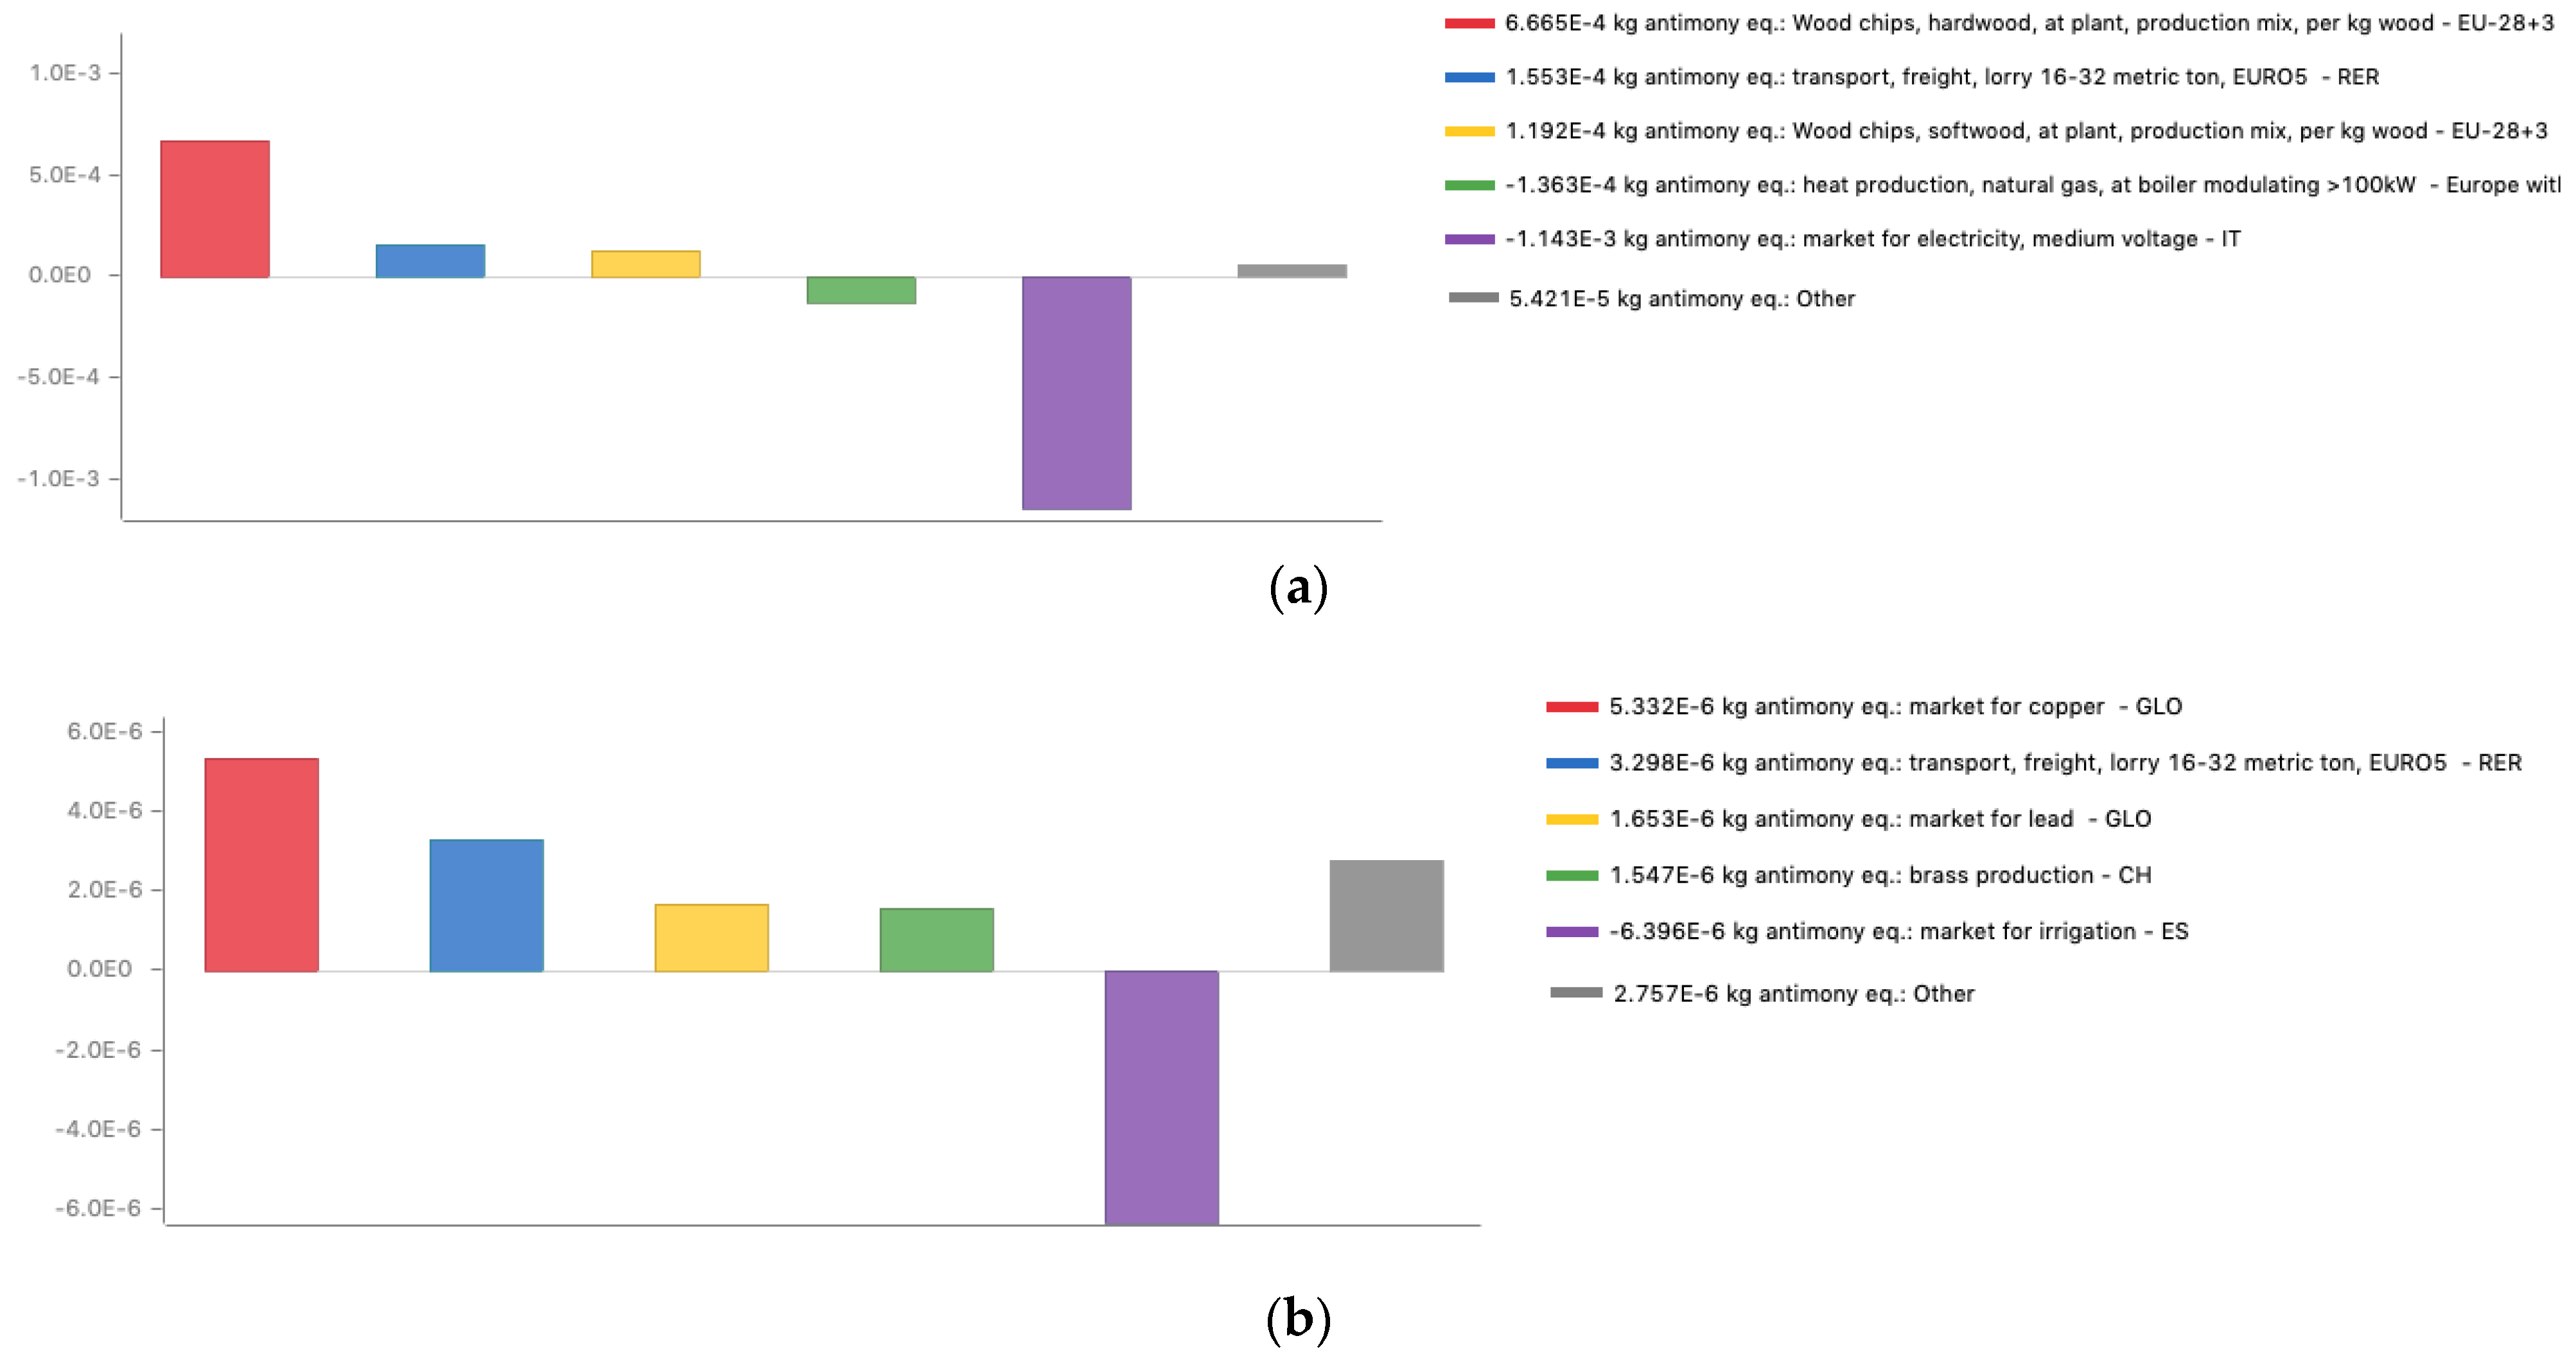
3.3. Depletion of Abiotic Resources—Elements, Ultimate Reserves

The abiotic resource balance of the cradle-to-grave perspective, shown in Figure 5a, could be considered equal to zero (−2.8 × 10⁻⁴ kg antinomy eq.), i.e., the resources that are consumed are approximately equal to the resources that are avoided. As in the other categories, the production of heat and energy had a negative impact, while the woodchip production and transport had a positive impact.
The abiotic resource balance in the downstream process, shown in Figure 5b, could be considered equal to zero (8.191 × 10⁻⁶ kg antinomy eq.), i.e., the resources that were consumed are approximately equal to the resources that are avoided. The reduction in irrigation almost totally compensated for the impacts resulting from the other processes (copper, lead, and brass production for the machinery manufacturing).

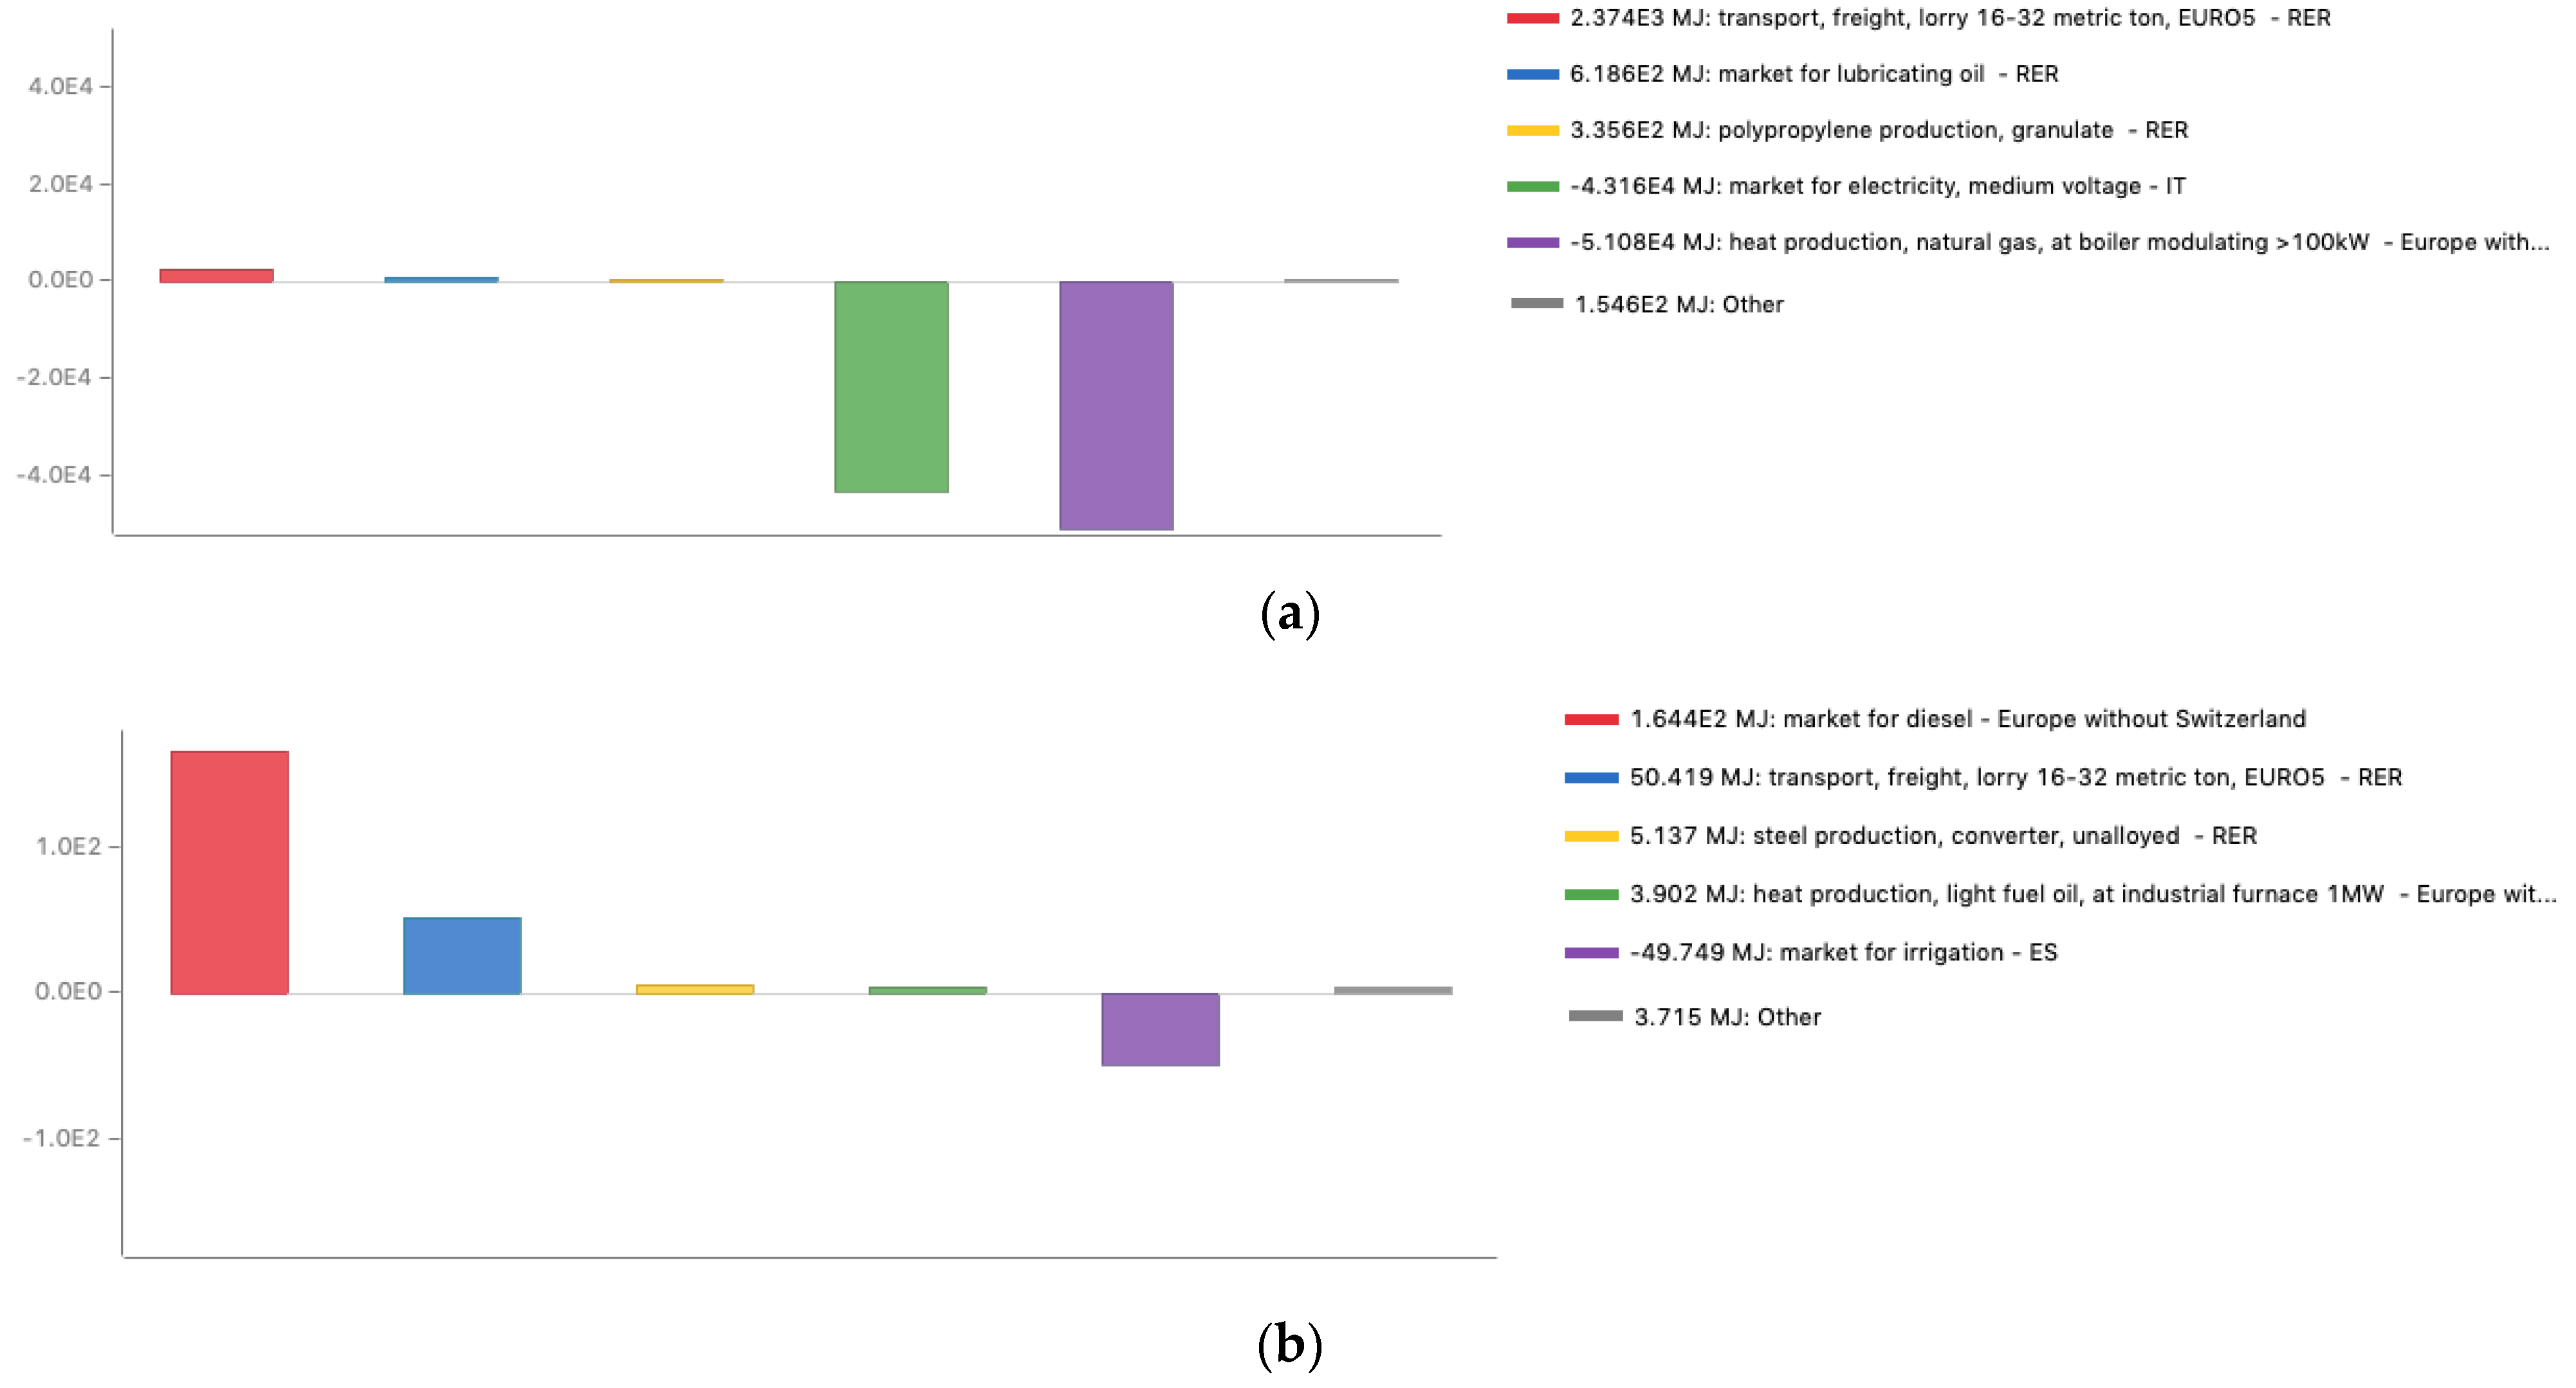
3.4. Depletion of Abiotic Resources—Fossil Fuels

From a cradle-to-grave perspective, shown in Figure 6a, the dominating factor for the depletion of fossil fuels wasthe negative contribution due to the displacement of fossil fuels from biochar co-products (electricity and heat), resulting in a high net reduction of abiotic depletion. The high net result for this category (−90,758.060 MJ) was the most predictable, as the process replaced the use of natural gas, petroleum products, and coal with the gasification of woody biomass. The principal positive contributors, although they had only low-impacting values, were transport, lubricating oil consumption, and polypropylene production for the large bags.
In the downstream process, shown in Figure 6b, depletion of fossil fuels, of course, was the impact category most closely related to emissions from burning fossil fuels. Consequently, the net value was positive and was equal to 177.783 MJ.

3.5. Eutrophication

In the cradle-to-grave results, shown in Figure 7a, the characterized index of eutrophication was found to be −7.140 kg PO43− eq. per 1-ton biochar produced and applied to the soil. Additionally, in this case, the electricity production from the gasification process in place of that produced with the Italian energy mix was the process that had the largest effect (−6.925 kg PO43− eq.), mainly due to the emissions of ammonia, nitrogen oxides, and phosphate.
In the downstream process of eutrophication impact, shown in Figure 7b, the main positive contribution was given by the direct combustion of fuel by agricultural machinery (0.017 kg PO43− eq.) and by transport (0.003 kg PO43− eq.). A modest negative contribution related to the impacts avoided by reducing the use of irrigation (−0.007 kg PO43− eq.). The “other” category also included the impacts avoided following the reduction of chemical fertilizers due to biochar properties (i.e., the reductions of ammonium nitrate, phosphoric acid, and potassium chloride fertilizers had a negative impact equal to −7 × 10⁻⁴, −4.7 × 10⁻⁴ and −3 × 10⁻⁵ kg PO43- eq., respectively).

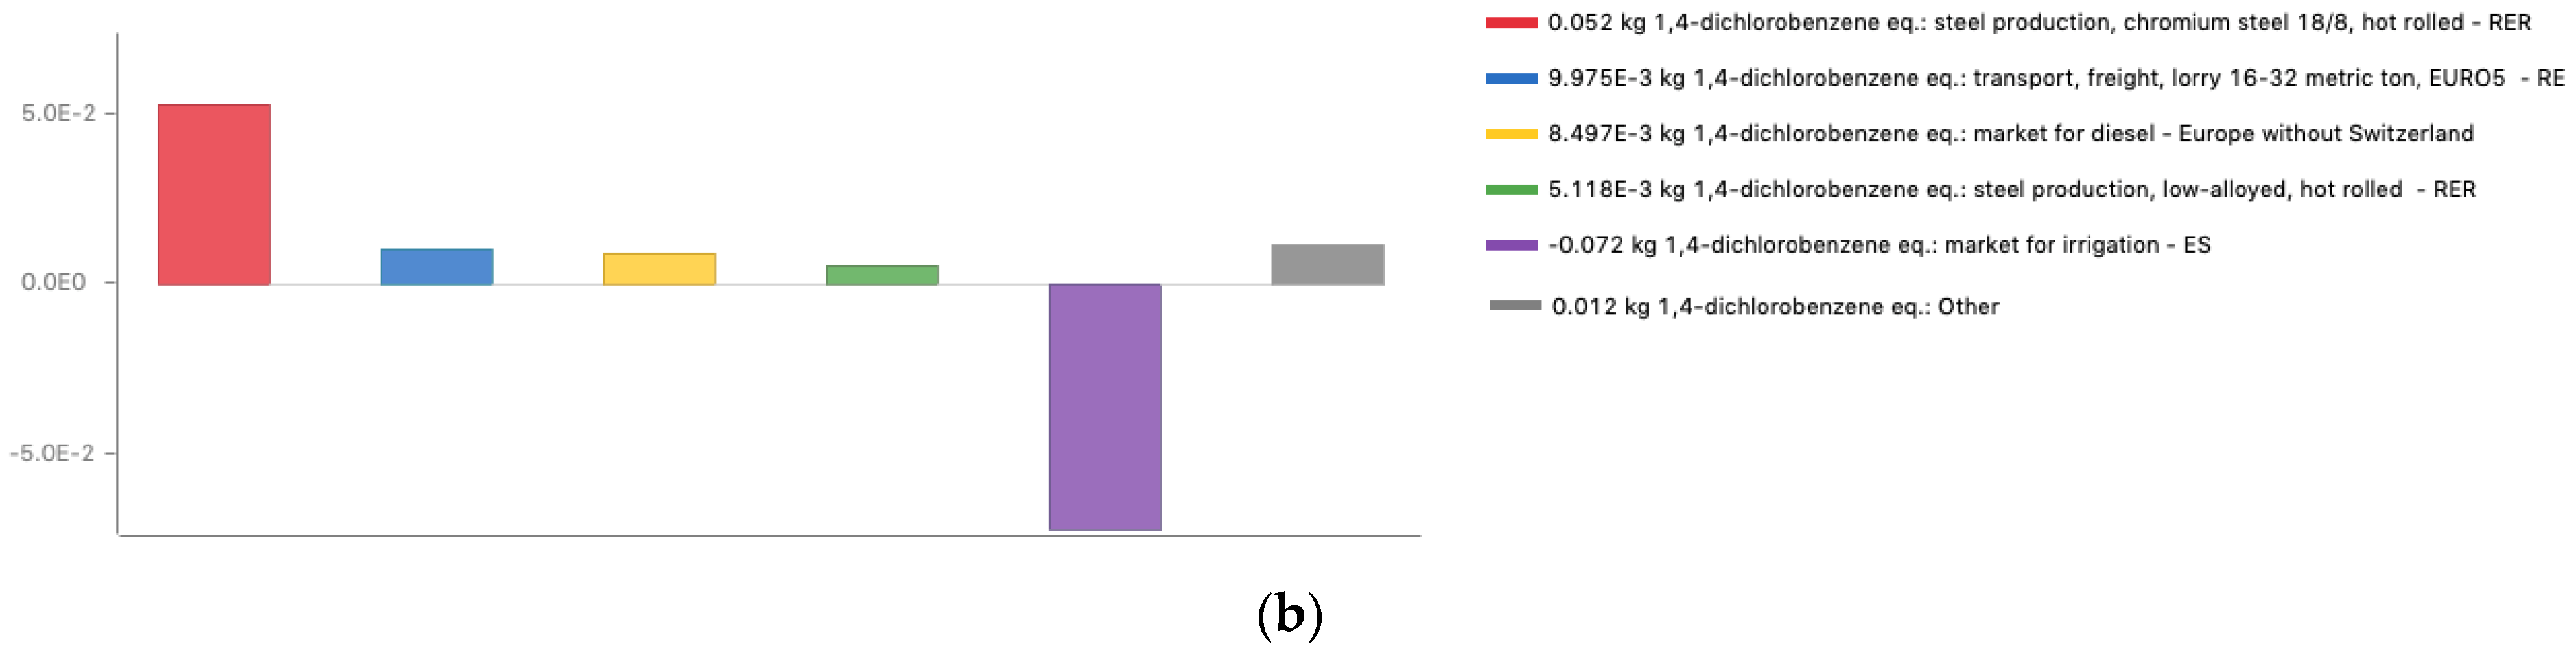
3.6. Freshwater Aquatic Ecotoxicity
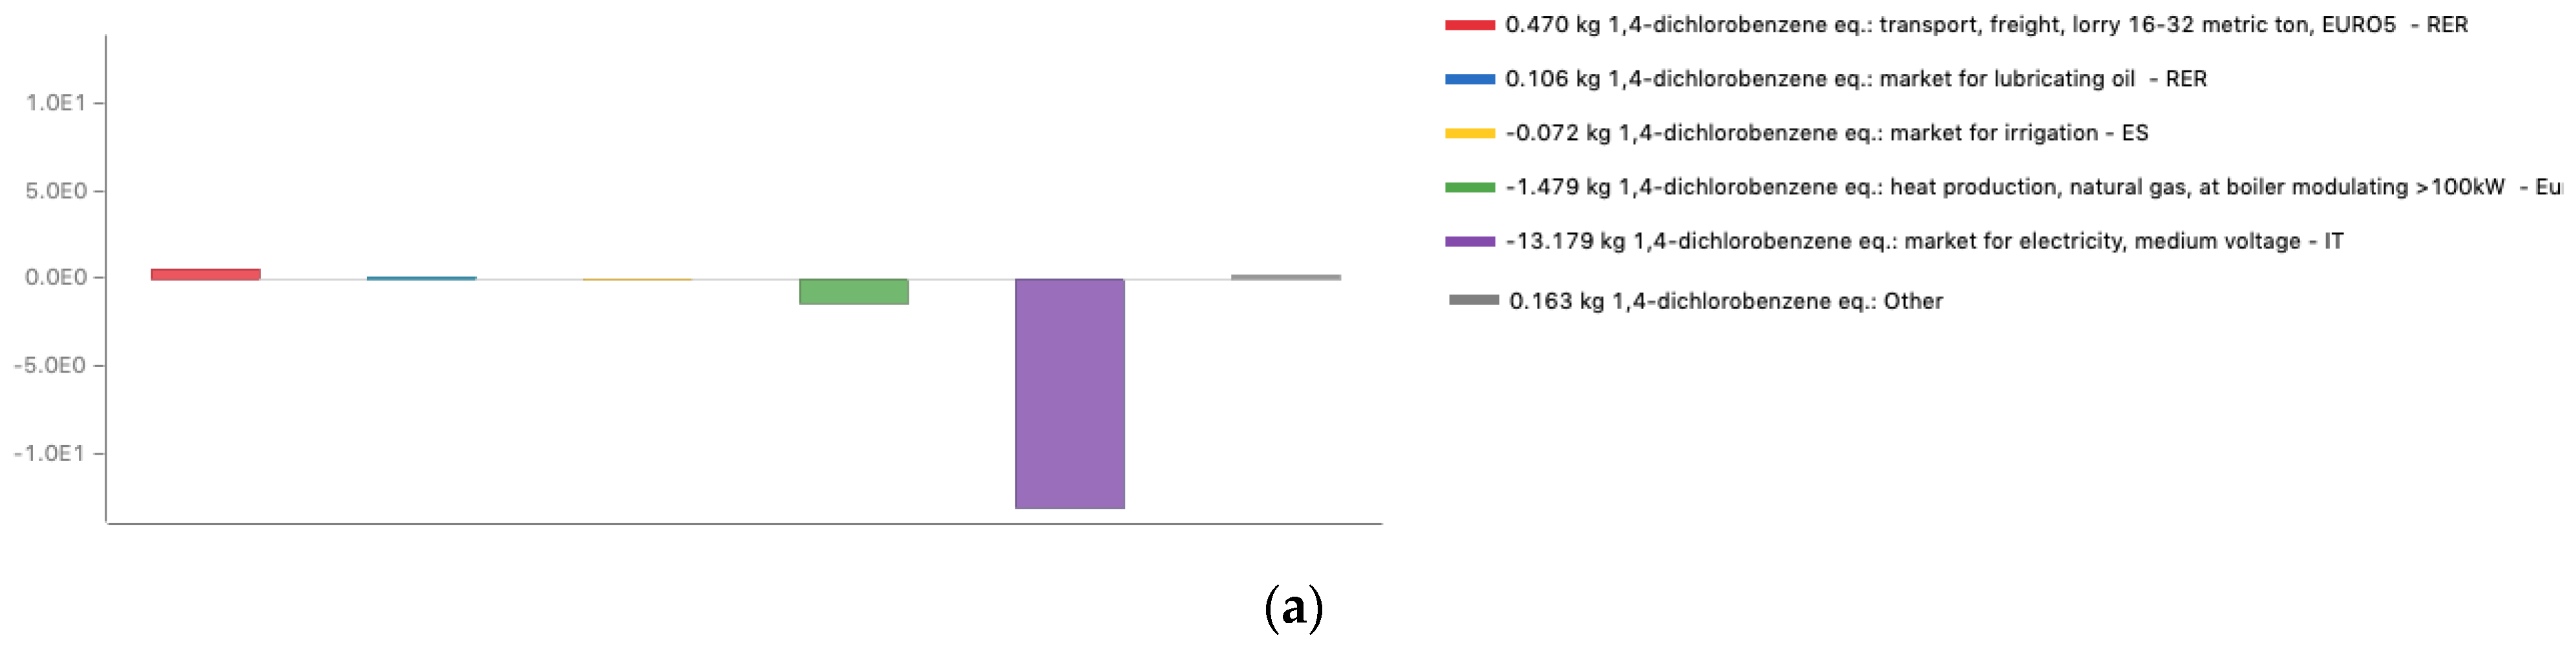
The results in the cradle-to-grave analysis for this impact category, shown in Figure 8a, were very similar to those of the eutrophication. The great negative impact, arising from electricity production (−824.690 kg 1,4-dichlorobenzene eq.), was because products with a high impact factor such as nickel, copper, and zinc were generated using the national energy mix sources.
In the downstream process, shown in Figure 8b, the greatest negative impact derived from a decrease in irrigation volumes (−1.703 kg 1,4-dichlorobenzene eq.). In this case, the reductions of ammonium nitrate, phosphoric acid, and potassium chloride fertilizers had a negative impact equal to −0.049, −0.033, and −0.033 kg 1,4-dichlorobenzene eq., respectively.

3.7. Human Toxicity

The production and use of biochar from the cradle-to-grave perspective of this analyzed process, shown in Figure 9a, had a negative and therefore beneficial balance from the point of view of human toxicity (−1109.860 kg 1,4-dichlorobenzene eq.). Electricity, heat, and irrigation had a negative impact, unlike the transport and production of lubricating oil, which, although relatively low, had a positive impact on this category.
In the downstream process, shown in Figure 9b, the most impactful element in this category was the production of steel and copper for the manufacture of agricultural machinery, the processes related to transport, and diesel production. Regarding negative impacts, the reduction of irrigation played a fundamental role (−3.273 kg 1,4-dichlorobenzene eq.).

3.8. Marine Aquatic Ecotoxicity

The results of the cradle-to-grave analysis for this category, shown in Figure 10a, were, at the level of prevailing processes, very similar to those for human toxicity. In absolute terms, however, the net impact was very high (−3.3 × 10⁶ kg 1,4-dichlorobenzene eq.). The emitted compounds which had the greatest impact on the processes were hydrogen fluoride, beryllium, barite, and nickel.
Compared to human toxicity, in the downstream process, shown in Figure 10b, the production of steel and copper for the manufacture of agricultural machinery had less impact than the production of diesel and transport-related processes. The negative impact still derived essentially from a decrease in irrigation volumes (−4340.530 kg 1,4-dichlorobenzene eq.). In this case, the reductions of ammonium nitrate, phosphoric acid, and potassium chloride fertilizers had a negative impact equal to −143.380, −100.070, and −24.310 kg 1,4-dichlorobenzene eq., respectively.

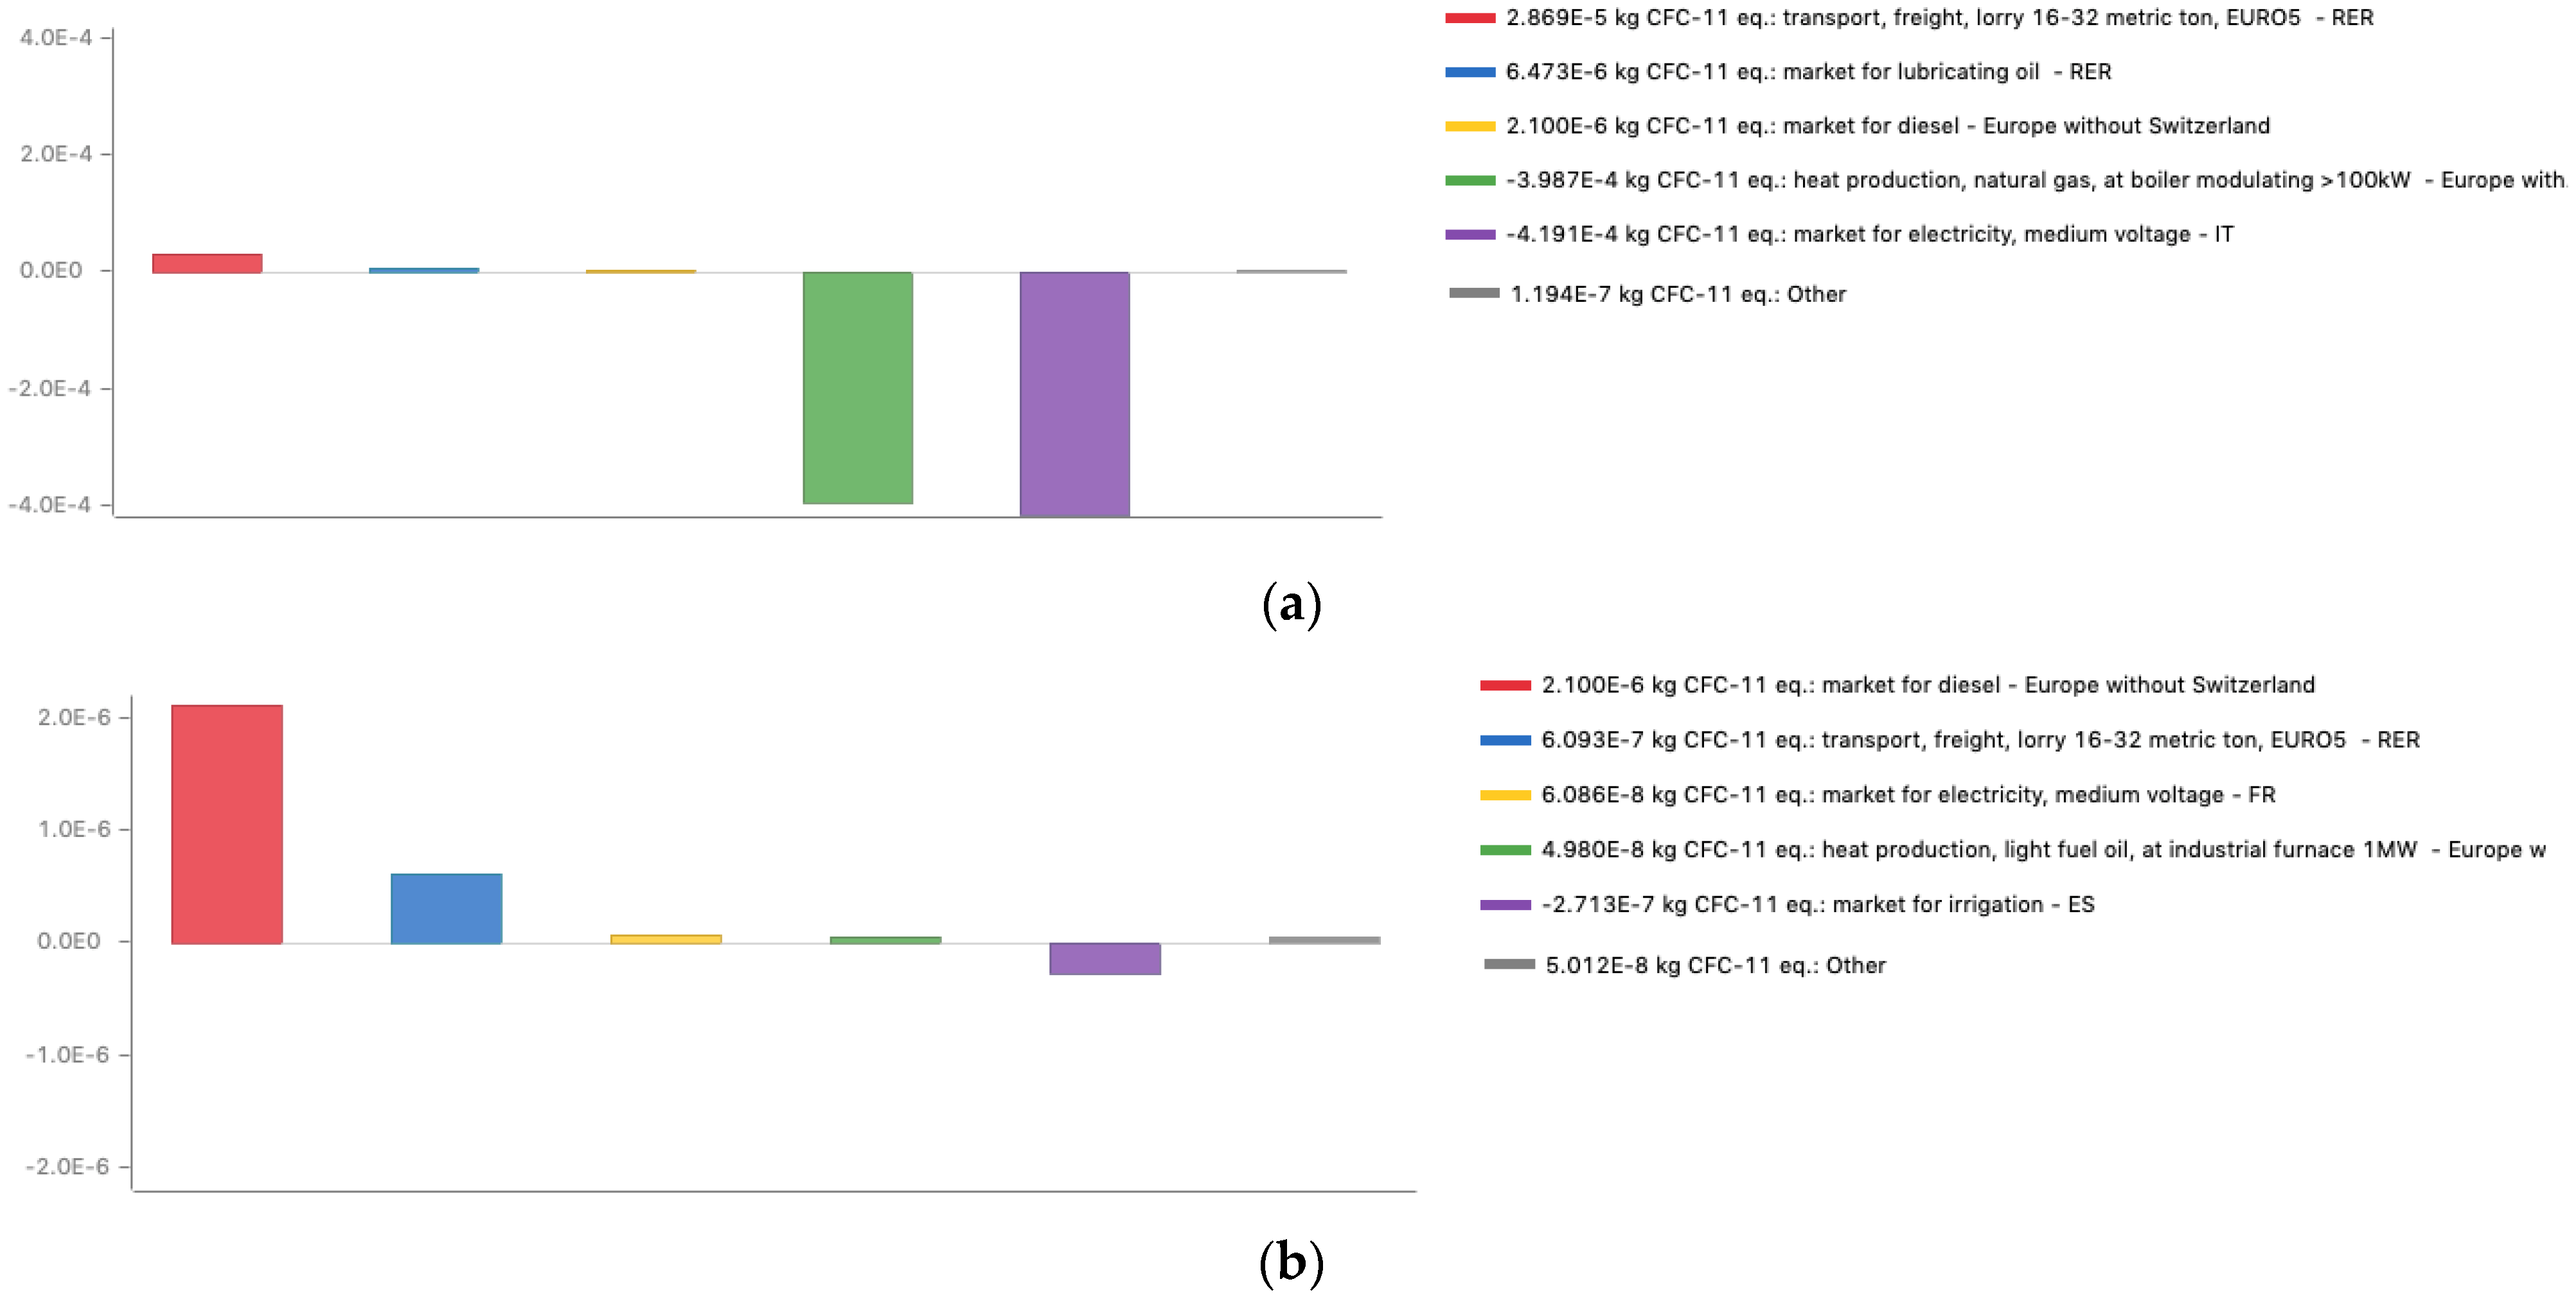
3.9. Ozone Layer Depletion

The electricity and heat production, in the Cradle-to-grave analysis, shown in Figure 11a, also contributed negatively to this category. The emission factors that had the greatest impact on ozone layer depletion were the chlorofluorocarbon emissions into the air, which, fortunately, were minimal in the analyzed process (net balance of −7.8 × 10⁻⁴ kg CFC-11 eq.).
On the contrary, the main impact of the biochar application to soil alone on the ozone layer depletion category was the emissions of bromotrifluoromethane (CBrF3; Halon 1301), connected to the production of diesel and transport-related processes, as it shown in Figure 11b. Even though to a lesser extent, the production of electricity and heat for the manufacture of agricultural machinery also had a negative impact. There was also a modest negative contribution related to the impacts avoided by reducing the use of irrigation (−4340.530 kg 1,4-dichlorobenzene eq.).

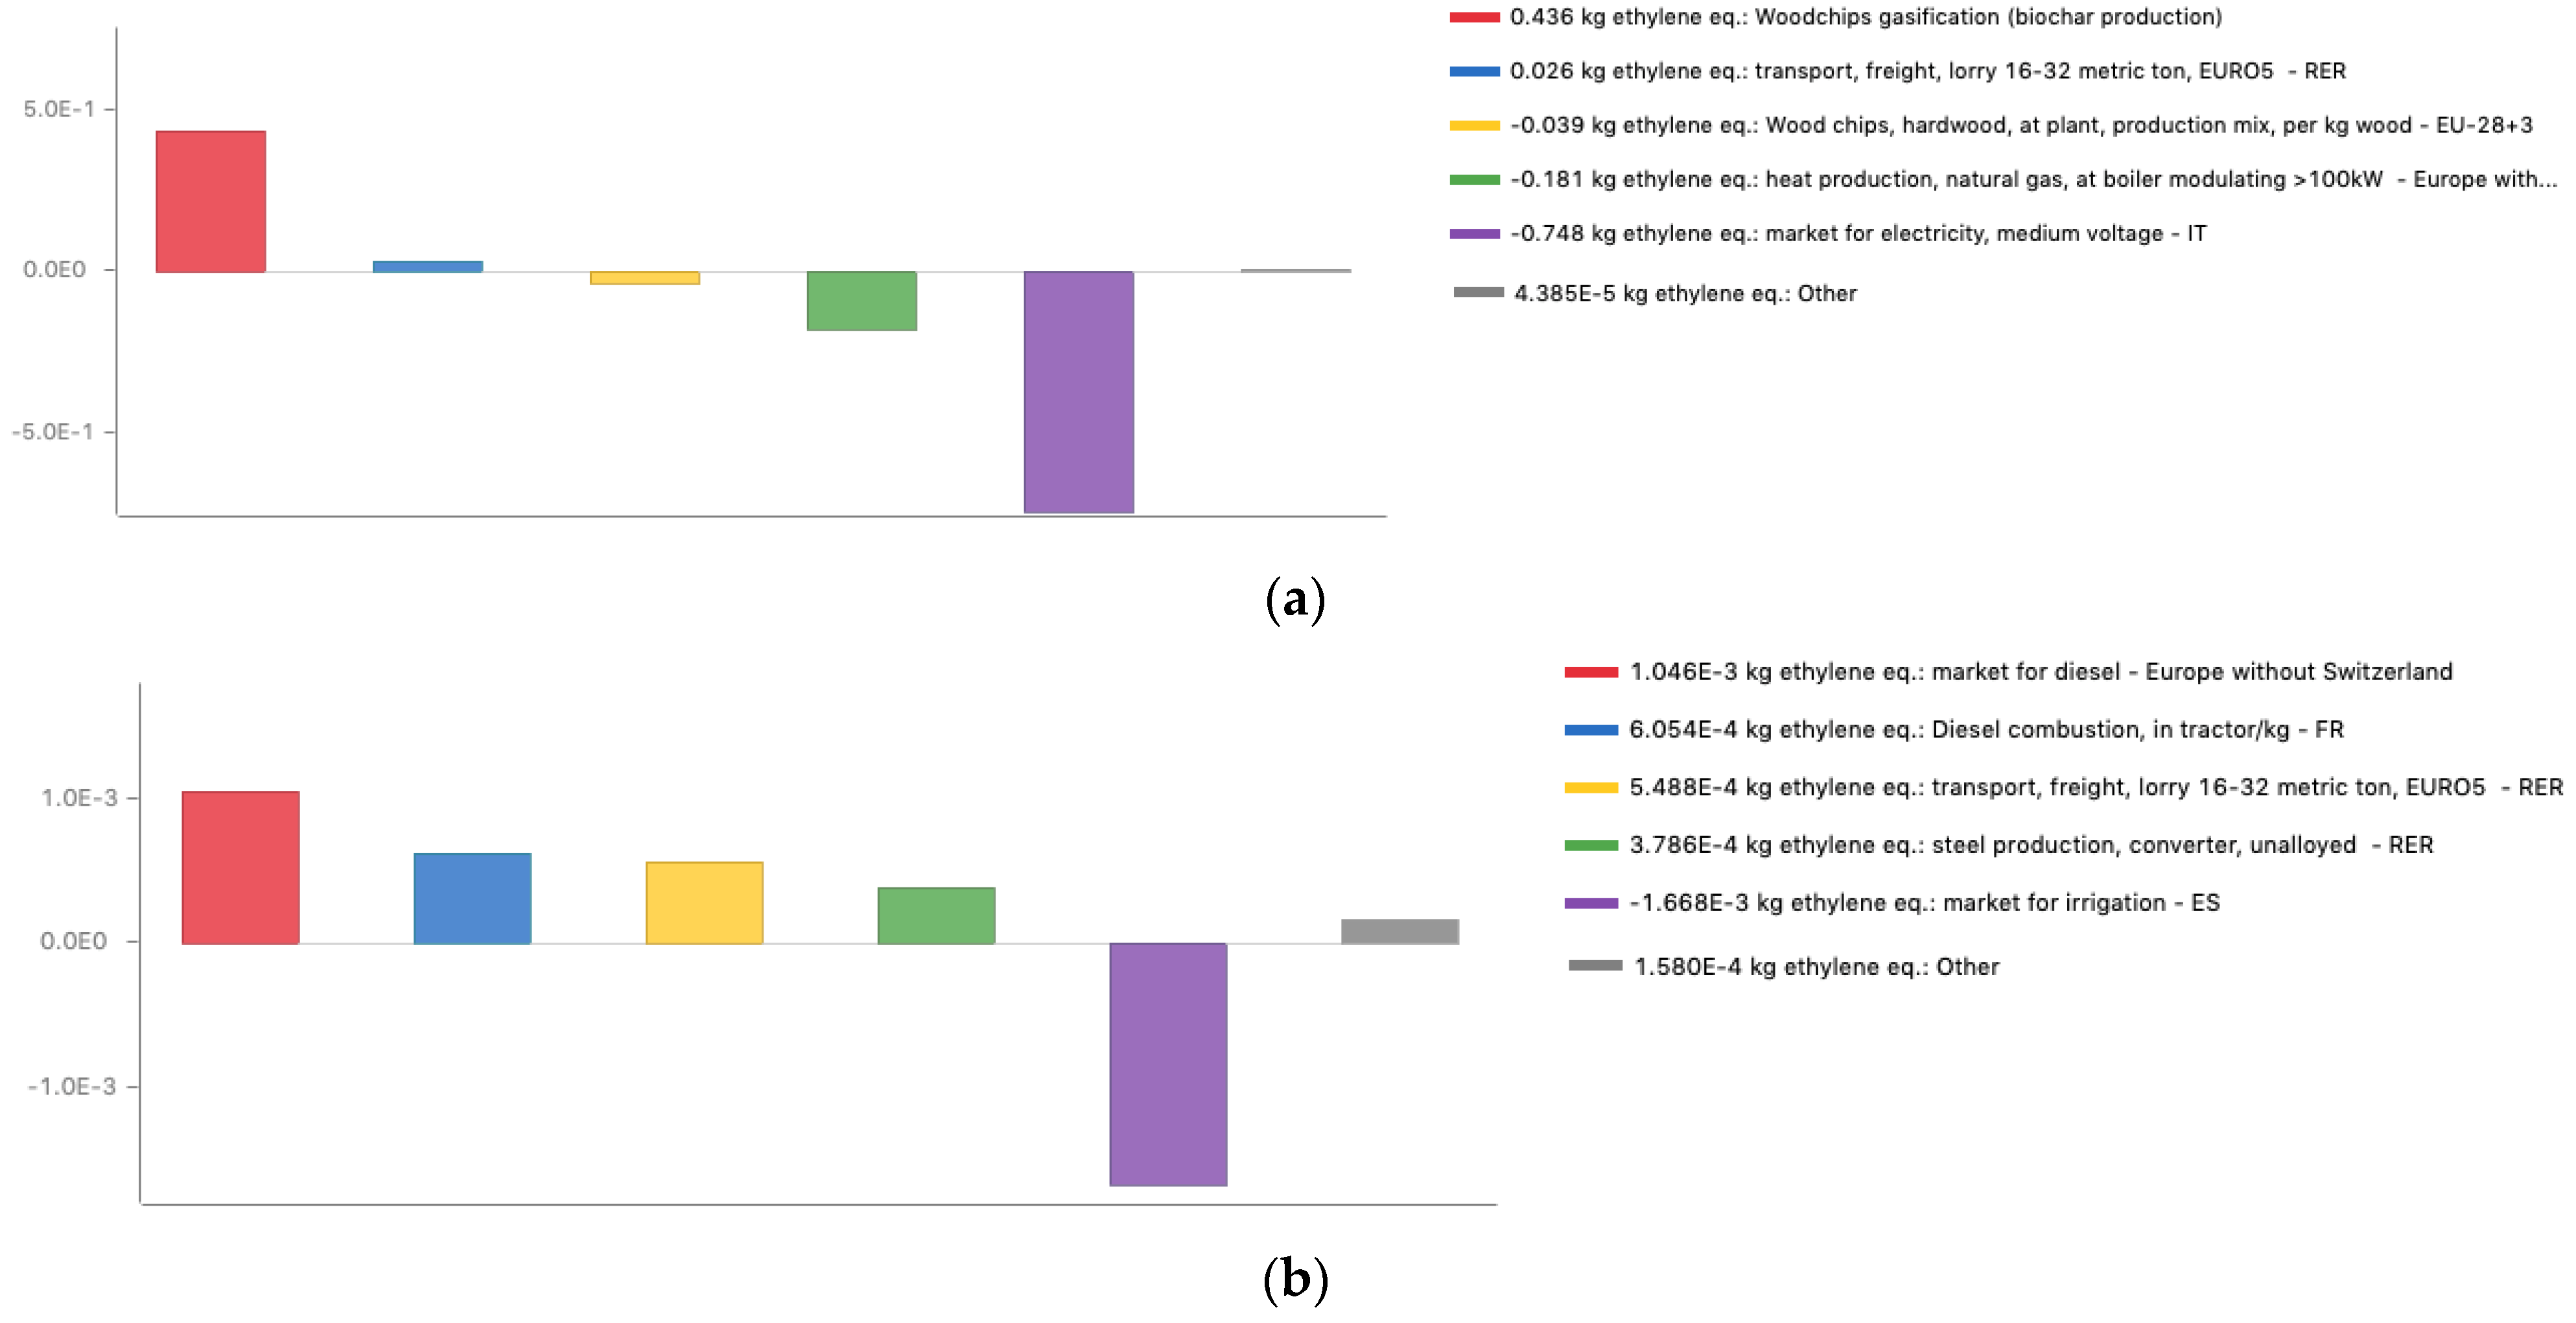
3.10. Photochemical Oxidation

In the cradle-to-grave results, the net balance of photochemical oxidation, shown in Figure 12a, was negative but very close to zero (−0.510 kg ethylene eq.). In this case, the main positive impact was linked to the emissions generated by the gasification processes—the combustion of syngas, mainly to carbon monoxide (CO), which is then emitted. The negative impacts related to the production of electricity (−0.748 kg ethylene eq.) and heat (−0.181 kg ethylene eq.) through the analyzed process depended strictly on the emissions of sulfur dioxide (SO2) avoided.
Photochemical oxidation in the downstream process, shown in Figure 12b, was strictly dependent on the emissions of sulfur dioxide, carbon monoxide, and hydrocarbons. These compounds are emitted with the combustion of diesel (both for agricultural and transport processes) and with the production of the same. Steel production also had a positive impact on this category. The amount of irrigation water saved thanks to the properties of the biochar made a relatively large negative contribution.

3.11. Terrestrial Ecotoxicity

Regarding the cradle-to-grave results concerning terrestrial ecotoxicity, shown in Figure 13a, the net balance of emissions was still negative (−13.990 kg 1,4-dichlorobenzene eq.). As for the previous ones, the main contribution was due to the avoided emissions linked to the production of electricity through the gasification process (−13.179 kg 1,4-dichlorobenzene eq.). Heavy metals were the main class of contaminants that impacted terrestrial ecotoxicity, due to their toxicity and persistence in the environment. The electricity production according to the national energy mix sources was characterized by high emissions of chromium and mercury into the air and soil; the same applied to the heat production by natural gas boilers.
For this last impact category, in the downstream process, shown in Figure 13b, the net balance of emissions was positive (0.015 kg 1,4-dichlorobenzene eq.). As for the previous processes, the key negative contribution was due to the avoided emissions linked to the reduced use of water for irrigation. Steel production was characterized by high emissions of chromium and was the process with the highest positive impact (0.052 kg 1,4-dichlorobenzene eq.). Other positive contributions derived from the processes related to transport, diesel, and steel production. In this case, the reductions of ammonium nitrate, phosphoric acid, and potassium chloride fertilizers had a negative impact equal to −1.6 × 10⁻³, −1.2 × 10⁻³, and −2.9 × 10⁻⁴ kg 1,4-dichlorobenzene eq., respectively.

4. Discussion

The LCA data presented in this study clearly outline the net positive effects of such a process in terms of its mitigation potential.
The system, when analyzed from cradle to grave, generates environmental benefits across all evaluated impact categories, indicating the net virtuous effects of co-producing biochar, electricity, and heat by gasification in terms of mitigation potentials.
Relevant results were found for the categories of “Climate change-GWP100”, with −8267.320 kg CO2 eq.; “Depletion of abiotic resources—fossil fuels”, with −90,758.060 MJ; and “Marine aquatic ecotoxicity”, with −3.3 × 10⁶ kg 1,4-dichlorobenzene. Electricity and heat production represented the main environmental hotspots of the biochar life cycle, together contributing almost 100% of the system-avoided environmental impacts. Transportation was the main hotspot that contributed to the deleterious environmental impacts of the life cycle of biochar. The emissions due to the gasification and syngas combustion processes had a significant impact on the “Photochemical oxidation” category, due to the quantity of carbon monoxide emitted into the air (0.430 kg ethylene eq.).
Nevertheless, analyzing the impacts related to the downstream process (the application of biochar as a soil improver), not all indicators assumed a favorable result; for example, “Depletion of abiotic resources—fossil fuels” and “Human toxicity” were equal to 177.780 MJ and 2.0 kg 1,4-dichlorobenzene eq., respectively.
Concerning the GWP100, biochar application to soil demonstrated a large potential for climate change mitigation, with a net of −1505.740 kg CO2 eq., even when not considering its yield stimulation potentials.
Overall, the proposed gasification supply chain makes it possible to support European climate policies. The European Commission has set targets for energy production from renewable sources for 2030 and 2050 to reach the more general goal of “zero emissions” for the European Union by 2050, and the recent European Green Deal outlines a strategy for achieving these goals through economic growth based on less exploitation of natural resources and a lower impact on health [123].
A good contribution to the mitigation of impacts was also given by the reduction of water volumes for irrigation, thanks to the biochar soil water retention capacity.
In this analysis, the characteristic of biochar to reduce the number of chemical fertilizers was of secondary importance. In fact, according to the assumptions made, the number of fertilizers avoided, if compared with the emissions due to the phase of biochar application to the soil through agricultural machinery, was not enough to produce a beneficial net balance of emissions. Biochar produced from woody biomass, in this case, deciduous and coniferous woodchip, has a too-limited quantity of nutrients compared to conventional fertilizers. For example, analyzing the results of “Eutrophication” for the downstream process, it can be highlighted that the reduction of the use of fertilizers gave a negligible contribution.
If the quantity of avoided fertilizers had been higher, the contribution to this impact category should have been much relevant, considering that eutrophication occurs due to the presence in the aquatic ecosystem of too-high doses of nutrients such as nitrogen, phosphorus, or potassium, and that the main anthropic source that causes eutrophication is the use of agricultural fertilizers.
Despite all the differences that have emerged from various LCA studies [124], a clear trend is still apparent and biochar application to soil provides significant benefits during the life cycle of the system.
To conclude, the application of biochar in agricultural soils would bring an additional environmental benefit, mainly due to the storage of carbon in soils. However, the impact of the agricultural component of the supply chain is certainly less significant than the impact of the energy production process.

5. Conclusions

This paper focused on the environmental impact assessment of the entire life cycle of a biochar-gasification system located in Italy. Primary and secondary data were combined to explore the environmental impacts and biochar life cycle, including the pre- and post-conversion processes.
After a deep LCA study of RE-CHAR®, manufactured by Record Immobiliare S.r.l, it can be concluded that this biochar presented a global positive externality concerning its possible impacts on the environment, in relation to the categories analyzed. Nevertheless, some negative effects were generated, principally due to transportation and gasification, which were compensated for by other indicators. On the other hand, water for irrigation can be reduced due to an increased water retention capacity.
Moreover, it should be noted that the analysis was carried out using both free software tools and databases (Supplementary S2: List of OpenLCA free databases used). Free databases have large qualitative and quantitative limits, especially when compared with large paid databases, such as Ecoinvent. Consequently, an analysis with more adequate tools is necessary to obtain more accurate and reliable impact data.
This study not only gives a valuable academic contribution to biochar LCA studies but can also act as a reference for biochar production companies, motivating biochar certification and studies of LCA. Furthermore, thanks to the results of this work, it is clear that developing biochar-to-soil projects could be another step towards a carbon-neutral society.

6. Further Perspectives

This study demonstrated the positive impact of developing biochar-to-soil projects; however, it did not consider some aspects of biochar production and uses.
Firstly, accepting the use of waste as input material for biochar production, by setting limits on the presence of toxic elements, would allow even greater environmental benefits and would fit perfectly into the context of the circular economy. In short-term experiments, biochar generally increases plant growth, soil nutrient status and reduces fertilizer and irrigation requirements. However, the mechanisms which lead to these benefits are not fully described. Furthermore, a lack of data from long-term studies generates a problem in establishing a link between biochar use and increased crop production.
Secondly, more specific data concerning the production process of wood biomass used as feedstock for gasification would also be needed for a more accurate life cycle assessment, using primary rather than secondary data (in this study the OpenLCA databases were used for the production phase of the woodchips).
Finally, this study did not explore all the consequences of the biochar’s effects on agricultural soils (such as its liming capacity and increases in crop yield); the considered effects are the result of hypotheses based on literature studies.
Long-term field experiments of biochar on a specific type of soil are essential for evaluating the real direct and indirect effects of its application to soil, reducing its environmental impacts and minimizing mineral substance losses.
It is important to remember that the European Green Deal aims to favor shallow and less intrusive soil processing practices on cultivated land as well as sustainable agricultural management practices such as biochar use.
For a more sustainable society, it is also our responsibility to explore the future of biochar by strengthening biochar research and development.

Supplementary Materials

The following are available online at https://0-www-mdpi-com.brum.beds.ac.uk/article/10.3390/land10111256/s1, Supplementary S1: Data used in LCI, Supplementary S2: List of OpenLCA free databases used, Supplementary S3: Biochar soil effects.

Author Contributions

Conceptualization, M.R.B. and A.C.; data curation, S.M., A.A. and A.C.; formal analysis, A.C., S.M., A.A., M.A.D. and P.V.; funding acquisition, M.R.B.; investigation, A.A., A.C., S.M. and M.A.D.; methodology, A.C. and P.V.; project administration, M.R.B.; resources, M.R.B.; software, A.C., A.A. and P.V.; supervision, M.R.B., A.C. and P.V.; validation, S.M., A.C. and M.A.D.; visualization, A.C., A.A. and S.M.; writing—original draft preparation, A.A. and M.A.D.; writing—review and editing, A.C. and S.M. All authors have read and agreed to the published version of the manuscript.

Funding

This research received no external funding.

Institutional Review Board Statement

Not applicable.

Data Availability Statement

The data presented in this studyare available upon request from the corresponding author.

Acknowledgments

The authors wish to thank RECORD IMMOBILIARE S.r.l. who provided RE-CHAR® biochar.

Conflicts of Interest

The authors declare no conflict of interest.

References

  1. Tripathi, M.; Sahu, J.N.; Ganesan, P. Effect of process parameters on production of biochar from biomass waste through pyrolysis: A review. Renew. Sustain. Energy Rev. 2016, 55, 467–481. [Google Scholar] [CrossRef]
  2. Intergovernmental Panel on Climate Change (IPCC). Climate Change 2013: The Physical Science Basis. Contribution of Working Group I to the Fifth Assessment Report of the Intergovern—Metal Panel on Climate Change; Stocker, T.F., Qin, D., Plattner, G.-K., Tignor, M., Allen, S.K., Boschung, J., Nauels, A., Xia, Y., Bex, V., Midgley, P.M., Eds.; Cambridge University Press: Cambridge, UK; New York, NY, USA, 2013. [Google Scholar]
  3. IPCC (Intergovernmental Panel on Climate Change). Special Report: Global Warming of 1.5 °C. 2019. Available online: https://www.ipcc.ch/sr15/ (accessed on 9 November 2021).
  4. Titirici, M.-M.; White, R.J.; Brun, N.; Budarin, V.L.; Su, D.S.; del Monte, F.; Clark, J.H.; MacLachlan, M.J. Sustainable carbon materials. Chem. Soc. Rev. 2014, 44, 250–290. [Google Scholar] [CrossRef]
  5. Roberts, K.G.; Gloy, B.A.; Joseph, S.; Scott, N.R.; Lehmann, J. Life Cycle Assessment of Biochar Systems: Estimating the Energetic, Economic, and Climate Change Potential. Environ. Sci. Technol. 2009, 44, 827–833. [Google Scholar] [CrossRef] [PubMed]
  6. Sparrevik, M.; Field, J.; Martinsen, V.; Breedveld, G.D.; Cornelissen, G. Life Cycle Assessment to Evaluate the Environmental Impact of Biochar Implementation in Conservation Agriculture in Zambia. Environ. Sci. Technol. 2013, 47, 1206–1215. [Google Scholar] [CrossRef] [PubMed]
  7. Shackley, S.; Sohi, S. An Assessment of the Benefits and Issues Associated with the Application of Biochar to Soil: A report commissioned by the UK Department for Environment, Food and Rural Affairs and Department of Energy and Climate Change; DECC: London, UK, 2010; pp. 1–132. [Google Scholar]
  8. Fowles, M. Black carbon sequestration as an alternative to bioenergy. Biomass Bioenergy 2007, 31, 426–432. [Google Scholar] [CrossRef]
  9. Hammond, J.; Shackley, S.; Sohi, S.; Brownsort, P. Prospective life cycle carbon abatement for pyrolysis biochar systems in the UK. Energy Policy 2011, 39, 2646–2655. [Google Scholar] [CrossRef]
  10. Smith, P. Soil carbon sequestration and biochar as negative emission technologies. Glob. Chang. Biol. 2016, 22, 1315–1324. [Google Scholar] [CrossRef] [PubMed]
  11. Saidur, R.; Abdelaziz, E.; Demirbas, A.; Hossain, M.; Mekhilef, S. A review on biomass as a fuel for boilers. Renew. Sustain. Energy Rev. 2011, 15, 2262–2289. [Google Scholar] [CrossRef]
  12. Saxena, R.; Adhikari, D.; Goyal, H. Biomass-based energy fuel through biochemical routes: A review. Renew. Sustain. Energy Rev. 2009, 13, 167–178. [Google Scholar] [CrossRef]
  13. Das, S.K.; Majhi, S.; Mohanty, P.; Pant, K.K. CO-hydrogenation of syngas to fuel using silica supported Fe–Cu–K catalysts: Effects of active components. Fuel Process. Technol. 2014, 118, 82–89. [Google Scholar] [CrossRef]
  14. Persson, H.; Han, T.; Sandström, L.; Xia, W.; Evangelopoulos, P.; Yang, W. Fractionation of liquid products from pyrolysis of lignocellulosic biomass by stepwise thermal treatment. Energy 2018, 154, 346–351. [Google Scholar] [CrossRef]
  15. Lee, J.; Kim, K.-H.; Kwon, E.E. Biochar as a Catalyst. Renew. Sustain. Energy Rev. 2017, 77, 70–79. [Google Scholar] [CrossRef]
  16. Panchasara, H.; Ashwath, N. Effects of Pyrolysis Bio-Oils on Fuel Atomisation—A Review. Energies 2021, 14, 794. [Google Scholar] [CrossRef]
  17. Qambrani, N.A.; Rahman, M.; Won, S.; Shim, S.; Ra, C. Biochar properties and eco-friendly applications for climate change mitigation, waste management, and wastewater treatment: A review. Renew. Sustain. Energy Rev. 2017, 79, 255–273. [Google Scholar] [CrossRef]
  18. Zeng, B.; Shimizu, N. Hydrogen Generation from Wood Chip and Biochar by Combined Continuous Pyrolysis and Hydrothermal Gasification. Energies 2021, 14, 3793. [Google Scholar] [CrossRef]
  19. Boni, M.; Chiavola, A.; Antonucci, A.; Di Mattia, E.; Marzeddu, S. A novel treatment for Cd-contaminated solution through adsorption on beech charcoal: The effect of bioactivation. Desalination Water Treat. 2018, 127, 104–110. [Google Scholar] [CrossRef]
  20. Gaunt, J.L.; Lehmann, J. Energy Balance and Emissions Associated with Biochar Sequestration and Pyrolysis Bioenergy Production. Environ. Sci. Technol. 2008, 42, 4152–4158. [Google Scholar] [CrossRef]
  21. Lehmann, J. A handful of carbon. Nature 2007, 447, 143–144. [Google Scholar] [CrossRef] [PubMed]
  22. Yao, Z.; You, S.; Ge, T.; Wang, C.-H. Biomass gasification for syngas and biochar co-production: Energy application and economic evaluation. Appl. Energy 2018, 209, 43–55. [Google Scholar] [CrossRef] [Green Version]
  23. Liu, Z.; Han, G. Production of solid fuel biochar from waste biomass by low temperature pyrolysis. Fuel 2015, 158, 159–165. [Google Scholar] [CrossRef]
  24. De Caprariis, B.; De Filippis, P.; Hernandez, A.D.; Petrucci, E.; Petrullo, A.; Scarsella, M.; Turchi, M. Pyrolysis wastewater treatment by adsorption on biochars produced by poplar biomass. J. Environ. Manag. 2017, 197, 231–238. [Google Scholar] [CrossRef] [PubMed]
  25. Abdelhadi, S.O.; Dosoretz, C.; Rytwo, G.; Gerchman, Y.; Azaizeh, H. Production of biochar from olive mill solid waste for heavy metal removal. Bioresour. Technol. 2017, 244, 759–767. [Google Scholar] [CrossRef]
  26. Hu, X.; Xu, J.; Wu, M.; Xing, J.; Bi, W.; Wang, K.; Ma, J.; Liu, X. Effects of biomass pre-pyrolysis and pyrolysis temperature on magnetic biochar properties. J. Anal. Appl. Pyrolysis 2017, 127, 196–202. [Google Scholar] [CrossRef]
  27. Jiang, Z.; Lian, F.; Wang, Z.; Xing, B. The role of biochars in sustainable crop production and soil resiliency. J. Exp. Bot. 2019, 71, 520–542. [Google Scholar] [CrossRef]
  28. Wang, T.; Arbestain, M.C.; Hedley, M.; Bishop, P. Predicting phosphorus bioavailability from high-ash biochars. Plant. Soil 2012, 357, 173–187. [Google Scholar] [CrossRef]
  29. Novak, J.M.; Busscher, W.J.; Watts, D.W.; Amonette, J.E.; Ippolito, J.A.; Lima, I.M.; Gaskin, J.W.; Das, K.C.; Steiner, C.; Ahmedna, M.; et al. Biochars Impact on Soil-Moisture Storage in an Ultisol and Two Aridisols. Soil Sci. 2012, 177, 310–320. [Google Scholar] [CrossRef] [Green Version]
  30. Herath, H.; Arbestain, M.C.; Hedley, M. Effect of biochar on soil physical properties in two contrasting soils: An Alfisol and an Andisol. Geoderma 2013, 209–210, 188–197. [Google Scholar] [CrossRef]
  31. Singh, B.; Camps-Arbestain, M.; Lehmann, J.; CSIRO (Australia). Biochar: A Guide to Analytical Methods; CSIRO Publishing: Clayton, Australia, 2017; ISBN 1486305105. [Google Scholar]
  32. Boni, M.R.; Chiavola, A.; Marzeddu, S. Application of Biochar to the Remediation of Pb-Contaminated Solutions. Sustainability 2018, 10, 4440. [Google Scholar] [CrossRef] [Green Version]
  33. Field, J.L.; Keske, C.M.H.; Birch, G.L.; DeFoort, M.W.; Cotrufo, M.F. Distributed biochar and bioenergy coproduction: A regionally specific case study of environmental benefits and economic impacts. GCB Bioenergy 2012, 5, 177–191. [Google Scholar] [CrossRef]
  34. Intergovernmental Panel on Climate Change (IPCC). Climate Change and Land: An IPCC Special Report; IPCC: Geneva, Switzerland, 2019. [Google Scholar]
  35. Bioeconomy Institute. Biochar Research. Available online: https://www.biorenew.iastate.edu/research/thermochemical/biochar (accessed on 9 November 2021).
  36. Lehmann, J.; Joseph, S. (Eds.) Biochar for Environmental Management Science and Technology; Earthscan: London, UK, 2009; ISBN 978-1-84407-658-1. [Google Scholar]
  37. Sharma, S.P. Biochar for Carbon Sequestration: Bioengineering for Sustainable Environment; Elsevier: Amsterdam, The Netherlands, 2018; ISBN 9780128158708. [Google Scholar]
  38. Penido, E.S.; Martins, G.C.; Mendes, T.B.M.; Melo, L.C.A.; do Rosário Guimarães, I.; Guilherme, L.R.G. Combining biochar and sewage sludge for immobilization of heavy metals in mining soils. Ecotoxicol. Environ. Saf. 2019, 172, 326–333. [Google Scholar] [CrossRef]
  39. Inyang, M.I.; Gao, B.; Yao, Y.; Xue, Y.; Zimmerman, A.; Mosa, A.; Pullammanappallil, P.; Ok, Y.S.; Cao, X. A review of biochar as a low-cost adsorbent for aqueous heavy metal removal. Crit. Rev. Environ. Sci. Technol. 2015, 46, 406–433. [Google Scholar] [CrossRef]
  40. Yu, X.-Y.; Ying, G.-G.; Kookana, R. Reduced plant uptake of pesticides with biochar additions to soil. Chemosphere 2009, 76, 665–671. [Google Scholar] [CrossRef]
  41. Décima, M.A.; Marzeddu, S.; Barchiesi, M.; Di Marcantonio, C.; Chiavola, A.; Boni, M.R. A Review on the Removal of Carbamazepine from Aqueous Solution by Using Activated Carbon and Biochar. Sustainability 2021, 13, 11760. [Google Scholar] [CrossRef]
  42. Ok, Y.S.; Chang, S.X.; Gao, B.; Chung, H.-J. SMART biochar technology—A shifting paradigm towards advanced materials and healthcare research. Environ. Technol. Innov. 2015, 4, 206–209. [Google Scholar] [CrossRef]
  43. International Organization for Standardization (ISO) ISO 14040:2006-Environmental Management—Life Cycle Assessment—Principles and Framework. Available online: https://www.iso.org/standard/37456.html (accessed on 16 November 2021).
  44. International Organization for Standardization (ISO) ISO 14044:2006-Environmental Management—Life Cycle Assessment—Requirements and Guidelines. Available online: https://www.iso.org/standard/38498.html (accessed on 16 November 2021).
  45. European Commission; Joint Research Centre; Institute for Environment and Sustainability. International Reference Life Cycle Data System (ILCD) Handbook—General Guide for Life Cycle Assessment—Detailed Guidance; Publications Office of the European Union: Luxembourg, 2010; ISBN 978-92-79-19092-6. [Google Scholar]
  46. Viotti, P.; Tatti, F.; Rossi, A.; Luciano, A.; Marzeddu, S.; Mancini, G.; Boni, M.R. An Eco-Balanced and Integrated Approach for a More-Sustainable MSW Management. Waste Biomass-Valorization 2020, 11, 5139–5150. [Google Scholar] [CrossRef]
  47. Huang, Y.; Anderson, M.; McIlveen-Wright, D.; Lyons, G.; McRoberts, W.; Wang, Y.; Roskilly, A.; Hewitt, N. Biochar and renewable energy generation from poultry litter waste: A technical and economic analysis based on computational simulations. Appl. Energy 2015, 160, 656–663. [Google Scholar] [CrossRef]
  48. Peters, J.; Iribarren, D.; Dufour, J. Biomass Pyrolysis for Biochar or Energy Applications? A Life Cycle Assessment. Environ. Sci. Technol. 2015, 49, 5195–5202. [Google Scholar] [CrossRef] [PubMed]
  49. Ibarrola, R.; Shackley, S.; Hammond, J. Pyrolysis biochar systems for recovering biodegradable materials: A life cycle carbon assessment. Waste Manag. 2012, 32, 859–868. [Google Scholar] [CrossRef] [PubMed]
  50. Chan, Y.H.; Tan, R.R.; Yusup, S.; Lam, H.L.; Quitain, A.T. Comparative life cycle assessment (LCA) of bio-oil production from fast pyrolysis and hydrothermal liquefaction of oil palm empty fruit bunch (EFB). Clean Technol. Environ. Policy 2016, 18, 1759–1768. [Google Scholar] [CrossRef]
  51. Dang, Q.; Yu, C.; Luo, Z. Environmental life cycle assessment of bio-fuel production via fast pyrolysis of corn stover and hydroprocessing. Fuel 2014, 131, 36–42. [Google Scholar] [CrossRef]
  52. Zhang, Y.; Hu, G.; Brown, R.C. Life cycle assessment of commodity chemical production from forest residue via fast pyrolysis. Int. J. Life Cycle Assess. 2014, 19, 1371–1381. [Google Scholar] [CrossRef]
  53. Peters, J.F.; Iribarren, D.; Dufour, J. Life cycle assessment of pyrolysis oil applications. Biomass-Convers. Biorefinery 2014, 5, 1–19. [Google Scholar] [CrossRef]
  54. Zhong, Z.; Song, B.; Zaki, M. Life-cycle assessment of flash pyrolysis of wood waste. J. Clean. Prod. 2010, 18, 1177–1183. [Google Scholar] [CrossRef]
  55. Nguyen, T.L.T.; Hermansen, J.E.; Nielsen, R.G. Environmental assessment of gasification technology for biomass conversion to energy in comparison with other alternatives: The case of wheat straw. J. Clean. Prod. 2013, 53, 138–148. [Google Scholar] [CrossRef]
  56. Suman, S. Conversion of Solid Biomass into Biochar: Act as a Green, Eco-Friendly Energy Source and a Substitute of Fossil Fuel Inputs. Proceedings 2020, 58, 34. [Google Scholar] [CrossRef]
  57. European Parliament and Council. Directive (EU) 2018/2001 of the European Parliament and of the Council of 11 December 2018 on the Promotion of the Use of Energy from Renewable Sources (PE/48/2018/REV/1); European Parliament and Council: Brussels, Belgium, 2018. [Google Scholar]
  58. Shaaban, M.; Van Zwieten, L.; Bashir, S.; Younas, A.; Núñez-Delgado, A.; Chhajro, M.A.; Kubar, K.A.; Ali, U.; Rana, M.S.; Mehmood, M.A.; et al. A concise review of biochar application to agricultural soils to improve soil conditions and fight pollution. J. Environ. Manag. 2018, 228, 429–440. [Google Scholar] [CrossRef]
  59. Boni, M.R.; Chiavola, A.; Marzeddu, S. Remediation of Lead-Contaminated Water by Virgin Coniferous Wood Biochar Adsorbent: Batch and Column Application. Water Air Soil Pollut. 2020, 231, 171. [Google Scholar] [CrossRef]
  60. Boni, M.; Marzeddu, S.; Tatti, F.; Raboni, M.; Mancini, G.; Luciano, A.; Viotti, P. Experimental and Numerical Study of Biochar Fixed Bed Column for the Adsorption of Arsenic from Aqueous Solutions. Water 2021, 13, 915. [Google Scholar] [CrossRef]
  61. Chiavola, A.; Marzeddu, S.; Boni, M.R. Remediation of water contaminated by Pb(II) using virgin coniferous wood biochar as adsorbent. In Frontiers in Water-Energy-Nexus—Nature-Based Solutions, Advanced Technologies and Best Practices for Environmental Sustainability. Advances in Science, Technology & Innovation; IEREK Interdisciplinary Series for Sustainable Development; Naddeo, V., Balakrishnan, M., Choo, K.-H., Eds.; Springer: Cham, Switzerland; Salerno, Italy, 2020; pp. 363–366. ISBN 978-3-030-13067-1. [Google Scholar]
  62. Zhang, Y.; Wang, J.; Feng, Y. The effects of biochar addition on soil physicochemical properties: A review. CATENA 2021, 202, 105284. [Google Scholar] [CrossRef]
  63. Wedema, B.P.; Bauer, C.; Hischier, R.; Mutel, C.; Nemecek, T.; Reinhard, J.; Vadenbo, C.O.; Wenet, G.; Weidema, B.P.; Bauer, C.; et al. Data quality guideline for the ecoinvent database version Ecoinvent Report 1 (v3). Swiss Cent. Life Cycle Invent. 2013, 3, 169. [Google Scholar]
  64. Spielmann, M.; Bauer, C.; Dones, R.; Tuchschmid, M. Transport Services; Ecoinvent Report No. 14; Swiss Centre for Life Cycle Inventories: Dübendorf, Switzerland, 2007. [Google Scholar]
  65. Shackley, S.; Russychaert, G.; Zwart, K.; Glaser, B. (Eds.) Biochar in European Soils and Agriculture: Science and Practice; Routledge: London, UK; New York, NY, USA, 2016; ISBN 9780415711661. [Google Scholar]
  66. Sohi, S.P.; Krull, E.; Lopez-Capel, E.; Bol, R. A review of biochar and its use and function in soil. In Advances in Agronomy; Elsevier: Amsterdam, The Netherlands, 2010; Volume 105, pp. 47–82. [Google Scholar]
  67. Verheijen, F.; Jeffery, S.; Bastos, A.C.; Van Der Velde, M.; Diafas, I. Biochar Application to Soils: A Critical Review of Effects on Soil Properties, Processes and Functions; Publications Office: Luxembourg, 2010; Volume 8, ISBN 9789279142932. [Google Scholar]
  68. Ye, L.; Camps-Arbestain, M.; Shen, Q.; Lehmann, J.; Singh, B.; Sabir, M. Biochar effects on crop yields with and without fertilizer: A meta-analysis of field studies using separate controls. Soil Use Manag. 2019, 36, 2–18. [Google Scholar] [CrossRef]
  69. Ladygina, N.; Rineau, F. Biochar and Soil Biota; CRC Press: Boca Raton, FL, USA, 2013; ISBN 9781466576513. [Google Scholar]
  70. Husk, B.; Major, J. Commercial Scale Agricultural Biochar Field Trial in Quebec, Canada Over two Years: Effects of Biochar on Soil Fertility, Biology and Crop Productivity and Quality; Blue Leaf Inc.: Quebec City, QC, Canada, 2010. [Google Scholar]
  71. Baronti, S.; Vaccari, F.; Miglietta, F.; Calzolari, C.; Lugato, E.; Orlandini, S.; Pini, R.; Zulian, C.; Genesio, L. Impact of biochar application on plant water relations in Vitis vinifera (L.). Eur. J. Agron. 2013, 53, 38–44. [Google Scholar] [CrossRef]
  72. Major, J. Guidelines on Practical Aspects of Biochar Application to Field Soil in Various Soil Management Systems; International Biochar Initiative: Westerville, OH, USA, 2010; Available online: https://www.biochar-international.org/wp-content/uploads/2018/04/IBI_Biochar_Application.pdf (accessed on 16 November 2021).
  73. Cayuela, M.L.; Van Zwieten, L.; Singh, B.; Jeffery, S.; Roig, A.; Sanchez-Monedero, M. Biochar’s role in mitigating soil nitrous oxide emissions: A review and meta-analysis. Agric. Ecosyst. Environ. 2014, 191, 5–16. [Google Scholar] [CrossRef]
  74. Song, X.; Pan, G.; Zhang, C.; Zhang, L.; Wang, H. Effects of biochar application on fluxes of three biogenic greenhouse gases: A meta-analysis. Ecosyst. Health Sustain. 2016, 2, e01202. [Google Scholar] [CrossRef] [Green Version]
  75. He, Y.; Zhou, X.; Jiang, L.; Li, M.; Du, Z.; Zhou, G.; Shao, J.; Wang, X.; Xu, Z.; Bai, S.H.; et al. Effects of biochar application on soil greenhouse gas fluxes: A meta-analysis. GCB Bioenergy 2016, 9, 743–755. [Google Scholar] [CrossRef]
  76. Borchard, N.; Schirrmann, M.; Cayuela, M.L.; Kammann, C.; Wrage-Mönnig, N.; Estavillo, J.M.; Fuertes-Mendizábal, T.; Sigua, G.; Spokas, K.; Ippolito, J.A.; et al. Biochar, soil and land-use interactions that reduce nitrate leaching and N2O emissions: A meta-analysis. Sci. Total Environ. 2018, 651, 2354–2364. [Google Scholar] [CrossRef]
  77. Lugato, E.; Paniagua, L.; Jones, A.; de Vries, W.; Leip, A. Complementing the topsoil information of the Land Use/Land Cover Area Frame Survey (LUCAS) with modelled N2O emissions. PLoS ONE 2017, 12, e0176111. [Google Scholar] [CrossRef] [PubMed] [Green Version]
  78. Wood, S.; Cowie, A. A Review of Greenhouse Gas Emission Factors for Fertiliser Production. IEA Bioenergy 2004, 38, 1–20. [Google Scholar]
  79. Yanai, Y.; Toyota, K.; Okazaki, M. Effects of charcoal addition on N2O emissions from soil resulting from rewetting air-dried soil in short-term laboratory experiments. Soil Sci. Plant Nutr. 2007, 53, 181–188. [Google Scholar] [CrossRef]
  80. Spokas, K.; Koskinen, W.; Baker, J.; Reicosky, D. Impacts of woodchip biochar additions on greenhouse gas production and sorption/degradation of two herbicides in a Minnesota soil. Chemosphere 2009, 77, 574–581. [Google Scholar] [CrossRef] [PubMed]
  81. Singh, B.P.; Hatton, B.J.; Singh, B.; Cowie, A.L.; Kathuria, A. Influence of Biochars on Nitrous Oxide Emission and Nitrogen Leaching from Two Contrasting Soils. J. Environ. Qual. 2010, 39, 1224–1235. [Google Scholar] [CrossRef]
  82. Kimetu, J.M.; Lehmann, J.; Ngoze, S.O.; Mugendi, D.N.; Kinyangi, J.M.; Riha, S.; Verchot, L.; Recha, J.; Pell, A.N. Reversibility of Soil Productivity Decline with Organic Matter of Differing Quality Along a Degradation Gradient. Ecosystems 2008, 11, 726–739. [Google Scholar] [CrossRef]
  83. Lehmann, J. Bio-Energy in the Black. Front. Ecol. Environ. 2007, 5, 381–387. [Google Scholar] [CrossRef] [Green Version]
  84. Curaqueo, G.; Meier, S.; Khan, N.; Cea, M.; Navia, R. Use of biochar on two volcanic soils: Effects on soil properties and barley yield. J. Soil Sci. Plant. Nutr. 2014, 14, 911–924. [Google Scholar] [CrossRef] [Green Version]
  85. Regione Marche Giunta Regionale. Programma D’azione delle Zone Vulnerabili da Nitrati di Origine Agricola della Regione Marche (ZVN) e Prime Disposizioni di Attuazione Del D. Lgs. 152/06 e del Titolo V del D.M. 7 Aprile 2006 per le ZVN; Regione Marche Giunta Regionale: Ancona, Italy, 2007. [Google Scholar]
  86. ISTAT (Istituto Nazionale di Statistica); 6° Censimento Generale dell’Agricoltura. Utilizzo della Risorsa Idrica a Fini Irrigui in Agricoltura; Istituto Nazionale di Statistica: Rome, Italy, 2014; ISBN 978-88-458-1805-9. [Google Scholar]
  87. Mukherjee, A.; Lal, R. Biochar Impacts on Soil Physical Properties and Greenhouse Gas Emissions. Agronomy 2013, 3, 313–339. [Google Scholar] [CrossRef] [Green Version]
  88. Hardie, M.; Clothier, B.; Bound, S.; Oliver, G.; Close, D. Does biochar influence soil physical properties and soil water availability? Plant. Soil 2013, 376, 347–361. [Google Scholar] [CrossRef]
  89. Cheng, C.-H.; Lehmann, J.; Thies, J.E.; Burton, S.D. Stability of black carbon in soils across a climatic gradient. J. Geophys. Res. Space Phys. 2008, 113. [Google Scholar] [CrossRef] [Green Version]
  90. Liang, B.; Lehmann, J.; Solomon, D.; Sohi, S.; Thies, J.E.; Skjemstad, J.O.; Luizão, F.J.; Engelhard, M.H.; Neves, E.G.; Wirick, S. Stability of biomass-derived black carbon in soils. Geochim. Cosmochim. Acta 2008, 72, 6069–6078. [Google Scholar] [CrossRef]
  91. Lehmann, J.; Joseph, S. (Eds.) Biochar for Environmental Management: Science, Technology and Implementation, 2nd ed.; Routledge: London, UK, 2015; ISBN 9780203762264. [Google Scholar] [CrossRef]
  92. Baldock, J.; Smernik, R. Chemical composition and bioavailability of thermally altered Pinus resinosa (Red pine) wood. Org. Geochem. 2002, 33, 1093–1109. [Google Scholar] [CrossRef]
  93. Wang, J.; Xiong, Z.; Kuzyakov, Y. Biochar stability in soil: Meta-analysis of decomposition and priming effects. GCB Bioenergy 2015, 8, 512–523. [Google Scholar] [CrossRef] [Green Version]
  94. Kammann, C.; Ippolito, J.; Hagemann, N.; Borchard, N.; Cayuela, M.L.; Estavillo, J.M.; Fuertes-Mendizábal, T.; Jeffery, S.; Kern, J.; Novak, J.; et al. Biochar as a Tool to Reduce the Agricultural Greenhouse-Gas Burden—Knowns, Unknowns and Future Research Needs. J. Environ. Eng. Landsc. Manag. 2017, 25, 114–139. [Google Scholar] [CrossRef]
  95. Lehmann, J.; Czimczik, C.; Laird, D.; Sohi, S. Stability of Biochar in the Soil. In Biochar for Environmental Management: Science and Technology; Lehmann, J., Stephen, J., Eds.; Earthscan: London, UK, 2009; pp. 169–182. ISBN 9781849770. [Google Scholar]
  96. Teixeira, R.F.M.; Morais, T.G.; Domingos, T. Global process-based characterization factors of soil carbon depletion for life cycle impact assessment. Sci. Data 2021, 8, 237. [Google Scholar] [CrossRef] [PubMed]
  97. Woods, J.S.; Verones, F.; Jolliet, O.; Vázquez-Rowe, I.; Boulay, A.-M. A framework for the assessment of marine litter impacts in life cycle impact assessment. Ecol. Indic. 2021, 129, 107918. [Google Scholar] [CrossRef]
  98. Guinee, J.B. Handbook on life cycle assessment operational guide to the ISO standards. Int. J. Life Cycle Assess. 2002, 7, 311. [Google Scholar] [CrossRef]
  99. Kang, E.J.; Han, A.-R.; Kim, J.-H.; Kim, I.-N.; Lee, S.; Min, J.-O.; Nam, B.-R.; Choi, Y.-J.; Edwards, M.S.; Diaz-Pulido, G.; et al. Evaluating bloom potential of the green-tide forming alga Ulva ohnoi under ocean acidification and warming. Sci. Total Environ. 2021, 769, 144443. [Google Scholar] [CrossRef]
  100. Zhang, S.; Yang, X.; Hsu, L.-C.; Liu, Y.-T.; Wang, S.-L.; White, J.R.; Shaheen, S.M.; Chen, Q.; Rinklebe, J. Soil acidification enhances the mobilization of phosphorus under anoxic conditions in an agricultural soil: Investigating the potential for loss of phosphorus to water and the associated environmental risk. Sci. Total Environ. 2021, 793, 148531. [Google Scholar] [CrossRef]
  101. Bassano, C.; Deiana, P.; Vilardi, G.; Verdone, N. Modeling and economic evaluation of carbon capture and storage technologies integrated into synthetic natural gas and power-to-gas plants. Appl. Energy 2020, 263, 114590. [Google Scholar] [CrossRef]
  102. Rispoli, A.L.; Verdone, N.; Vilardi, G. Green fuel production by coupling plastic waste oxy-combustion and PtG technologies: Economic, energy, exergy and CO2-cycle analysis. Fuel Process. Technol. 2021, 221, 106922. [Google Scholar] [CrossRef]
  103. Silva, V.; Contreras, F.; Bortoleto, A.P. Life-cycle assessment of municipal solid waste management options: A case study of refuse derived fuel production in the city of Brasilia, Brazil. J. Clean. Prod. 2020, 279, 123696. [Google Scholar] [CrossRef]
  104. Pradel, M.; Garcia, J.; Vaija, M.S. A framework for good practices to assess abiotic mineral resource depletion in Life Cycle Assessment. J. Clean. Prod. 2020, 279, 123296. [Google Scholar] [CrossRef]
  105. Vilardi, G.; De Caprariis, B.; Stoller, M.; Di Palma, L.; Verdone, N. Intensified water denitrification by means of a spinning disk reactor and stirred tank in series: Kinetic modelling and computational fluid dynamics. J. Water Process. Eng. 2020, 34, 101147. [Google Scholar] [CrossRef]
  106. Vilardi, G.; Bubbico, R.; Di Palma, L.; Verdone, N. Nitrate green removal by fixed-bed columns packed with waste biomass: Modelling and friction parameter estimation. Chem. Eng. Res. Des. 2020, 154, 250–261. [Google Scholar] [CrossRef]
  107. Raboni, M.; Viotti, P.; Rada, E.C.; Conti, F.; Boni, M.R. The Sensitivity of a Specific Denitrification Rate under the Dissolved Oxygen Pressure. Int. J. Environ. Res. Public Health 2020, 17, 9366. [Google Scholar] [CrossRef]
  108. Zhang, C.; Chen, X.; Ho, S.-H. Wastewater treatment nexus: Carbon nanomaterials towards potential aquatic ecotoxicity. J. Hazard. Mater. 2021, 417, 125959. [Google Scholar] [CrossRef] [PubMed]
  109. Mehinto, A.C.; Smith, J.; Wenger, E.; Stanton, B.; Linville, R.; Brooks, B.W.; Sutula, M.A.; Howard, M.D. Synthesis of ecotoxicological studies on cyanotoxins in freshwater habitats—Evaluating the basis for developing thresholds protective of aquatic life in the United States. Sci. Total Environ. 2021, 795, 148864. [Google Scholar] [CrossRef] [PubMed]
  110. Ciampi, P.; Esposito, C.; Viotti, P.; Boaga, J.; Cassiani, G.; Papini, M.P. An Integrated Approach Supporting Remediation of an Aquifer Contaminated with Chlorinated Solvents by a Combination of Adsorption and Biodegradation. Appl. Sci. 2019, 9, 4318. [Google Scholar] [CrossRef] [Green Version]
  111. Emara, Y.; Fantke, P.; Judson, R.; Chang, X.; Pradeep, P.; Lehmann, A.; Siegert, M.-W.; Finkbeiner, M. Integrating endocrine-related health effects into comparative human toxicity characterization. Sci. Total Environ. 2020, 762, 143874. [Google Scholar] [CrossRef] [PubMed]
  112. Hertwich, E.G.; Mateles, S.F.; Pease, W.S.; McKone, T.E. Human toxicity potentials for life-cycle assessment and toxics release inventory risk screening. Environ. Toxicol. Chem. 2001, 20, 928–939. [Google Scholar] [CrossRef] [PubMed]
  113. Jackson, M.; Eadsforth, C.; Schowanek, D.; Delfosse, T.; Riddle, A.; Budgen, N. Comprehensive review of several surfactants in marine environments: Fate and ecotoxicity. Environ. Toxicol. Chem. 2016, 35, 1077–1086. [Google Scholar] [CrossRef] [PubMed] [Green Version]
  114. Balasbaneh, A.T.; Yeoh, D.; Juki, M.I.; Gohari, A.; Abidin, A.R.Z.; Bin Marsono, A.K. Applying three pillar indicator assessments on alternative floor systems: Life cycle study. Int. J. Life Cycle Assess. 2021, 26, 1439–1455. [Google Scholar] [CrossRef]
  115. Pazouki, P.; Lu, H.R.; El Hanandeh, A.; Biswas, W.; Bertone, E.; Helfer, F.; Stewart, R.A. Comparative environmental life cycle assessment of alternative osmotic and mixing dilution desalination system configurations. Desalination 2021, 504, 114963. [Google Scholar] [CrossRef]
  116. Bałdowska-Witos, P.; Piasecka, I.; Flizikowski, J.; Tomporowski, A.; Idzikowski, A.; Zawada, M. Life Cycle Assessment of Two Alternative Plastics for Bottle Production. Materials 2021, 14, 4552. [Google Scholar] [CrossRef] [PubMed]
  117. Miao, J.; Wang, X.; Bai, S.; Xiang, Y.; Li, L. Distance-to-target weighting factor sets in LCA for China under 2030 vision. J. Clean. Prod. 2021, 314, 128010. [Google Scholar] [CrossRef]
  118. Magdy, M.; Alalm, M.G.; El-Etriby, H.K. Comparative life cycle assessment of five chemical methods for removal of phenol and its transformation products. J. Clean. Prod. 2021, 291, 125923. [Google Scholar] [CrossRef]
  119. Russo, V.; Strever, A.E.; Ponstein, H.J. Exploring sustainability potentials in vineyards through LCA? Evidence from farming practices in South Africa. Int. J. Life Cycle Assess. 2021, 26, 1374–1390. [Google Scholar] [CrossRef]
  120. Rathour, R.; Medhi, K.; Gupta, J.; Thakur, I.S. Integrated approach of whole-genome analysis, toxicological evaluation and life cycle assessment for pyrene biodegradation by a psychrophilic strain, Shewanella sp. ISTPL2. Environ. Pollut. 2020, 269, 116176. [Google Scholar] [CrossRef] [PubMed]
  121. Tsai, J.-H.; Huang, J.-Y.; Wilson, D.I. Life cycle assessment of cleaning-in-place operations in egg yolk powder production. J. Clean. Prod. 2020, 278, 123936. [Google Scholar] [CrossRef]
  122. GSE Fuel Mix, Determinazione del Mix Energetico per Gli Anni 2018–2019. Available online: https://www.gse.it/servizi-per-te/news/fuel-mix-determinazione-del-mix-energetico-per-gli-anni-2018-2019 (accessed on 10 November 2021).
  123. European Commission. Communication from the Commission to the European Parliament, the European Council, the Council, the European Economic and Social Committee and the Committee of the Regions; The European Green Deal: Brussels, Belgium, 2019. [Google Scholar]
  124. Matuštík, J.; Hnátková, T.; Kočí, V. Life cycle assessment of biochar-to-soil systems: A review. J. Clean. Prod. 2020, 259, 120998. [Google Scholar] [CrossRef]
Figure 1. Phases and applications of an LCA (based on ISO 14040 and ISO 14044, 2006 [43,44]).
Land 10 01256 g001
Figure 2. System boundaries and flowchart of the process investigated. The green box represents what is included in the cradle-to-gate boundaries; the blue box represents the system boundaries for the cradle-to-grave analysis; the red box represents what is not included in this analysis.
Land 10 01256 g002
Figure 3. Acidification potential: top 5 contributions impacting category results: (a) Cradle-to-grave analysis; (b) Downstream process.
Land 10 01256 g003
Figure 4. Climate change–GWP 100: top 5 contributions impacting category results: (a) Cradle-to-grave analysis; (b) Downstream process.
Land 10 01256 g004
Figure 5. Depletion of abiotic resources—elements, ultimate reserves: top 5 contributions impacting category results: (a) Cradle-to-grave analysis; (b) Downstream process.
Land 10 01256 g005
Figure 6. Depletion of abiotic resources—fossil fuels: top 5 contributions impacting category results: (a) Cradle-to-grave analysis; (b) Downstream process.
Land 10 01256 g006
Figure 7. Eutrophication: top 5 contributions impacting category results: (a) Cradle-to-grave analysis; (b) Downstream process.
Land 10 01256 g007
Figure 8. Freshwater Aquatic ecotoxicity: top 5 contributions impacting category results: (a) Cradle-to-grave analysis; (b) Downstream process.
Land 10 01256 g008
Figure 9. Human Toxicity: top 5 contributions impacting category results: (a) Cradle-to-grave analysis; (b) Downstream process.
Land 10 01256 g009
Figure 10. Marine aquatic ecotoxicity: top 5 contributions impacting category results: (a) Cradle-to-grave analysis; (b) Downstream process.
Land 10 01256 g010
Figure 11. Ozone layer depletion: top 5 contributions impacting category results: (a) Cradle-to-grave analysis; (b) Downstream process.
Land 10 01256 g011
Figure 12. Photochemical oxidation: top 5 contributions impacting category results: (a) Cradle-to-grave analysis; (b) Downstream process.
Land 10 01256 g012
Figure 13. Terrestrial ecotoxicity: top 5 contributions impacting category results: (a) Cradle-to-grave analysis; (b) Downstream process.
Land 10 01256 g013aLand 10 01256 g013b
Table 1. Technical parameters of the gasification plant.
ParameterUnitAmount
Model-ESPE CHIP50
Fuel-Woodchips (moisture = 10 %W/W *)
Gasifier type-Fixed bed downdraft
Woodchips to gasificationkg/h49 (for each gasifier)
Average syngas flow generatedm3/h140 (for each gasifier)
Syngas lower calorific valuekJ/Nm35500–6000
Energy efficiency%>75
Average gasification temperature°C~1000
Gas temperature leaving the gasifier°C~700
Gasifier inlet air temperature°C~300
Residence times~255
Electric powerKwh98 (for both gasifiers)
Thermal powerKwh220 (for both gasifiers)
Production of biochar%W/W (on dry matter basis)~5
* W/W: weight per weight.
Table 2. Combustion engine characteristics.
ParameterUnitAmount
Motor type-TEDOM TB 90 G5V NX86
Displacementdm311,946
Nominal speedrpm1500
Nominal mechanical powerkw53 (for each engine)
Nominal electric powerkw49 (for each engine)
Table 3. RE-CHAR® Physico-chemical characteristics 1.
ParameterUnitAmount (±SE 2)
Cation exchange capacity (CEC)cmol(+)/kgDW12.5 ± 0.8
Conductance (1 g/L)S132.3 ± 1.7 × 10⁻⁶
pH (1%)-11.71 ± 0.1
Specific surface (BET)m2/g280.25 ± 7.12
Medium porositycm3/g0.28 ± 0.012
Average pore sizeA69 ± 1.1
Density (estimate)kg/m3528.0
Specific weight (estimate)N/m35177.57
Particle Size Distribution
>850 × 10−6 m%17.230
>600 × 10−6 m%33.017
>500 × 10−6 m%7.134
>355 × 10−6 m%4.307
>300 × 10−6 m%2.492
>212 × 10−6 m%9.014
>180 × 10−6 m%3.173
>90 × 10−6 m%8.984
>75 × 10−6 m%13.704
>53 × 10−6 m%0.750
>45 × 10−6 m%0.180
>38 × 10−6 m%0.007
<38 × 10−6 m%0.002
Composition
Humidity (105 °C)%0.98 ± 0.1
Water content (180 °C)%1.22 ± 0.1
Fixed carbon%80.84 ± 0.1
Ashes%11.55 ± 0.44
Volatile substance%6.63 ± 0.04
Elemental composition
C%84.5 ± 0.1
H%0.85 ± 0.04
N%0.15 ± 0.02
O%9.99 ± 1.05
P%1.79 ± 0.59
K%1.4 ± 0.11
S%0.32 ± 0.02
Ca%<LOD 3 (0.50)
Mg%<LOD 3 (0.50)
O/C-0.118
H/C-0.01
Functional groups
OH-mmol/g0.44 ± 0.05
Acidsmmol/g1.31 ± 0.09
Lactonemmol/g<0.001
Carboxylemmol/g0.29 ± 0.02
Indexes
Iodine indexg/kgDW202 ± 12.4
Methylene blue indexg/kgDW25.56 ± 3.4
1 The data in this table were provided by the authors. 2 SE: standard error. 3 LOD: Limit of detection.
Table 4. Effects and parameters used to explore potential biochar soil effects and biochar stability.
Process or PracticeUnitAmount
Residence time of biochar in the soilYears100
Biochar carbon recalcitrance%C80%
N2O emissions from soil%N2O−30%
Mineral fertilizer applicationN−8.33%
P−4.17%
K−4.17%
Use of irrigation%water−20%
Table 5. CML baseline results (per ton of packed biochar).
Impact CategoryUnitCradle-to-Grave ResultsDownstream Process Results
Acidification potentialkg SO2 eq.−28.3700.079
Climate change-GWP100kg CO2 eq.−8267.320−1505.741
Depletion of abiotic resources-elements, ultimate reserveskg antimony eq.−2.8 × 10−48.191 × 10−6
Depletion of abiotic resources-fossil fuelsMJ−90,758.060177.783
Eutrophicationkg PO43− eq.−7.1400.017
Freshwater aquatic ecotoxicitykg 1,4-dichlorobenzene eq.−851.880−0.372
Human toxicity kg 1,4-dichlorobenzene eq.−1109.8602.003
Marine aquatic ecotoxicity kg 1,4-dichlorobenzene eq.−3.3 × 10⁶−611.397
Ozone layer depletionkg CFC-11 eq.−7.8 × 10−42.599 × 10−6
Photochemical oxidationkg ethylene eq.−0.5100.001
Terrestrial ecotoxicitykg 1,4-dichlorobenzene eq.−13.9900.015
Publisher’s Note: MDPI stays neutral with regard to jurisdictional claims in published maps and institutional affiliations.

