Article

Soil Water Retention as Affected by Management Induced Changes of Soil Organic Carbon: Analysis of Long-Term Experiments in Europe

1
Department of Earth and Environmental Sciences, KU Leuven, 3001 Leuven, Belgium
2
DAFNAE Department, University of Padova, 35122 Legnaro, Italy
3
Crop Research Institute, Prague 6-Ruzyne, 16100 Prague, Czech Republic
4
Soil Service of Belgium (BDB), 3001 Heverlee, Belgium
5
Institute of Earth and Environmental Sciences, UMCS, 20-035 Lublin, Poland
6
Game & Wildlife Conservation Trust, Allerton Project, Loddington, Leicester LE7 9XE, UK
7
Georgikon Campus Keszthely, Institute of Agronomy, Hungarian University of Agriculture and Life Sciences, 2100 Gödöllő, Hungary
*
Author to whom correspondence should be addressed.
Submission received: 25 October 2021 / Revised: 30 November 2021 / Accepted: 8 December 2021 / Published: 9 December 2021

Abstract

:
Soil water retention (SWR) is an important soil property related to soil structure, texture, and organic matter (SOM), among other properties. Agricultural management practices affect some of these properties in an interdependent way. In this study, the impact of management-induced changes of soil organic carbon (SOC) on SWR is evaluated in five long-term experiments in Europe (running from 8 up to 54 years when samples were taken). Topsoil samples (0–15 cm) were collected and analysed to evaluate the effects of three different management categories, i.e., soil tillage, the addition of exogenous organic materials, the incorporation of crop residues affecting SOC and water content under a range of matric potentials. Changes in the total SOC up to 10 g C kg−1 soil (1%) observed for the different management practices, do not cause statistically significant differences in the SWR characteristics as expected. The direct impact of the SOC on SWR is consistent but negligible, whereas the indirect impact of SOC in the higher matric potentials, which are mainly affected by soil structure and aggregate composition, prevails. The different water content responses under the various matric potentials to SOC changes for each management group implies that one conservation measure alone has a limited effect on SWR and only a combination of several practices that lead to better soil structure, such as reduced soil disturbances combined with increased SOM inputs can lead to better water holding capacity of the soil.

1. Introduction

Soil water retention (SWR) is a measure of how much water a particular type of soil can retain. It is an important soil property related to the distribution of pore space and, thus, is highly dependent on soil structure and texture, as well as on other related properties such as soil organic matter (SOM) [1]. SWR is critical for crop growth with a profound influence on crop yield and crop failure and acts as the main source of moisture for the soil’s biota, which contributes to land productivity and biological soil health.
The relationship between the volumetric soil water content (θ) and the pressure head (or matric potential head, h) is described by the soil water retention curve (WRC), also known as the soil moisture characteristic curve or pF curve [2]. This curve is characteristic for different soils and is used to predict soil water storage for applications in agronomy, ecology, hydrology and many other soil-related sectors [3,4,5,6], as well as in earth systems models [7,8].
For the determination of the WRC, different field and laboratory methods exist [9,10,11]. Analytical models [12] or regression equations—empirical formulas called pedo-transfer functions (PTF)—are used to predict the WRC values from easily measured or already available soil properties [13,14,15,16,17]. The majority of the PTFs for estimating the WRC use soil texture, bulk density and SOM content as predictors [1,13,17], although the necessity of the latter has been questioned [18] or shown to improve the estimations only for specific soil water potentials [19]. For modelling purposes, analytical functions are fit to a set of observed h-θ values used to represent the continuous WRC. The most common retention functions have been presented by Brooks and Corey [20] and by van Genuchten [21].
The dependence of the SWR on texture and structure has been widely researched and demonstrated [22]. The dependence of the SWR on SOM content has also been proven [23,24], but the results on the quantitative influence of SOM are contradictory and vary with texture, pressure head and soil organic carbon (SOC) content as such [24,25,26] and therefore need to be further evaluated [27]. Analysing the effect and relationship of SOC content on SWR taking into account different soil textures has shown that the sensitivity of the SWR to SOC changes depending on the soil textural classes and on the SOM content itself [24,26]. For the same SOC increase, soils with coarser textures and low SOC contents present a larger increase in water retention than the finer soils [26], which may also present a decrease [24]. In contrast, for soils with high SOC contents the water retention increases for all textural classes, especially for sandy and silty soils [24]. Nevertheless, as pointed out in a review by Minasny and McBratney [26], a 1% absolute mass increase of SOC (10 g C kg−1 soil) has a limited effect on the SWR and can increase the available water capacity by up to 1.16% volumetrically. They also found that the effect is relatively larger for sandy soils. A change in the SOC content also influences the water content at the different pressure points in a different way [26], with field capacity (FC at −33 kPa or pF 2.5) to present higher sensitivity than the wilting point (WP at −1500 kPa or pF 4.2) [24]. Nevertheless, the use of SOM as an auxiliary predictor for the SWR through PTFs has been proven to be redundant when bulk density is also used as a predictor [18].
The different management practices applied in cropping systems affect the soil structure and soil composition, and consequently the SWR and other physical soil properties. Organic and conservation farming (defined as a farming system that promotes practices about maintenance of a permanent soil cover, minimum soil disturbances and crop diversification [28]) can increase the soil water storage through better soil aggregation and improved soil structure [29], but in some cases, the conventional systems yield higher water contents as a result of higher microporosity [30]. The SOC decreases when SOC losses due to erosion or/and mineralization, which can be stimulated also through soil tillage, exceed the organic carbon inputs coming from the addition of exogenous organic inputs (compost or manure) and organic inputs from crop residues (shoots and roots) [31].
Adding more exogenous organic materials such as compost or farmyard manure and the incorporation of crop residues into the soil above the SOC mineralization rate causes an increase in the total SOC in most cases [32,33,34]. However, the quality and stage of decomposition of exogenous organic materials affect how much of this added carbon remains as stable organic carbon in the soil [31,35]. The degree of maturation of manure and the composition of the compost greatly affects retention rates of organic carbon in the soil [36]. The addition of exogenous organic material increases the volumetric water content at most pressure heads, mainly because of the increase in total porosity [37] and the increase in total SOC. Mulching with or incorporating the crop residues has been proven to significantly impact the SWR in the wet range (pF < 2), but not in the dryer range (pF > 3) [34,38,39].
Reduced or no-tillage is often advocated to increase the SOC in the topsoil, which is important for a good structure, increased infiltration and reduced soil erosion rates when compared to conventional ploughing, but the results are controversial when considering the whole soil profile [31,40,41]. Conservation tillage has been proven to improve chemical soil properties such as SOM or physical soil properties such as aggregate stability of the topsoil, but the effects on soil water content are, in many cases not, significant [42] or controversial [43]. Sometimes the results are not solely dependent on soil tillage type but vary with matric potential [44,45,46]. The water content tends to be larger in the higher pressures (pF < 1 or wetter part) for conventional tillage when compared with conservation or no-tillage but in the smaller potentials the water content is larger for the conservation or no-tillage practices [44,46]. There are also cases where significant differences in the water content are present only in the more negative (pF > 3 or dryer) matric potentials [47]. López et al. [48] and Kargas and Londra [47] found that reduced and conventional tillage result in similar water content values, whereas no-tillage leads to lower values of water storage. On the other hand, Bescansa et al. [44] found that soil water content was higher in the no-tillage fields when compared to conventional tillage, especially in the drier condition because of the higher available water content caused by increased SOC content and changes in the pore distribution of the untilled soils.
Although previous studies have investigated the effects of management on the soil chemical and physical properties, less attention has been given to the link between combined management practices and SWR. In addition, most studies include a limited number of management practices and intensities and are not replicated in multiple agroecosystems and/or study regions that cover broad environmental gradients (i.e., climatic conditions and soil properties), possibly due to the logistical constraints associated with extensive field work. Finally, a comparison between published data is frequently hindered by methodological discrepancies between studies. To this end, studies that investigate broad management practices and intensities in multiple agroecosystems and regions with distinct environmental conditions are well needed to understand the interactions between soil structure, organic carbon, and water retention.
In our study, we compared seven long-term (8–54 years) experimental setups by sampling the topsoil with identical methods and analysing all samples in the same laboratory. The field experiments have been set up with specific and different objectives, but all together they cover a broad range of tillage practices, fertilization, additions of organic materials and management of crop residues. The objective of this study was to evaluate and quantify comprehensively the effect of different management practices on SOC content and their impact on the water-holding capacity of the soils.

2. Materials and Methods

2.1. Experiments’ Descriptions

Topsoil samples were collected from seven different long-term agricultural experiments with different treatments in 5 European countries (the towns, countries, coordinates, start year of the experiment and main soil type of the sites are given in Table 1). In each country, the experiments were setup with different objectives and under different environmental conditions. Although the diversity of the experiments makes it challenging to combine them, they offer a wide range of representative management practices and pedo-climatological conditions. As the original experiments attempted to answer different scientific questions, they include several management treatments. For this research, a subset of treatments was selected from each experiment to include treatments from three main categories. The first category includes different soil tillage treatments (CZ, HU_2, UK), the second category comprises the addition of different types of exogenous organic materials (BE, IT_1c, IT_1p), and the third category deals with the incorporation of crop residues in the topsoil (HU_1, IT_2c, IT_2l). The experiments in Italy are conducted on two different soil types each and, in this study, are analysed as separate experiments: a clay and an initially peaty soil for IT_1 (i.e., IT_1c and IT_1p) and a clay and a loamy soil for experiment IT_2 (i.e., IT_2c and IT_2l) resulting in nine experiments in our study. The selected treatments per experiment are presented in Table 2. At the five study sites, an identical sampling procedure was performed for determining the WRC and SOC.

2.2. WRC Points Determination

To estimate the water content at the different points of the WRC, three undisturbed topsoil samples (positioned in the middle of 0–15 cm layer) were collected from each experimental plot (apart from Italy where the plots are too small and only one ring sample per plot could be collected) with the use of a Kopecky ring, of a known volume (100 cm3). The 177 soil samples taken at different dates do not represent an equal number for each experiment and experimental plot (details about the number of samples per experimental plot are shown in Table 3). The top organic layer was first removed and with the use of suitable equipment (i.e., hammering holders and plastic hammer) to minimize soil disturbances the rings were pushed into the soil to collect the samples, which were stored afterwards at room temperature until analysis.
In this paper, we use pF to indicate the soil water potential. The pF is defined as the decimal logarithm of the absolute value of pressure head expressed in cm (pF = log10|h|).
The drainage or drying cycle was used for the determination of the volumetric water content at moisture tensions (suction) from pF 0 to pF 4.2. Sandboxes were used for the determination of the water content at the lower suction values (pF 0.0, pF 1.0, pF 1.8 and pF 2.0) and pressure plates cells (Soilmoisture Equipment Corp.) were used for the determination of the sample water content at pF 2.7, pF3.4 and pF 4.2 [55].

2.3. OC Determination

The largest component and easiest indicator of SOM status to measure is the SOC content and it is used in this report both to present the results and when we refer to content changes in the existing literature. SOC content was determined by dry combustion and mass spectrometry elemental analysis (Carlo-Erba EA 1110, Thermo Scientific, Waltham, MA, USA). Fresh disturbed field topsoil samples (0–15 cm) were taken with a sharp shovel from various spots within each experimental plot, mixed and directly broken to pass a <8 mm sieve. Soil samples were then stored in plastic containers to avoid compaction and disturbance during transportation and then stored in the refrigerator until air-drying could be carried out. All samples were air-dried at 40 °C until a constant mass was achieved and stored in a dark and dry place at room temperature. A subsample of the bulk soil was taken with a soil sample splitter to allow for a random representative sample, crushed manually to a homogenized powder and weighted into an Ag capsule. To determine only the carbon present in organic form carbonates were removed by adding HCl (35%). After drying at 40 °C the soil samples were loaded into the autosampler for combustion with oxygen at 800 °C with the presence of a catalyst. The organic carbon (OC) reacts to carbon dioxide (CO2) which is quantified by infrared absorption spectroscopy and the mass percentage is determined

2.4. Statistical Analysis and Visualization Tools

The statistical data analysis was performed using R-Studio, R version 3.6.1 [56]. One-way Analysis of Variance (ANOVA) was carried out with the R software [57] to test for differences between treatments. Estimated marginal means (also known as least-squares means) by factors were computed by the least square method using the package “emmeans” [58]. Graphs were produced with the package “ggplot2” [59]. In the present work, statistical significance is assumed at p < 0.05. The assumptions of normality and homoscedasticity of the residuals were assessed by visual inspection of Q-Q plots and by plotting the normalized residuals against the fitted values.

3. Results and Discussion

3.1. Soil Organic Carbon
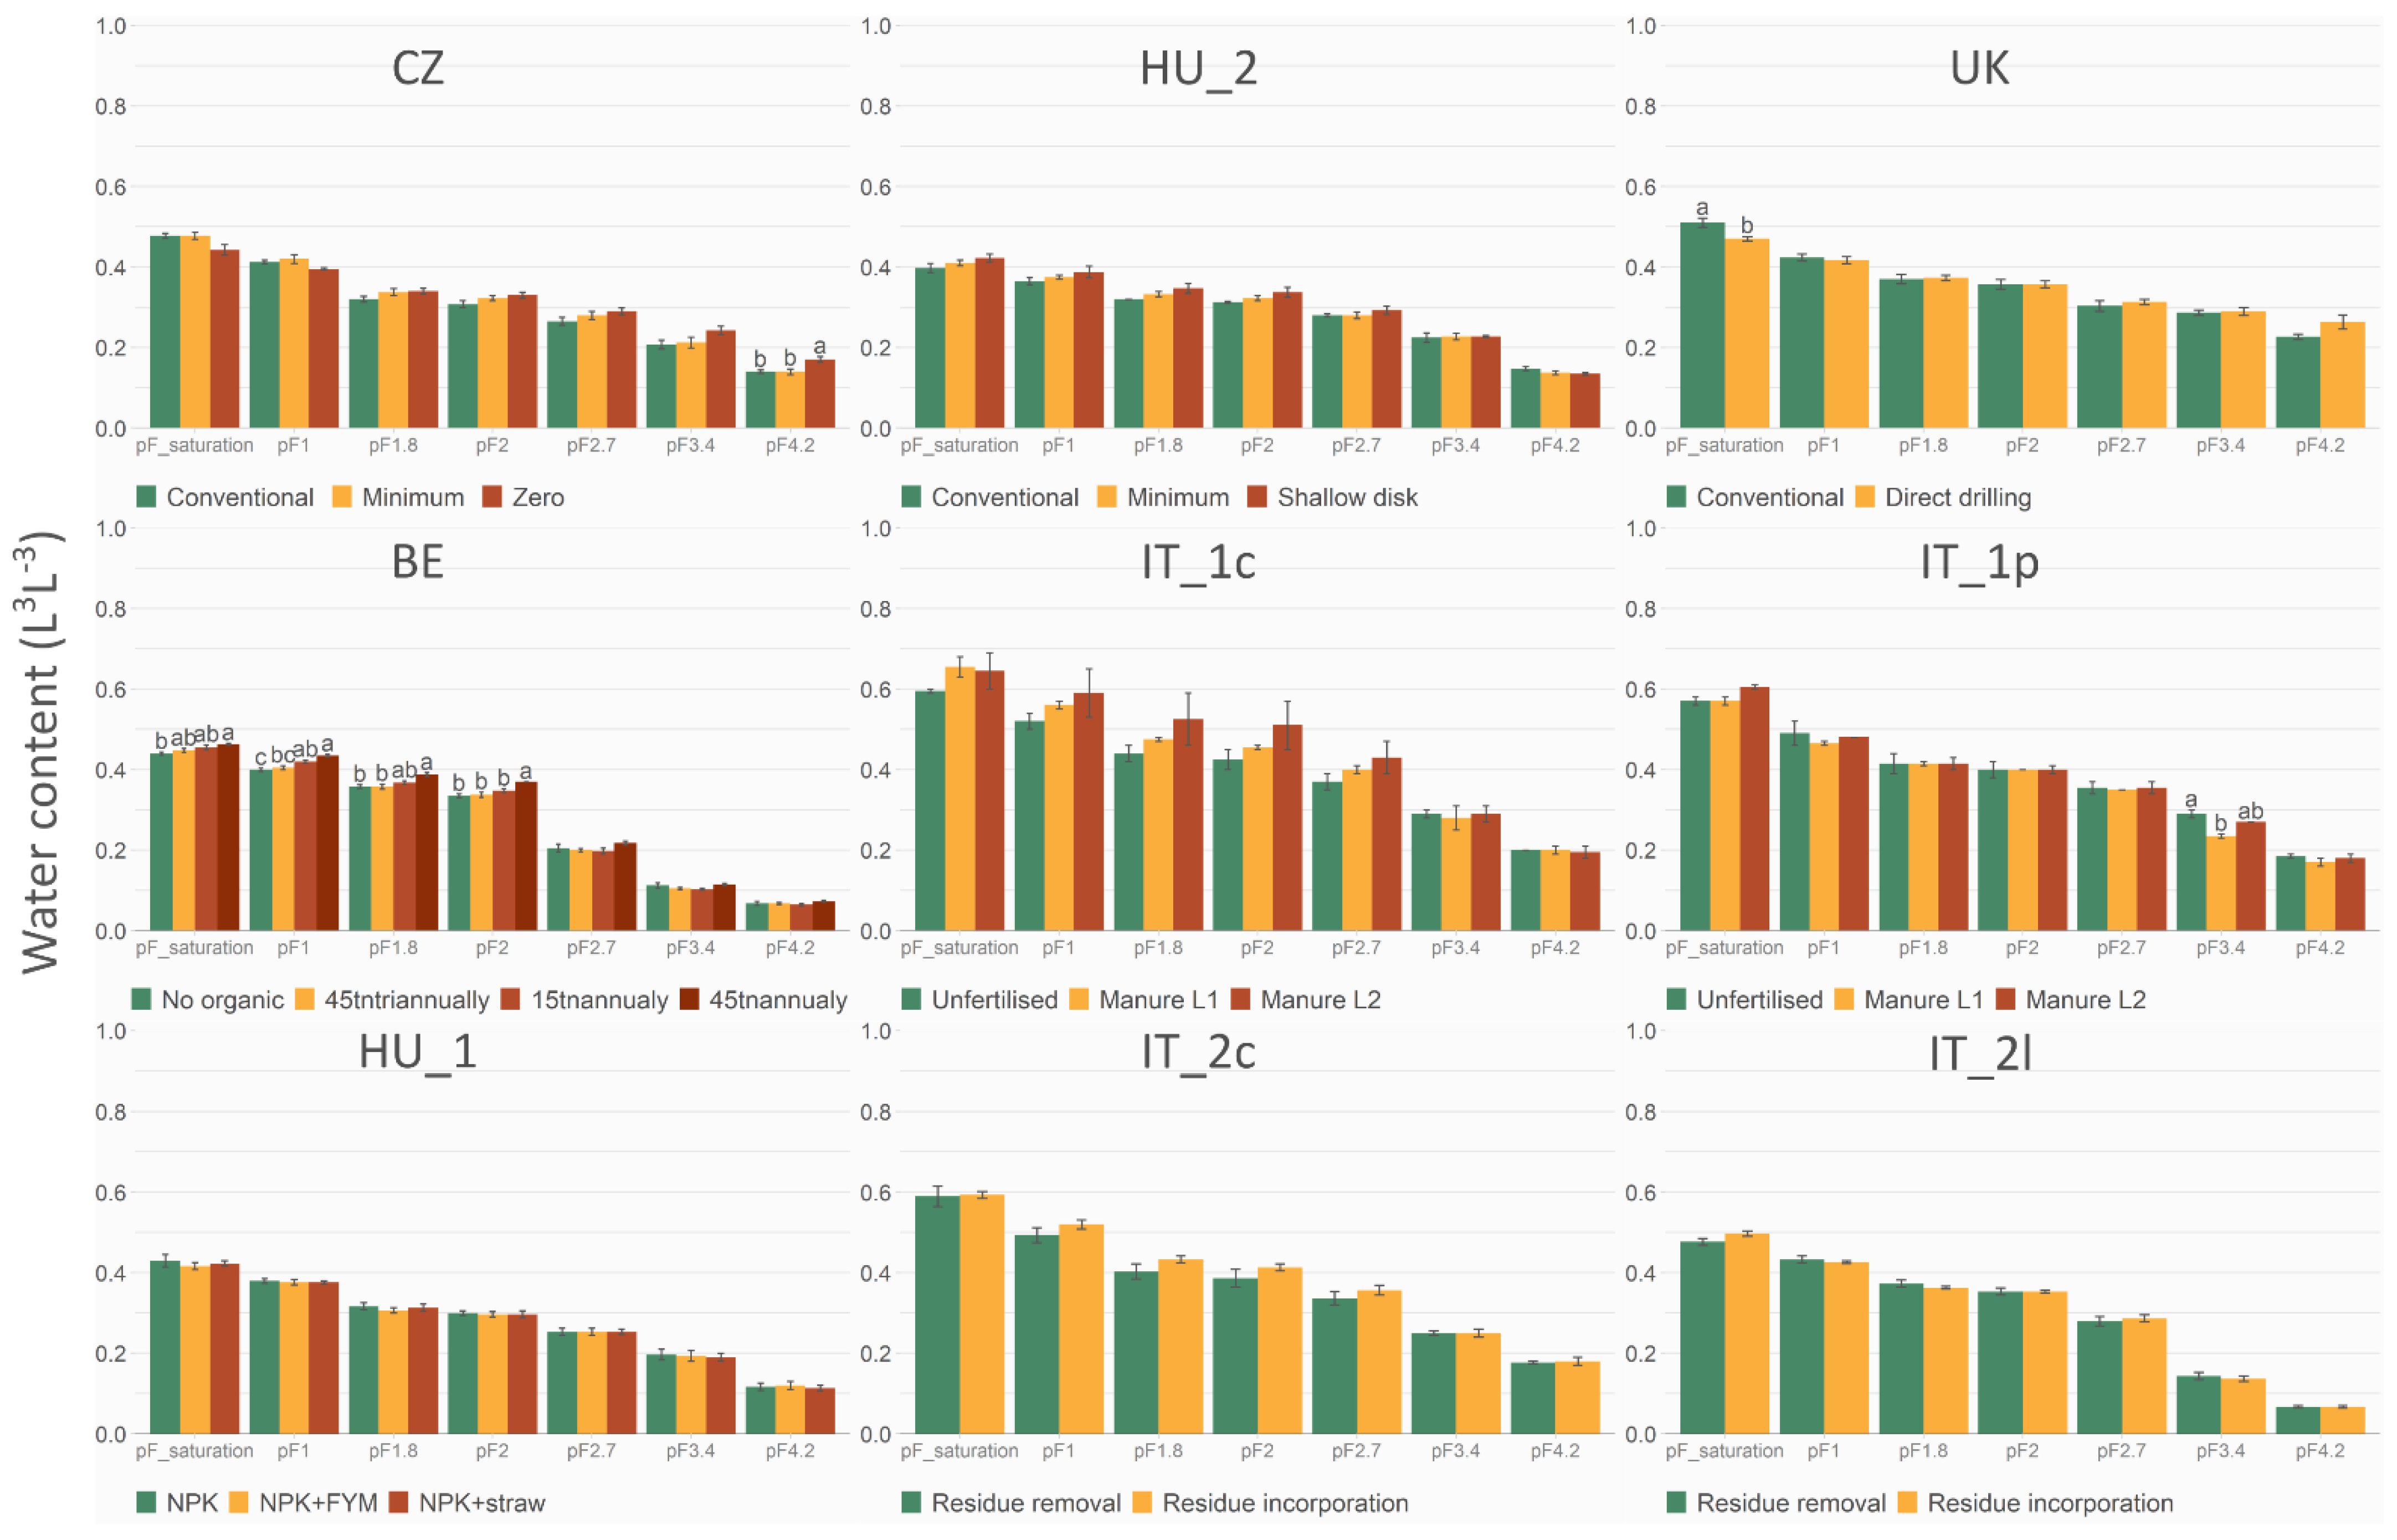
The total SOC as determined in the bulk soil is presented in Figure 1. Generally, SOC is relatively sensitive to the different management treatments and statistically significant differences are present among most of them. In the field experiments sampled, values of total organic carbon vary between 6 and 56 g C kg−1 soil (0.6–5.6%). The highest values observed is in the IT_1p experiment, in which an initially peaty soil was treated with different levels of manure. The lowest values were observed in the IT_2l experiment, where removal of residues took place in a loamy soil.
In the organic input experiments, as was expected [33], the higher amount of manure or compost resulted in a higher SOC. Nevertheless, statistically significant SOC differences are observed only between the higher levels of additions and the controls, which in all cases are those with only mineral inputs apart from the IT_1p and IT_1c in which the control is unfertilized treatment. In the IT_1p experiment, no statistically significant differences are observed but despite this, treatments with organic inputs show a trend that follows that same assumption i.e., higher input of organic materials leads to higher SOC. In this experiment, where agricultural management was established in initially peaty soil, there is a reduction in the total SOC over the years because of cultivation, but the decline is lower when manure is added, highlighting the importance of organic fertilizers in maintaining soil fertility in the long term [60].
In the tillage experiments, the treatments with the minimum soil disturbance present statistically significantly higher values of SOC content in the 0–15 cm layer than the treatments where conventional tillage took place, since fresh organic material will be kept concentrated at the topsoil [61,62]. As a result of the no- or reduced- tillage practices, apart from the increased organic inputs from the crop residues which are concentrated in the top layer, and the roots that remain intact in the soil, the carbon outputs by mineralization are reduced in the no-tillage systems. Reduced tillage systems present similar levels of mineralization with the conventional ploughing [61,63] but, according to recent evidence, reduced tillage presents lower CO2 emissions [64] or higher levels of mineralizable carbon [65] when compared to conventional ploughing, indicating reduced mineralization because of minimal disruption of the stable aggregates. A more stable soil structure and improved aggregation also lead to reduced losses of fertile carbon-rich topsoil because of reduced water erosion. Nevertheless, it should always be kept in mind that only the topsoil 0–15 cm was sampled. Carbon stock changes may be observed in the no- or reduced-tillage experiments within the top layer sampled but if the whole soil profile is considered, conclusions cannot be drawn from our analysis. There is recent evidence to show that when the time since the adoption of the no-tillage system is considered (i.e., at least 6 years application of no-till), the increase of the carbon content in the top layers (0–20 cm) and the no change of the SOC in the deeper layers of the soil profile lead to an overall increase in the carbon stocks under no-tillage [41]. On the other hand, there is also evidence that when the entire soil profile is analysed, soil cultivation methods do not affect the SOC quantity but rather redistribute it in the profile [31,61,66,67,68].
In the HU_1 experiment, the incorporation of the straw and stalks causes a small but statistically significant difference in the SOC content when compared with the only mineral fertilized treatment and also significantly increased soil aggregate stability [69], supporting this way the physical soil condition. In contrast, in the IT_2c and IT_2l experiments, small or no statistically significant changes are noticed between the treatments. This, on the one hand, confirms the little potential of crop residues for soil improvement [70] and, on the other hand, raises questions if only the incorporation of crop residues without any kind of pre-processing like composting, conversion to biochar or the parallel use of other conservation measures such as reducing tillage, can contribute to the build-up of SOC. Indeed, in the same Italian experiment Dal Ferro et al. [71] recently found that residues incorporation seems to be effective in SOC storage only when coupled with minimum-tillage practice.
The results indicate that the SOC is a sensitive and good indicator to monitor changes caused in the soil quality by management practices in the long-term. The results should always consider the sampling depth, especially when tillage practices with different tillage depths are compared.

3.2. WRC

In Figure 2, the soil water content as a function of the matrix pressures (expressed in pF) is shown for all the study sites as measured in the laboratory conditions which may be different from field conditions. Although all trends looked consistent, whereby more SOC consistently meant a slightly higher water content for a given pF, we detected only a few statistically significant differences (in only 3 out of 9 experiments and in a limited number of pressure points).
In the soil tillage experiments, there are no statistically significant changes in the soil water content among the different levels of tillage, but a pattern is observed. In the CZ and UK experiments, we observe that in the higher matric potential range the treatments with the higher levels of disturbances present higher water content, whereas in the lower pressures the pattern is opposite: here, the higher the soil disturbance the lower is the water content. This happens because in the higher pressures (less negative) the macropores and capillary forces play an important role in the total water content, whereas in the lower matric potential the adsorption on the soil particles and the SOM work as water storage pools [72]. These results follow McVay et al. [42], who also observed that tillage methods do not significantly affect the WHC of most of the soils analysed and reported changes only in the higher matric potentials [44,46,47], indicating that tillage mainly influences the volume of larger pore sizes, dominantly influencing water infiltration and aeration of the soil.
Higher organic matter input always led to modestly higher water content at all pressures. Only in the BE experiment, there are statistically significant differences among the treatments in the higher pressures (less negative or wetter part) as a result of an annual addition of 45 tonnes of compost per hectare. It is important to point out that a yearly dose of 45 tonnes of compost is excessive as compared to normal practice. In the IT_1c experiment, in which different levels of farmyard manure are applied in clay soil, the high variability in the water content among the replicates did not allow to detect statistically significant differences, but the same trend is observed i.e., higher organic matter input leads to higher water content at all pressures. In the same experiment with the peaty soil with initially 18% organic carbon, this trend is not noted. The results are consistent with Eusufzai and Fujii [37] who found that organic amended soils present increased water content, especially in the higher pressure points.
In the last experiment group in which the crop residues are incorporated into the soil after the cropping season, our analysis does not reveal consistent changes in the water storage capacity, or at least consistent trends to justify the reported findings in the literature that incorporation of residues impacts the water retention in the higher matric potentials [34,38,39].
An analysis of the effect of different practices in the whole WRC as calculated from the Rosseta version 3 model [17] is presented in Figure S2 of the Supplementary Materials; changes are observed only in the wetter part of the retention curve, whereas the dryer part is not affected by the different applied cropping systems.

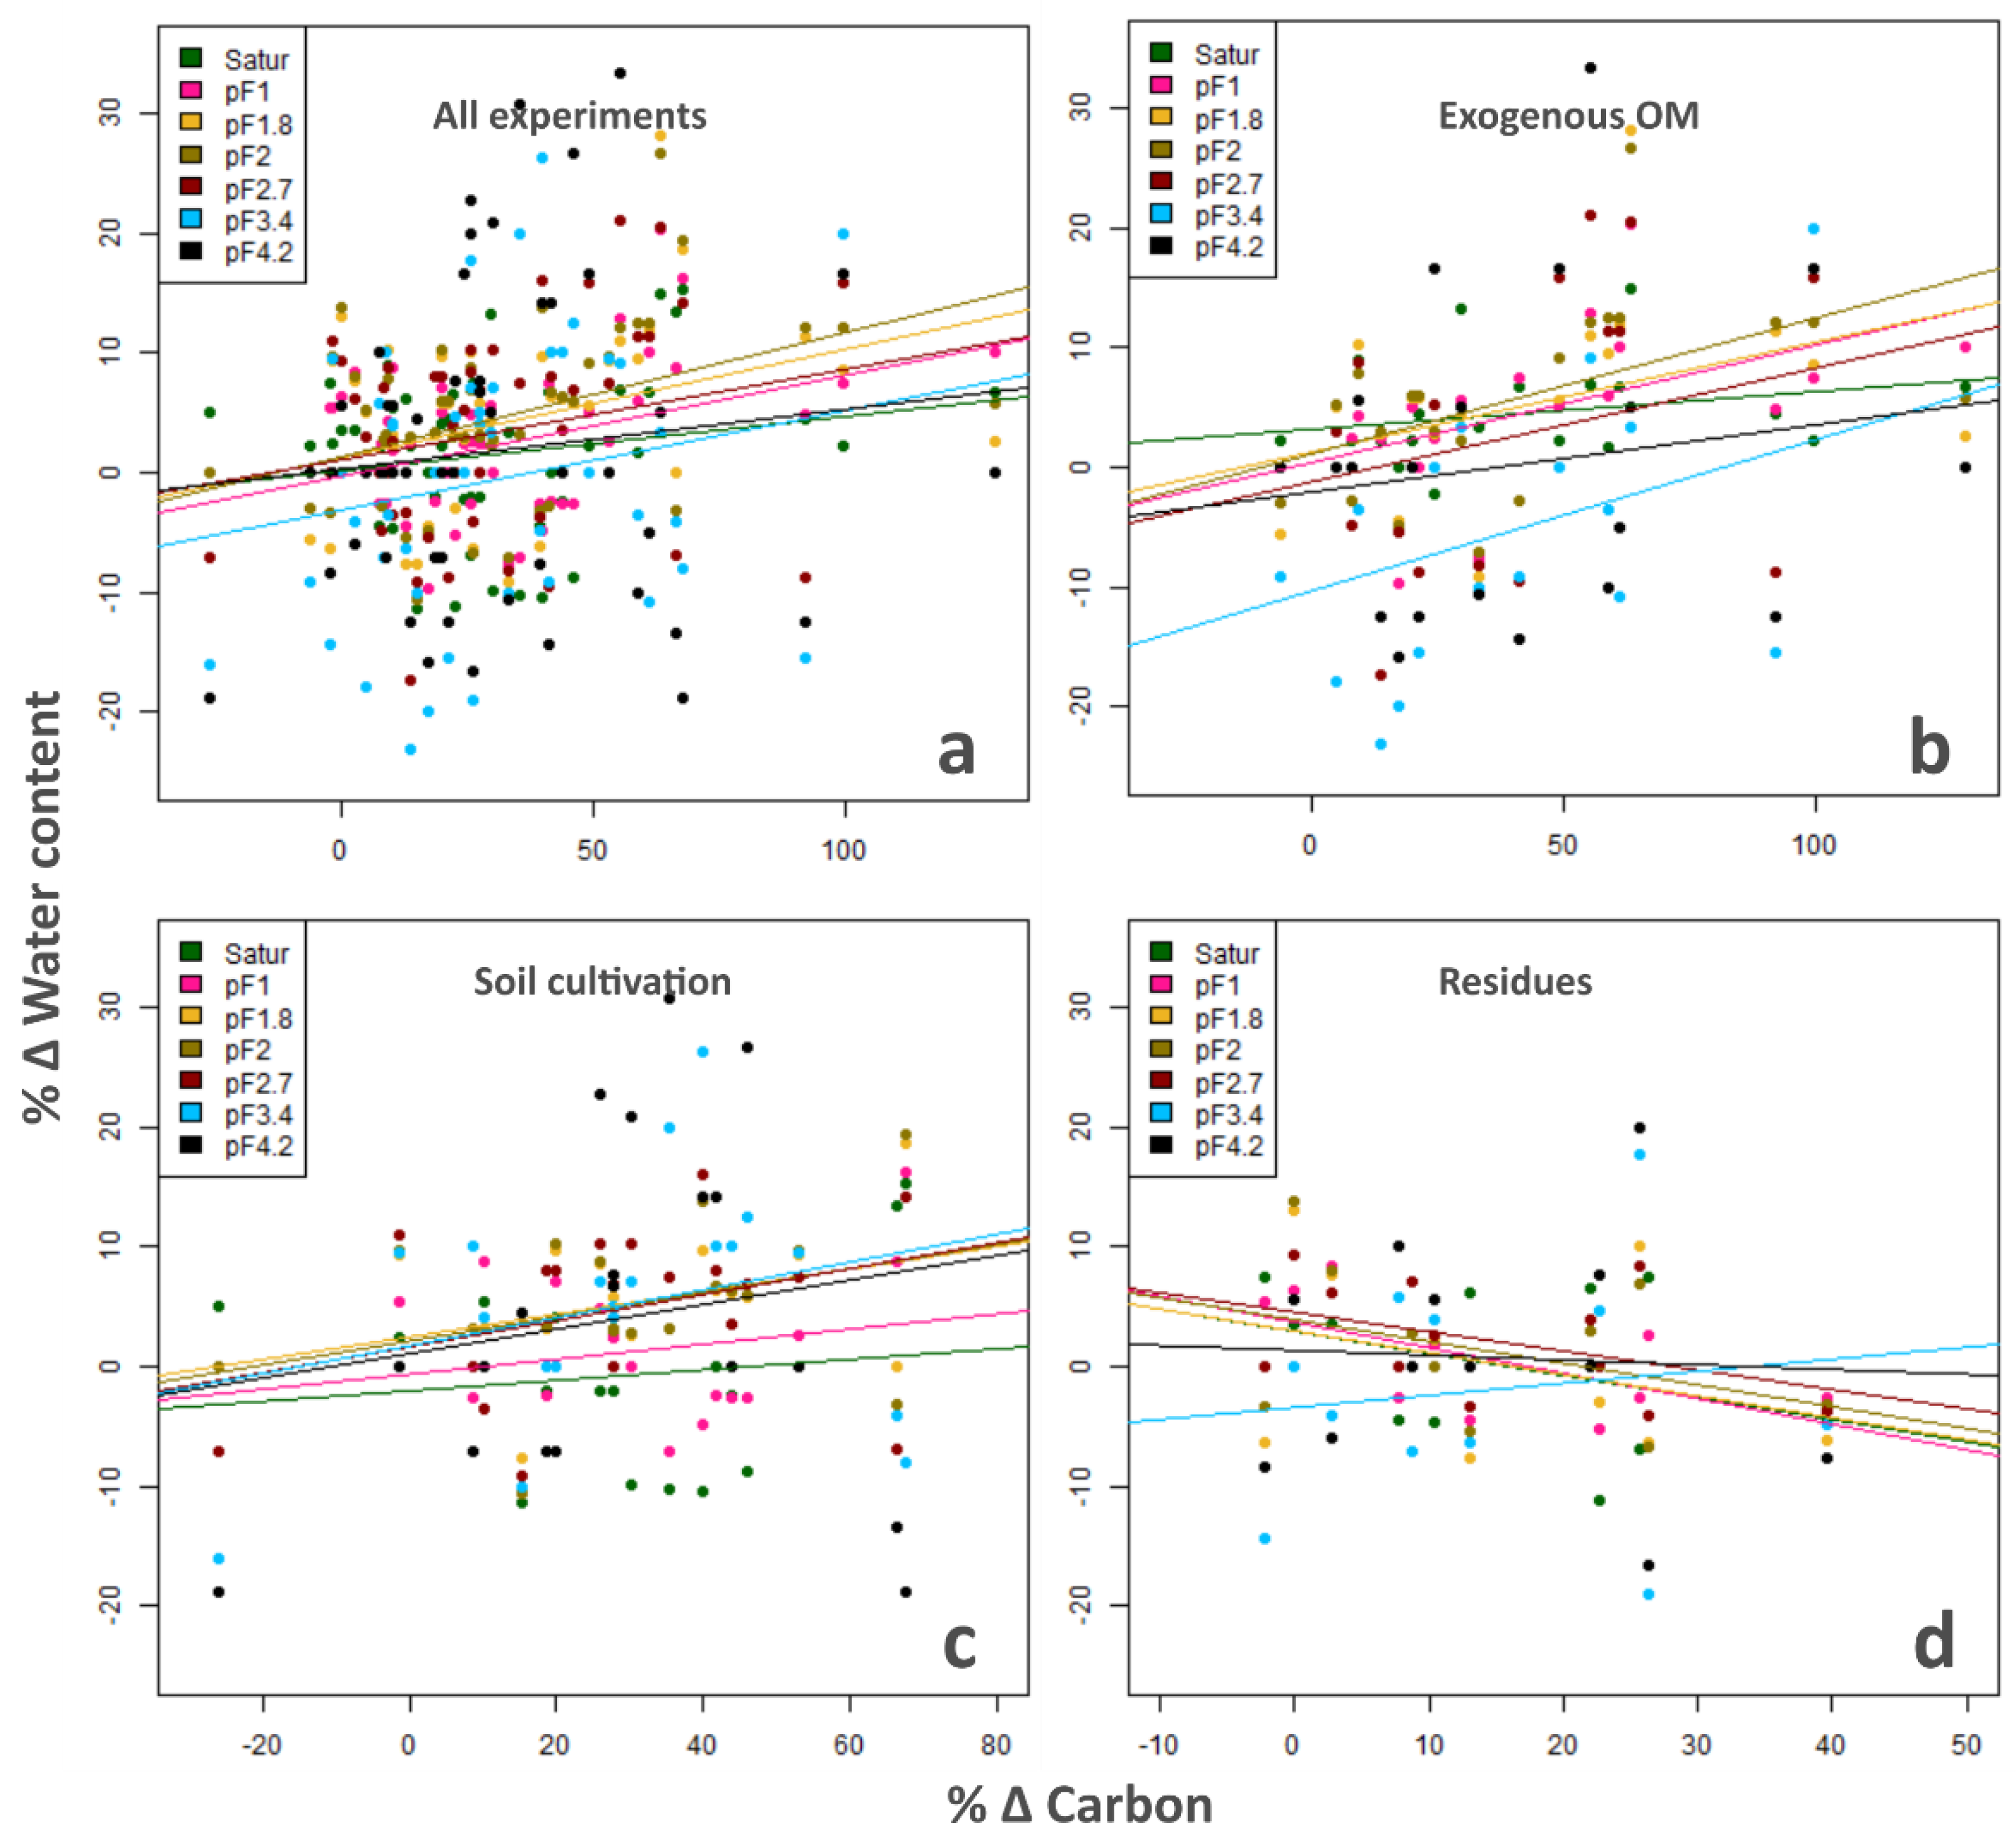
3.3. Water Retention as Affected by Carbon Changes and Management Practices

In Figure 3, the percentage differences of water content in relation to the percentage differences of SOC content among the different plots of each experiment are presented as differences with the corresponding control treatment of the relevant block. When all experiments are analysed together, it is observed that the increase of total SOC over the period that each experiment is running, generally causes an increase in water content at all moisture tensions, especially for the higher matric potentials (wetter conditions) at which the regression relationship is also statistically significant (Table 4). This trend is less pronounced at the permanent wilting point (pF 4.2), where the impact is almost negligible. As a result of the negligible increase in the wilting point and the bigger increase in the water content at field capacity, the plant available water increases even with an 1% increase of the total SOC.
Comparing the results of the percentage differences of water content in relation with the SOC percentage changes in each experiments group, it is observed that the impact of increased carbon content on the water content does not only depend on the pressure point, texture, and organic carbon content, but also on the applied management practices. Management practices that increase bulk density (no- tillage, reduced OM inputs etc.) decrease the volume fraction of macro-pores, but at the same time increase the volume fraction of both micro- and meso-pores, resulting in an increase of the water content at lower matric potentials and a decrease under wetter conditions [73]. In the soil tillage experiments where the maximum carbon increase observed is about 0.65% as a result of practices that minimize topsoil disturbances, an increase in the soil water content is observed in the lower matric potentials (drier conditions) as a result of increased SOC and surface adsorption [72,74], as also observed from Bescansa et al. [44] and a smaller increase of the water content in the wetter conditions (saturation and pF 1) as a result of changes in the pore distribution and capillary forces [72,74]. These two conditions may lead to a decrease in the plant available water content (AWC) when cultivation practices with less soil disturbance are followed as also mentioned by Hill [75]. Indeed, as shown in Figure S1 in the Supplementary Materials, the AWC in the CZ experiment is statistically significantly lower in the zero-tillage treatment when compared with the minimum tillage, and in the UK experiment it is lower, but not statistically significant in the direct drilling treatment in comparison with the conventional ploughing. In the experiments where exogenous organic material is added, a cca. 1% increase in SOC increases the soil water content under all applied pore water pressures but the increase is lower in the drier conditions and sometimes also a decrease in the soil water content is presented when compared to no addition of organic materials. The addition of organic material leads to increased macro aggregation and therefore increased meso- and macroporosity [37,73] and increased water content in these pores, resulting in less water available for storing in the micropores. A negligible increase in the dryer conditions denotes also that the increase of SOC does not increase the sorbed water or that it is counteracted by the increased macroporosity. Nevertheless, the negligible increase in the water content in the wilting point and the big increase in the water content at field capacity will lead to higher plant available water content (Figure S1Supplementary Materials), something that impacts positively the plant growth. In the experiments where the residues have been incorporated in the topsoil, the soil water content decreases or remains similar, even if an increase of 0.3% of the total SOC is observed. Despite the long-term application, there were no large SOC changes following the incorporation of the residues. Building up SOC and simultaneously a stable soil structure might be more important than a large increase in SOC content, especially during wetter soil conditions.
There is a strong belief and impression by practitioners and advocates of conservation agriculture and organic farming that an increase in the total SOC increases water retention directly and substantially [76,77,78]. In this research, the water retention characteristics present the expected but modest trends. However, it is remarkable that even after 54 years of practices that increase SOC, the observed differences in the water content, especially in the lower pressures (drier conditions), are negligible from a practical point of view, and almost all not statistically significant. It was expected that in the lower water pressures (pF > 2.5) where the macropores and capillarity do not have an important impact and surface adsorption and SOC content seems to play the most important role in the soil’s water content, the differences in SWR among the different treatments would be noticeable. The statistically significant linear relationship of the carbon change and the water retention mainly in the wetter conditions (Table 4) and not in the drier conditions suggest that the direct impact of the increased SOC on water retention is limited and the indirect impact stronger. The fact that the change of SOC affects the water content under the different matric potential in a different way and is statistically significant only in the higher matric potentials implies that the impact of SOC is indirect and is more linked to the changes in other soil parameters and most probably in soil structure and aggregation status.

4. Conclusions

We analysed different groups of management practices for improving soil quality as applied in long-term experiments in five European countries. We investigated their effect on SOC and the link with the capacity of the soil to retain water at different matric potentials. Our findings suggest that practices that minimize soil disturbances cause an increase in SOC in the topsoil but may lead to decreased plant available water content as a result of the increased water content at wilting point and a less profound increase in water content at field capacity, jeopardizing the crop yield. On the other hand, the different soil-improving management practices that increase the organic materials in the soil (both exogenous and incorporation of residues) contribute to an increase in the soil water availability for the crops, but not because of increased water holding capacity as a result of increased SOC. The addition of organic materials affects the soil structure, and it is more likely that the soil structure—as improved by the SOM—affects the water availability because of more macro and mesopores, rather than because of larger water-holding capacity per soil volume caused by a SOC increase. The better structure formed by higher amounts and more stable SOC and the increase in SWR are important factors leading to increased water infiltration, even under long-term rainy conditions, and promoting several soil functions such as less soil erosion minimised effects of extreme rainfalls and droughts deeper rooting of the crops end enhanced crop productivity. The negligible effect of increased SOC under different management practices during drier conditions, and the increased effect in wetter conditions, implies that the indirect effects of SOC increase in the soil structure are more important and should be considered in future research.

Supplementary Materials

The following are available online at https://0-www-mdpi-com.brum.beds.ac.uk/article/10.3390/land10121362/s1, Figure S1: Plant Available Water Content as calculated from the difference between water content at field capacity (pF 2) and water content at wilting point (pF 4.2). Figure S2: WRC for each treatment. The lines represent the WRC as calculated from the Rosetta version 3 model with input the average silt clay and sand percentages, the average bulk density of the treatments as measured and the water content at field capacity and wilting point.

Author Contributions

Conceptualization, I.S.P. and G.W.; methodology, I.S.P.; formal analysis, I.S.P.; data curation, I.S.P.; writing—original draft preparation, I.S.P.; writing—review and editing, G.W., J.P., J.D., M.T., A.E., I.P., A.B., C.S., Z.T., H.K. and P.Č.; visualization, I.S.P.; supervision, G.W., J.D. and J.P.; project coordination, G.W.; funding acquisition, G.W. All authors have read and agreed to the published version of the manuscript.

Funding

This research was funded by the project “SoilCare: Soil Care for profitable and sustainable crop production in Europe” from the H2020 Programme under grant agreement n° 677407.

Institutional Review Board Statement

Not applicable.

Informed Consent Statement

Not applicable.

Data Availability Statement

The data that support the findings of this study are available from the corresponding author upon reasonable request and approval from the study sites representative co-authors.

Acknowledgments

We thank all the study sites owners for permitting the use of the experimental fields where this research was done and providing all types of help during the sampling campaign. We thank the laboratory assistant of the Department of Earth and Environmental Sciences of the KU Leuven Lore Fondu for providing valuable guidance and help during the soil samples analysis. ISP thanks Antonios Apostolakis for the extensive discussions and guidance on the statistical analyses and concepts.

Conflicts of Interest

The authors declare no conflict of interest.

References

  1. Vereecken, H.; Maes, J.; Feyen, J.; Darius, P. Estimating the soil moisture retention characteristic from texture, bulk density, and carbon content. Soil Sci. 1989, 148, 389–403. [Google Scholar] [CrossRef]
  2. Stephens, D.B. Vadose Zone Hydrology, 1st ed.; CRC Press: Boca Raton, FL, USA, 1996. [Google Scholar]
  3. Grillakis, M.G.; Koutroulis, A.G.; Alexakis, D.D.; Polykretis, C.; Daliakopoulos, I.N. Regionalizing Root-Zone Soil Moisture Estimates From ESA CCI Soil Water Index Using Machine Learning and Information on Soil, Vegetation, and Climate. Water Resour. Res. 2021, 57, e2020WR029249. [Google Scholar] [CrossRef]
  4. Pan, T.; Hou, S.; Liu, Y.; Tan, Q. Comparison of three models fitting the soil water retention curves in a degraded alpine meadow region. Sci. Rep. 2019, 9, 18407. [Google Scholar] [CrossRef] [PubMed]
  5. Vereecken, H.; Weynants, M.; Javaux, M.; Pachepsky, Y.; Schaap, M.G.; van Genuchten, M.T. Using Pedotransfer Functions to Estimate the van Genuchten-Mualem Soil Hydraulic Properties: A Review. Vadose Zone J. 2010, 9, 795–820. [Google Scholar] [CrossRef]
  6. Zhang, L.; Han, J. Improving water retention capacity of an aeolian sandy soil with feldspathic sandstone. Sci. Rep. 2019, 9, 14719. [Google Scholar] [CrossRef] [Green Version]
  7. Fatichi, S.; Or, D.; Walko, R.; Vereecken, H.; Young, M.H.; Ghezzehei, T.A.; Hengl, T.; Kollet, S.; Agam, N.; Avissar, R. Soil structure is an important omission in Earth System Models. Nat. Commun. 2020, 11, 522. [Google Scholar] [CrossRef] [Green Version]
  8. Van Looy, K.; Bouma, J.; Herbst, M.; Koestel, J.; Minasny, B.; Mishra, U.; Montzka, C.; Nemes, A.; Pachepsky, Y.A.; Padarian, J.; et al. Pedotransfer Functions in Earth System Science: Challenges and Perspectives. Rev. Geophys. 2017, 55, 1199–1256. [Google Scholar] [CrossRef] [Green Version]
  9. Lu, D.; Wang, H.; Huang, D.; Li, D.; Sun, Y. Measurement and Estimation of Water Retention Curves Using Electrical Resistivity Data in Porous Media. J. Hydrol. Eng. 2020, 25, 04020021. [Google Scholar] [CrossRef]
  10. Sun, D.; You, G.; Annan, Z.; Daichao, S. Soil–water retention curves and microstructures of undisturbed and compacted Guilin lateritic clay. Bull. Eng. Geol. Environ. 2016, 75, 781–791. [Google Scholar] [CrossRef]
  11. Whalley, W.R.; Ober, E.S.; Jenkins, M. Measurement of the matric potential of soil water in the rhizosphere. J. Exp. Bot. 2013, 64, 3951–3963. [Google Scholar] [CrossRef] [Green Version]
  12. Sun, H.; Lee, J.; Chen, X.; Zhuang, J. Estimating soil water retention for wide ranges of pressure head and bulk density based on a fractional bulk density concept. Sci. Rep. 2020, 10, 16666. [Google Scholar] [CrossRef]
  13. Cornelis, W.M.; Ronsyn, J.; Van Meirvenne, M.; Hartmann, R. Evaluation of Pedotransfer Functions for Predicting the Soil Moisture Retention Curve. Soil Sci. Soc. Am. J. 2001, 65, 638–648. [Google Scholar] [CrossRef]
  14. Schaap, M.G.; Leij, F.J.; Van Genuchten, M.T. Rosetta: A computer program for estimating soil hydraulic parameters with hierarchical pedotransfer functions. J. Hydrol. 2001, 251, 163–176. [Google Scholar] [CrossRef]
  15. Tóth, B.; Weynants, M.; Nemes, A.; Makó, A.; Bilas, G.; Tóth, G. New generation of hydraulic pedotransfer functions for Europe. Eur. J. Soil Sci. 2015, 66, 226–238. [Google Scholar] [CrossRef]
  16. Wösten, J.H.M.; Pachepsky, Y.A.; Rawls, W.J. Pedotransfer functions: Bridging the gap between available basic soil data and missing soil hydraulic characteristics. J. Hydrol. 2001, 251, 123–150. [Google Scholar] [CrossRef]
  17. Zhang, Y.; Schaap, M.G. Weighted recalibration of the Rosetta pedotransfer model with improved estimates of hydraulic parameter distributions and summary statistics (Rosetta3). J. Hydrol. 2017, 547, 39–53. [Google Scholar] [CrossRef] [Green Version]
  18. Zacharias, S.; Wessolek, G. Excluding Organic Matter Content from Pedotransfer Predictors of Soil Water Retention. Soil Sci. Soc. Am. J. 2007, 71, 43–50. [Google Scholar] [CrossRef]
  19. Contreras, C.P.; Bonilla, C.A. A comprehensive evaluation of pedotransfer functions for predicting soil water content in environmental modeling and ecosystem management. Sci. Total Environ. 2018, 644, 1580–1590. [Google Scholar] [CrossRef]
  20. Brooks, R.H.; Corey, A.T. Hydraulic Properties of Porous Media; Colorado State University: Fort Collins, CO, USA, 1964; Volume 3. [Google Scholar]
  21. Van Genuchten, M.T. A closed-form equation for predicting the hydraulic conductivity of unsaturated soils. Soil Sci. Soc. Am. J. 1980, 44, 892–898. [Google Scholar] [CrossRef] [Green Version]
  22. Kool, D.; Tong, B.; Tian, Z.; Heitman, J.L.; Sauer, T.J.; Horton, R. Soil water retention and hydraulic conductivity dynamics following tillage. Soil Tillage Res. 2019, 193, 95–100. [Google Scholar] [CrossRef] [Green Version]
  23. Hudson, B.D. Soil organic matter and available water capacity. J. Soil Water Conserv. 1994, 49, 189–194. [Google Scholar]
  24. Rawls, W.J.; Pachepsky, Y.A.; Ritchie, J.C.; Sobecki, T.M.; Bloodworth, H. Effect of soil organic carbon on soil water retention. Geoderma 2003, 116, 61–76. [Google Scholar] [CrossRef]
  25. Manns, H.R.; Parkin, G.W.; Martin, R.C. Evidence of a union between organic carbon and water content in soil. Can. J. Soil Sci. 2016, 96, 305–316. [Google Scholar] [CrossRef] [Green Version]
  26. Minasny, B.; McBratney, A.B. Limited effect of organic matter on soil available water capacity. Eur. J. Soil Sci. 2018, 69, 39–47. [Google Scholar] [CrossRef] [Green Version]
  27. Huntington, T. Available Water Capacity and Soil Organic Matter. In Encyclopedia of Soil Science; Taylor and Francis: New York, NY, USA, 2007; pp. 139–143. [Google Scholar]
  28. FAO. Conservation Agriculture. 2017. Available online: https://www.fao.org/conservation-agriculture/en/ (accessed on 27 November 2021).
  29. Williams, D.M.; Blanco-Canqui, H.; Francis, C.A.; Galusha, T.D. Organic farming and soil physical properties: An assessment after 40 years. Agron. J. 2017, 109, 600–609. [Google Scholar] [CrossRef]
  30. Głąb, T.; Pużyńska, K.; Pużyński, S.; Palmowska, J.; Kowalik, K. Effect of organic farming on a Stagnic Luvisol soil physical quality. Geoderma 2016, 282, 16–25. [Google Scholar] [CrossRef]
  31. Chenu, C.; Angers, D.A.; Barré, P.; Derrien, D.; Arrouays, D.; Balesdent, J. Increasing organic stocks in agricultural soils: Knowledge gaps and potential innovations. Soil Tillage Res. 2019, 188, 41–52. [Google Scholar] [CrossRef]
  32. De Clercq, T.; Merckx, R.; Elsen, A.; Vandendriessche, H. Impact of long-term compost amendments on soil fertility, soil organic matter fractions and nitrogen mineralization. Acta Hortic. 2016, 1146, 79–86. [Google Scholar] [CrossRef]
  33. Diacono, M.; Montemurro, F. Long-term effects of organic amendments on soil fertility. A review. Agron. Sustain. Dev. 2010, 30, 401–422. [Google Scholar] [CrossRef] [Green Version]
  34. Karlen, D.L.; Wollenhaupt, N.C.; Erbach, D.C.; Berry, E.C.; Swan, J.B.; Eash, N.S.; Jordahl, J.L. Crop residue effects on soil quality following 10-years of no-till corn. Soil Tillage Res. 1994, 31, 149–167. [Google Scholar] [CrossRef]
  35. Wang, H.; Boutton, T.W.; Xu, W.; Hu, G.; Jiang, P.; Bai, E. Quality of fresh organic matter affects priming of soil organic matter and substrate utilization patterns of microbes. Sci. Rep. 2015, 5, 10102. [Google Scholar] [CrossRef] [PubMed] [Green Version]
  36. Bhogal, A.; Nicholson, F.A.; Rollett, A.; Taylor, M.; Litterick, A.; Whittingham, M.J.; Williams, J.R. Improvements in the Quality of Agricultural Soils Following Organic Material Additions Depend on Both the Quantity and Quality of the Materials Applied. Front. Sustain. Food Syst. 2018, 2, 9. [Google Scholar] [CrossRef] [Green Version]
  37. Eusufzai, M.K.; Fujii, K. Effect of Organic Matter Amendment on Hydraulic and Pore Characteristics of a Clay Loam Soil. Open J. Soil Sci. 2012, 2, 372–381. [Google Scholar] [CrossRef] [Green Version]
  38. Hiel, M.P.; Chélin, M.; Parvin, N.; Barbieux, S.; Degrune, F.; Aboulkacem, L.; Colinet, G.; Degré, A.; Bodson, B.; Garré, S. Crop residue management in arable cropping systems under a temperate climate. Part 2: Soil physical properties and crop production. A review. Biotechnol. Agron. Soc. Environ. 2016, 20, 245–256. [Google Scholar]
  39. Mulumba, L.N.; Lal, R. Mulching effects on selected soil physical properties. Soil Tillage Res. 2008, 98, 106–111. [Google Scholar] [CrossRef]
  40. Wiesmeier, M.; Urbanski, L.; Hobley, E.; Lang, B.; von Lützow, M.; Marin-Spiotta, E.; van Wesemael, B.; Rabot, E.; Ließ, M.; Garcia-Franco, N.; et al. Soil organic carbon storage as a key function of soils—A review of drivers and indicators at various scales. Geoderma 2019, 333, 149–162. [Google Scholar] [CrossRef]
  41. Cooper, H.V.; Sjögersten, S.; Lark, R.M.; Mooney, S.J. To till or not to till in a temperate ecosystem? Implications for climate change mitigation. Environ. Res. Lett. 2021, 16, 054022. [Google Scholar] [CrossRef]
  42. McVay, K.A.; Budde, J.A.; Fabrizzi, K.; Mikha, M.M.; Rice, C.W.; Schlegel, A.J.; Peterson, D.E.; Sweeney, D.W.; Thompson, C. Management Effects on Soil Physical Properties in Long-Term Tillage Studies in Kansas. Soil Sci. Soc. Am. J. 2006, 70, 434–438. [Google Scholar] [CrossRef] [Green Version]
  43. Strudley, M.W.; Green, T.R.; Ascough, J.C. Tillage effects on soil hydraulic properties in space and time: State of the science. Soil Tillage Res. 2008, 99, 4–48. [Google Scholar] [CrossRef]
  44. Bescansa, P.; Imaz, M.J.; Virto, I.; Enrique, A.; Hoogmoed, W.B. Soil water retention as affected by tillage and residue management in semiarid Spain. Soil Tillage Res. 2006, 87, 19–27. [Google Scholar] [CrossRef]
  45. Farkas, C.; Birkás, M.; Várallyay, G. Soil tillage systems to reduce the harmful effect of extreme weather and hydrological situations. Biologia 2009, 64, 624–628. [Google Scholar] [CrossRef]
  46. Karlen, D.L.; Wollenhaupt, N.C.; Erbach, D.C.; Berry, E.C.; Swan, J.B.; Eash, N.S.; Jordahl, J.L. Long-term tillage effects on soil quality. Soil Tillage Res. 1994, 32, 313–327. [Google Scholar] [CrossRef]
  47. Kargas, G.; Londra, P.A. Effect of tillage practices on the hydraulic properties of a loamy soil. Desalin. Water Treat. 2015, 54, 2138–2146. [Google Scholar] [CrossRef]
  48. López, M.V.; Arrúe, J.L.; Sánchez-Girón, V. A comparison between seasonal changes in soil water storage and penetration resistance under conventional and conservation tillage systems in Aragon. Soil Tillage Res. 1996, 37, 251–271. [Google Scholar] [CrossRef] [Green Version]
  49. Ceglar, A.; Zampieri, M.; Toreti, A.; Dentener, F. Observed Northward Migration of Agro-Climate Zones in Europe Will Further Accelerate Under Climate Change. Earths Future 2019, 7, 1088–1101. [Google Scholar] [CrossRef] [Green Version]
  50. Tits, M.; Elsen, A.; Bries, J.; Vandendriessche, H. Short-term and long-term effects of vegetable, fruit and garden waste compost applications in an arable crop rotation in Flanders. Plant Soil 2014, 376, 43–59. [Google Scholar] [CrossRef]
  51. Mühlbachová, G.; Kusá, H.; Růžek, P. Soil characteristics and crop yields under differenttillage techniques. Plant Soil Environ. 2015, 61, 566–572. [Google Scholar] [CrossRef] [Green Version]
  52. Kismányoky, T.; Tóth, Z. Effect of mineral and organic fertilization on soil organic carbon content as well as on grain production of cereals in the IOSDV (ILTE) long-term field experiment, Keszthely, Hungary. Arch. Agron. Soil Sci. 2013, 59, 1121–1131. [Google Scholar] [CrossRef]
  53. Hoffmann, S.; Kismányoky, T. Soil fertility in a long-term fertilizer trial with different tillage systems. Arch. Agron. Soil Sci. 2001, 46, 239–250. [Google Scholar] [CrossRef]
  54. Giardini, L. Ongoing Trials. In Productivity and Sustainability of Different Cropping Systems. 40 Years of Experiments in Veneto Region; Giardini, L., Ed.; Patron: Bologna, Italy, 2004; pp. 89–97. [Google Scholar]
  55. Klute, A. Water Retention:Laboratory Methods. In Methods of Soil Analysis; Part 1—Physical and Mineralogical Methods, 2nd ed.; Klute, A., Ed.; ASA & SSSA: Madison, WI, USA, 1986; pp. 635–662. [Google Scholar]
  56. RStudio Team. RStudio: Integrated Development Environment for R; RStudio, Inc.: Boston, MA, USA, 2016. [Google Scholar]
  57. R Core Team. R: A Language and Environment for Statistical Computing; R Foundation for Statistical Computing: Vienna, Austria, 2019. [Google Scholar]
  58. Lenth, R. Estimated Marginal Means, aka Least-Squares Means. 2020. Available online: https://cran.r-project.org/package=emmeans (accessed on 8 December 2021).
  59. Wickham, H. ggplot2: Elegant Graphics for Data Analysis; Springer: New York, NY, USA, 2016; ISBN 78-3-319-24277-4. [Google Scholar]
  60. Morari, F.; Lugato, E.; Berti, A.; Giardini, L. Long-term effects of recommended management practices on soil carbon changes and sequestration in north-eastern Italy. Soil Use Manag. 2006, 22, 71–81. [Google Scholar] [CrossRef]
  61. Haddaway, N.R.; Hedlund, K.; Jackson, L.E.; Kätterer, T.; Lugato, E.; Thomsen, I.K.; Jørgensen, H.B.; Söderström, B. How does tillage intensity affect soil organic carbon? A systematic review. Environ. Evid. 2017, 6, 30. [Google Scholar] [CrossRef] [Green Version]
  62. Krauss, M.; Berner, A.; Perrochet, F.; Frei, R.; Niggli, U.; Mäder, P. Enhanced soil quality with reduced tillage and solid manures in organic farming—A synthesis of 15 years. Sci. Rep. 2020, 10, 4403. [Google Scholar] [CrossRef] [Green Version]
  63. Balesdent, J.; Marriotti, A.; Boisgontier, D. Effect of tillage on soil organic carbon mineralization estimated from 13C abundance in maize fields. J. Soil Sci. 1990, 41, 587–596. [Google Scholar] [CrossRef]
  64. Ghimire, R.; Norton, U.; Bista, P.; Obour, A.K.; Norton, J.B. Soil organic matter, greenhouse gases and net global warming potential of irrigated conventional, reduced-tillage and organic cropping systems. Nutr. Cycl. Agroecosyst. 2017, 107, 49–62. [Google Scholar] [CrossRef]
  65. Chen, J.; Zhu, R.; Zhang, Q.; Kong, X.; Sun, D. Reduced-tillage management enhances soil properties and crop yields in a alfalfa-corn rotation: Case study of the Songnen Plain, China. Sci. Rep. 2019, 9, 17064. [Google Scholar] [CrossRef]
  66. Blanco-Canqui, H.; Lal, R. No-Tillage and Soil-Profile Carbon Sequestration: An On-Farm Assessment. Soil Sci. Soc. Am. J. 2008, 72, 693–701. [Google Scholar] [CrossRef] [Green Version]
  67. Camarotto, C.; Piccoli, I.; Dal Ferro, N.; Polese, R.; Chiarini, F.; Furlan, L.; Morari, F. Have we reached the turning point? Looking for evidence of SOC increase under conservation agriculture and cover crop practices. Eur. J. Soil Sci. 2020, 71, 1050–1063. [Google Scholar] [CrossRef]
  68. Piccoli, I.; Chiarini, F.; Carletti, P.; Furlan, L.; Lazzaro, B.; Nardi, S.; Berti, A.; Sartori, L.; Dalconi, M.C.; Morari, F. Disentangling the effects of conservation agriculture practices on the vertical distribution of soil organic carbon. Evidence of poor carbon sequestration in North-Eastern Italy. Agric. Ecosyst. Environ. 2016, 230, 68–78. [Google Scholar] [CrossRef]
  69. Csitári, G.; Tóth, Z.; Kökény, M. Effects of organic amendments on soil aggregate stability and microbial biomass in a long-term fertilization experiment (Iosdv). Sustainability 2021, 13, 9769. [Google Scholar] [CrossRef]
  70. Piccoli, I.; Sartori, F.; Polese, R.; Berti, A. Crop yield after 5 decades of contrasting residue management. Nutr. Cycl. Agroecosyst. 2020, 117, 231–241. [Google Scholar] [CrossRef]
  71. Dal Ferro, N.; Piccoli, I.; Berti, A.; Polese, R.; Morari, F. Organic carbon storage potential in deep agricultural soil layers: Evidence from long-term experiments in northeast Italy. Agric. Ecosyst. Environ. 2020, 300, 106967. [Google Scholar] [CrossRef]
  72. Hillel, D. Introduction to Soil Physics; Academic Press: New York, NY, USA, 1982; ISBN 0-12-348520-7. [Google Scholar]
  73. Assouline, S. Modeling the Relationship between Soil Bulk Density and the Water Retention Curve. Vadose Zone J. 2006, 5, 554–563. [Google Scholar] [CrossRef]
  74. Lu, N. Generalized Soil Water Retention Equation for Adsorption and Capillarity. J. Geotech. Geoenviron. Eng. 2016, 142, 04016051. [Google Scholar] [CrossRef] [Green Version]
  75. Hill, R.L. Long-Term Conventional and No-Tillage Effects on Selected Soil Physical Properties. Soil Sci. Soc. Am. J. 1990, 54, 161–166. [Google Scholar] [CrossRef]
  76. Bot, A.; Benites, J. Creating Drought-Resistant Soil. In The Importance of Soil Organic Matter Key to Drought-Resistant Soil and Sustained Food Production; Food and Agriculture Organization of the United Nations (FAO): Rome, Italy, 2005; pp. 35–40. [Google Scholar]
  77. Müller, A.; Bautze, L.; Matthias, M.; Gattinger, A.; Gall, E.; Chatzinikolaou, E.; Meredith, S.; Ukas, T.; Ullmann, L. Organic Farming, Climate Change and Beyond. 2016. Available online: www.ifoam-eu.org (accessed on 8 December 2021).
  78. Page, K.L.; Dang, Y.P.; Dalal, R.C. The Ability of Conservation Agriculture to Conserve Soil Organic Carbon and the Subsequent Impact on Soil Physical, Chemical, and Biological Properties and Yield. Front. Sustain. Food Syst. 2020, 4, 31. [Google Scholar] [CrossRef] [Green Version]
Figure 1. SOC content in the topsoil (0–15 cm) for each study site (see also Table 1 for the codes and Table 2 for a description of the soil improving treatments). Error bars represent the standard error (n -number of treatments replications- is denoted in Table 3 for each experiment).
Land 10 01362 g001
Figure 2. Soil water content at the different pressure points for each study site (see also Table 1 for the codes and Table 2 for a description of the soil improving treatments). Error bars represent the standard error (n -number of treatments replications- is denoted in Table 3 for each experiment).
Land 10 01362 g002
Figure 3. Relationship of the percentage change in soil water content and percentage change in SOC content. The water content and SOC values represent the percentage differences between the different treatments’ plots and the control plot of each block of the experiment. The different colours represent the water content change in the different pressure points of the WRC. (a): All the experiments plotted together. (bd): Each experimental group plotted separately (b): addition of compost or manure, (c): tillage experiments, (d): residue management).
Land 10 01362 g003
Table 1. Description of the study sites.
CodeTown, CountryCoordinates
(Decimal Degrees)
Agro-Climate Zone [49]Start of ExperimentSoil TypeName of
Experiment
Reference/
Detailed
Information
BEBierbeek, BE50.8244
4.79605
Maritime North1997Silt LoamVFG Compost trialTits et al. [50]
CZPrague-Ruzyně, CZ50.0880
14.2980
Continental1995Silt LoamTillage trialMühlbachová, Kusá and Růžek, [51]
HU_1Keszthely, HU46.7332
17.2295
Pannonian1983Silt LoamOrganic & inorganic fertilization trial- IOSDVKismányoky and Tóth, [52]
HU_2Keszthely, HU46.7346
17.2302
Pannonian1972Silt LoamSoil tillage systems in wheat and maize bi cultureHoffmann and Kismányoky, [53]
IT_1cLegnaro, IT45.3506
11.9497
Maritime South1964Silty Clay LoamOrganic & mineral fertilization trialGiardini, [54]
IT_1pLegnaro, IT45.3506
11.9497
Maritime South1964Peat* 18% OC initiallyOrganic & mineral fertilization trialGiardini, [54]
IT_2cLegnaro, IT45.3507
11.9498
Maritime South1970Silty Clay LoamNitrogen fertilization and crop residue trialGiardini, [54]
IT_2lLegnaro, IT45.3507
11.9498
Maritime South1970Silt LoamNitrogen fertilization and crop residue trialGiardini, [54]
UKLoddington, UK52.6089
0.83257
Maritime North2011Clay loamSoil Biology and Soil Health-
Table 2. Details of the soil treatments in the various experiments ‡ Randomized complete block design (RCBD); φ Split plot-randomized complete block design (Split Plot-RCBD).
CodeName of Experiment/
Experimental Design
TreatmentsReplications (#)Main Crop Types
BEVegetable-Fruit-Garden waste (VFG) compost trial ‡No organic: No organic fertilization (control)
45tntriannually: 45 t/ha compost * applied every three years
15tnannually: 15 t/ha compost * applied yearly
45tnannually: 45 t/ha compost * applied yearly
* C/N ≈ 12
4Winter wheat, carrots, sugar beet, potatoes
CZTillage trial Conventional: Conventional ploughing (Turning of stubble—furrow opener at 10 cm, Mouldboard plough at 22 cm) (control)
Minimum: Minimum tillage (Turning of stubble- furrow opener at 10 cm, 30% of crop residues remain on the soil surface)
Zero: Zero tillage (all residues remain in the soil surface)
4oil rapeseed, winter wheat, Peas
HU_1Organic & inorganic fertilization trial- IOSDV φNPK: Only mineral fertilization/ removal of straw (control)
NPK+FYM: 35 t/ha 0.5% N, farmyard manure application every 3 years/removal of straw
NPK+STR: Straw and stalk incorporation completed with 10 kg N*t straw/ha
3maize, winter wheat, winter barley
HU_2Soil tillage systems in wheat and maize bi culture φConventional: Deep winter ploughing (27–28 cm) + secondary tillage (control)
Minimum: Disking just before drilling (<15 cm)
Shallow: Shallow winter disking (<15 cm) +secondary tillage
4winter wheat, maize
IT_1cOrganic & mineral fertilization trial ‡Unfertilized: No organic or mineral fertilization (control)
Manure L1: 20 t/ha manure applied annually *
Manure L2: 40 t/ha manure applied annually *
2maize, winter wheat, potato, tillage radish (as winter cover crop), ryegrass, silage maize
IT_1pOrganic & mineral fertilization trial ‡Unfertilized: No organic or mineral fertilization (control)
Manure L1: 20 t/ha manure applied annually *
Manure L2: 40 t/ha manure applied annually *
* Farmyard manure from dairy cows (20% dry matter, 0.5% N, 0.25% P2O5, 0.7% K2O)
2
IT_2cNitrogen fertilization and crop residue trial ‡Residue Removal: Removal of the previous crop residues (control)
Residue incorporation: Burial of the previous crop residues
3
IT_2lNitrogen fertilization and crop residue trial ‡Residue Removal: Removal of the previous crop residues (control)
Residue incorporation: Burial of the previous crop residues
3
UKSoil Biology and Soil Health ‡Conventional: Ploughing at 25 cm (control)
Direct drilling: Direct drilling of the seeds into previous crop residues
3winter wheat, whet, oat
Table 3. Sampling details per experiment.
CodeRing Soil Samples
per Plot (#)
Sampling Month/YearYears Applied When Sampling
BE3October 201922
CZ3November 201823
HU_13November 201835
HU_23November 201846
IT_1c1November 201854
IT_1p1November 201854
IT_2c1November 201848
IT_2l1November 201848
UK3April 20198
Table 4. F-statistic of the linear regression analysis. Significance codes of p-value: ** 0.05, * 0.1.
SaturationpF1pF1.8pF2pF2.7pF3.4pF 4.2
All experimentsF-statistic1.326.993.336.171.873.860.42
p-value0.270.02 **0.08 *0.02 **0.190.070.53
Exogenous OMF-statistic1.326.983.336.171.873.860.42
p-value0.270.02 **0.08 *0.02 **0.190.07 *0.53
Soil cultivationF-statistic0.310.983.302.432.251.270.44
p-value0.590.340.09 *0.140.150.280.51
ResiduesF-statistic1.495.881.251.692.230.180.18
p-value0.250.04 **0.290.220.170.680.87
Publisher’s Note: MDPI stays neutral with regard to jurisdictional claims in published maps and institutional affiliations.

