
Comparison of Attitudes towards Roadside Vegetation Management across an Exurban Landscape

Department of Natural Resources and the Environment, University of Connecticut, Storrs, CT 06269-4087, USA
*
Author to whom correspondence should be addressed.
Land 2021, 10(3), 308; https://0-doi-org.brum.beds.ac.uk/10.3390/land10030308
Submission received: 5 January 2021
/
Revised: 11 March 2021
/
Accepted: 14 March 2021
/
Published: 17 March 2021
(This article belongs to the Section Landscape Ecology)
Abstract
:Exurban development is the fastest growing land use across the United States (US). Its prevalence on the East Coast is susceptible to natural disaster events such as hurricanes and nor’easters. However, the socio-ecological processes related to disaster mitigation within exurban areas remain understudied. Our objective was to integrate social and landscape data to compare resident attitudes towards utility roadside vegetation management across four areas in the state of Connecticut, US. We collected data from residents using two mail surveys completed in 2017 and 2019 (n = 1962). From the survey questions, three attitude variables measured perceptions of the utility vegetation management process, and tradeoffs between protecting trees and maintaining reliable power. Across all locations, respondents with more favorable attitudes toward vegetation management were more likely to have greater knowledge about trees, and beliefs that trees should be used for human benefit; land cover characteristics and sociodemographic variables were less strongly associated with attitudes scores. Respondents differed among study areas in their preferences for aesthetics of roadside trees and their basic beliefs regarding the importance of trees. The results suggested that social processes within the exurban landscapes are spatially heterogeneous. Therefore, local variation in residential preferences for vegetation management may influence support for natural disaster management policy.
1. Introduction
Exurban development, also referred to as low-density development, is the fastest-growing land-use type in the United States (US) [1,2]. Exurban land use and development affect landscape-level processes, including human-wildlife conflicts [3,4], wetland permanence [5], and species diversity [6,7]. Despite ecological knowledge, socio-ecological processes among exurban landscapes are less studied [8], particularly at the landscape level and in comparison to urban and rural landscapes [9,10,11,12]. Exurban areas were originally defined for wildfire mitigation along the wildland-urban interface in the western US [13]. However, the extent of exurban lands are more prevalent in the eastern US [14], where they are susceptible to a broad range of natural disasters including hurricanes [15,16], nor’easters [17], ice storms [18], forest fires [19], and severe flooding [20]. Given the expected growth of exurban development [2,21,22,23], and the projected increase in severity and frequency of natural disaster events [24], social processes are likely to influence support for mitigation strategies for natural disasters [20,25] within the expanding exurban land use classification.
Natural disaster events influence public risk perceptions and support for landscape-level policies to mitigate for disaster impacts [26,27,28,29]. Large storm events can lead to power outages, causing safety concerns [17], financial hardship [30], and mental health effects [31] among residents and communities. Specific to this study were severe power outages caused by storm events, such as Tropical Storm Irene, Storm Alfred [i.e., “the October Snowstorm”], and Hurricane Sandy along the northeastern US coast in 2011 and 2012. Trees are a leading cause of power outages in forested regions during such storm events [32] and have the potential to cause widespread outages [33,34]. Impacts from these storms led to the implementation of mitigation strategies such as more aggressive vegetation management protocols for the region through creation of more sustainable roadside forests (e.g., [35]), and smart grid systems to diffuse storm damage potential [36]. In the state of Connecticut, new policies and regulations were passed to improve utility infrastructure and safety [37], including the Electric Company Tree Trimming and Property Law, which specifically designated the utility work zone as eight feet horizontally from the outermost company powerline and vertically from ground to sky, and encourages tree trimming [38]. Utility companies were also federally mandated to manage vegetation around transmission system structures in an attempt to prevent future power outages [39]. In Connecticut, tree wardens issue permits for tree trimming and removal within the public right of way; if the planned tree work is in the right of way, abutting property owners must be notified and have the ability to modify or refuse the work, whereas homeowners must provide consent for planned tree work on private property [38,40]. Although public relations has been reported as the most challenging aspect of the vegetation management process [41], limited research exists on public attitudes towards roadside vegetation management.
To explore the social processes related to natural disaster management, we assessed resident attitudes toward utility vegetation management within exurban Connecticut. Previous research focused on social dynamics related to vegetation management has included attitudes and knowledge of tree topping practices [42], attitudes about tree replacement and planting programs [43,44], and the importance of trees to residents [45]. Among the few studies that have evaluated public perceptions of utility vegetation management in exurban landscapes, Hale and Morzillo [46] suggested that attitudes towards vegetation management are influenced by both social-psychological and residential context variables, and Kloster [47] indicated diverse reasons for homeowner’s consenting or objecting to utility removal of hazard trees, with personal affinity for individual trees being influential to the decision-making process.
The objectives of this study were to: (1) compare differences in attitudes toward vegetation management across four study areas of Connecticut, and (2) evaluate variables that influenced differences in attitude scores. Although exurban landscapes have been described as a homogeneous land use category [48], we hypothesized that social processes instead would be heterogenous given the diversity of social processes found among other land use categories; i.e., urban [9,49], suburban [50], and rural [51,52]. Ancillary evidence also suggested that exurban social processes are multi-scalar and heterogeneous [46], with variations influenced by regional histories and geographic differences [53]. More discretely, past research also suggests that decision-making about trees is influenced by individual level of knowledge about vegetation management practices [43,54], individual forest-related value orientations [55,56], local landscape characteristics [49,57,58,59], aesthetic preferences [44,60], and sociodemographics [9]. Therefore, based on these studies and others (e.g., [46]), we also hypothesized that attitudes towards vegetation management would be influenced by knowledge about trees and vegetation management, beliefs that humans should use trees for human benefit, percentage of proximal tree cover, and sociodemographic characteristics.
2. Materials and Methods
2.1. Study Area
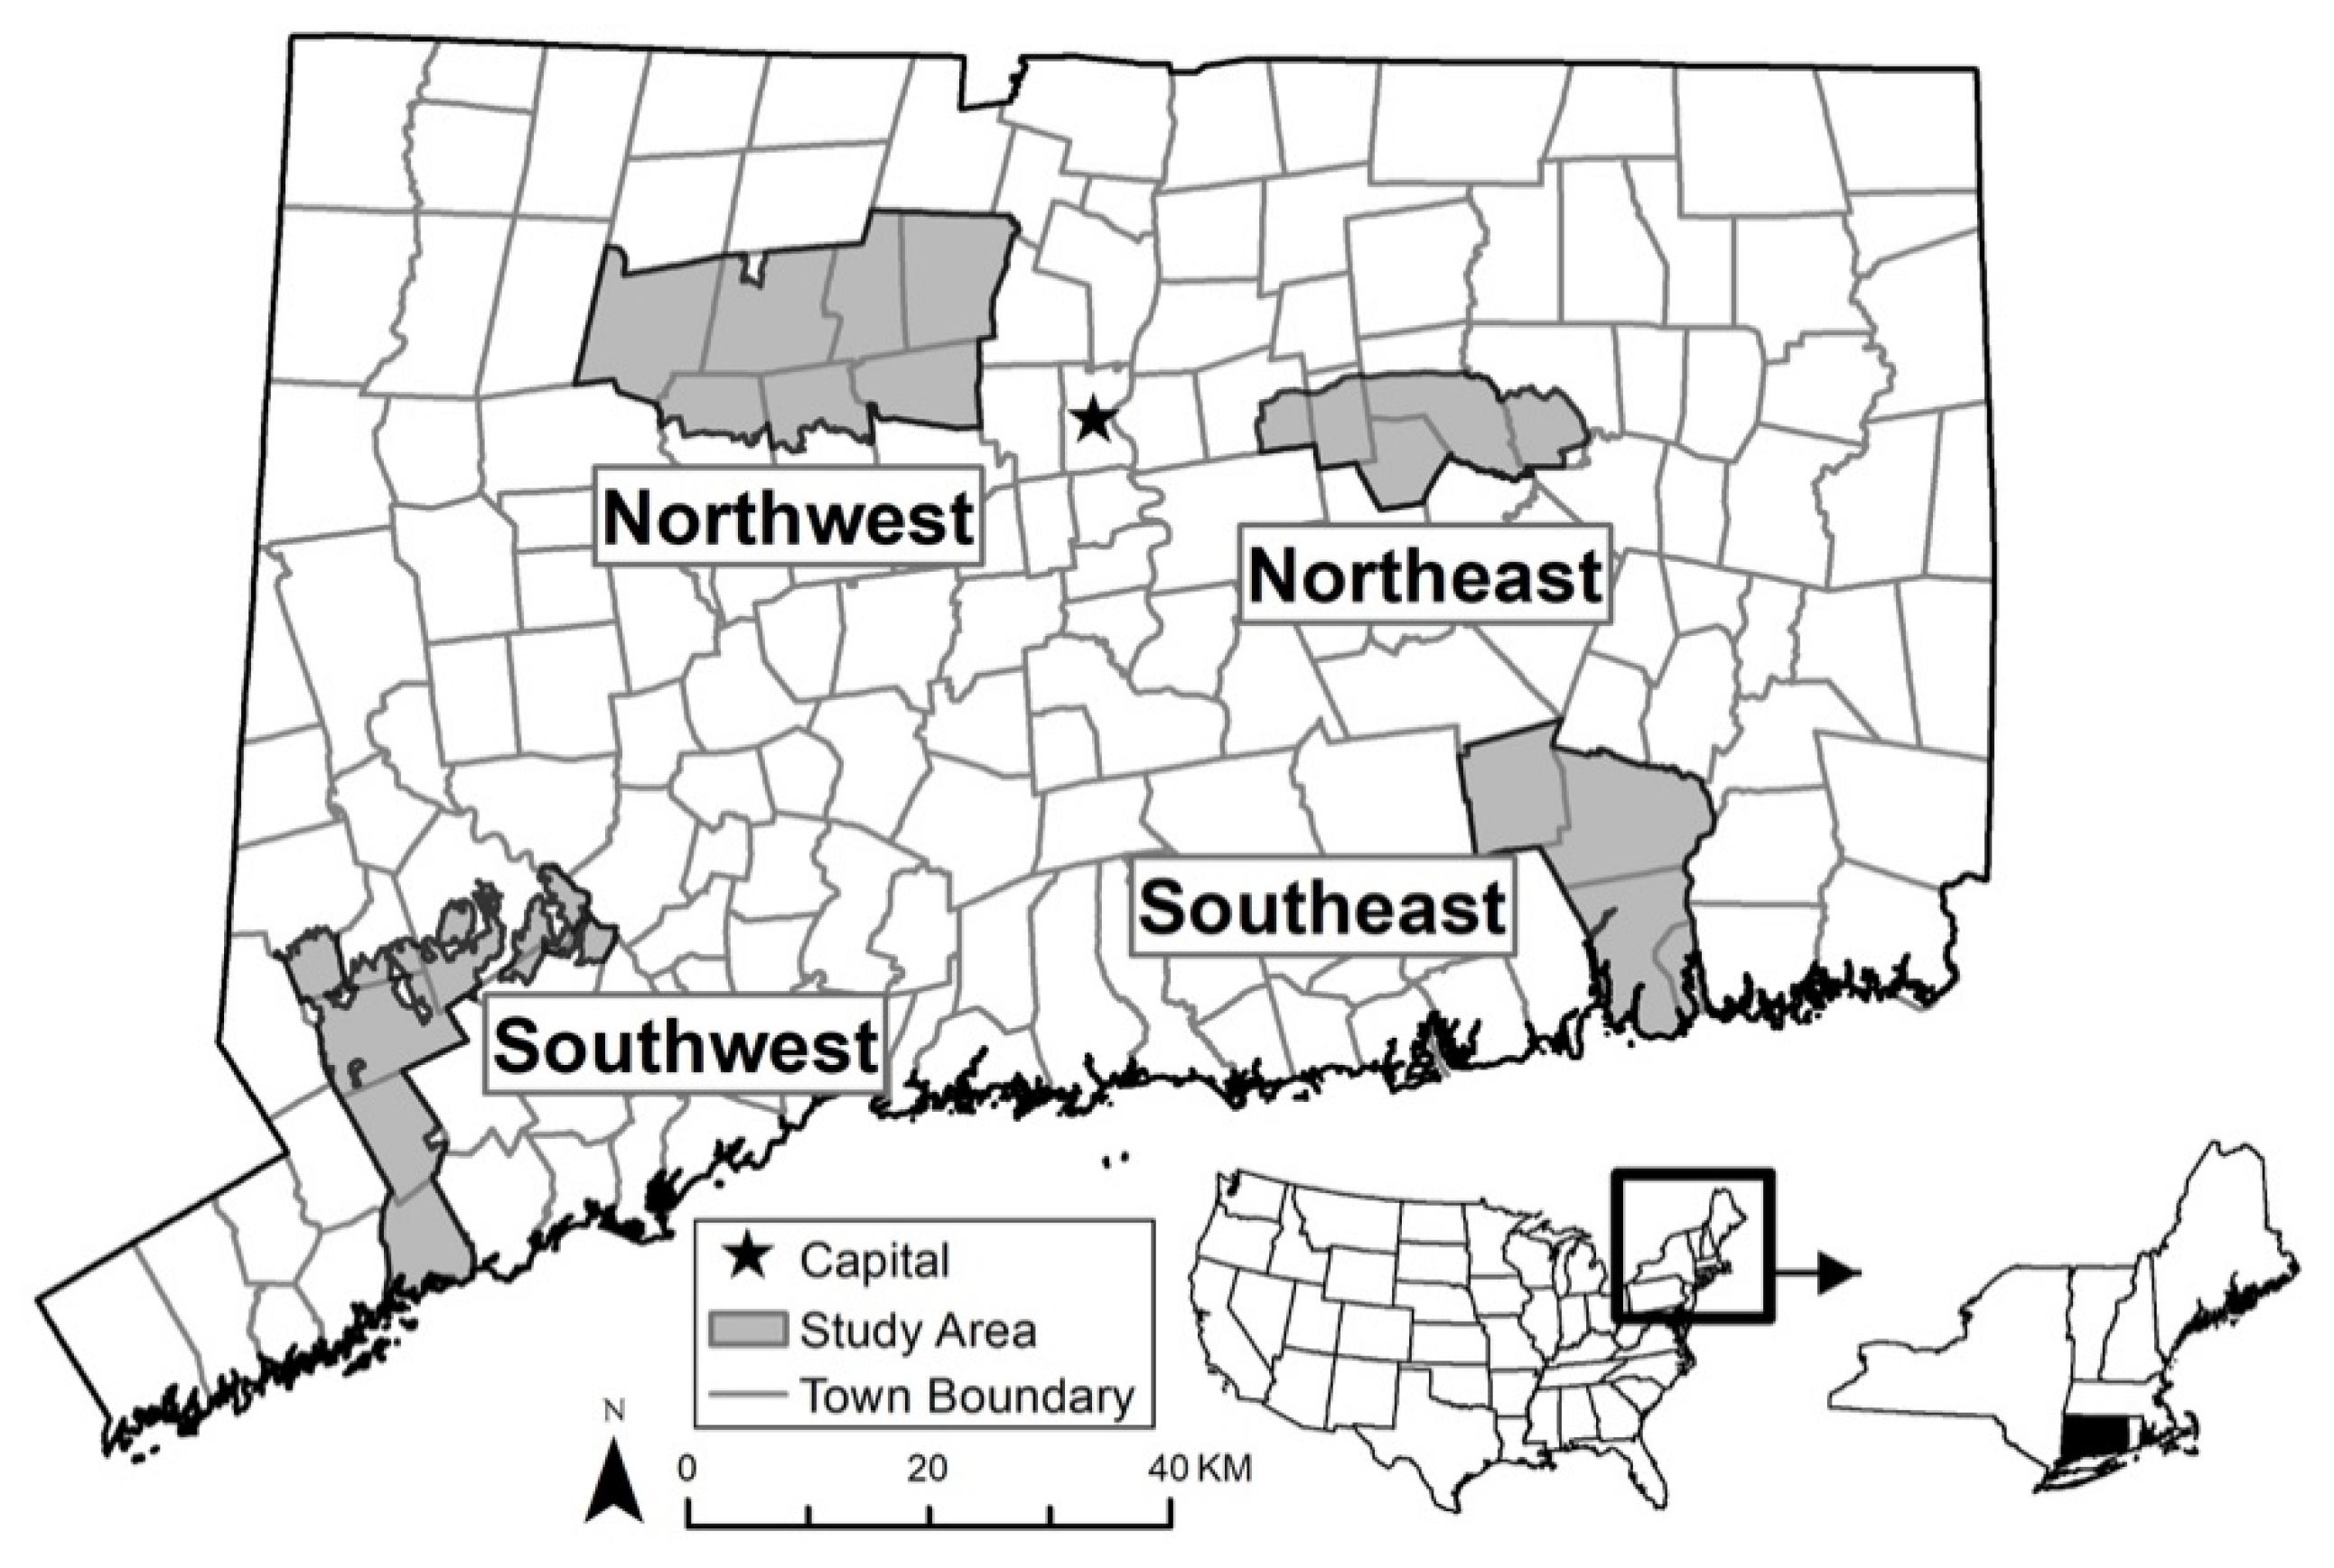
Connecticut is a small state (14,357 km2) located within the northeastern US, and has experienced rapid population growth and exurbanization since the 1950s [61]. A combination of Connecticut’s high proportion of forest cover (72.6% of the state, [62]) and high population density (285 people/km2, [63]) results in the state having the greatest proportion of wildland-urban interface in the US (65.6%, [14]). Four geographically distinct study areas in Connecticut (Figure 1) were selected based on discussions with project partners and interviews with utility employees (n = 7; author unpublished data); additional criteria included current utility provider, distribution across an urban-rural gradient, ongoing issues with vegetation-influenced power outages, and current or recent utility vegetation management activity along roadsides in that location [46].
2.2. Data Collection
Social science data were collected from the Northeast and Southwest study areas in 2017 [46], and the Northwest and Southeast study areas in 2019. Data were collected using a mail survey, which consisted of questions that addressed five main topics: experiences with power outages, attitudes toward roadside vegetation management, roadside tree and forest management preferences, knowledge about trees and tree health, and background information including individual relationship with the environment and sociodemographics.
Surveys were mailed to individual households within each of the four study areas. Street address information was purchased from Marketing Systems Group (Horsham, PA), which compiles sampling datasets from U.S. Postal Service delivery sequence files. To focus sampling on residents involved in property-level tree management decisions, the sampling effort was focused on single-family owner-occupied households. Post office boxes, seasonal homes, mail drops, and vacant homes were excluded from the sample. Based on expected response rate and a desired sampling error of α = 0.05 (95% confidence interval, [64]), 1800 surveys were mailed to each study area. The survey was sent to an equal number of urban and rural respondents, as designated by the 2010 Census classification of urban and rural [63].
A modification of the Tailored Design Method was used for data collection [65]. Multiple mailings were used as an effort to increase response rate and included: (1) a pre-notice postcard to introduce the project, (2) a packet containing a cover letter, survey and pre-paid return envelope, (3) a reminder/thank you postcard, and (4) a second survey packet to those who had not yet responded. To evaluate potential for non-response bias, non-respondents to the original survey received a short follow-up mail survey focusing on ten key items from the original survey. The University of Connecticut Institutional Review Board (IRB) granted permission for use of human subjects (IRB #H16-007).
2.3. Dependent Variables
Attitudes measure favor or disfavor towards a person, object, event, or situation [66]. Past research relevant to this study has included evaluating attitudes related to urban tree maintenance [67], native trees [68], and forest management [69]. To assess attitudes toward vegetation management, we measured respondent agreement with a series of attitude statements on the survey. Responses were coded using a five-point Likert scale measuring level of agreement (5 = strongly agree; 1 = strongly disagree). Principle component analysis (PCA) with varimax rotation was used to reduce the number of attitude statements to those that factored together and create scale scores. Cronbach’s alpha (α) was used to test the internal reliability of groups of statements that factored together [70]. Following Hale and Morzillo [42], statements that factored together were summed, resulting in three scale-based variables: AttProfessional, AttSafety, and AttTradeoff.
Six attitude statements were used to construct a scale score for AttProfessional (2017: α = 0.880, n = 967; 2019: α = 0.894, n = 939), which focused on the perceived professionalism of vegetation managers: (a) Those who do vegetation management care about trees, (b) Those who do vegetation management care about minimizing outages, (c) Vegetation management maintains adequate power line clearance using techniques that minimize harm to trees, (d) Vegetation management is done with care for the trees, (e) Those who do vegetation management do a good job explaining the process to the public, and (f) I trust those who do vegetation management to treat the trees properly. Greater scores indicated greater perceived accountability of vegetation management practices. The possible and actual scale scores ranged from 6–30.
Four attitude statements were used to construct a scale score for AttSafety (2017: α = 0.764, n = 967; 2019, α = 0.759, n = 939), which focused on the perceived safety of vegetation management: (a) Vegetation management improves the safety of people over the long term, (b) Those who do vegetation management care about my safety, (c) Those who do vegetation management care about minimizing outages, and (d) Clearance of power lines through vegetation management minimizes power outages. Greater scores indicated greater perceived safety from vegetation management. Possible and actual scale scores ranged from 4–20.
Five attitude statements were used to construct a scale score for AttTradeoff (2017: α = 0.758, n = 986; 2019: α = 0.789, n = 946), which focused on the tradeoffs between protecting trees and tree trimming to reduce power outages: (a) Most storm-related power outages are caused by trees or tree limbs damaging power lines, (b) Tree trimming helps to reduce the number of power outages, (c) Regardless of how it affects the trees, power line trimming must be done to keep the power on, (d) Reliable power is more important than protecting trees, and (e) More intensive tree work now will require less frequent management over the long term. Greater scale scores indicate greater importance placed on power compared to trees. Possible and actual scale scores ranged from 5–25.
2.4. Independent Variables
Based on the past literature focused on human dimensions of tree and vegetation management as related to storm events (e.g., [4,9,42,43,46,54], twenty-two independent variables were constructed for analysis. Sixteen social survey variables derived from survey questions, and five residential context variables derived from each respondent’s geographic location (Table 1).
2.4.1. Social Survey Variables
The respondents’ knowledge (KnowTree) about trees was assessed using the sum of responses to four true knowledge statements (5 = strongly agree; 1 = strongly disagree; [54]: (a) Growth and death are natural processes for trees, (b) Most storm-related power outages are caused by trees or tree limbs damaging power lines, (c) Trimming branches off trees can be beneficial to the tree, and (d) Rural trees typically live longer than urban trees. Greater scale scores were attributed to greater knowledge about trees. To evaluate the respondents’ knowledge of tree wind resistance (KnowWind), respondents selected from one of three tree illustrations that they believed was most resistant to wind damage: (a) round crown with a thick trunk, (b) round crown with a thin trunk, or (c) crown cropped to one side with a thin trunk. Trees with full crowns and thick trunks are considered more wind resistant [71], therefore, KnowWind was coded with “round crown with a thick trunk” = 1 and all other responses = 0.
Resident preference for vegetation management was assessed using four survey variables. For GreenTunnel, respondents were asked their opinion about the aesthetic “green tunnel of trees along roadsides in Connecticut”: (a) It is important to maintain this look, (b) I am OK with this changing if it results in fewer outages, or (c) I have no opinion about this. GreenTunnel represented a preference for reliable power over a green tunnel visual aesthetic (“I am OK with this changing if it results in fewer power outages” = 1, all other responses = 0). For RoadForest, respondents selected their preference for one of three illustrations depicting roadside forests of different management styles: (a) trees forming a canopy above roadway and power lines, (b) trees trimmed in current management technique, and (c) trees trimmed further from the road and away from power lines and roadway. RoadForest represented acceptance for roadside forest management (response indicating trees trimmed further from the road and away from power lines and roadway = 1, all other responses = 0). Two variables were used to assess which outcome of tree and vegetation management along roadsides was considered most important to respondents: OutcomeReducedOutages represented a preference for reducing outages as the most important outcome of vegetation management (“Reduced number of power outages”= 1, all other responses = 0), and OutcomeAesthetics represented the aesthetic outcome as the most important outcome of vegetation management (“Aesthetics when finished” = 1, all other responses = 0).
Value orientations are amalgamations of basic beliefs held by individuals [72], which form the basis for understanding attitudes, and behaviors towards natural resource management [73,74]. Each value orientation was derived from a set of belief statements coded using a five-point Likert scale (5 = strongly agree; 1 = strongly disagree), and responses were summed to create scale scores (Table 2). Based on past literature [73,75], three value orientation scale scores were constructed to measure specific belief dimensions described as follows: Abundant measured importance of having abundant trees around respondent’s home, Biocentric measured perception that nature has an inherent worth, and Use measured belief that trees should be utilized for human benefit.
Data related to eight sociodemographic variables also was collected and included: household size (HouseholdSize; number of individuals in household); whether any household members were less than 18 years old (Children; yes or no); respondent sex (Sex; male or female); year respondent was born (Age in years); and length of time respondent has lived at their current address (Tenure in years). Respondents selected their perceived residential classification (LocReside) from the following categories: (a) urban, (b) suburban, (c) semi-rural (also referred to as exurban), and (d) rural. For Education, respondents selected all that apply for seven formal education levels: (a) Less than high school, (b) High school or equivalent (e.g., GED), (c) Some college, (d) Vocational or trade school, (e) College degree (2-year or certificate), (f) College degree (Bachelor’s), or (g) Graduate or professional degree Education represented the highest education level selected. For household income (Income), respondents selected from among five income groups ranging from <$25,000 to ≥$100,000.
2.4.2. Residential Context
We developed five metrics to assess whether attitudes toward vegetation management were influenced by residential context. Two land cover variables (TreeCover and Development) were created using 30-m resolution National Land Cover Database (NLCD) 2016 raster data [76] to assess the landscape context around each respondent’s home. Percent forested land cover (TreeCover) was created by reclassifying the NLCD forest land cover classes (deciduous, coniferous, and mixed forest) into a single raster layer representing all forested lands. Percent developed (Developed) was created by reclassifying the NLCD developed land cover classes (developed open space, low, medium, and high intensity development) into a single raster layer representing developed land. Land cover variables were calculated as the proportion of land within each of the two cover types at six buffer radii distances (250 m, 500 m, 750 m, 1000 m, 1500 m, and 2000 m) using the Zonal Statistics as Table tool in ArcGIS [77]. The 250 m buffer was selected for both land cover variables after observing high collinearity (Pearson’s r > 0.7) among buffer distance pairs. Respondent’s property size (Parcel Size) was calculated from regional government parcel data [78]. DistUrban was calculated using the distance from the respondent’s location to the nearest Connecticut city with a population greater than 100,000 [79], using the shortest network path identified by the ArcMap Origin Destination Cost Matrix tool [80]. Connecticut 9–1-1 roadmap [81] was used to create a road network for calculating distance in meters from the respondent’s location to the nearest road (DistToRoad).
2.5. Data Analysis
The responses among study areas were compared using ANOVA or chi-square, [82], and Tukey’s HSD test [83]. Linear regression was used to further identify independent variables that could explain the differences found among study areas. Regression model residuals were tested for spatial autocorrelation to test assumptions of independence [78]. Alpha values were defined as significant at the 95% confidence interval (α = 0.05). Effect size (Eta) was calculated, as appropriate, to assess the strength of relationship between variables [84]. Statistical analyses were conducted in SPSS (SPSS, Inc. Chicago, IL, USA) and R programming language. Spatial analyses were completed using ESRI ArcGIS 10.6.1 (ESRI) and Python 2.7.10 using the ArcPy module.
3. Results
Collectively, 1962 completed surveys were returned (response rate = 27.3%; Northeast n = 555; Southwest n = 443; Northwest n = 495; Southeast n = 466; Table 1). Among the respondents sampled, 52.4% were female, average age was 61.1 (±14.2) years, and the average residential tenure was 21.5 (±15.1) years. On average, respondents indicated either a Bachelor’s (29.9%) or an advanced degree (35.1%) as the greatest level of formal education completed and had a household income of $100,000 or more (52.4%). Respondents self-identified their residential location as rural = 28.1%, exurban = 32.3, suburban = 35.0, and urban = 4.6% (LocReside). Compared to the overall population of the study areas, survey respondents were older, had more formal education completed, and greater household incomes [85]. Compared with the original survey respondents, those who completed the non-response follow-up survey (n= 347) were younger, less likely to have been in their current residence during recent major storms, more likely to agree that reliable power is more important than protecting trees, and more likely to agree that more intensive tree work now will require less frequent management over the long term.
Overall, respondents had relatively favorable attitude scores towards roadside vegetation management with average scale scores greater than the median (Table 1). Responses suggested that participants were generally knowledgeable about trees (KnowTree), amenable to changing roadside forests to reduce power outages (GreenTunnel) and accepting of vegetation management actions that resulted in greater spacing of trees (RoadForest). Half of respondents selected ‘Reduced number of power outages’ as the most important desired outcome of vegetation management (OutcomeReducedOutages; Table 1). Respondents had an average parcel size of 2.9 (±13.6) acres and were, on average, 37.5 (±18.2) kilometers away from the nearest urban center (DistUrban). Land cover within 250 m of respondents’ home was, on average, 39% developed and 52% forested.
Comparisons among study areas revealed differences for 12 independent variables (KnowTree, Abundant, HouseholdSize, Children, GreenTunnel, LocReside, Education, Income, Developed, Tree, DistToRoad, and DistUrban; Table 1). For example, the Southwest study area had larger households (HouseholdSize), a greater percentage of households with children (Children), greater levels of formal education completed (Education), and a greater percentage of respondents with an income of $100,000 or more (Income) than the other study areas (Table 1).
Comparative analysis revealed differences among study areas for two of the three dependent variables (AttProfessional and AttSafety): AttProfessional (F3,1900 = 4.05, p = 0.007) and AttSafety (F3,1900 = 5.37, p = 0.001). For AttProfessional, Northeast scale scores were more likely to be greater than those in the Southeast (Northeast mean ± SD = 21.4 ± 5.0; Southeast = 20.3 ± 5.6, p= 0.006). For AttSafety, Southeast scores were more likely to be lower than those in both the Northeast (Southeast = 16.6 ± 2.7; Northeast = 17.2 ± 2.5; p = 0.001) and Southwest (Southeast = 16.6 ± 2.7; Southwest = 17.1 ± 2.4; p= 0.011). Greater AttProfessional scores were more likely to be associated with greater KnowTree, GreenTunnel, and Use scores across all four locations (Table 3). Greater AttProfessional scores were more likely to be associated with greater OutcomeReducedOutages scores in the Southwest and Northwest and Developed and Tree in the Northwest. Less favorable AttProfessional scores were more likely to be associated with greater scores for Abundant in the Northeast and greater Tenure values in the Southwest study areas, respectively. Greater AttSafety scores were more likely to be associated with greater KnowTree and Use scores across all four locations (Table 4). Greater AttSafety scores were more likely to be associated with greater GreenTunnel scores in the Northeast, Northwest, and Southeast. Greater AttSafety scores were more likely to be associated with greater OutcomeReducedOutages scores in the Northeast, Southwest, and Northwest. Greater AttSafety scores were also more likely to be associated with female respondents (Sex) for the Northeast, Southeast, and Northwest study areas.
AttTradeoff scale scores did not differ among study areas (F3,1927 = 0.39, p = 0.762); therefore, data were pooled (Table 5; “All” column). Regression analysis revealed that respondents who favored reliable power over protecting trees were more likely to have greater knowledge about trees (KnowTree), amenable to changing the green tunnel (GreenTunnel), considered reducing power outages the most important outcome of vegetation management (OutcomeReducedOutages), believed trees should be for human use (Use), and accepted roadside forests that result in greater spacing between trees (RoadForest; Table 5). Respondents with greater AttTradeoff scores also were less likely to find aesthetics an important outcome of vegetation management (OutageAesthetics), believe trees are important (Abundant and Biocentric), and be female (Sex). Across all four study areas, greater AttTradeoff scores were more likely to be associated with greater KnowTree, GreenTunnel, OutcomeReducedOutages, and Use scores. Greater AttTradeoff scores were more likely to be associated with greater RoadForest scores and male respondents (Sex) in the Northwest and Southeast. Less favorable AttTradeoff scores were more likely to be associated with greater KnowWind scores and greater ParcelSize values in the Northwest, greater Abundant scores in the Northeast and Southeast, greater Biocentric scores in the Southwest and Northwest, and greater Tenure values in the Southwest (Table 5).
Moran’s I statistic was calculated for model residuals to verify that spatial relationships did not violate the assumption of independence [78]. No spatial autocorrelation was found in the residuals of any linear regression model.
4. Discussion
In Connecticut, policies addressing risks associated with natural disasters often are made at the state level, but the social processes that affect and are affected by those policies occur at multiple scales. In this study, we compared attitudes towards vegetation management across four study areas and evaluated variables that might influence differences in attitudes among locations. Although respondents to this survey generally had favorable attitudes toward vegetation management for reducing power outages, the level of support for specific management outcomes differed among study areas. Supporting our first hypothesis, AttProfessional and AttSafety scores illustrated variability among study areas, suggesting that location-specific differences may be influencing attitudes. For example, community planning in suburban areas has historically focused on planting trees along roads to create a closed canopy effect [86]. Appreciation for such planning may be supported by responses to GreenTunnel in the Southwest area, for which several towns are located within the New York City suburbs, as compared to the other three study areas. As reflected by respondent comments on the survey, residents may be attracted to such towns if desiring forest-like aesthetics within their neighborhoods is an important visual quality [87] that may be perceived as disrupted by vegetation management practices:
“Utility co’s [company] arborist[s] do not maintain the trees as a homeowner/town resident would. Many trees are cut so nearly half the tree is removed- it is unappealing and questionable quality of [tree] survival.”
“My whole neighborhood …[was] so disappointed with the tree trimming job that took place over the last 6 months. They were so slow (a waste of money) left an atrocious mess, and left trees unsightly (poor job of trimming). Horrible management.”
Contrasting our first hypothesis, AttTradeoff scores did not vary across study areas, suggesting a consistent acknowledgement of the importance of reliable power to respondents regardless of location. Power outages pose risk to many communities because electricity is essential to most everyday activities [88]. Respondent comments on the survey echoed an understanding of such tradeoffs:
“Removing trees within a certain distance from powerlines or roads, I am OK with that. At the same time, I also think it is important not to remove too many trees, so the state is still able to maintain healthy ecosystems and forests.”
“Trees are very important to the environment; to the beauty of CT [Connecticut] and to me. Sensible, necessary tree removal to maintain [the] power grid is acceptable.”
Past research also has suggested that attitudes may be affected by previous experiences with large storm events, which in turn can influence individual concerns about future storm events [26]. Elsewhere in the survey, most respondents across all locations indicated they were in their current residence during the 2011 and 2012 storms (Tropical Storm Irene = 82.1%; Storm Alfred [i.e., “the October Snowstorm”] = 83%; and Hurricane Sandy = 84%). When asked if these storms influenced decisions to manage trees on their property, many respondents removed hazard trees (49.2%) or allowed the utility, municipality, town, or state to remove trees (33.5%; author, unpublished data). Others reported enhanced vegetation management by residents in response to public awareness campaigns about mitigating risks of natural disasters [89], and for protection of property from future storm damage [90]. More broadly within the forest management in response to natural disaster literature, residents living near national forests showed a greater acceptance of forest management for reducing wildfire risk when the purpose of management aligned with their attitudes, values, and preferences for forest aesthetics [91]. Therefore, a universal approach to creating policies and management solutions may be more likely to succeed with consideration of diversity among residential attitudes and preferences.
Despite an observed understanding of tradeoffs between reliable power and preserving trees, the importance of aesthetics was also revealed by respondents. This result supported previous studies suggesting aesthetic preferences impelled homeowner decisions about tree management [43,68,92]. For example, Shakeel and Conway [93] suggested that household tree management decisions were prompted by the physical characteristics of properties, such as available planting space that could accommodate large tree species on larger parcels versus short trees on smaller properties. In our study, only in the Northwest study area were attitudes associated with residential context characteristics, where respondents with larger properties (Parcel Size) were in favor of preserving trees over maintaining reliable power (Table 5). In the broader project associated with our analysis, the observed rationale for property-level decisions as influenced by personal affinity for individual trees was a critical component to homeowner management decisions [47]. Thus, although our results suggested general approval of utility vegetation management, public acceptance of enhanced tree trimming measures appeared to be influenced by the resulting visual or aesthetic outcome.
Attitudes toward vegetation management held by exurban respondents were heterogeneous across our study areas, supporting Sharp and Clark’s [94] suggestion that exurban areas do not fit within the conventional definition of urban and rural. Environmental values of exurban communities are not simply a mix of urban and rural, but rather exhibit their own uniqueness [95], often attributed to the immigration of predetermined individual values as people relocate from urban to more rural areas [96]. Along with social heterogeneity, outcomes of exurbanization include land use heterogeneity [48] in correspondence with habitat fragmentation [6] and housing development policies [97]. However, in one study, Urban and Roehm [5] did not observe forest cover loss with increasing residential development in exurban Connecticut. One explanation could be the strict local zoning laws throughout the state, which have encouraged exurbanization, yet concurrently have sought to minimize landscape fragmentation resulting from exurban development. For example, the town of Mansfield, CT, requires two acres of land per single-family residence, and 40% of land to be permanently dedicated as conserved open space for multi-family developments [98]. Therefore, exurban areas likely are influenced by both social processes and regional land-use variations that occur simultaneously at multiple scales.
Supporting our second hypothesis, in all study areas, more favorable attitudes toward vegetation management were associated with a greater knowledge of trees and the belief that humans should use trees for human benefit. Elsewhere in the natural disaster risk literature, those more knowledgeable about wildfires were more likely to support prescribed fire and other management strategies to mitigate the risk of wildfire damage [19,99]. More central to our analysis, Kuhns and Reiter [42] reported that individuals more knowledgeable about trees were more likely to favor tree trimming practices that encouraged tree growth [42]. Almas and Conway [68] further noted that those in their study who were more knowledgeable about native trees were more likely to have read municipal forestry documents. As suggested by Almas and Conway [100], opportunities also exist for municipalities with specific planning goals to engage in public outreach to seek support for and prioritization of species for tree planting by residents. Therefore, there likely is opportunity for further communication between vegetation managers and the public, particularly to (1) provide information about trees and tree maintenance, (2) explain reasons why vegetation management is important for mitigating power outages, (3) present supporting evidence of successes resulting from such vegetation management, and (4) suggest actions residents can take on their own property to reduce potential for vegetation-related risk to powerlines.
Creating more resilient roadside forests is a priority for utilities throughout New England in preparation for potentially more frequent and intense storms [24,101]. Powerline susceptibility to falling trees varies based on differences in land use, topography [102], and species composition [103], producing an unequal distribution of storm damage [102]. In addition, municipal budget deficiencies have led utilities to act as tree managers for most towns [104], yet some towns have roadside tree protection ordinances that affect utility ability to manage vegetation. For example, in Connecticut, the town of Greenwich prohibits pruning of “strong wooded trees” for any utility line clearance [105]. In Mansfield, town ordinances encourage maintaining closed canopy for the scenic value of specific roadways [106]. Therefore, local policies implemented may conflict with state mandates and, therefore, hinder overall natural disaster preparedness and create confusion among residents.
5. Conclusions
Attitudes towards roadside vegetation management were positive overall, yet variation existed among study areas for perceived professionalism of vegetation managers and perceived safety of vegetation management. Social-psychological survey variables influenced attitude scores, with knowledge about trees and belief that humans should use trees for human benefit as the most consistent variables associated with greater attitudes. Residential context variables and sociodemographics were less influential than hypothesized. Across all study areas, respondents recognized tradeoffs between reliable power and preserving trees, and exhibited a preference for actions that maintain visual aesthetics associated with roadside forests. Within the exurban landscape, residents are multifaceted in how they perceive information and assess land management decisions. Therefore, consideration for individual preferences and geographic variation may help increase public support when mitigating the effects of natural disasters, as illustrated here for vegetation management.
Author Contributions
S.D. and A.T.M. both contributed to conceptualization, methodology, formal analysis, and writing of draft preparation, writing review and editing. A.T.M. provided resources, supervision, project administration, and funding acquisition. All authors have read and agreed to the published version of the manuscript.
Funding
This research was funded by the Eversource Energy Center and University of Connecticut.
Institutional Review Board Statement
The study was conducted according to the guidelines of the Declaration of Helsinki, and The University of Connecticut Institutional Review Board (IRB) granted permission for use of human subjects (IRB #H16-007).
Informed Consent Statement
Informed consent was obtained from all subjects involved in the study per Institutional Review Board guidelines and protocol.
Acknowledgments
Thank you to A. Aguiar, A. Alling, T. Armijo, A. Bunce, A. Carey, M. de Nicolo, R. Fahey, R. French, J. Guay, H. Ives, D. Kloster, L. Keener-Eck, N. Marek, W. McIntosh, T. Meyer, J. Parent, M. Poppick, T.J. Powell, A. Price, K. Raymond, S. Redding, E. Saavedra, A. Salazar, A. Schindler, Z. Smiarowski, J. Volin, M. Walrath, C. Witharana, T. Worthley, N. Yarmey, and all survey respondents.
Conflicts of Interest
The authors declare no conflict of interest. Funder project contact provided feedback on study design, but no role in the collection, analyses, or interpretation of data; in the writing of the manuscript, or in the decision to publish the results.
References
- Heimlich, R.E.; Anderson, W.D. Development at the Urban Fringe and Beyond: Impacts on Agriculture and Rural Land; ERS Agricultural Economic Report: Washington, DC, USA, 2001. [Google Scholar]
- Theobald, D.M.; Spies, T.; Kline, J.; Maxwell, B.; Hobbs, N.T.; Dale, V.H. Ecological Support for Rural Land-Use Planning. Ecol. Appl. 2005, 15, 1906–1914. [Google Scholar] [CrossRef]
- Evans, M.J.; Hawley, J.E.; Rego, P.W.; Rittenhouse, T.A.G. Exurban Land Use Facilitates Human-Black Bear Conflicts: Exurban Human-Black Bear Conflicts. J. Wildl. Manag. 2014, 78, 1477–1485. [Google Scholar] [CrossRef]
- Morzillo, A.T.; Schwartz, M.D. Landscape Characteristics Affect Animal Control by Urban Residents. Ecosphere 2011, 2, 1–16. [Google Scholar] [CrossRef]
- Urban, M.C.; Roehm, R. The Road to Higher Permanence and Biodiversity in Exurban Wetlands. Oecologia 2018, 186, 291–302. [Google Scholar] [CrossRef]
- Glennon, M.J.; Kretser, H.E. Size of the Ecological Effect Zone Associated with Exurban Development in the Adirondack Park, NY. Landsc. Urban Plan. 2013, 112, 10–17. [Google Scholar] [CrossRef]
- Hansen, A.J.; Knight, R.L.; Marzluff, J.M.; Powell, S.; Brown, K.; Gude, P.H.; Jones, K. Effects of Exurban Development on Biodiversity: Patterns, Mechanisms, and Research Needs. Ecol. Appl. 2005, 15, 1893–1905. [Google Scholar] [CrossRef]
- Miller, J.R.; Hobbs, R.J. Conservation Where People Live and Work. Conserv. Biol. 2002, 16, 330–337. [Google Scholar] [CrossRef]
- Belaire, J.A.; Westphal, L.M.; Minor, E.S. Different Social Drivers, Including Perceptions of Urban Wildlife, Explain the Ecological Resources in Residential Landscapes. Landsc. Ecol. 2016, 31, 401–413. [Google Scholar] [CrossRef]
- Berenguer, J.; Corraliza, J.A.; Martín, R. Rural-Urban Differences in Environmental Concern, Attitudes, and Actions. Eur. J. Psychol. Assess. 2005, 21, 128–138. [Google Scholar] [CrossRef]
- Chowdhury, R.R.; Larson, K.; Grove, M.; Polsky, C.; Cook, E.; Onsted, J.; Ogden, L. A Multi-Scalar Approach to Theorizing Socio-Ecological Dynamics of Urban Residential Landscapes. Cities Environ. CATE 2011, 4, 6. [Google Scholar]
- Short Gianotti, A.G.; Getson, J.M.; Hutyra, L.R.; Kittredge, D.B. Defining Urban, Suburban, and Rural: A Method to Link Perceptual Definitions with Geospatial Measures of Urbanization in Central and Eastern Massachusetts. Urban Ecosyst. 2016, 19, 823–833. [Google Scholar] [CrossRef]
- Federal Register Urban Wildland Interface Communities within the Vicinity of Federal Lands That Are at High Risk from Wildfire. Available online: https://www.federalregister.gov/documents/2001/01/04/01-52/urban-wildland-interface-communities-within-the-vicinity-of-federal-lands-that-are-at-high-risk-from (accessed on 30 July 2019).
- Martinuzzi, S.; Stewart, S.I.; Helmers, D.P.; Mockrin, M.H.; Hammer, R.B.; Radeloff, V.C. The 2010 Wildland-Urban Interface of the Conterminous United States; U.S. Department of Agriculture, Forest Service, Northern Research Station: Newtown Square, PA, USA, 2015.
- Davidson, R.A.; Liu, H.; Sarpong, I.K.; Sparks, P.; Rosowsky, D.V. Electric Power Distribution System Performance in Carolina Hurricanes. Nat. Hazards Rev. 2003, 4, 36–45. [Google Scholar] [CrossRef]
- Howe, P.D.; Boudet, H.; Leiserowitz, A.; Maibach, E.W. Mapping the Shadow of Experience of Extreme Weather Events. Clim. Chang. 2014, 127, 381–389. [Google Scholar] [CrossRef]
- Burger, J.; Gochfeld, M. Health Concerns and Perceptions of Central and Coastal New Jersey Residents in the 100days Following Superstorm Sandy. Sci. Total Environ. 2014, 481, 611–618. [Google Scholar] [CrossRef] [Green Version]
- Armenakis, C.; Nirupama, N. Urban Impacts of Ice Storms: Toronto December 2013. Nat. Hazards 2014, 74, 1291–1298. [Google Scholar] [CrossRef]
- Ryan, R.L. The Influence of Landscape Preference and Environmental Education on Public Attitudes toward Wildfire Management in the Northeast Pine Barrens (USA). Landsc. Urban Plan. 2012, 107, 55–68. [Google Scholar] [CrossRef]
- Moser, S.C.; Kasperson, R.E.; Yohe, G.; Agyeman, J. Adaptation to Climate Change in the Northeast United States: Opportunities, Processes, Constraints. Mitig. Adapt. Strateg. Glob. Chang. 2008, 13, 643–659. [Google Scholar] [CrossRef]
- White, E.M.; Morzillo, A.T.; Alig, R.J. Past and Projected Rural Land Conversion in the US at State, Regional, and National Levels. Landsc. Urban Plan. 2009, 89, 37–48. [Google Scholar] [CrossRef] [Green Version]
- Zabik, M.J.; Prytherch, D.L. Challenges to Planning for Rural Character: A Case Study from Exurban Southern New England. Cities 2013, 31, 186–196. [Google Scholar] [CrossRef] [Green Version]
- Mondal, P.; Butler, B.J.; Kittredge, D.B.; Moser, W.K. How Are America’s Private Forests Changing? An Integrated Assessment of Forest Management, Housing Pressure, and Urban Development in Alternate Emissions Scenarios. Land Use Policy 2013, 32, 230–238. [Google Scholar] [CrossRef]
- Hoegh-Guldberg, O.; Jacob, D.; Taylor, M.; Bindi, M.; Brown, S.; Camilloni, I.; Diedhiou, A.; Djalante, R.; Ebi, K.L.; Engelbrecht, F.; et al. Impacts of 1.5 °C of Global Warming on Natural and Human Systems. In Global Warming of 1.5 °C. An IPCC Special Report on the Impacts of Global Warming of 1.5 °C above Pre-Industrial Levels and Related Global Greenhouse Gas Emission Pathways, in the Context of Strengthening the Global Response to the Threat of Climate Change, Sustainable Development, and Efforts to Eradicate Poverty; 2018; pp. 175–311, In Press. [Google Scholar]
- Reidmiller, D.R.; Avery, C.W.; Easterling, D.R.; Kunkel, K.E.; Lewis, K.L.M.; Maycock, T.C.; Stewart, B.C. Fourth National Climate Assessment, Volume II: Impacts, Risks, and Adaptation in the United States; US Global Change Research Program: Washington, DC, USA, 2018. [Google Scholar] [CrossRef]
- Albright, E.A.; Crow, D. Beliefs about Climate Change in the Aftermath of Extreme Flooding. Clim. Chang. 2019, 155, 1–17. [Google Scholar] [CrossRef]
- Wachinger, G.; Renn, O.; Begg, C.; Kuhlicke, C. The Risk Perception Paradox--Implications for Governance and Communication of Natural Hazards. Risk Anal. Off. Publ. Soc. Risk Anal. 2013, 33, 1049–1065. [Google Scholar] [CrossRef]
- Bichard, E.; Kazmierczak, A. Are Homeowners Willing to Adapt to and Mitigate the Effects of Climate Change? Clim. Chang. 2012, 112, 633–654. [Google Scholar] [CrossRef] [Green Version]
- Marlon, J.R.; Rosenthal, S.; Feinberg, G.; Pal, S.; Leiserowitz, A. Hurricane Attitudes of Coastal Connecticut Residents: A Segmentation Analysis; Yale University: New Haven, CT, USA, 2015. [Google Scholar]
- Burton, I. Adapt and Thrive: Options for Reducing the Climate-Change Adaption Deficit. Policy Options 2005, 33–38. [Google Scholar]
- Neria, Y.; Shultz, J.M. Mental Health Effects of Hurricane Sandy: Characteristics, Potential Aftermath, and Response. JAMA 2012, 308, 2571. [Google Scholar] [CrossRef] [Green Version]
- Parent, J.R.; Meyer, T.H.; Volin, J.C.; Fahey, R.T.; Witharana, C. An Analysis of Enhanced Tree Trimming Effectiveness on Reducing Power Outages. J. Environ. Manag. 2019, 241, 397–406. [Google Scholar] [CrossRef]
- Cieslewicz, S.; Novembri, R. Utility Vegetation Management Final Report. In Federal Energy Regulatory Commision U.S. Government; 2004. Available online: https://www.nerc.com/pa/rrm/ea/August%2014%202003%20Blackout%20Investigation%20DL/uvm-final-report(trees).pdf (accessed on 26 June 2020).
- Campbell, R.J. Weather-Related Power Outages and Electric System Resiliency. In CRS Report for Congress: Congressional Research Service; Library of Congress: Washington, DC, USA, 2012; pp. 103–118. [Google Scholar]
- McGee, J.; Carozza, P.; Edelstein, T.; Hoffman, L.; Jackson, S.; McGrath, R.; Osten, C. Report of the Two Storm Panel; Two Storm Panel, Connecticut State Government: Hartford, CT, USA, 2012; pp. 1–42.
- Editorial. Money To Rebuild After Sandy. The New York Times, 14 November 2012. Docket No. 12-01-10. Available online: https://www.nytimes.com/2012/11/15/opinion/money-to-rebuild-after-sandy.html (accessed on 16 July 2020).
- Public Utilities Regulatory Authority PURA Investigation into the Tree Trimming Practices of Connecticut’s Utility Companies; 2014. Available online: https://portal.ct.gov/PURA/Docket/Docket-and-Document-Information (accessed on 15 July 2020).
- McCarthy, K. Electric Company Tree Trimming and Property Law. Conn. Gen. Assem. 2014, R-0008, 8. [Google Scholar]
- Federal Energy Regulatory Commission Transmission Vegetation Management (Report No. FAC-003-2). 2011. Available online: https://www.nerc.com/files/E-5_Order_FAC-003-2_2013.3.21.pdf (accessed on 15 September 2020).
- State of Connecticut. An Act Concerning Implementation of Connecticut’s Comprehensive Energy Strategy and Various Revisions to the Energy Statutes. 2013. Available online: https://www.cga.ct.gov/2013/ACT/PA/2013PA-00298-R00HB-06360-PA.htm (accessed on 26 June 2020).
- Johnson, A. Best Practices Handbook for Roadside Vegetation Management 2008. Minnesota Department of Transportation. Available online: http://www.lrrb.org/pdf/200820.pdf (accessed on 23 August 2020).
- Kuhns, M.R.; Reiter, D.K. Tree Care and Topping Beliefs, Knowledge, and Practices in Six Western US Cities. J. Arboric. 2009, 35, 122. [Google Scholar]
- Conway, T.M. Tending Their Urban Forest: Residents’ Motivations for Tree Planting and Removal. Urban For. Urban Green. 2016, 17, 23–32. [Google Scholar] [CrossRef]
- Flowers, D.; Gerhold, H. Replacement of Trees under Utility Wires Impacts Attitudes and Community Tree Programs. J. Arboric. 2000, 26, 309–318. [Google Scholar]
- Dilley, J.; Wolf, K.L. Homeowner Interactions with Residential Trees in Urban Areas. Arboric. Urban For. 2013, 39, 267–277. [Google Scholar]
- Hale, D.C.; Morzillo, A.T. Landscape Characteristics and Social Factors Influencing Attitudes Toward Roadside Vegetation Management. Landsc. Ecol. 2020. [Google Scholar] [CrossRef]
- Kloster, D. Human Dimensions of Roadside Vegetation Management to Reduce Utility Infrastructure Vulnerability. Ph.D. Thesis, University of Connecticut, Storrs, CT, USA, 2020. [Google Scholar]
- Theobald, D.M. Placing Exurban Land-Use Change in a Human Modification Framework. Front. Ecol. Environ. 2004, 2, 139–144. [Google Scholar] [CrossRef]
- Andrade, R.; Larson, K.L.; Hondula, D.M.; Franklin, J. Social–Spatial Analyses of Attitudes toward the Desert in a Southwestern U.S. City. Ann. Am. Assoc. Geogr. 2019, 109, 1845–1864. [Google Scholar] [CrossRef]
- Harris, E.M.; Polsky, C.; Larson, K.L.; Garvoille, R.; Martin, D.G.; Brumand, J.; Ogden, L. Heterogeneity in Residential Yard Care: Evidence from Boston, Miami, and Phoenix. Hum. Ecol. 2012, 40, 735–749. [Google Scholar] [CrossRef] [Green Version]
- Balukas, J.A.; Bell, K.P.; Bauer, D.M. Classifying Private Landowners to Improve Understanding of Management Decisions and Conservation Opportunities in Urbanizing Forested Landscapes. J. Environ. Manag. 2019, 232, 751–758. [Google Scholar] [CrossRef] [PubMed]
- Ulrich-Schad, J.D.; Qin, H. Culture Clash? Predictors of Views on Amenity-Led Development and Community Involvement in Rural Recreation Counties. Rural Sociol. 2018, 83, 81–108. [Google Scholar] [CrossRef]
- Taylor, L. No Boundaries: Exurbia and the Study of Contemporary Urban Dispersion. GeoJournal 2011, 76, 323–339. [Google Scholar] [CrossRef]
- Kuhns, M.R.; Reiter, D.K. Knowledge of and Attitudes about Utility Pruning and How Education Can Help. Arboric. Urban For. 2007, 33, 264. [Google Scholar]
- Bengston, D.N.; Webb, T.J.; Fan, D.P. Shifting Forest Value Orientations in the United States, 1980–2001: A Computer Content Analysis. Environ. Values 2004, 13, 13373–13392. [Google Scholar] [CrossRef] [Green Version]
- de Groot, J.I.M.; Steg, L. Value Orientations to Explain Beliefs Related to Environmental Significant Behavior: How to Measure Egoistic, Altruistic, and Biospheric Value Orientations. Environ. Behav. 2008, 40, 330–354. [Google Scholar] [CrossRef]
- Balram, S.; Dragićević, S. Attitudes toward Urban Green Spaces: Integrating Questionnaire Survey and Collaborative GIS Techniques to Improve Attitude Measurements. Landsc. Urban Plan. 2005, 71, 147–162. [Google Scholar] [CrossRef]
- Firestone, J.; Kirk, H. A Strong Relative Preference for Wind Turbines in the United States among Those Who Live near Them. Nat. Energy 2019, 4, 311–320. [Google Scholar] [CrossRef]
- Upton, V.; Dhubháin, Á.N.; Bullock, C. Are Forest Attitudes Shaped by the Extent and Characteristics of Forests in the Local Landscape? Soc. Nat. Resour. 2015, 28, 641–656. [Google Scholar] [CrossRef]
- Locke, D.H.; Roman, L.A.; Murphy-Dunning, C. Why Opt-in to a Planting Program? Long-Term Residents Value Street Tree Aesthetics. Arboric. Urban For. 2015, 41, 324–333. [Google Scholar]
- Brown, D.G.; Johnson, K.M.; Loveland, T.R.; Theobald, D.M. Rural Land-Use Trends in the Conterminous United States, 1950–2000. Ecol. Appl. 2005, 15, 1851–1863. [Google Scholar] [CrossRef] [Green Version]
- Nowak, D.J.; Greenfield, E.J. Tree and Impervious Cover in the United States. Landsc. Urban Plan. 2012, 107, 21–30. [Google Scholar] [CrossRef] [Green Version]
- U.S. Census Bureau. U.S. Census 2010; US. Department of Commerce: Washington, DC, USA, 2011.
- Sheskin, I.M. Survey Research for Geographers; Association of American Geographers: Washington, DC, USA, 1985. [Google Scholar]
- Dillman, D.A.; Smyth, J.D.; Christian, L.M. Internet, Phone, Mail, and Mixed-Mode Surveys: The Tailored Design Method; John Wiley & Sons: Hoboken, NJ, USA, 2009; ISBN 978-1-118-92130-2. [Google Scholar]
- Fazio, R.H.; Chen, J.; McDonel, E.C.; Sherman, S.J. Attitude Accessibility, Attitude-Behavior Consistency, and the Strength of the Object-Evaluation Association. J. Exp. Soc. Psychol. 1982, 18, 339–357. [Google Scholar] [CrossRef]
- Davis, K.L.; Jones, R.E. Modeling Environmental Concern for Urban Tree Protection Using Biophysical and Social Psychological Indicators. Soc. Nat. Resour. 2014, 27, 372–388. [Google Scholar] [CrossRef]
- Almas, A.D.; Conway, T. Resident Attitudes and Actions Toward Native Tree Species: A Case Study of Residents in Four Southern Ontario Municipalities. Arboric. Urban For. 2018, 44, 101–115. [Google Scholar]
- Wyatt, S.; Rousseau, M.-H.; Nadeau, S.; Thiffault, N.; Guay, L. Social Concerns, Risk and The Acceptability of Forest Vegetation Management Alternatives: Insights for Managers. For. Chron. 2011, 87, 274–289. [Google Scholar] [CrossRef]
- Cortina, J.M. What Is Coefficient Alpha? An Examination of Theory and Applications. J. Appl. Psycol. 1993, 78, 98–104. [Google Scholar] [CrossRef]
- Bunce, A.; Volin, J.C.; Miller, D.R.; Parent, J.; Rudnicki, M. Determinants of Tree Sway Frequency in Temperate Deciduous Forests of the Northeast United States. Agric. For. Meteorol. 2019, 266–267, 87–96. [Google Scholar] [CrossRef] [Green Version]
- Vaske, J.J.; Donnelly, M.P. A Value-Attitude-Behavior Model Predicting Wildland Preservation Voting Intentions. Soc. Nat. Resour. 1999, 12, 523–537. [Google Scholar]
- Fulton, D.C.; Manfredo, M.J.; Lipscomb, J. Wildlife Value Orientations: A Conceptual and Measurement Approach. Hum. Dimens. Wildl. 1996, 1, 24–47. [Google Scholar] [CrossRef]
- Zinn, H.C.; Manfredo, M.J.; Barro, S.C. Patterns of Wildlife Value Orientations in Hunters’ Families. Hum. Dimens. Wildl. 2002, 7, 147–162. [Google Scholar] [CrossRef]
- Vaske, J.J.; Donnelly, M.P.; Williams, D.R.; Jonker, S. Demographic Influences on Environmental Value Orientations and Normative Beliefs About National Forest Management. Soc. Nat. Resour. 2001, 14, 761–776. [Google Scholar] [CrossRef]
- Homer, C.; Dewitz, J.; Jin, S.; Xian, G.; Costello, C.; Danielson, P.; Gass, L.; Funk, M.; Wickham, J.; Stehman, S.; et al. Conterminous United States Land Cover Change Patterns 2001–2016 from the 2016 National Land Cover Database. ISPRS J. Photogramm. Remote Sens. 2020, 162, 184–199. [Google Scholar] [CrossRef]
- ESRI. ArcMap 10.6.1; Environmental Systems Resource Institute: Redlands, CA, USA, 2018. [Google Scholar]
- State of Connecticut General Statute 16a-4c. Available online: https://www.cga.ct.gov/current/pub/chap_295.htm#sec_16a-4c (accessed on 1 May 2020).
- Van Berkel, D.B.; Rayfield, B.; Martinuzzi, S.; Lechowicz, M.J.; White, E.; Bell, K.P.; Colocousis, C.R.; Kovacs, K.F.; Morzillo, A.T.; Munroe, D.K.; et al. Recognizing the ‘Sparsely Settled Forest’: Multi-Decade Socioecological Change Dynamics and Community Exemplars. Landsc. Urban Plan. 2018, 170, 177–186. [Google Scholar] [CrossRef]
- Benenson, I.; Martens, K.; Rofé, Y. Measuring the Gap between Car and Transit Accessibility: Estimating Access Using a High-Resolution Transit Network Geographic Information System. Transp. Res. Rec. J. Transp. Res. Board 2010, 2144, 28–35. [Google Scholar] [CrossRef]
- Tele Atlas North America, Inc Street Centerline Used for Geocoding 9-1-1 Wireline Telephone Calls (Version 6.2) [Shapefile]; State of Connecticut Department of Public Safety: Preston, CT, USA, 2010.
- Bryman, A.; Cramer, D. Quantitative Data Analyses with SPSS 12 and 13. A Guide for Social Scientists; Routledge: New York, NY, USA, 2005. [Google Scholar]
- Watkins, C.; Poudyal, N.C.; Caplenor, C.; Buehler, D.; Applegate, R. Motivations and Support for Regulations: A Typology of Eastern Wild Turkey Hunters. Hum. Dimens. Wildl. 2018, 23, 433–445. [Google Scholar] [CrossRef]
- Gliner, J.A.; Vaske, J.J.; Morgan, G.A. Null Hypothesis Significance Testing: Effect Size Matters. Hum. Dimens. Wildl. 2001, 6, 291–301. [Google Scholar] [CrossRef]
- ACS 5-Year Estimates, 2013-2017. US Census Bureau (USCB), Department of Commerce. Available online: https://factfinder.census.gov/ (accessed on 23 January 2020).
- Nitoslawski, S.A.; Duinker, P.N.; Bush, P.G. A Review of Drivers of Tree Diversity in Suburban Areas: Research Needs for North American Cities. Environ. Rev. 2016, 24, 471–483. [Google Scholar] [CrossRef] [Green Version]
- Ryan, R.L. Comparing the Attitudes of Local Residents, Planners, and Developers about Preserving Rural Character in New England. Landsc. Urban Plan. 2006, 75, 5–22. [Google Scholar] [CrossRef]
- Ghanem, D.A.; Mander, S.; Gough, C. “I Think We Need to Get a Better Generator”: Household Resilience to Disruption to Power Supply During Storm Events. Energy Policy 2016, 92, 171–180. [Google Scholar] [CrossRef]
- Schulte, S.; Miller, K.A. Wildfire Risk and Climate Change: The Influence on Homeowner Mitigation Behavior in the Wildland–Urban Interface. Soc. Nat. Resour. 2010, 23, 417–435. [Google Scholar] [CrossRef]
- Conway, T.M.; Yip, V. Assessing Residents’ Reactions to Urban Forest Disservices: A Case Study of a Major Storm Event. Landsc. Urban Plan. 2016, 153, 1–10. [Google Scholar] [CrossRef]
- Clement, J.M.; Cheng, A.S. Using Analyses of Public Value Orientations, Attitudes and Preferences to Inform National Forest Planning in Colorado and Wyoming. Appl. Geogr. 2011, 31, 393–400. [Google Scholar] [CrossRef]
- Camacho-Cervantes, M.; Schondube, J.E.; Castillo, A.; MacGregor-Fors, I. How Do People Perceive Urban Trees? Assessing Likes and Dislikes in Relation to the Trees of a City. Urban Ecosyst. 2014, 17, 761–773. [Google Scholar] [CrossRef]
- Shakeel, T.; Conway, T.M. Individual Households and Their Trees: Fine-Scale Characteristics Shaping Urban Forests. Urban For. Urban Green. 2014, 13, 136–144. [Google Scholar] [CrossRef]
- Sharp, J.S.; Clark, J.K. Between the Country and the Concrete: Rediscovering the Rural-Urban Fringe. City Community 2008, 7, 61–79. [Google Scholar] [CrossRef]
- Jones, R.E.; Fly, J.M.; Talley, J.; Cordell, H.J. Green Migration into Rural America: The New Frontier of Environmentalism? Soc. Nat. Resour. 2003, 16, 221–238. [Google Scholar] [CrossRef] [Green Version]
- Egan, A.F.; Luloff, A.E. The Exurbanization of America’s Forests: Research in Rural Social Science. J. For. 2000, 98, 26–30. [Google Scholar]
- Compas, E. Measuring Exurban Change in the American West: A Case Study in Gallatin County, Montana, 1973–2004. Landsc. Urban Plan. 2007, 82, 56–65. [Google Scholar] [CrossRef]
- Town of Mansfield Zoning Regulations of the Town of Mansfield, Connecticut. 2019. Available online: http://mansfieldct.gov/DocumentCenter/View/2327/Current-Zoning-Regulations-for-the-Town-of-Mansfield (accessed on 13 July 2020).
- Loomis, J.B.; Bair, L.S.; González-Cabán, A. Prescribed Fire and Public Support. J. For. 2001, 99, 18–22. [Google Scholar]
- Almas, A.D.; Conway, T.M. Residential Knowledge of Native Tree Species: A Case Study of Residents in Four Southern Ontario Municipalities. Environ. Manag. 2017, 59, 21–33. [Google Scholar] [CrossRef]
- Poulos, H.M. Spatially Explicit Mapping of Hurricane Risk in New England, USA Using ArcGIS. Nat. Hazards 2010, 54, 1015–1023. [Google Scholar] [CrossRef]
- Poulos, H.M.; Camp, A.E. Mapping Threats to Power Line Corridors for Connecticut Rights-of-Way Management. Environ. Manag. 2011, 47, 230–238. [Google Scholar] [CrossRef]
- Poulos, H.M.; Camp, A.E. Decision Support for Mitigating the Risk of Tree Induced Transmission Line Failure in Utility Rights-of-Way. Environ. Manag. 2010, 45, 217–226. [Google Scholar] [CrossRef]
- State Vegetation Management Task Force Final Report: Issued to the Connecticut Department of Energy & Environmental Protection 2012. Available online: https://portal.ct.gov/-/media/DEEP/forestry/VMTF/Final_Report/SVMTFFinalReportpdf.pdf (accessed on 15 July 2020).
- Town of Greenwich Public Tree Policy. Dep. Parks Recreat. 2018. Available online: https://www.greenwichct.gov/DocumentCenter/View/176/Public-Tree-Policy-PDF (accessed on 26 June 2020).
- Town of Mansfield Scenic Roads Ordinance. Town Code Chapter 155 1995. Available online: https://www.ecode360.com/MA1517 (accessed on 29 May 2020).
Figure 1.
Study areas sampled as part of this analysis within the state of Connecticut.


Table 1.
Sample characteristics of variables reported by study area.
| Variable (n) | Northeast | Southwest | Northwest | Southeast | All | |
|---|---|---|---|---|---|---|
| AttProfessional (1904, mean ± SD; scale 6–30) a d | 21.4 ± 5.0 | 20.5 ± 4.9 | 20.8 ± 5.2 | 20.3 ± 5.6 | 20.8 ± 5.2 | |
| AttSafety (1904, mean ± SD; scale 4–20) a d f | 17.2 ± 2.5 | 17.1 ± 2.4 | 17.0 ± 2.5 | 16.6 ± 2.7 | 17.0 ± 2.5 | |
| AttTradeoff (1931, mean ± SD; scale 5–25) | 20.0 ± 3.5 | 20.2 ± 3.5 | 20.1 ± 3.6 | 20.0 ± 3.7 | 20.1 ± 3.6 | |
| KnowTree (1931, mean ± SD; scale 4–20) a b f g | 16.3 ± 1.7 | 16.7 ± 1.7 | 16.5 ± 1.8 | 16.2 ± 2.0 | 16.4 ± 1.8 | |
| Abundant (1832, mean ± SD; scale 9–45) a d f | 42.3 ± 4.2 | 42.5 ± 3.8 | 42.2 ± 4.1 | 41.6 ± 4.7 | 42.1 ± 4.2 | |
| Biocentric (1832, mean ± SD; scale 3–15) | 12.1 ± 2.6 | 11.9 ± 2.5 | 11.9 ± 2.8 | 12.1 ± 2.7 | 12.0 ± 2.7 | |
| Use (1828, mean ± SD; scale 4–20) | 16.7 ± 2.6 | 16.7 ± 2.5 | 16.7 ± 2.5 | 16.6 ± 2.6 | 16.7 ± 2.6 | |
| HouseholdSize (1692, mean # of individuals ± SD) a b e f | 2.5 ± 1.2 | 2.8 ± 1.3 | 2.5 ± 1.3 | 2.4 ± 1.1 | 2.6 ± 1.2 | |
| Children (1700, % households with children) a b e f | 26.3 | 36.3 | 23.9 | 20.2 | 26.4 | |
| Sex (1912, % female) | 52.6 | 49.0 | 50.5 | 57.5 | 52.4 | |
| Age (1812, mean age in years ± SD) | 60.8 ± 14.7 | 61.5 ± 13.5 | 61.5 ± 14.5 | 60.8 ± 14.0 | 61.1 ± 14.2 | |
| Tenure (1911, mean years ± SD) | 21.3 ± 14.6 | 21.1 ± 14.9 | 21.6 ± 15.8 | 22.1 ± 15.2 | 21.5 ± 15.1 | |
| KnowWind (1881, %) | ||||||
| Round crown with thick trunk | 61.7 | 60.9 | 62.7 | 58.6 | 61.1 | |
| Round crown with thin trunk | 28.3 | 30.0 | 28.1 | 30.9 | 29.2 | |
| Crown cropped one side; thin trunk | 10.0 | 9.1 | 9.2 | 10.5 | 9.7 | |
| OutcomeAesthetics (1864, %) | 22.7 | 24.1 | 23.7 | 17.2 | 22.0 | |
| OutcomeReducedOutages (1864, %) | 49.1 | 50.2 | 51.0 | 52.2 | 50.5 | |
| GreenTunnel (1890, %) a | ||||||
| I have no opinion about this d e f | 15.9 | 13.5 | 21.6 | 22.7 | 18.4 | |
| I am OK with this changing if it results in fewer outages | 54.7 | 49.2 | 48.3 | 51.4 | 51.1 | |
| It is important to maintain this look f | 29.4 | 37.3 | 30.0 | 25.8 | 30.5 | |
| RoadForest (1853, %) | ||||||
| Green tunnel of trees | 6.8 | 10.5 | 6.7 | 8.0 | 7.9 | |
| Current vegetation management | 18.9 | 22.8 | 22.5 | 20.2 | 21.0 | |
| Greater spacing of trees | 74.3 | 66.7 | 70.8 | 71.7 | 71.1 | |
| LocReside (1857, %) a | ||||||
| Rural b e f | 32.3 | 18.8 | 27.4 | 32.8 | 28.1 | |
| Semi-rural (also referred to as exurban) f | 31.2 | 37.6 | 31.9 | 28.7 | 32.3 | |
| Suburban b f | 32.5 | 41.9 | 37.3 | 28.9 | 35.0 | |
| Urban d f g | 4.0 | 1.7 | 3.4 | 9.6 | 4.6 | |
| Education (1907, %) a | ||||||
| Less than high school | 0.9 | 0.2 | 0.0 | 0.9 | 0.5 | |
| High school or equivalent b e f | 9.3 | 3.5 | 7.9 | 12.9 | 8.4 | |
| Some college b | 13.3 | 7.9 | 10.1 | 13.1 | 11.2 | |
| Vocational or trade school e f | 5.4 | 2.1 | 6.2 | 6.9 | 5.2 | |
| College degree (2-year or certificate) b f | 10.9 | 5.6 | 10.1 | 11.1 | 9.5 | |
| College degree (Bachelor’s) f | 28.3 | 35.9 | 29.8 | 26.4 | 29.9 | |
| Graduate or professional degree b e f | 31.8 | 45.1 | 36.0 | 28.8 | 35.1 | |
| Income (1629, %) a | ||||||
| Less than $25,000 | 3.6 | 2.9 | 6.8 | 5.8 | 4.8 | |
| $25,000–$49,999 b e f | 14.9 | 4.6 | 11.9 | 12.3 | 11.3 | |
| $50,000–$74,999 b f | 19.8 | 9.2 | 9.2 | 19.6 | 14.8 | |
| $75,000–$99,999 f | 18.1 | 11.7 | 15.3 | 21.2 | 16.8 | |
| $100,000 or more b c e f g | 43.6 | 71.6 | 56.9 | 41.1 | 52.4 | |
| Developed (1959, %) a c | 42.2 ± 33.4 | 38.8 ± 32.1 | 36.1 ± 28.9 | 37.4 ± 31.4 | 38.7 ± 31.6 | |
| Tree (1959, %) a b c | 47.6 ± 30.4 | 54.0 ± 30.5 | 55.4 ± 27.6 | 52.1 ± 29.4 | 52.1 ± 29.6 | |
| Parcel Size (1955, acre) | 2.3 ± 5.5 | 2.1 ± 2.0 | 2.6 ± 5.9 | 4.3 ± 26.6 | 2.9 ± 13.6 | |
| DistToRoad (1959, m) a b d e | 40.1 ± 36.5 | 53.1 ± 38.6 | 43.7 ± 31.8 | 48.9 ± 49.2 | 46.0 ± 39.6 | |
| DistUrban(1959, km) a b c d e f g | 26.7 ± 9.0 | 28.8 ± 9.0 | 28.8 ± 9.1 | 65.5 ± 10.2 | 37.5 ± 18.2 | |
a Significant difference among study areas (p < 0.05): AttProfessional (F3,1900 = 4.050, p = 0.007); AttSafety (F3,1900 = 5.366, p = 0.001); KnowTree (F3,1927 = 6.894, p < 0.000); Abundant (F3,1828 = 3.717, p = 0.011); HouseholdSize (F3,1744 = 7.871, p < 0.001); Children (χ2 = 28.116, df = 3, p < 0.001); GreenTunnel (χ2 = 26.898, df = 6, p < 0.001); LocReside (χ2 = 71.027, df = 9, p < 0.001); Education (χ2 = 85.227, df = 18, p < 0.001); Income (χ2 = 112.340, df = 12, p < 0.001); Development (F3,1955 = 3.693, p = 0.011); Tree (F3,1955 = 6.971, p < 0.001); DistToRoad (F3,1955 = 10.392, p < 0.001); DistUrban (F3,1955 = 1886.195, p < 0.001). Tukey’s HSD differences between study areas (p < 0.05): b Northeast and Southwest strata; c Northeast and Northwest; d Northeast and Southeast; e Southwest and Northwest; f Southwest and Southeast strata; g Northwest and Southeast.
Table 2.
Derivation of value orientation variables (n = 1828).
| Variable (Reliability) a | |||
|---|---|---|---|
| Belief Statement | Abundant (0.910) | Biocentric (0.717) | Use (0.634) |
| Humans should manage trees so that humans benefit | X | ||
| Losing trees is acceptable if the overall forest is maintained | X | ||
| We should use trees to add to the quality of human life | X | ||
| It is important for humans to manage trees | X | ||
| Trees have as much right to exist as humans | X | ||
| Nature has as much right to exist as humans | X | ||
| Trees have value whether humans are present or not | X | ||
| Humans should ensure the survival of trees | X | ||
| It is important that we always have abundant trees | X | ||
| It is important for me to know that trees exist | X | ||
| We should ensure that future generations have an abundance of trees | X | ||
| It is important to maintain trees for future generations to enjoy | X | ||
| I enjoy seeing trees around my home | X | ||
| I notice trees around me every day | X | ||
| Having trees around my home is important to me | X | ||
| Trees are an important part of my community | X | ||
a Cronbach’s alpha (α) measures internal reliability for each variable.
Table 3.
Results of regression analysis a for AttProfessional across each of the four study areas.
| Northeast b | Southwest c | Northwest d | Southeast e | |||||
|---|---|---|---|---|---|---|---|---|
| Variables | B | t | B | t | B | t | B | t |
| KnowTree | 0.19 | 4.050.37 | 0.27 | 4.990.38 | 0.31 | 6.510.35 | 0.21 | 3.830.35 |
| KnowWind | −0.14 | −1.49 | 0.07 | 0.66 | 0.04 | 0.41 | −0.12 | −1.07 |
| GreenTunnel | 0.38 | 3.810.32 | 0.40 | 3.560.25 | 0.25 | 2.440.27 | 0.35 | 2.920.29 |
| OutcomeReducedOutages | 0.15 | 1.40 | 0.36 | 2.730.26 | 0.38 | 3.190.29 | 0.12 | 0.95 |
| OutcomeAesthetics | −0.12 | −0.95 | −0.12 | −0.81 | −0.23 | −1.75 | −0.20 | −1.26 |
| RoadForest | 0.14 | 1.26 | −0.10 | −0.82 | 0.09 | 0.83 | −0.06 | −0.46 |
| Use | 0.17 | 3.460.32 | 0.19 | 3.390.41 | 0.14 | 2.670.32 | 0.19 | 3.250.38 |
| Abundant | −0.13 | −2.310.27 | −0.04 | −0.64 | −0.07 | −1.23 | −0.10 | −1.56 |
| Biocentric | 0.10 | 1.79 | 0.05 | 0.77 | −0.04 | −0.66 | −0.04 | −0.61 |
| Tenure | −0.01 | −0.12 | −0.13 | −2.070.18 | −0.03 | −0.47 | −0.06 | −0.88 |
| Sex | −0.01 | −0.13 | 0.10 | 0.88 | −0.01 | −0.08 | 0.08 | 0.70 |
| Age | 0.10 | 1.66 | 0.00 | 0.00 | 0.03 | 0.52 | 0.04 | 0.50 |
| Education | −0.01 | −0.27 | −0.03 | −0.48 | −0.04 | −0.70 | −0.05 | −0.89 |
| Income | −0.09 | −1.84 | −0.06 | −1.03 | −0.02 | −0.33 | −0.02 | −0.25 |
| Developed | −0.05 | −0.46 | 0.21 | 1.25 | 0.26 | 2.120.29 | 0.14 | 0.94 |
| Tree | −0.05 | −0.43 | 0.17 | 1.07 | 0.23 | 2.020.28 | 0.20 | 1.43 |
| DistToRoad | 0.03 | 0.55 | 0.04 | 0.65 | 0.04 | 0.82 | 0.02 | 0.36 |
| ParcelSize | −0.06 | −1.10 | 0.08 | 1.28 | 0.01 | 0.22 | 0.01 | 0.16 |
| DistUrban | 0.10 | 1.73 | −0.06 | −0.79 | 0.01 | 0.21 | 0.01 | 0.20 |
a Standardized coefficient (B) and t-statistic (t) reported. Superscript designates effect size (Eta) for variables identified as significant at p < 0.05. b R2 = 0.241 (Adj. R2 = 0.202), F = 6.155, p < 0.001; n = 387. c R2 = 0.300 (Adj. R2 = 0.252), F = 6.259, p < 0.001; n = 297. d R2 = 0.306 (Adj. R2 = 0.265), F = 7.504, p < 0.001; n = 343. e R2 = 0.222 (Adj. R2 = 0.173), F = 4.549, p < 0.001; n = 322.
Table 4.
Results of regression analysis a for AttSafety across each of the four study areas.
| Northeast b | Southwest c | Northwest d | Southeast e | |||||
|---|---|---|---|---|---|---|---|---|
| Variables | B | t | B | t | B | t | B | t |
| KnowTree | 0.24 | 5.090.35 | 0.29 | 5.540.40 | 0.25 | 4.950.33 | 0.19 | 3.590.44 |
| KnowWind | −0.09 | −0.95 | 0.17 | 1.61 | −0.02 | −0.17 | −0.19 | −1.74 |
| GreenTunnel | 0.33 | 3.320.28 | 0.16 | 1.51 | 0.29 | 2.660.27 | 0.32 | 2.740.29 |
| OutcomeReducedOutages | 0.23 | 2.160.24 | 0.39 | 3.120.30 | 0.29 | 2.370.25 | 0.08 | 0.69 |
| OutcomeAesthetics | −0.08 | −0.65 | −0.1 | −0.7 | −0.1 | −0.73 | −0.25 | −1.59 |
| RoadForest | 0.08 | 0.73 | 0.04 | 0.34 | 0.02 | 0.17 | 0.07 | 0.56 |
| Use | 0.27 | 5.450.40 | 0.26 | 4.820.46 | 0.25 | 4.800.40 | 0.23 | 4.020.40 |
| Abundant | 0.01 | 0.25 | 0.07 | 1.14 | 0.04 | 0.64 | 0.11 | 1.84 |
| Biocentric | 0.03 | 0.54 | 0.03 | 0.46 | −0.11 | −1.84 | −0.08 | −1.3 |
| Tenure | −0.06 | −0.95 | −0.12 | −1.88 | −0.02 | −0.32 | 0 | 0.08 |
| Sex | 0.22 | 2.320.01 | 0.24 | 2.250.09 | 0.23 | 2.270.02 | 0.07 | 0.65 |
| Age | 0.03 | 0.52 | 0.08 | 1.26 | −0.04 | −0.6 | −0.06 | −0.9 |
| Education | 0.05 | 0.99 | 0.02 | 0.43 | −0.02 | −0.34 | 0.03 | 0.44 |
| Income | −0.08 | −1.54 | 0.06 | 1.05 | −0.02 | −0.35 | 0.01 | 0.09 |
| Developed | 0.11 | 0.92 | 0.05 | 0.32 | 0.17 | 1.38 | 0 | 0 |
| Tree | 0.16 | 1.38 | 0.04 | 0.27 | 0.17 | 1.44 | 0.09 | 0.64 |
| DistToRoad | 0 | 0.04 | −0.01 | −0.25 | 0.04 | 0.66 | 0 | 0.03 |
| ParcelSize | −0.07 | −1.38 | 0.06 | 1.07 | 0.01 | 0.14 | 0.04 | 0.84 |
| DistUrban | 0.02 | 0.3 | −0.13 | −1.96 | −0.01 | −0.11 | 0.1 | 1.39 |
a Standardized coefficient (B) and t-statistic (t) reported. Superscript designates effect size (Eta) for variables identified as significant at p < 0.05. b R2 = 0.267 (Adj. R2 = 0.230), F = 7.070, p < 0.001; n = 387. c R2 = 0.349 (Adj. R2 = 0.304), F = 7.815, p < 0.001; n = 297. d R2 = 0.260 (Adj. R2 = 0.216), F = 5.972, p < 0.001; n = 343. e R2 = 0.241 (Adj. R2 = 0.193), F = 5.063, p < 0.001; n = 322.
Table 5.
Results of regression analysis a for AttTradeoff across for each of the four study areas.
| Northeast b | Southwest c | Northwest d | Southeast e | All f | ||||||
|---|---|---|---|---|---|---|---|---|---|---|
| Variables | B | t | B | t | B | t | B | t | B | t |
| KnowTree | 0.27 | 6.820.41 | 0.35 | 7.880.54 | 0.29 | 7.210.39 | 0.29 | 6.770.40 | 0.29 | 14.290.41 |
| KnowWind | −0.08 | −1.03 | −0.11 | −1.20 | −0.25 | −3.040.11 | −0.03 | −0.40 | −0.12 | −2.830.11 |
| GreenTunnel | 0.63 | 7.520.46 | 0.29 | 3.130.34 | 0.48 | 5.580.42 | 0.54 | 5.760.50 | 0.48 | 10.920.43 |
| OutcomeReducedOutages | 0.39 | 4.220.39 | 0.38 | 3.500.37 | 0.36 | 3.610.36 | 0.31 | 3.250.39 | 0.36 | 7.340.38 |
| OutcomeAesthetics | −0.11 | −1.03 | −0.03 | −0.25 | −0.14 | −1.27 | −0.11 | −0.90 | −0.14 | −2.350.27 |
| RoadForest | 0.00 | 0.02 | 0.10 | 1.01 | 0.25 | 2.740.24 | 0.21 | 2.210.23 | 0.13 | 2.860.21 |
| Use | 0.22 | 5.180.43 | 0.29 | 6.360.52 | 0.28 | 6.530.49 | 0.16 | 3.540.46 | 0.23 | 10.840.45 |
| Abundant | −0.16 | −3.420.27 | −0.02 | −0.42 | −0.03 | −0.58 | −0.14 | −2.840.29 | −0.10 | −4.510.22 |
| Biocentric | −0.01 | −0.19 | −0.18 | −3.470.32 | −0.15 | −3.210.27 | −0.08 | −1.69 | −0.09 | −4.130.26 |
| Tenure | −0.02 | −0.36 | −0.11 | −2.020.22 | 0.05 | 1.03 | −0.03 | −0.61 | −0.02 | −0.66 |
| Sex | −0.13 | −1.64 | −0.07 | −0.72 | −0.17 | −2.050.23 | −0.27 | −3.050.20 | −0.17 | −4.070.20 |
| Age | 0.08 | 1.48 | 0.06 | 1.12 | −0.08 | −1.50 | 0.09 | 1.60 | 0.04 | 1.37 |
| Education | 0.00 | 0.06 | −0.08 | −1.64 | −0.05 | −1.11 | −0.00 | −0.07 | −0.03 | −1.45 |
| Income | −0.00 | −0.01 | 0.02 | 0.43 | −0.02 | −0.50 | −0.09 | −1.95 | −0.02 | −1.03 |
| Developed | 0.16 | 1.60 | 0.13 | 0.94 | −0.14 | −1.40 | −0.08 | −0.67 | 0.02 | 0.42 |
| Tree | 0.15 | 1.55 | 0.23 | 1.81 | −0.07 | −0.69 | −0.03 | −0.26 | 0.07 | 1.42 |
| DistToRoad | −0.02 | −0.38 | −0.02 | −0.45 | 0.02 | 0.37 | 0.05 | 1.05 | 0.01 | 0.32 |
| ParcelSize | 0.01 | 0.27 | 0.05 | 0.95 | −0.09 | −2.080.20 | −0.06 | −1.36 | −0.02 | −0.79 |
| DistUrban | 0.05 | 1.08 | −0.07 | −1.30 | −0.00 | −0.05 | −0.03 | −0.53 | 0.00 | 0.16 |
a Standardized coefficient (B) and t-statistic (t) reported. Superscript designates effect size (Eta) for variables indicated as significant at p < 0.05. b R2 = 0.455 (Adj. R2 = 0.427), F = 16.58, p < 0.001; n = 398. c R2 = 0.517 (Adj. R2 = 0.485), F = 15.89, p < 0.001; n = 302. d R2 = 0.521 (Adj. R2 = 0.493), F = 18.82, p < 0.001; n = 349. e R2 = 0.510 (Adj. R2 = 0.479), F = 16.69, p < 0.001; n = 325. f R2 = 0.472 (Adj. R2 = 0.465), F = 63.69, p < 0.001; n = 1374.
Publisher’s Note: MDPI stays neutral with regard to jurisdictional claims in published maps and institutional affiliations. |
© 2021 by the authors. Licensee MDPI, Basel, Switzerland. This article is an open access article distributed under the terms and conditions of the Creative Commons Attribution (CC BY) license (http://creativecommons.org/licenses/by/4.0/).
Share and Cite
MDPI and ACS Style
DiFalco, S.; Morzillo, A.T. Comparison of Attitudes towards Roadside Vegetation Management across an Exurban Landscape. Land 2021, 10, 308. https://0-doi-org.brum.beds.ac.uk/10.3390/land10030308
AMA Style
DiFalco S, Morzillo AT. Comparison of Attitudes towards Roadside Vegetation Management across an Exurban Landscape. Land. 2021; 10(3):308. https://0-doi-org.brum.beds.ac.uk/10.3390/land10030308
Chicago/Turabian StyleDiFalco, Steven, and Anita T. Morzillo. 2021. "Comparison of Attitudes towards Roadside Vegetation Management across an Exurban Landscape" Land 10, no. 3: 308. https://0-doi-org.brum.beds.ac.uk/10.3390/land10030308
Note that from the first issue of 2016, this journal uses article numbers instead of page numbers. See further details here.