
Radiation Effect of Urban Agglomeration’s Transportation Network: Evidence from Chengdu–Chongqing Urban Agglomeration, China

1
School of Management Science and Real Estate, Chongqing University, Chongqing 400044, China
2
Research Center for Construction Economy and Management, Chongqing University, Chongqing 400044, China
*
Author to whom correspondence should be addressed.
Land 2021, 10(5), 520; https://0-doi-org.brum.beds.ac.uk/10.3390/land10050520
Submission received: 27 March 2021
/
Revised: 27 April 2021
/
Accepted: 10 May 2021
/
Published: 13 May 2021
(This article belongs to the Section Urban Contexts and Urban-Rural Interactions)
Abstract
:Recent years have seen the global proliferation and integration of transportation systems in urban agglomeration (UA), suggesting that transportation networks have become more prominent in the sustainable development of UA. Core cities play a radiating and driving role in affecting their adjacent cities to formulate transportation networks. Such a phenomenon is called the radiation effect of transportation networks and can be imaged using a field strength model as proposed in the study. The field strength model was verified using the Chengdu–Chongqing urban agglomeration (CCUA) as a case. Case data concerning transportation routes and traffic volume were collected for the past 20 years. The data analyses results indicate a relatively stable pattern of transportation networks in the UA. UA cities’ radiation effects follow the same compactness trend. The core cities’ radiation spheres go beyond their territories, and they can envelop the surrounding cities, highlighting the core cities’ dominance in the entire transportation network. Moreover, two development stages of UA transportation—focus and spillover—are also identified. This study contributes to the literature by providing an innovative quantitative method to detect the interaction between a city’s transportation system and peripheral cities or regions. The radiation effect of cities’ transportation systems should be considered in the UA transportation development plan, so as to meet the needs of spatial structure planning and coordinated development of the UA.
1. Introduction
Transportation has been one of the most important economic growth drivers as it fosters access to employment opportunities, services, and amenities, and contributes to a social network [1,2]. As highlighted in previous studies, the relationship between transportation and economies is statistically significant and positive [3,4]. In America, advanced transportation has been an engine of the next wave of economic growth [5]. In India, transportation is considered to be directly related to critical sectors, such as housing, shelter, and livelihoods [6]. In the European Union, Korea, and China, high-speed rail services fortify regional connections to reap economic, environmental, and social benefits [7,8].
The driving role of transportation is more obvious in the formation and development of urban agglomeration (UA). UA refers to a highly developed spatial form composed of core cities and adjoining outgrowths [9]. Cities are highly integrated within an UA, which renders the agglomeration one of the most important carriers for global economic development [10].UA prosperity results from an improved industrial linkage, compacted spatial organization, and integrated economic connection [11]. Intercity transportation corridors, such as intercity railways, high-speed rails, and high-speed highways, constitute the most fundamental UA transportation network element. A reasonable distribution of nodes and ties in the transportation network is conducive to socioeconomic prosperity through utilizing transportation systems [12,13].
Core cities in a UA play a leading role in driving the whole region to assume greater responsibility in integrating transportation systems [14]. The role also aids the core cities to function as a trigger of diffusing total production factors to peripheral regions [15,16]. In turn, an expedited diffusion of social and economic factors requires consolidating the transportation links between core cities and the surrounding areas [17]. The focus goes to intercity links to facilitate the coordinated development of UA transportation. It seems that UA cities cannot be isolated from one another from the perspective of transportation networks. Instead, a city’s transportation system has impacts on its counterparts. This phenomenon, caused by the disparity in the development levels of transportation systems between cities, can be called the radiation effect of a city’s transportation system.
The radiation effect of transportation systems is a theme of traffic planning and regional development widely concerned in previous studies. López et al. [18] and Monzón et al. [19] found that the main concerns in an early phase of transportation networks have been the over-supply of connecting services to core cities. For this reason, researchers probably argued that if only a core city’s traffic conditions reached a high level would the entire territory’s transportation system be improved. For instance, in the Yangtze River Delta, UA transportation exhibits a diffusion effect due to Shanghai’s leading role in the UA [20]. As Jiao et al. [21] delineated, such kinds of radiation effects spill over to facilitate regional transportation networks possess a core-periphery structure. The core-periphery structure connects a core city to its surrounding areas in a tree-like shape [22]. Chen [23] investigated the unbalance of inter-provincial highways in China and appreciated it important to orient UA cities’ transportation systems to promote the connectivity between neighboring areas. Derudder et al. [24] attempted to uncover the connectivity of South Asian cities concerning traffic networks. They found that some cities, such as Delhi, Mumbai, and Lahore, are important nodes for integrating regional transportation. The centralities of these cities are remarkable in the transportation network. Moreover, researchers have advocated less developed areas to utilize the transportation network’s radiation effect to develop their transportations following core cities’ strategies [23].
A transportation network’s radiation effect has heatedly been debated in the literature regarding its definition and utilization. However, there lacks an effective model to examine the UA’s radiation effect. Specifically, two questions are to be answered in this study, namely (1) how to measure the interaction between a city’s transportation system and peripheral cities or regions reasonably, and (2) how to utilize the transportation network’s radiation effect to achieve the promotion of the integrated UA transportation network. To answer these questions, this study, taking the Chengdu–Chongqing UA (CCUA) as a case, measured the UA transport development and quantified transportation accessibility, and modeled the radiation effects and driving role of core cities in UA transportation systems using field strength model.
The rest of this paper is structured as follows. The second section reviews and summarizes relevant research on UA’s spatial characteristics and field strength rationale. The third section presents the establishment of the field strength model. The fourth section is about an empirical study. The fifth section refers to UA’s calculation results and the sphere of radiation effects. In the sixth section, a discussion based on the findings is conducted. The last section presents the conclusions and policy recommendations.
2. Literature Review
2.1. Urban Spatial Structure
The urban spatial form has experienced the process of transformation from individual cities into mega-city regions or metropolises [25]. Academics, as well as other observers, have long sought explanations for urban spatial structure patterns by which to judge their desirability [26]. Initially, the compact monocentric city is set as a goal in many metropolitan areas for the benefits of minimal land consumption, short distances, or minimizing transport, high density, and mix of land uses [27]. With the rapid development of collective action and cooperation among cities, the monocentric model is apparently no longer suitable for exploring the evolving spatial patterns in some developed mega-city regions [25,28]. The polycentric spatial structure has been considered a recipe for relieving overcrowding in monocentric cities, spreading prosperity to peri-urban areas, and decreasing excessive commuting in-between for transport-related environmental benefits [29]. Based on the impact of the development of transportation and communication technologies on economic activities, Anas et al. [26] analyzed the evolution process of urban spatial form from the monocentric to the polycentric structure. Yang et al. [29] adopted a recursive spatial equilibrium model to explore possible polycentric development scenarios of Shanghai, and found that the unbalance between job opportunities and housing provision promotes the polycentric development of urban spatial structure.
In the dual processes of global urbanization and economic globalization, UAs can be treated as semi-organic systems that both attract and diffuse capital and information, having potential for actively engaging in global competition [10]. The spatial structure of UAs is clearly the next major area of study in urban spatial organization. Lan et al. [25] employed panel regression models to explore the major driving forces underlying the spatial structure evolution of the UAs by innovatively using night-time light data, and pointed out that the transport infrastructure is one of the polycentric drivers for polycentric changes of the UAs in China. Qi et al. [30] probed into UA compactness and spatial distribution characteristics from the perspective of industry, and concluded that, due to the scientific and rational distribution pattern of economic factors, such as funds, technologies and traffic, the higher the compactness is, the more costs can be saved during the operation of the UA.
2.2. UA Transportation
An UA is not only a geographically continuous entity, but also a close connection and collaborative interaction between cities, which promotes the flow of factors, efficient allocation of resources, and industrial linkages among cities [10].
One goal of establishing a UA is to tighten city links to realize a relatively complete aggregate [10,30,31]. Thereby, cities on different scales can benefit from each other, in regards to comparative advantage, complementarity, resource sharing, and industrial integration [10,32]. Transportation infrastructure functions as the backbone of the development of UA [33]. The Tokyo Metropolitan and the Paris Metropolitan upgraded their transportation networks to satisfy UA’s spatial structure needs. By establishing transportation links between Tokyo and its adjacent areas, urban spaces are restructured to facilitate mutual exchanges and cooperation in functional suburbs [12]. Paris UA’s transportation networks, comprising fourteen metro lines, four suburban railway lines, eight tramway lines, and eight regional train lines, spread out over the greater Paris region to deliver quality transportation services to 12 million citizens [13].
The spatial structure of UA is shaped, in large measure, by advances in transportation networks [26]. Transportation infrastructure and its improvements are important elements needed to explain the spatial structure of UA in general [34].
A polycentric spatial structure, denoting multiple UA centers, prevails in Europe and the United States [28]. Such a spatial structure coincides with the emergence of transportation polycentrality [26]. In effect, the UA owns a complex, unique, and large-scale transportation system connecting intra and inter-cities in a broader scope [35]. The transportation system is more advanced than that of counterparts regarding travel distance hierarchy, travel purpose diversity, and travel mode efficiency [1,23].
Recent years have witnessed the increase of UA compactness, requiring a simultaneous improvement of transportation networks [36,37,38]. UA compactness means spatial concentration degree of physical entities, such as resources, funds and technologies [30]. Specifically, in adhering to the principle of UA compactness, internal connectivity in the UA and the distribution of industries, resources, capital, technology, and professionals are optimized from spatial and temporal dimensions [9,30,39]. Using India as a case, Verma et al. [40] disclosed that transportation could restructure regional spatial organizations to advance city development and integrate cities to create opportunities for small and medium-sized cities. Qi et al. [30] probed into UA compactness and spatial distribution characteristics from an industry perspective. They proposed to examine UA compactness from multidimensional perspectives, of which transportation should be prioritized. Garcia-Lopez [34] and Kruszyna et al. [41] examined the relationship between intercity transportation and urban population distribution, and pointed out that the population is regularly distributed around intercity traffic routes. It seems that UA compactness is contributed by a strong transportation network [39,42,43].
2.3. The Field Strength Model
In physics, objects are interrelated and interact with each other [44]. Physical scientists prefer the term “field” to reflect the potential energy of a source object on its surroundings and use “field strength” to characterize the magnitude of this potential energy [45,46]. While field strength is a popular concept in the gravitational field, many researchers employ it to portray the interaction between objects in socioeconomic contexts [47]. Chen [48] promoted a field strength model to image the spatial interaction between cities and found that cities’ actions and reactions are time-lagged and not equal. Karemera et al. [49] demonstrated it suitable to use a field strength model to examine the influence of political, economic, and demographic factors on migration flows to North America. Using the field strength model, Wang et al. [50] examined the evolution of urban attractiveness to tourism. They debated that transportation is a prerequisite for the construction of a local tourism system.
Basically, “field” in the field strength model is generated by one or more field sources; “field strength” can be quantified by using the “mass” of the field source and the distance from the field source [45,46]. Field strength is associated with the laws of universal gravitation and distance attenuation [45]. Thus, the principle of gravity in a spatial shape is followed to determine field strength models for whatever uses [50]. As the network node of spatial structure, cities can affect UA growth [51], defined as the city’s “field strength” in the study. The radiation effect of UA transportation networks denotes the field source’s radiation effect on the whole area. Likewise, a field strength model is proposed to seize the core cities’ radiation effect and viewed as a typical paradigm to reflect a city’s influence.
2.4. UA Transportation Field
Due to the pursuit of efficiency, more capital will be invested to construct a stronger transportation network in the core cities [7,8]. UA government policy should thus address the integral development of transportation networks relying on the improvement of core cities’ transportation networks [1]. Considering the applicability of the field strength model in studying cities’ radiation effect, this research exploited the transportation field strength model.
The radiation effect is detectable in the UA transportation network. According to the conceptualization of universal gravitation, there are mutual attractions between objects [44]. By adhering to the fundamental principle of field strength in physics, the “transportation field” in the UA is coined in the study. The transportation system per city radiates and drives the entire transportation network through transportation fields [19,20]. A city’s transportation system is a field source that further constitutes the transportation field. The city’s transportation development level is the “mass” of the field source [50]. The field source has a radiation effect on any point in the study area. Likewise, the radiation effect is determined by the field source’s mass and the distance in the field [50].
3. Model Development
3.1. Quantifying the Mass of Field Source
The mass of transportation field source refers to the development of a city’s transportation system, measured from two perspectives—physical transportation infrastructure and traffic volume [23,50,52]. While these two types of measurement are both effective in use, they have relatively independence and connotation. According to Jin and Chen [53], they may be synthesized to obtain a better measurement result. Hence, physical transportation infrastructure and traffic volume are combined in the study in quantifying the mass of transportation field source. Indicators for the physical infrastructure can be a total length [23,53], geographical distribution, and route density [54,55]. Indicators for traffic volume include passenger volume [56,57], freight volume [54,56], and turnover of passenger or freight [53]. The mass of the transportation field source is calculated using Equation (1).
where Zi is an index for city i’s transportation field source mass. Yij refers to the values of indicator j for city i. m is the number of principal components with eigenvalues greater than 1. k is the principal component number, and its value is from 1 to m. s is the number of indicators. j is the indicator number, and its value is from 1 to s. λk is the contribution rate of the principal component k. Ckj is the load of principal component k on indicator j.
3.2. Measuring the Field Distance
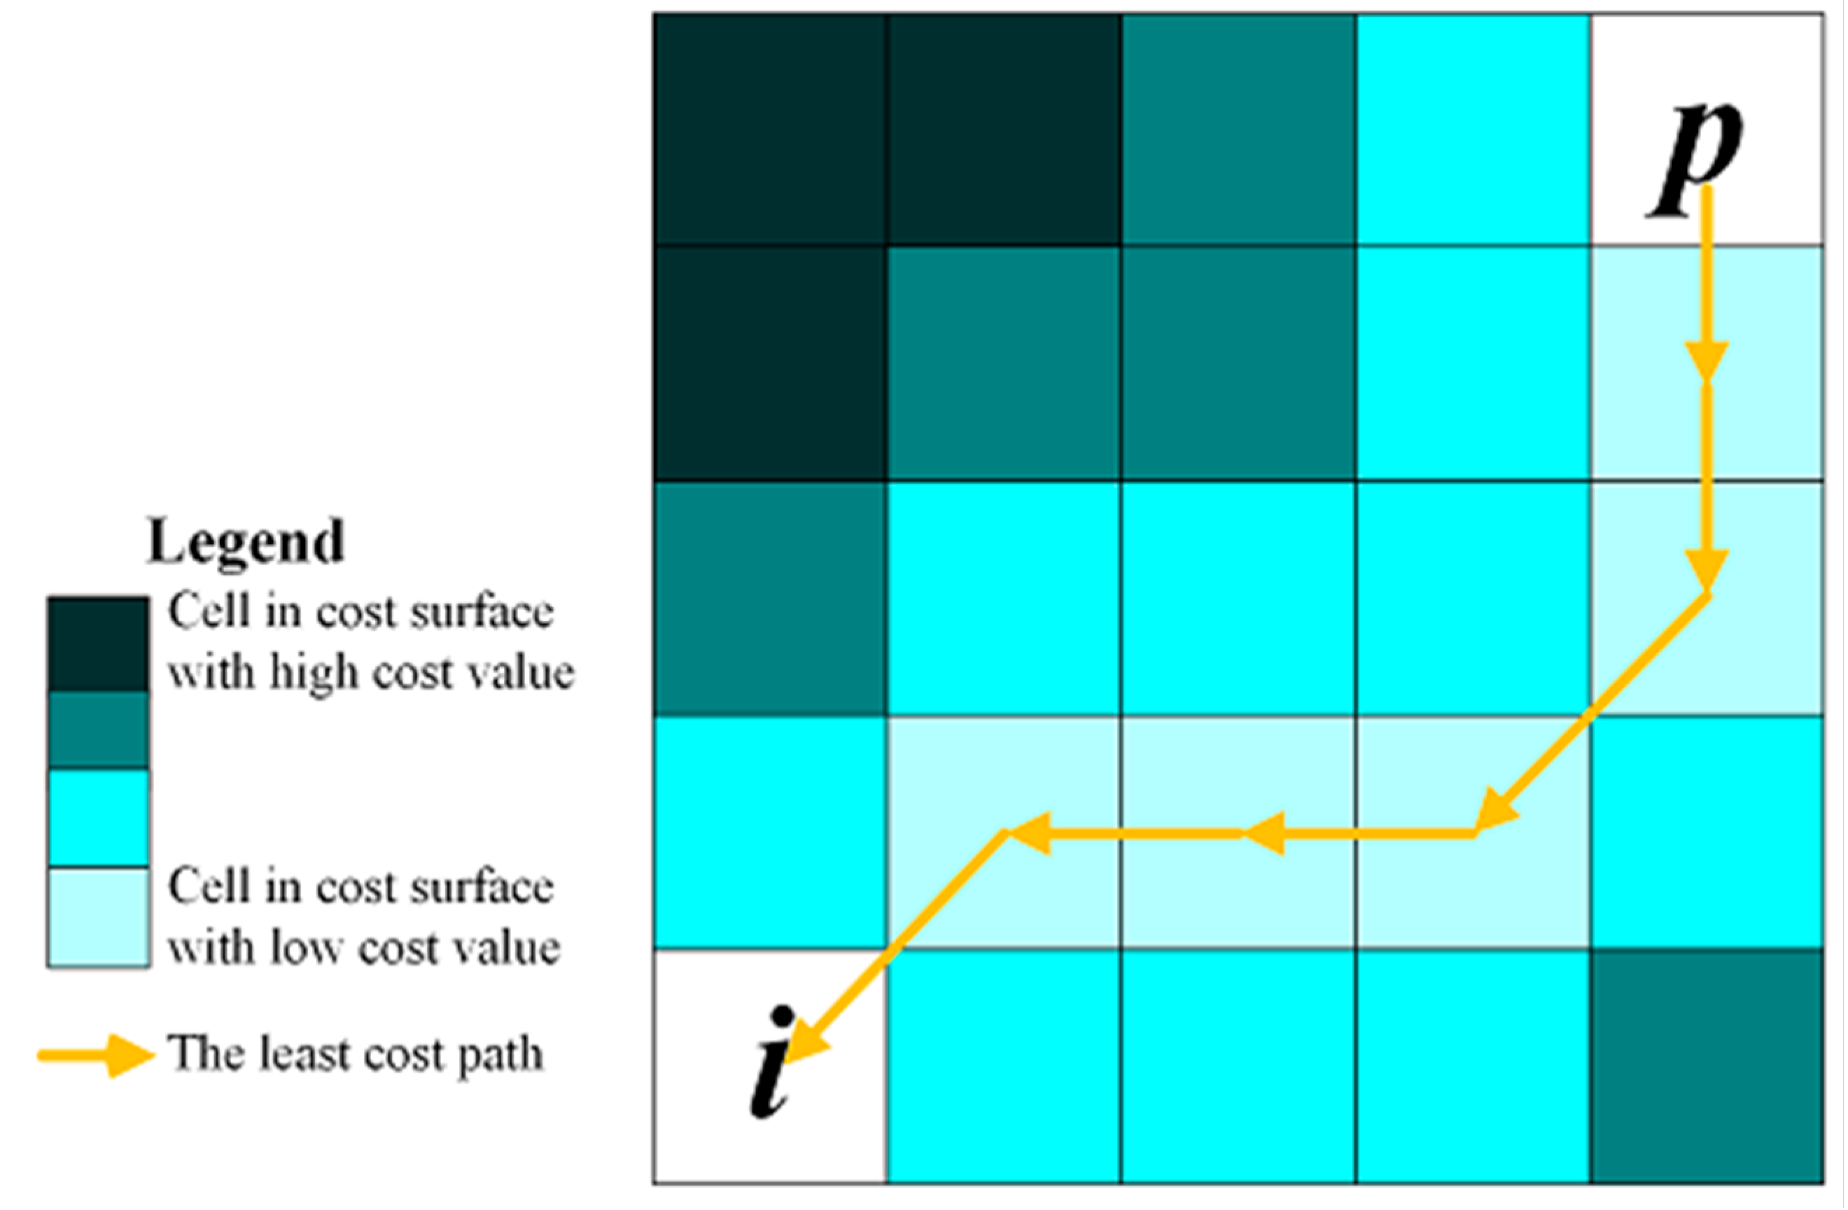
In line with the definition above, transportation field distance is calculated using the cost distance tool of ArcGIS [50]. The tool module serves to calculate the least accumulative cost distance for a given point p to the nearest source i over a cost surface, as shown in Figure 1. On a cost surface, cities are treated as field sources, and the value of a cell in the cost surface is the time required to pass through the cell. Transportation field distance, Dip, is the least accumulative time cost for a certain point (say, point p) on the cost surface to its nearest source (say, city i). It also means the shortest travel time from city i to point p.
3.3. Quantifying Radiation Sphere
Similarly, a transportation field strength model is proposed below according to the definition of field strength:
where Fip is city i’s transportation field strength at point p in the study area.
Fip = Zi/Dip
According to Equation (2), the Raster Calculator module of ArcGIS is used to generate the transport field strength map of each city in the whole study area, using the transportation field distance and source mass data of the corresponding city. Then, the Mosaic module of ArcGIS is employed to assess each point’s attribution in the study area in adhering to the maximum principle. The central matter is to determine to which radiation sphere every point belongs. Deviation range index is thus introduced to present a city’s ability to expand its radiation spheres as follows:
where DRIi is city i’s deviation of range index. SREi is city i’s radiation sphere. AAi is city i’s administrative area.
DRIi = SREi/AAi
Furthermore, the deviation range trend is employed to map out the UA transportation network’s spatial evolution.
4. Data
4.1. A Typical Case in China
The CCUA encompasses nineteen cities and has been one of China’s four major UAs. Located in the southwest of the country, it is an important UA in the Yangtze River Economic Belt and a crucial platform for the National Western Development Strategy. The CCUA has a land area of 185,000 square kilometers and 95 million permanent residents in 2018, accounting for 6.8 percent of the national population. The CCUA’s GDP reached CNY 5.7 trillion, occupying 6.4 percent of the national one.
In recent years, the CCUA invested numerous resources to resolve internal and external transportation bottlenecks through transportation infrastructure development. By 2020, an intercity railway network, including twenty-three railways, five skeleton railways, and eighteen auxiliary railways, arose. The intercity railway network is characterized by two main hubs, namely Chengdu and Chongqing, and the total mileage is 1008 km. The CCUA has twelve expressway passages between two core cities (Chengdu and Chongqing), nine national roads of Grade II and above, and ten provincial roads of Grade III and above in adjacent areas. The CCUA’s transportation network has been experiencing rapid development, which poses both Chengdu and Chongqing to realize traffic advantages. The increasing role of these two major cities ascends the radiation effect of the UA transportation network straightforwardly. Therefore, the CCUA is considered typical for examination in the study, and it can be used to verify the transportation field strength model and the radiation effect.
4.2. Data Collection
The data to measure the development of a city’s transportation system were collected from China City Statistical Yearbook, Sichuan Statistical Yearbook, and Chongqing Statistical Yearbook for three milestone years (2002, 2010, and 2018). By referring to those indicators identified in previous studies and the principles of systematicness, comparability, comprehensiveness, and operability, fifteen indicators were selected under three headings, namely infrastructure condition, passenger transport, and freight transport, as shown in Table 1 and Appendix A Table A1. It should be noted that CCUA cities’ population densities varied distinctively from one to another. Therefore, two indexes of road network densities calculated by population and administrative area were adopted, respectively, to control the impacts. Moreover, the index of turnover and traffic density were considered. The index of turnover considers both the volume of transportation objects (passenger and freight) and transportation distance to reflect transportation efficiency comprehensively. Traffic density is the average turnover of passenger or freight per kilometer, reflecting capacity utilization and the transport line’s intensity.
To eliminate the influence of quantities and dimensions, all original data were converted into standardized values using the following equation.
where Yij and Xij are standardized values and original data for indicator j of city i, respectively. n is the total number of cities in the UA.
In the principal component analysis, the Bartlett ball test demonstrates that the Chi-square approximation is 1699, the free degree is 105, the significance level is 0.000, less than 0.001, and the KMO coefficient is 0.623, greater than 0.6. Therefore, the data collected in the study were found suitable for principal component analysis. The principal component factors were extracted as eigenvalues are greater than 1, and the variance contribution rate of the first three principal components are 47.551%, 17.506%, and 12.596%, respectively. The cumulative contribution rates reached 77.653%.
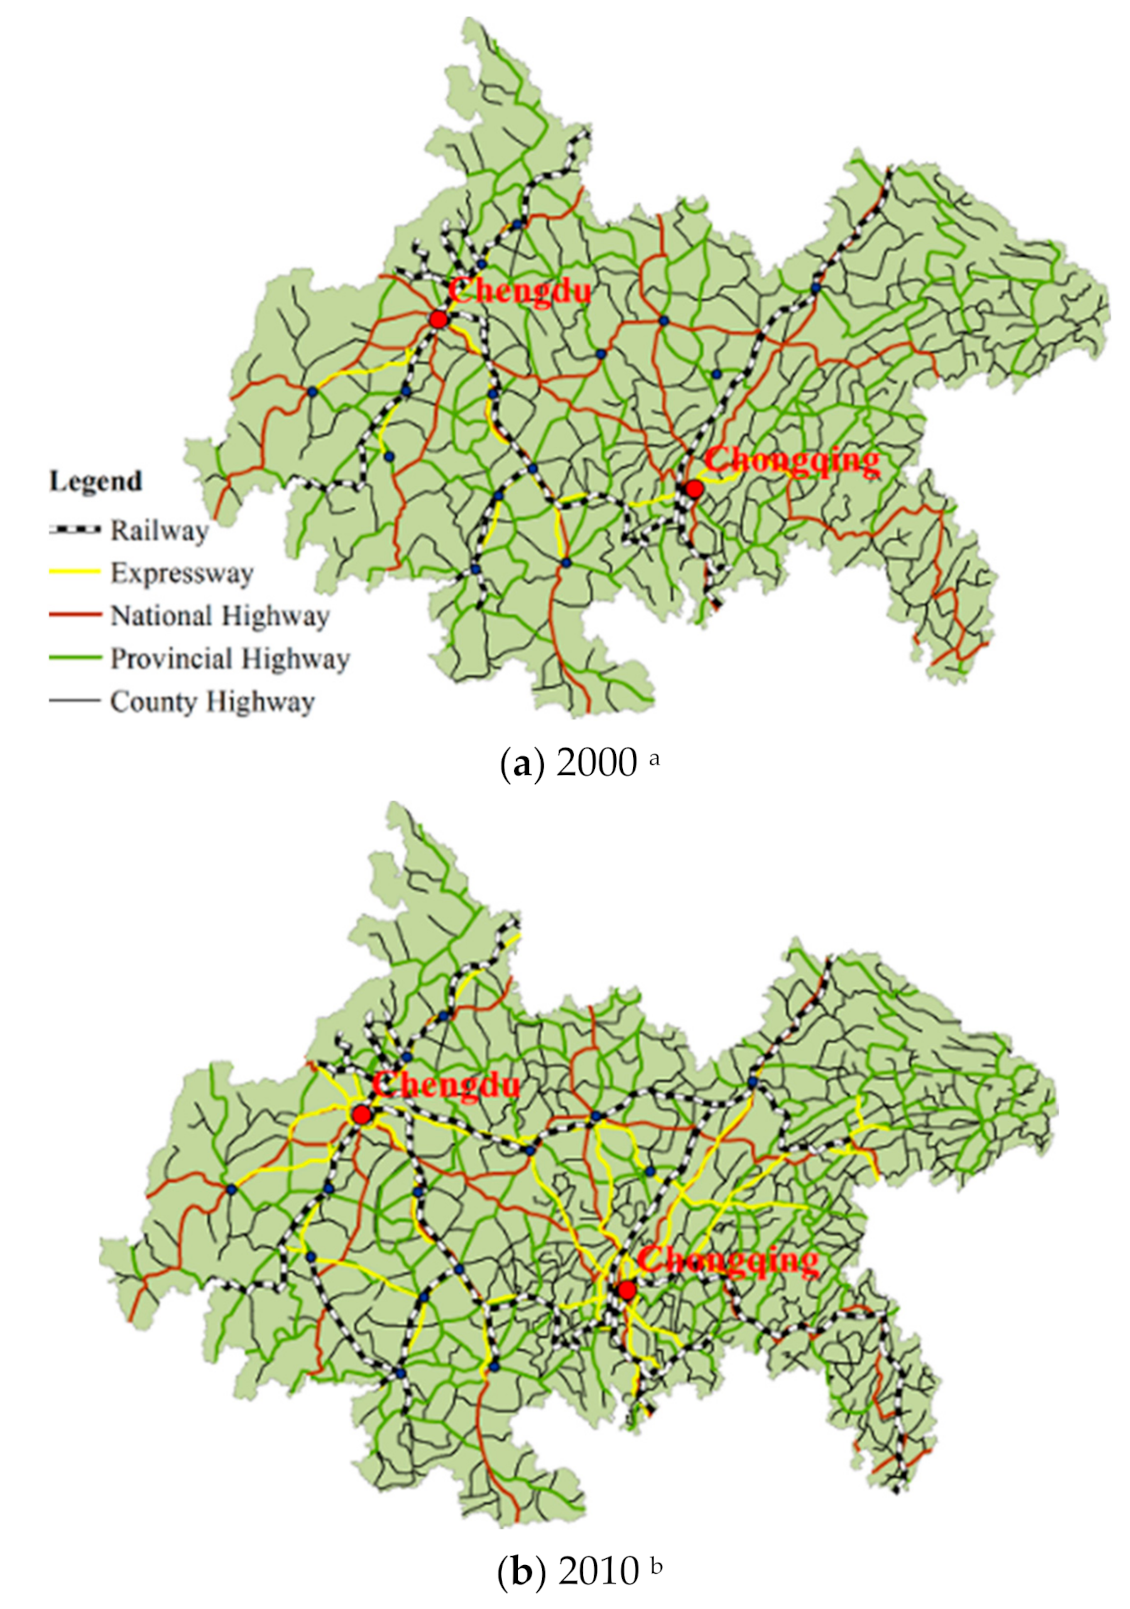
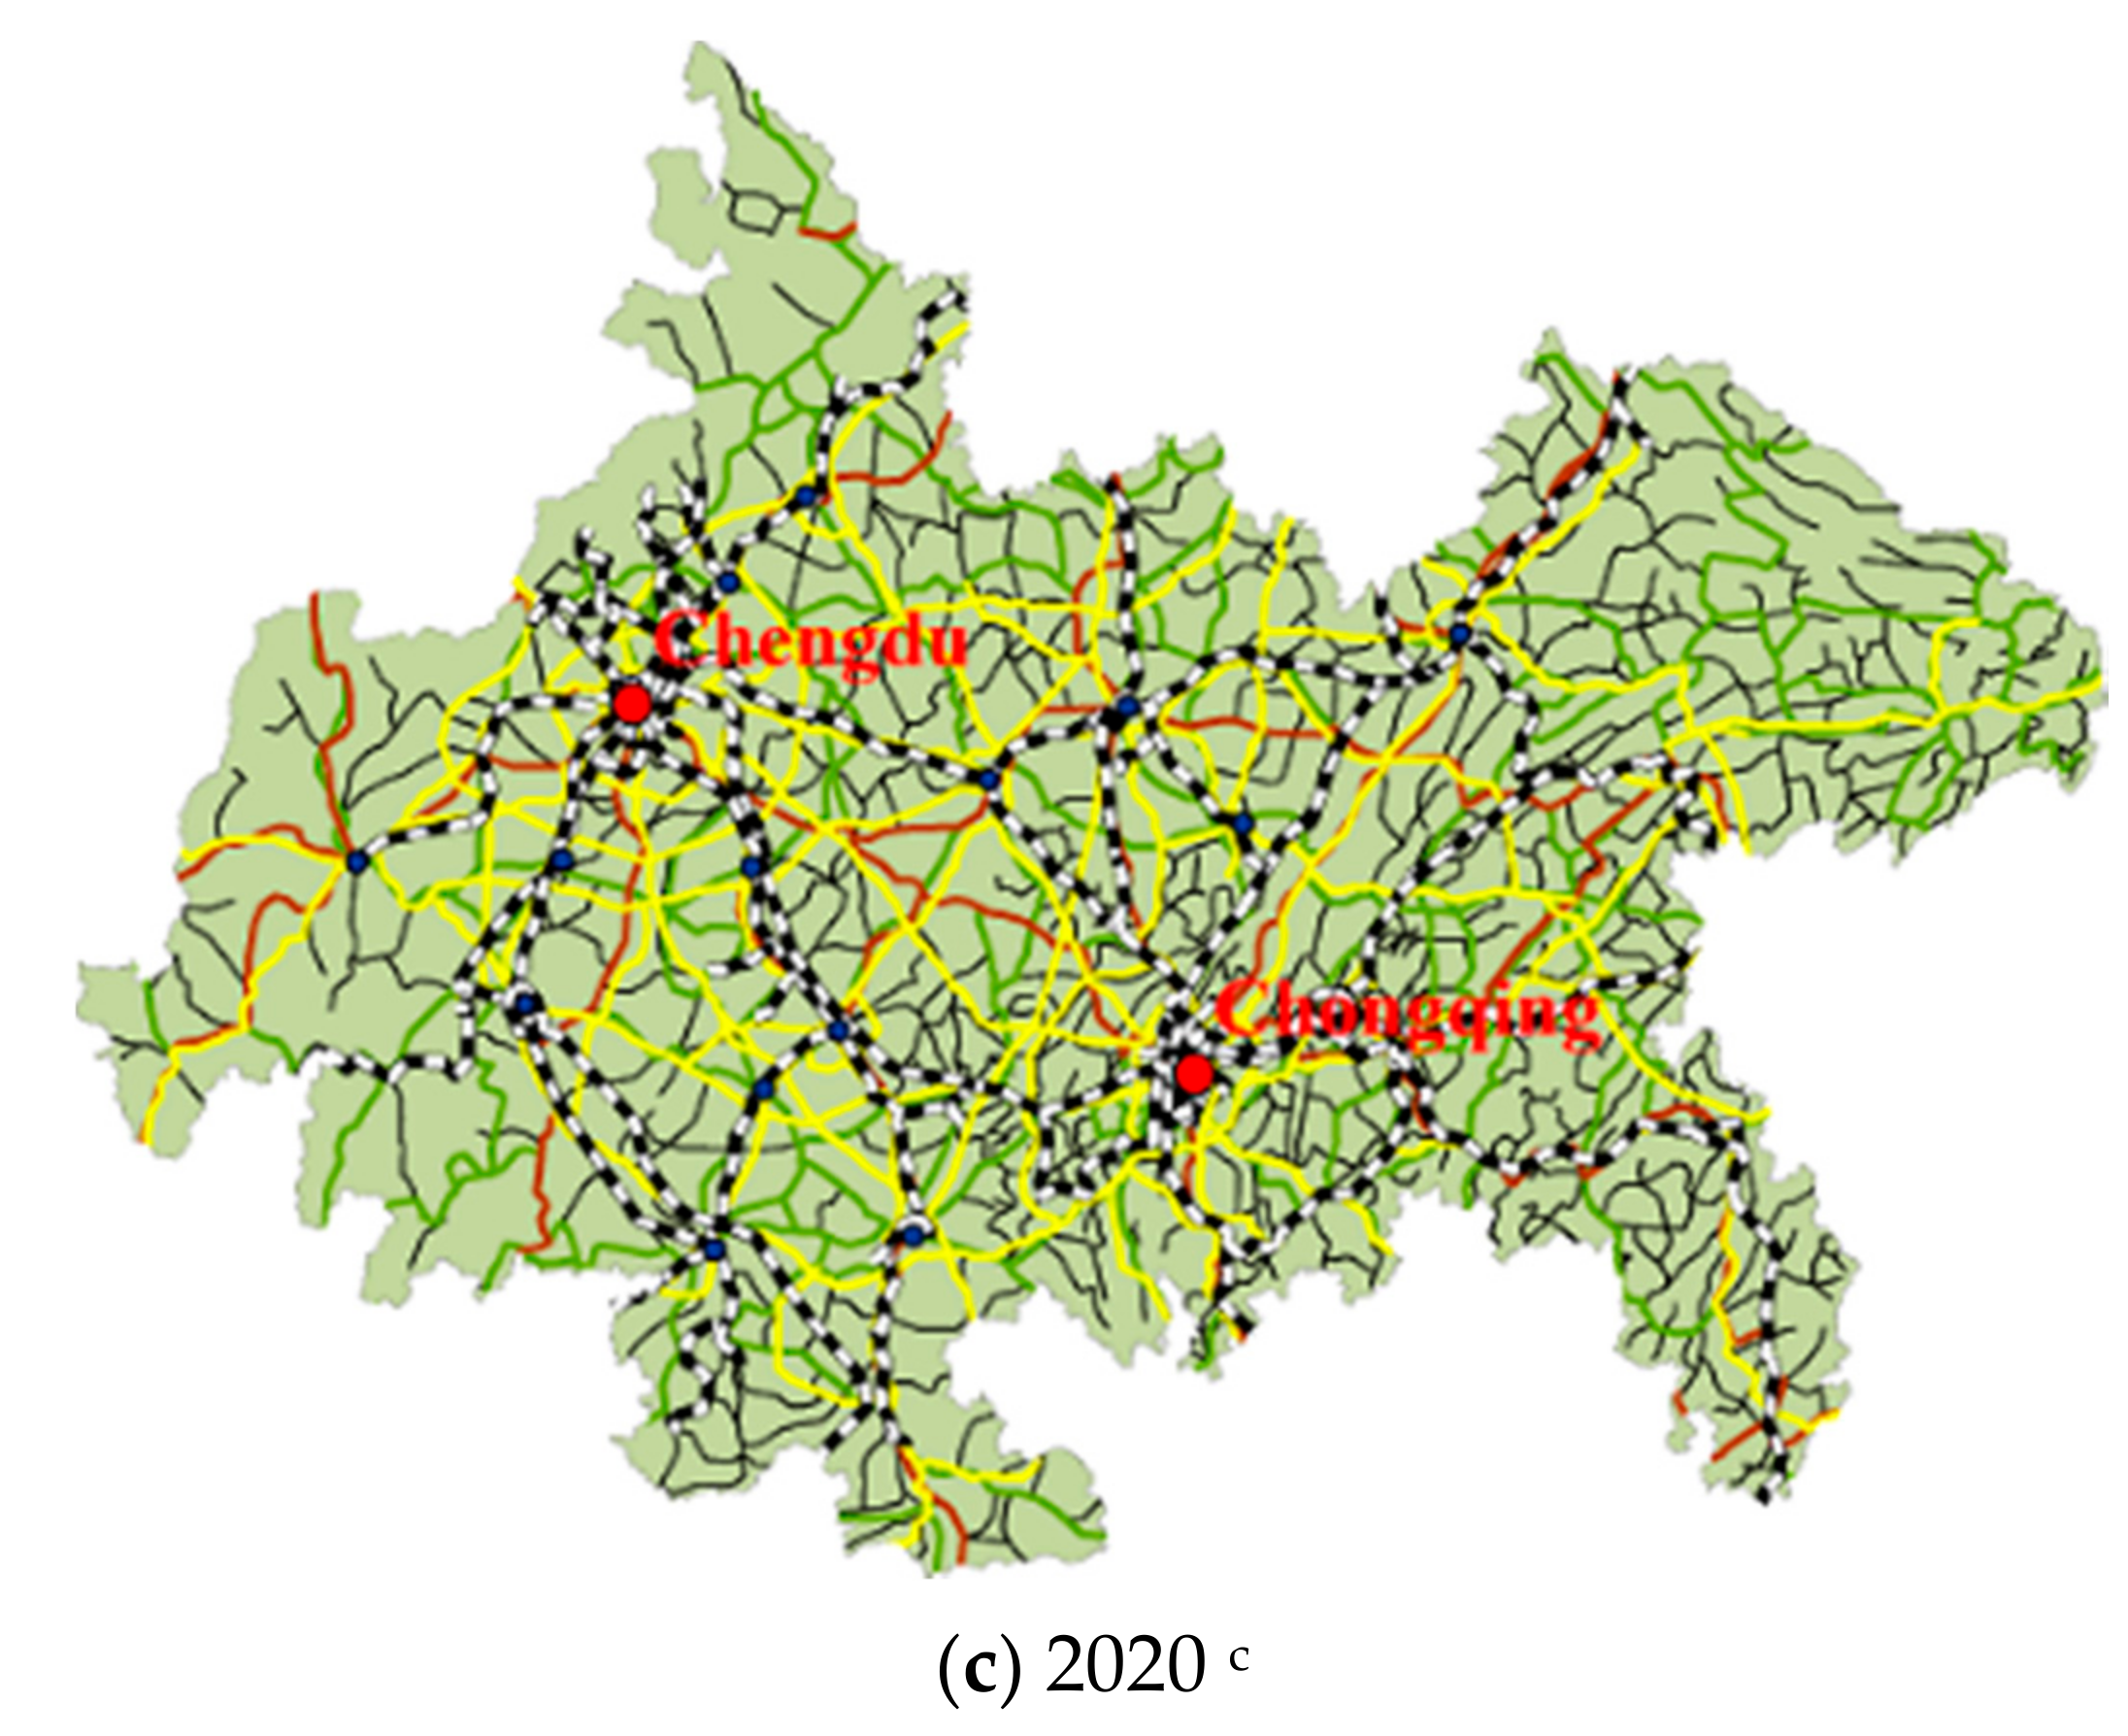
Travel time was calculated based on traffic route graphic data extracted from the Atlas of Traffic Mileage China (2000), the Transport Atlas of China (2010), and the Transport Atlas of China (2020). The above traffic route data were rasterized using the 1:250,000 national basic geographic data (2019 edition). The selected size of analysis is 1 km × 1 km of the original vector raster map, and the entire research area is divided into 246,253 homogeneous cells. As Figure 2 shows, the CCUA’s transportation network coverage density improved significantly, and Chengdu and Chongqing played increasingly important roles as transportation hubs.
Since the measurement is time distance, the driving speeds of different traffic routes each year deserve consideration [50]. When a low-grade highway intersects a high-grade highway, the cell in the cost surface corresponding to the intersection point is given the larger driving speed value. The average driving speeds of different traffic routes each year are set, as shown in Table 2. For example, the highway driving speed is 100 km/h for 2020, which means the time to pass through each cell is 0.01 h. Besides, the walking speed was set at 10 km/h, i.e., the time to pass through each cell without a traffic route is 0.1 h.
5. Results of the Data Analysis
5.1. The Mass of Transportation Field Source
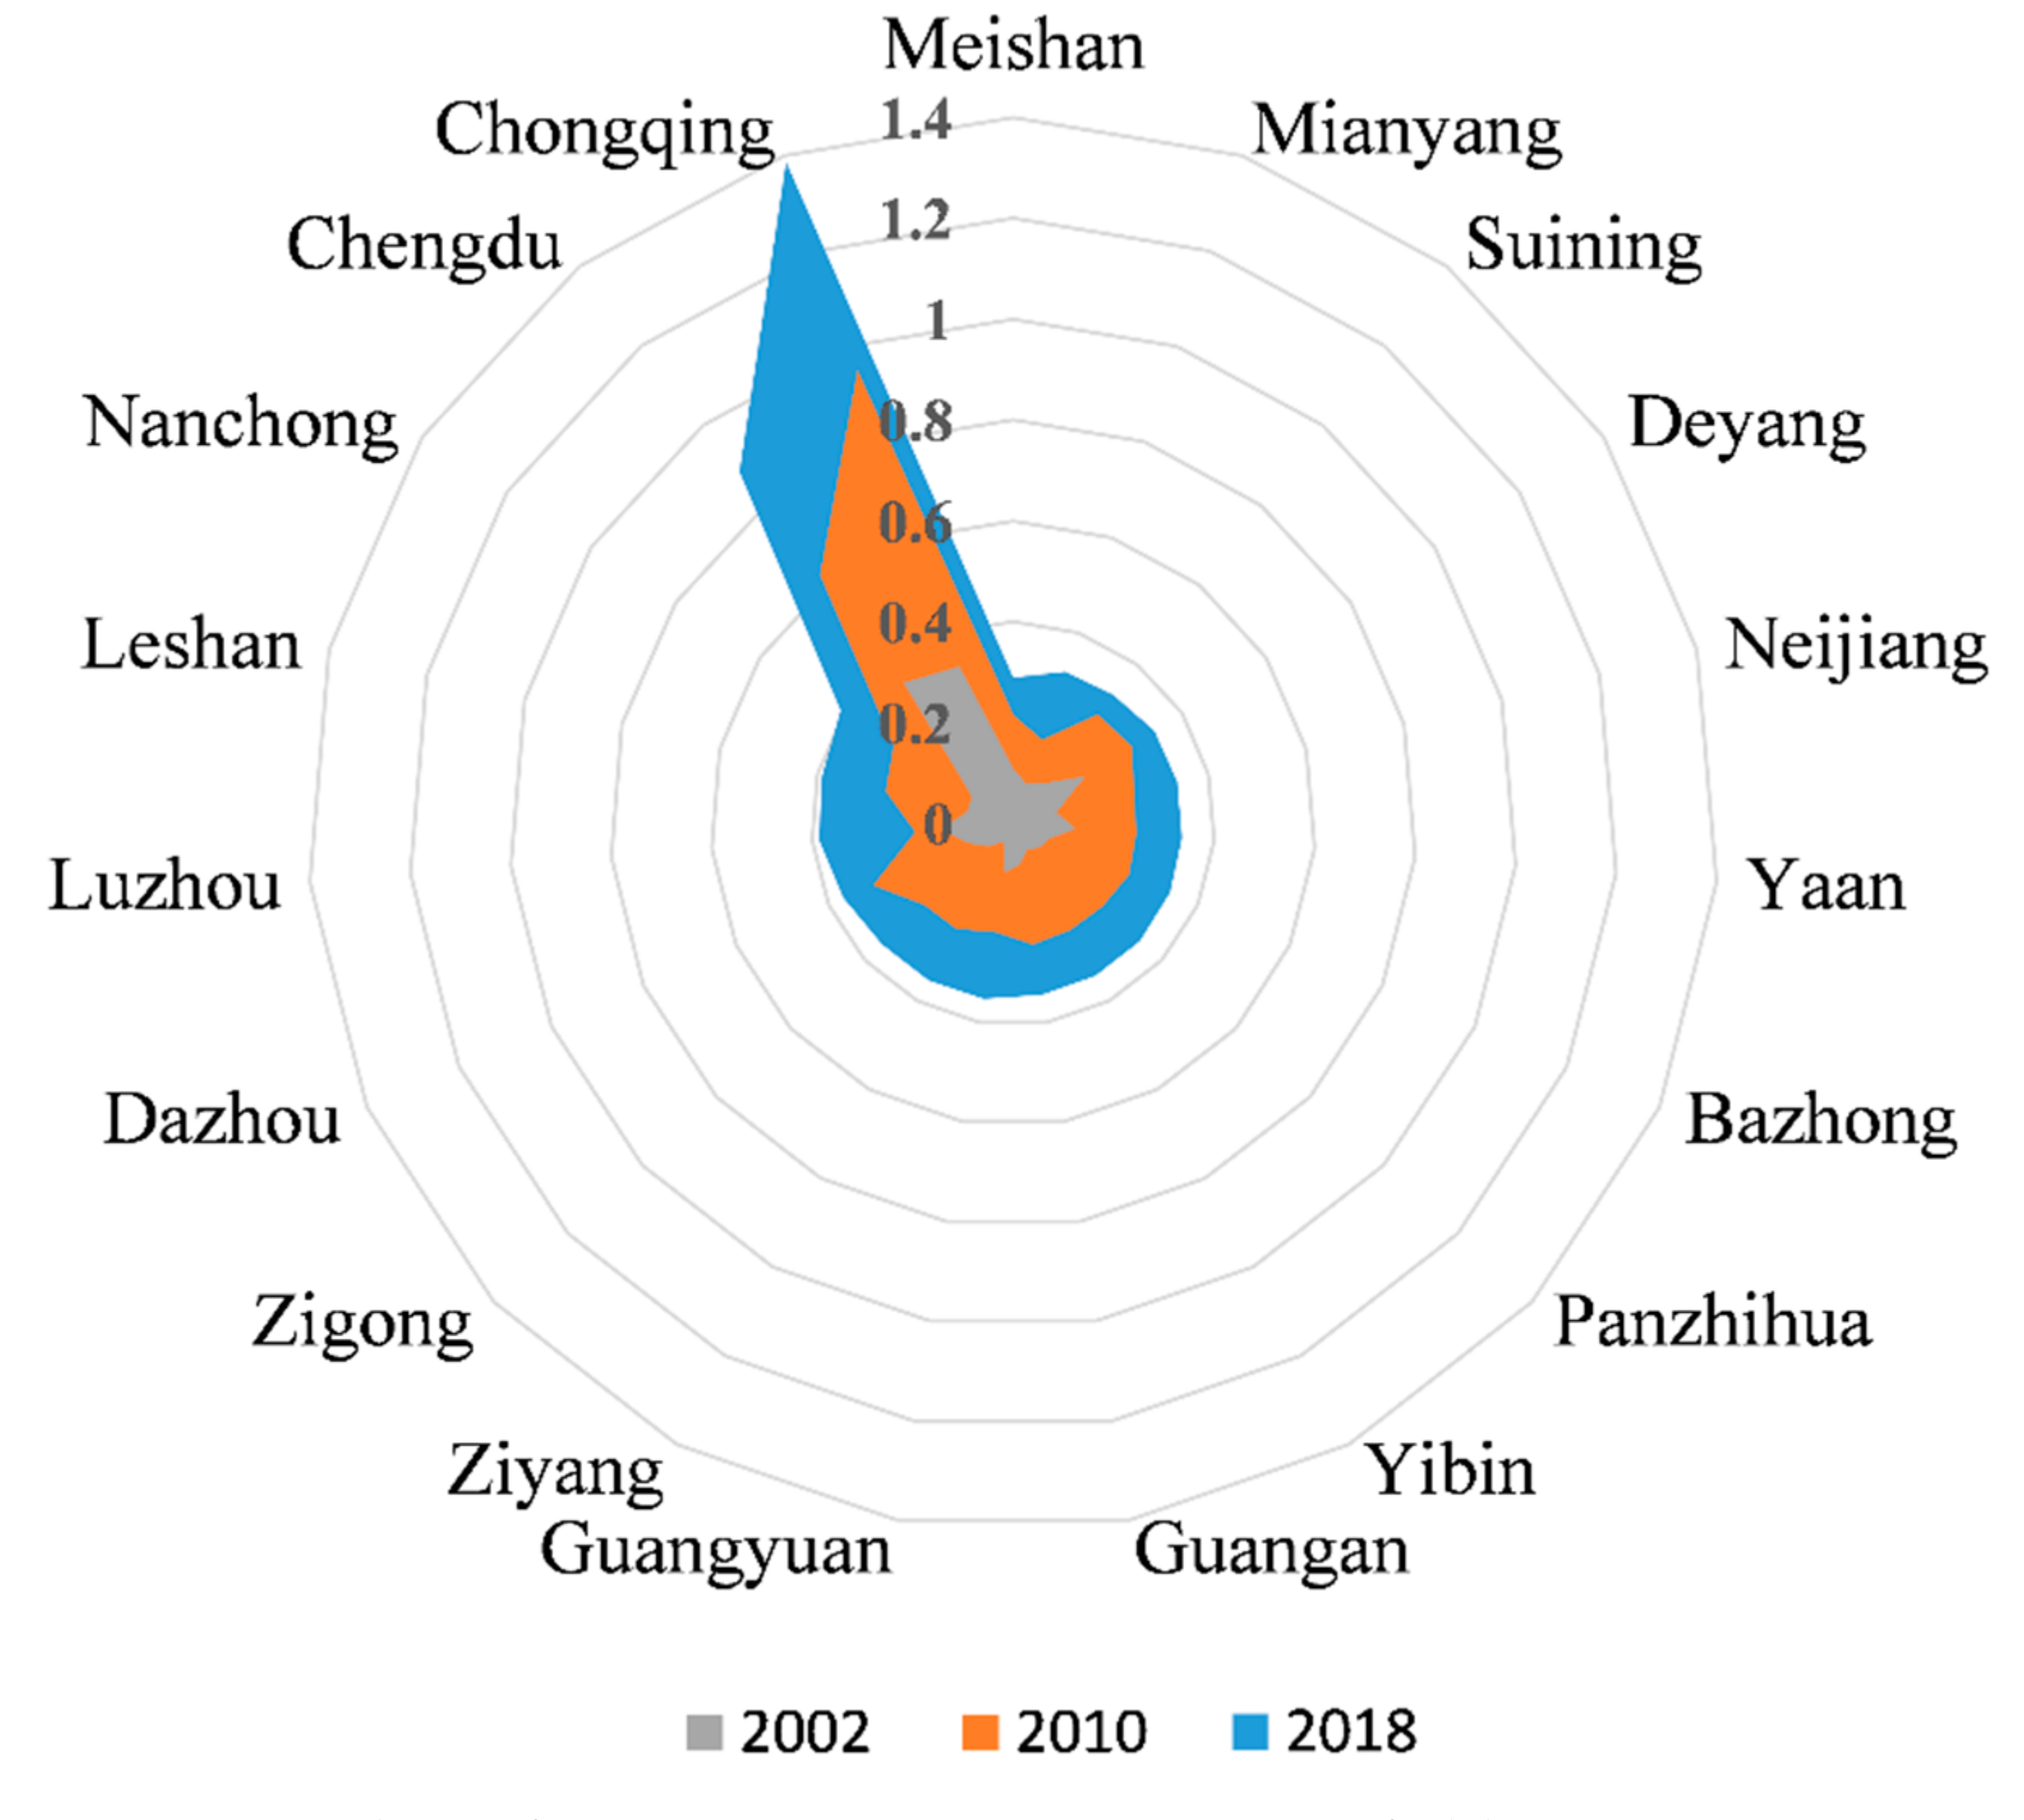
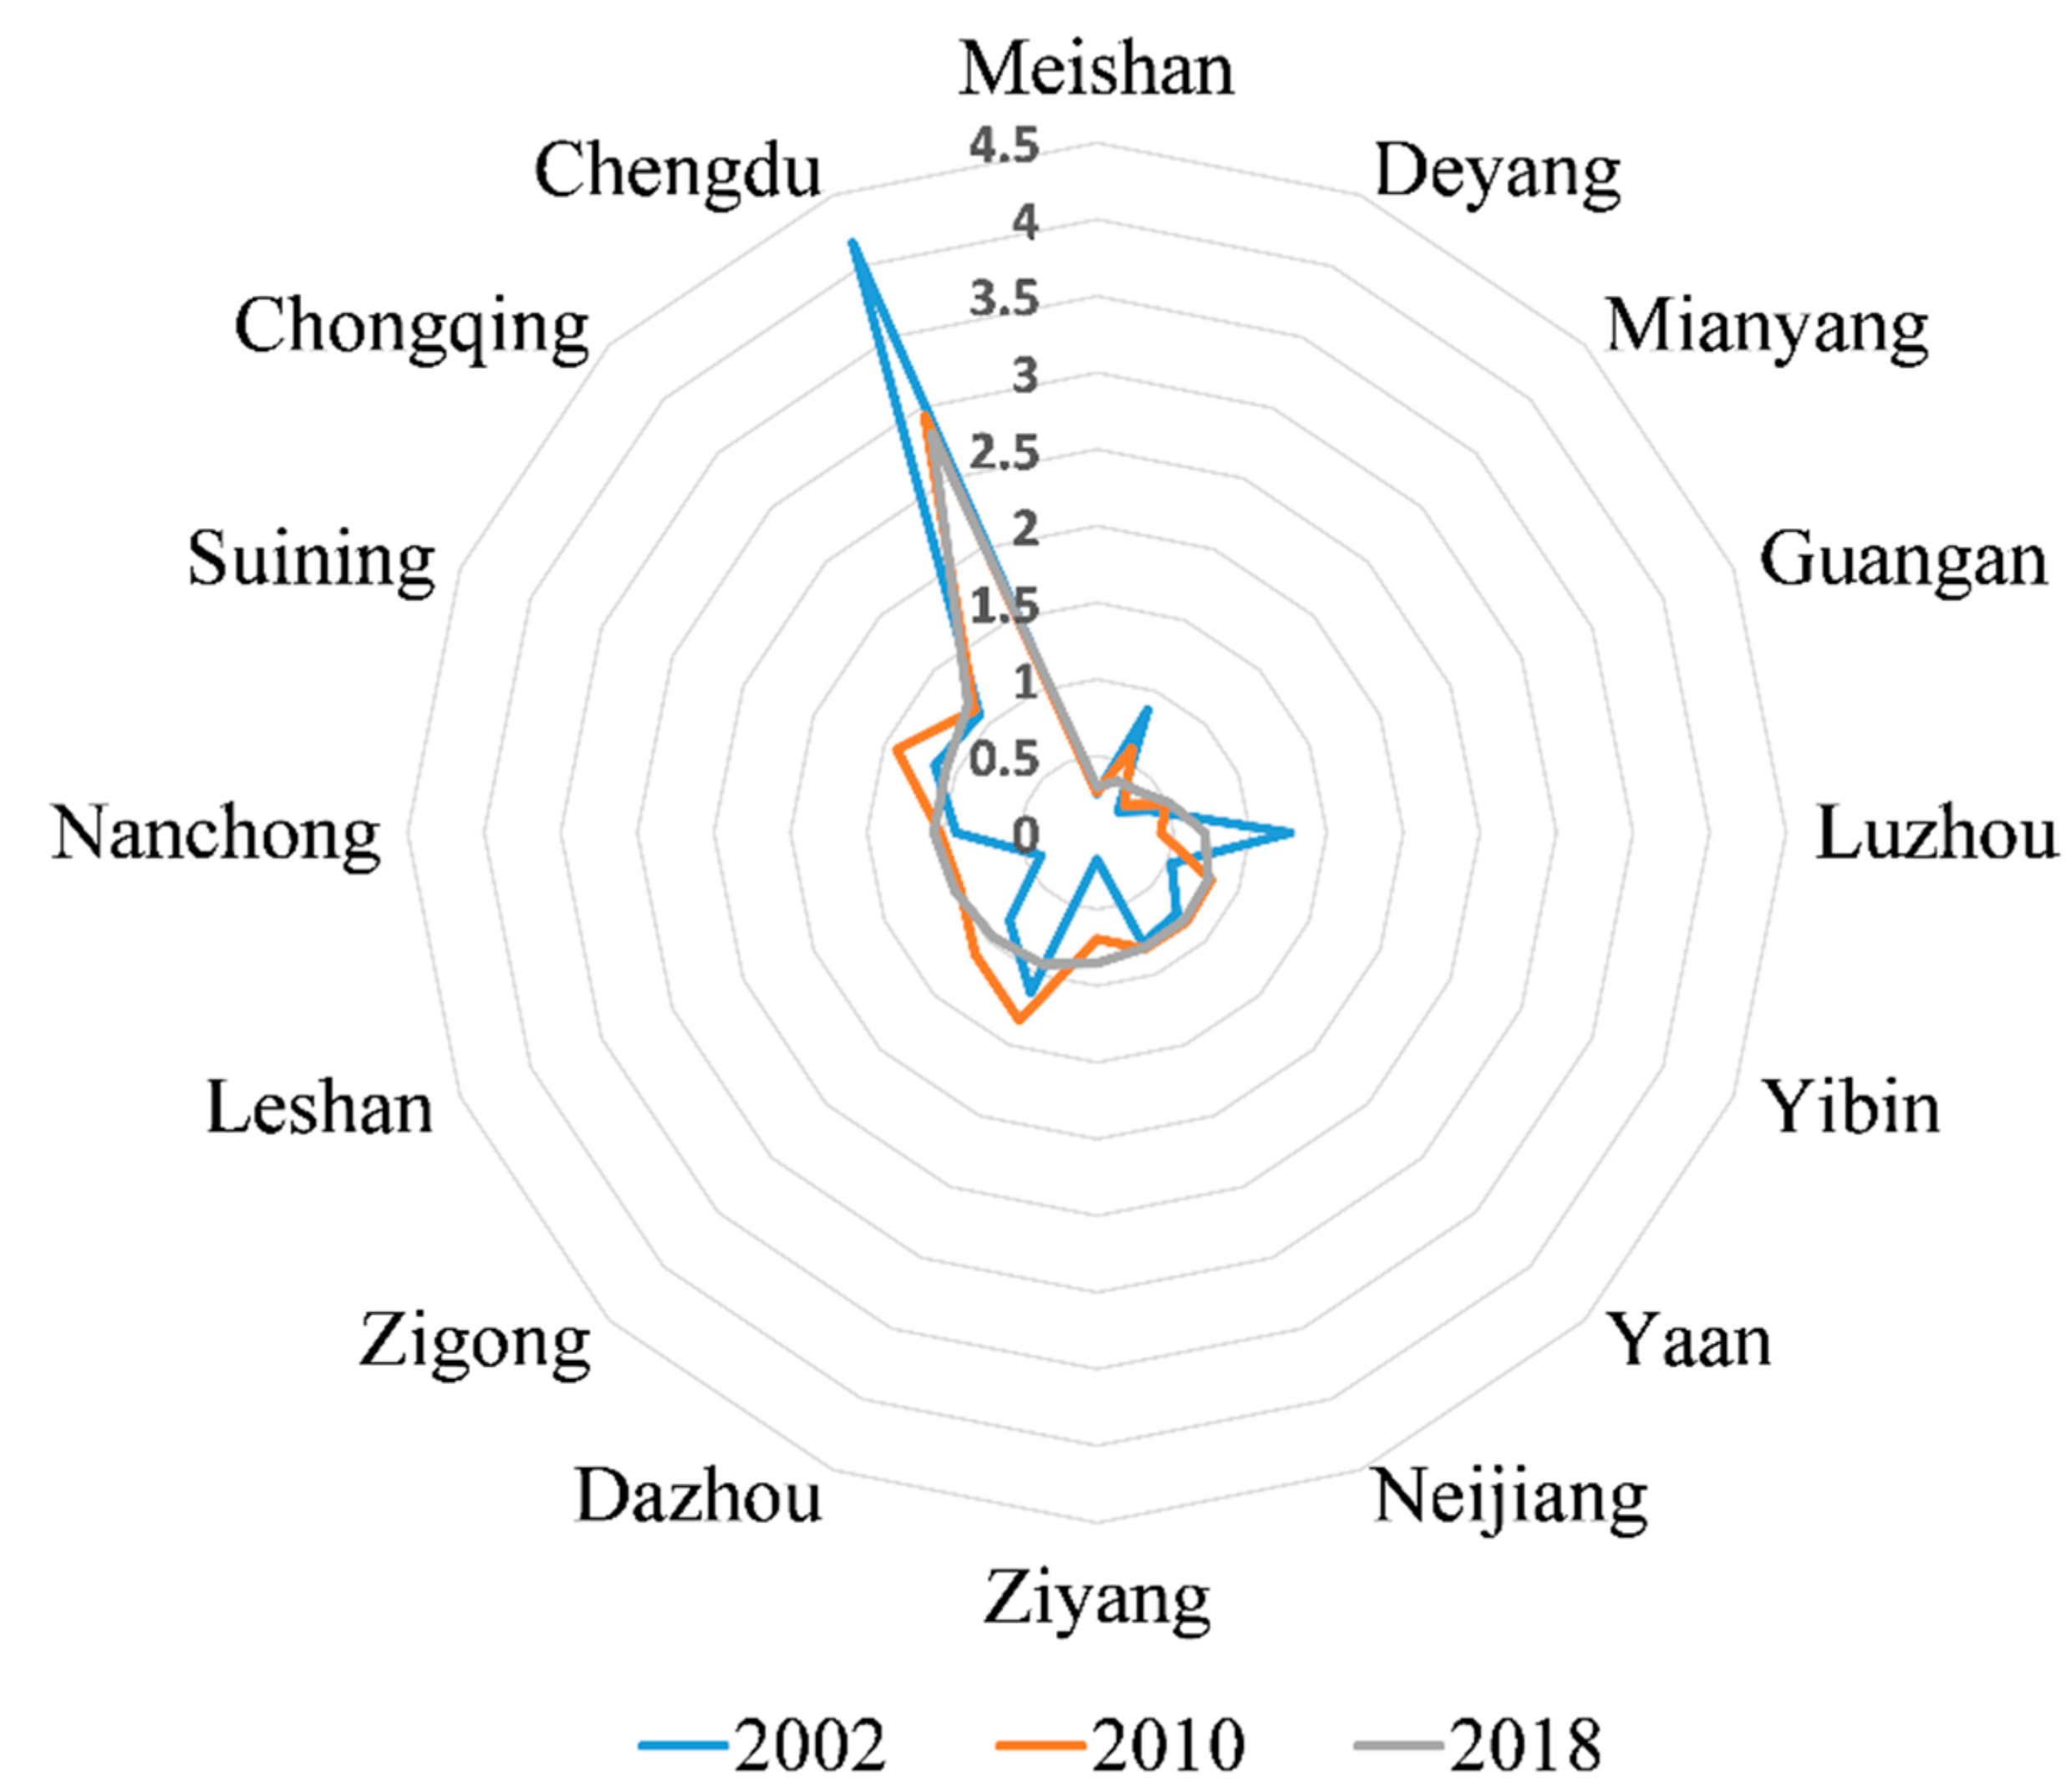
The derived indexes for CCUA cities’ transportation field mass are shown in Figure 3. It can be found that, in 2002, Chengdu had the top transportation field mass (0.3536), 8.58 times that of the lowest city Ziyang (0.0412). In 2010, Chongqing (0.9495) surpassed Chengdu to become the city with the highest value, 5.4 times that of Mianyang (0.1758). In 2018, Chongqing (1.3874) still ranked top one, 4.79 times that of the lowest city Meishan (0.2896).
5.2. Field Distance
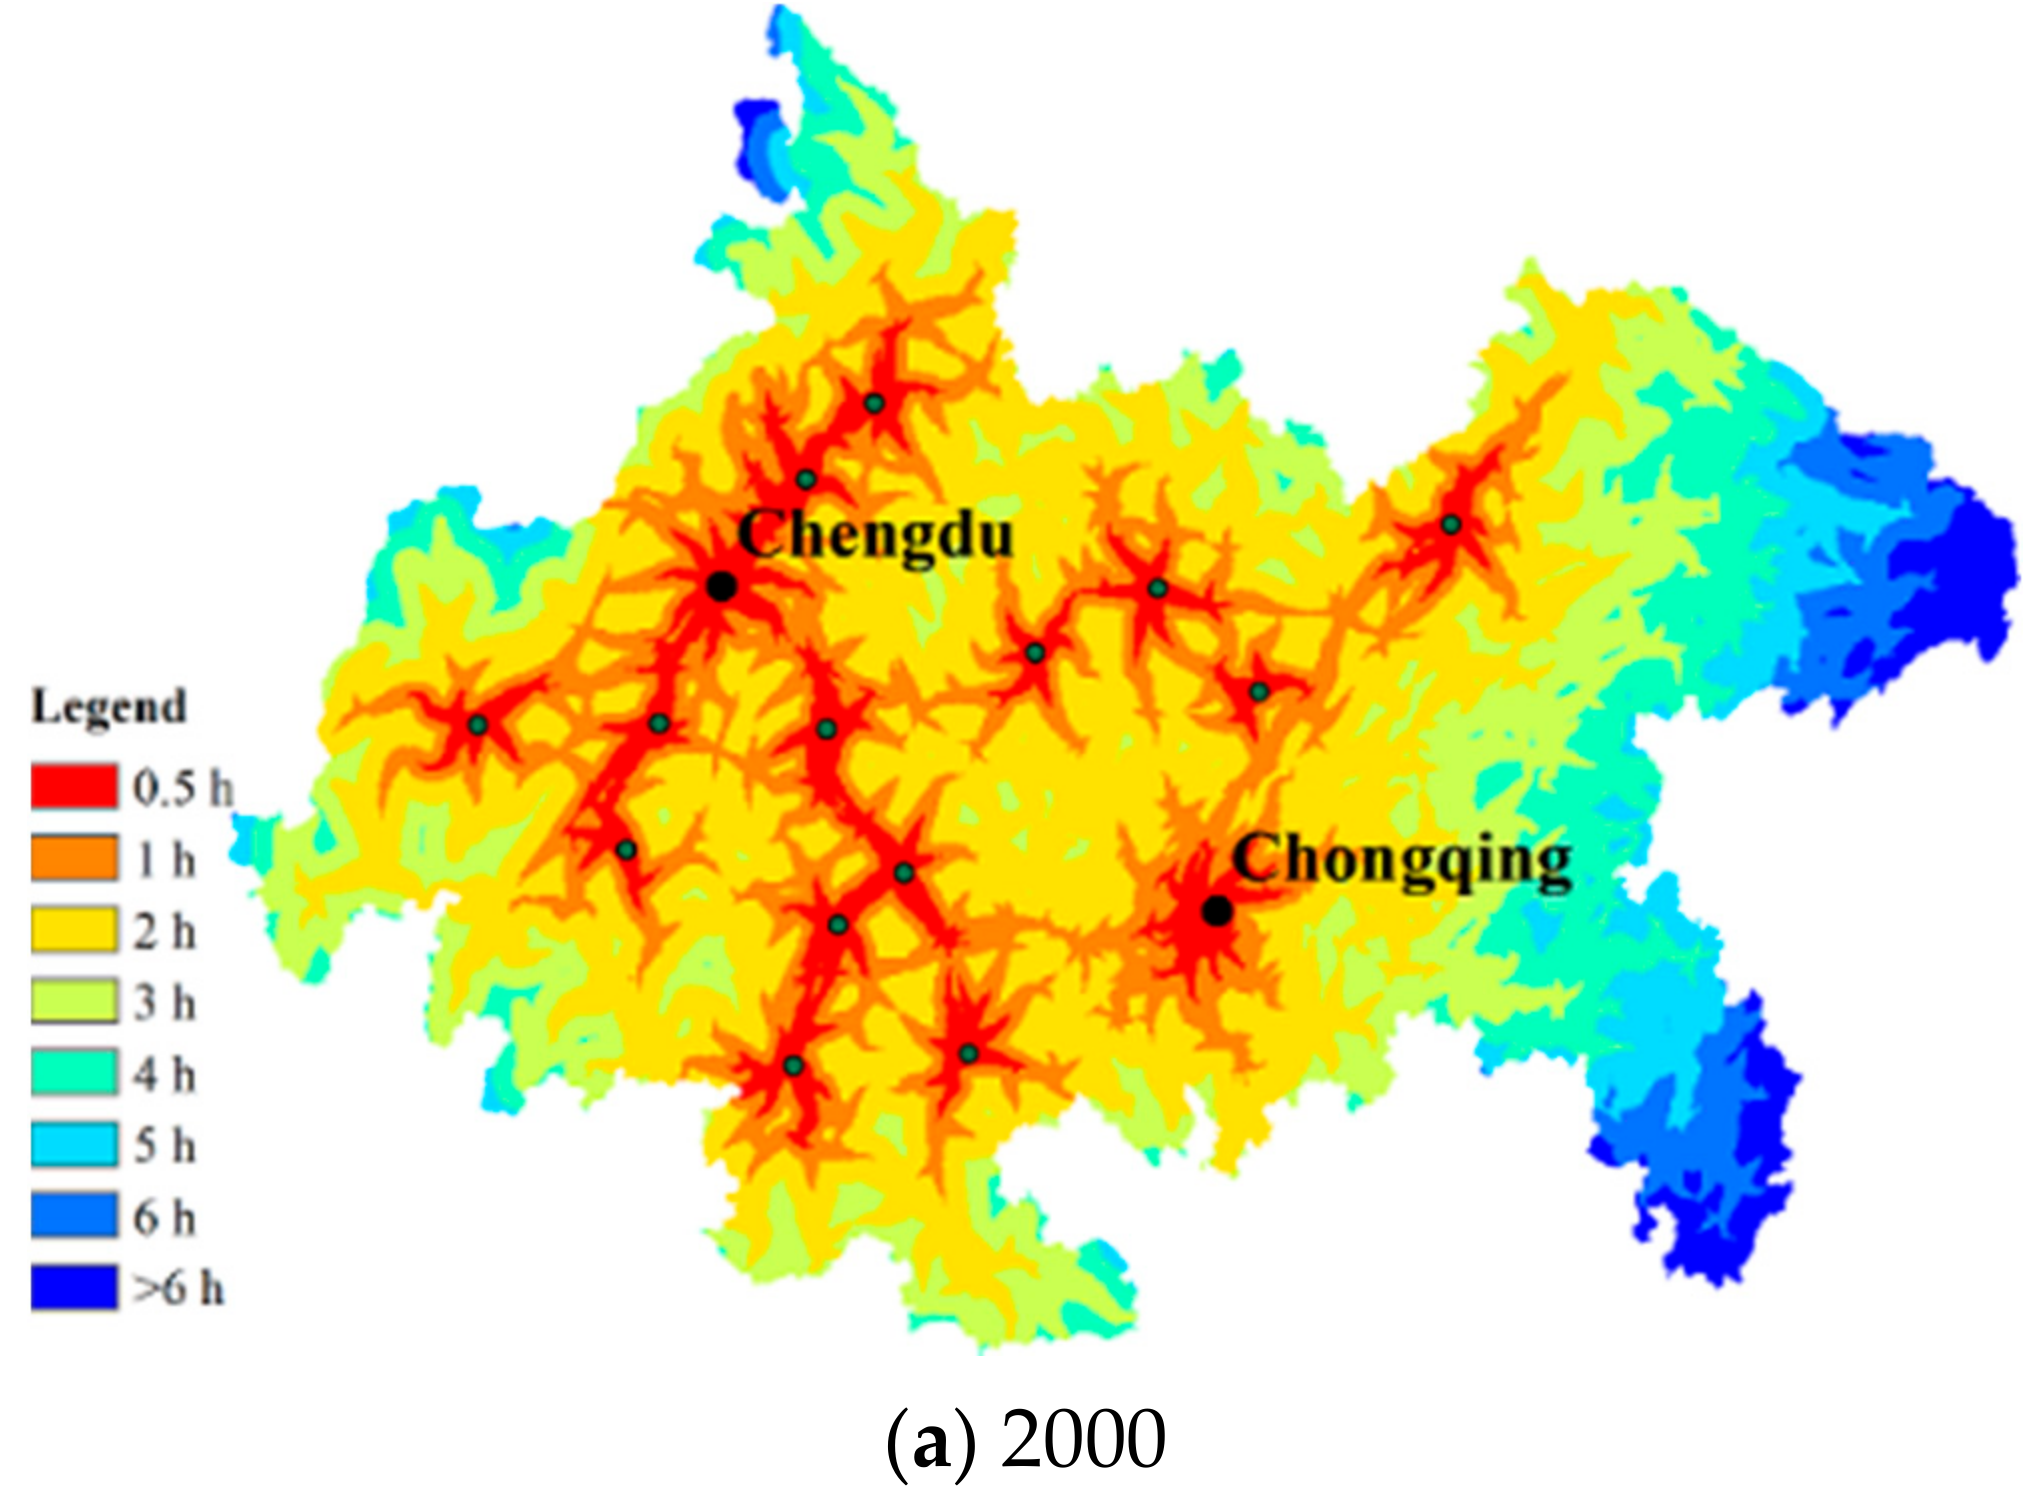
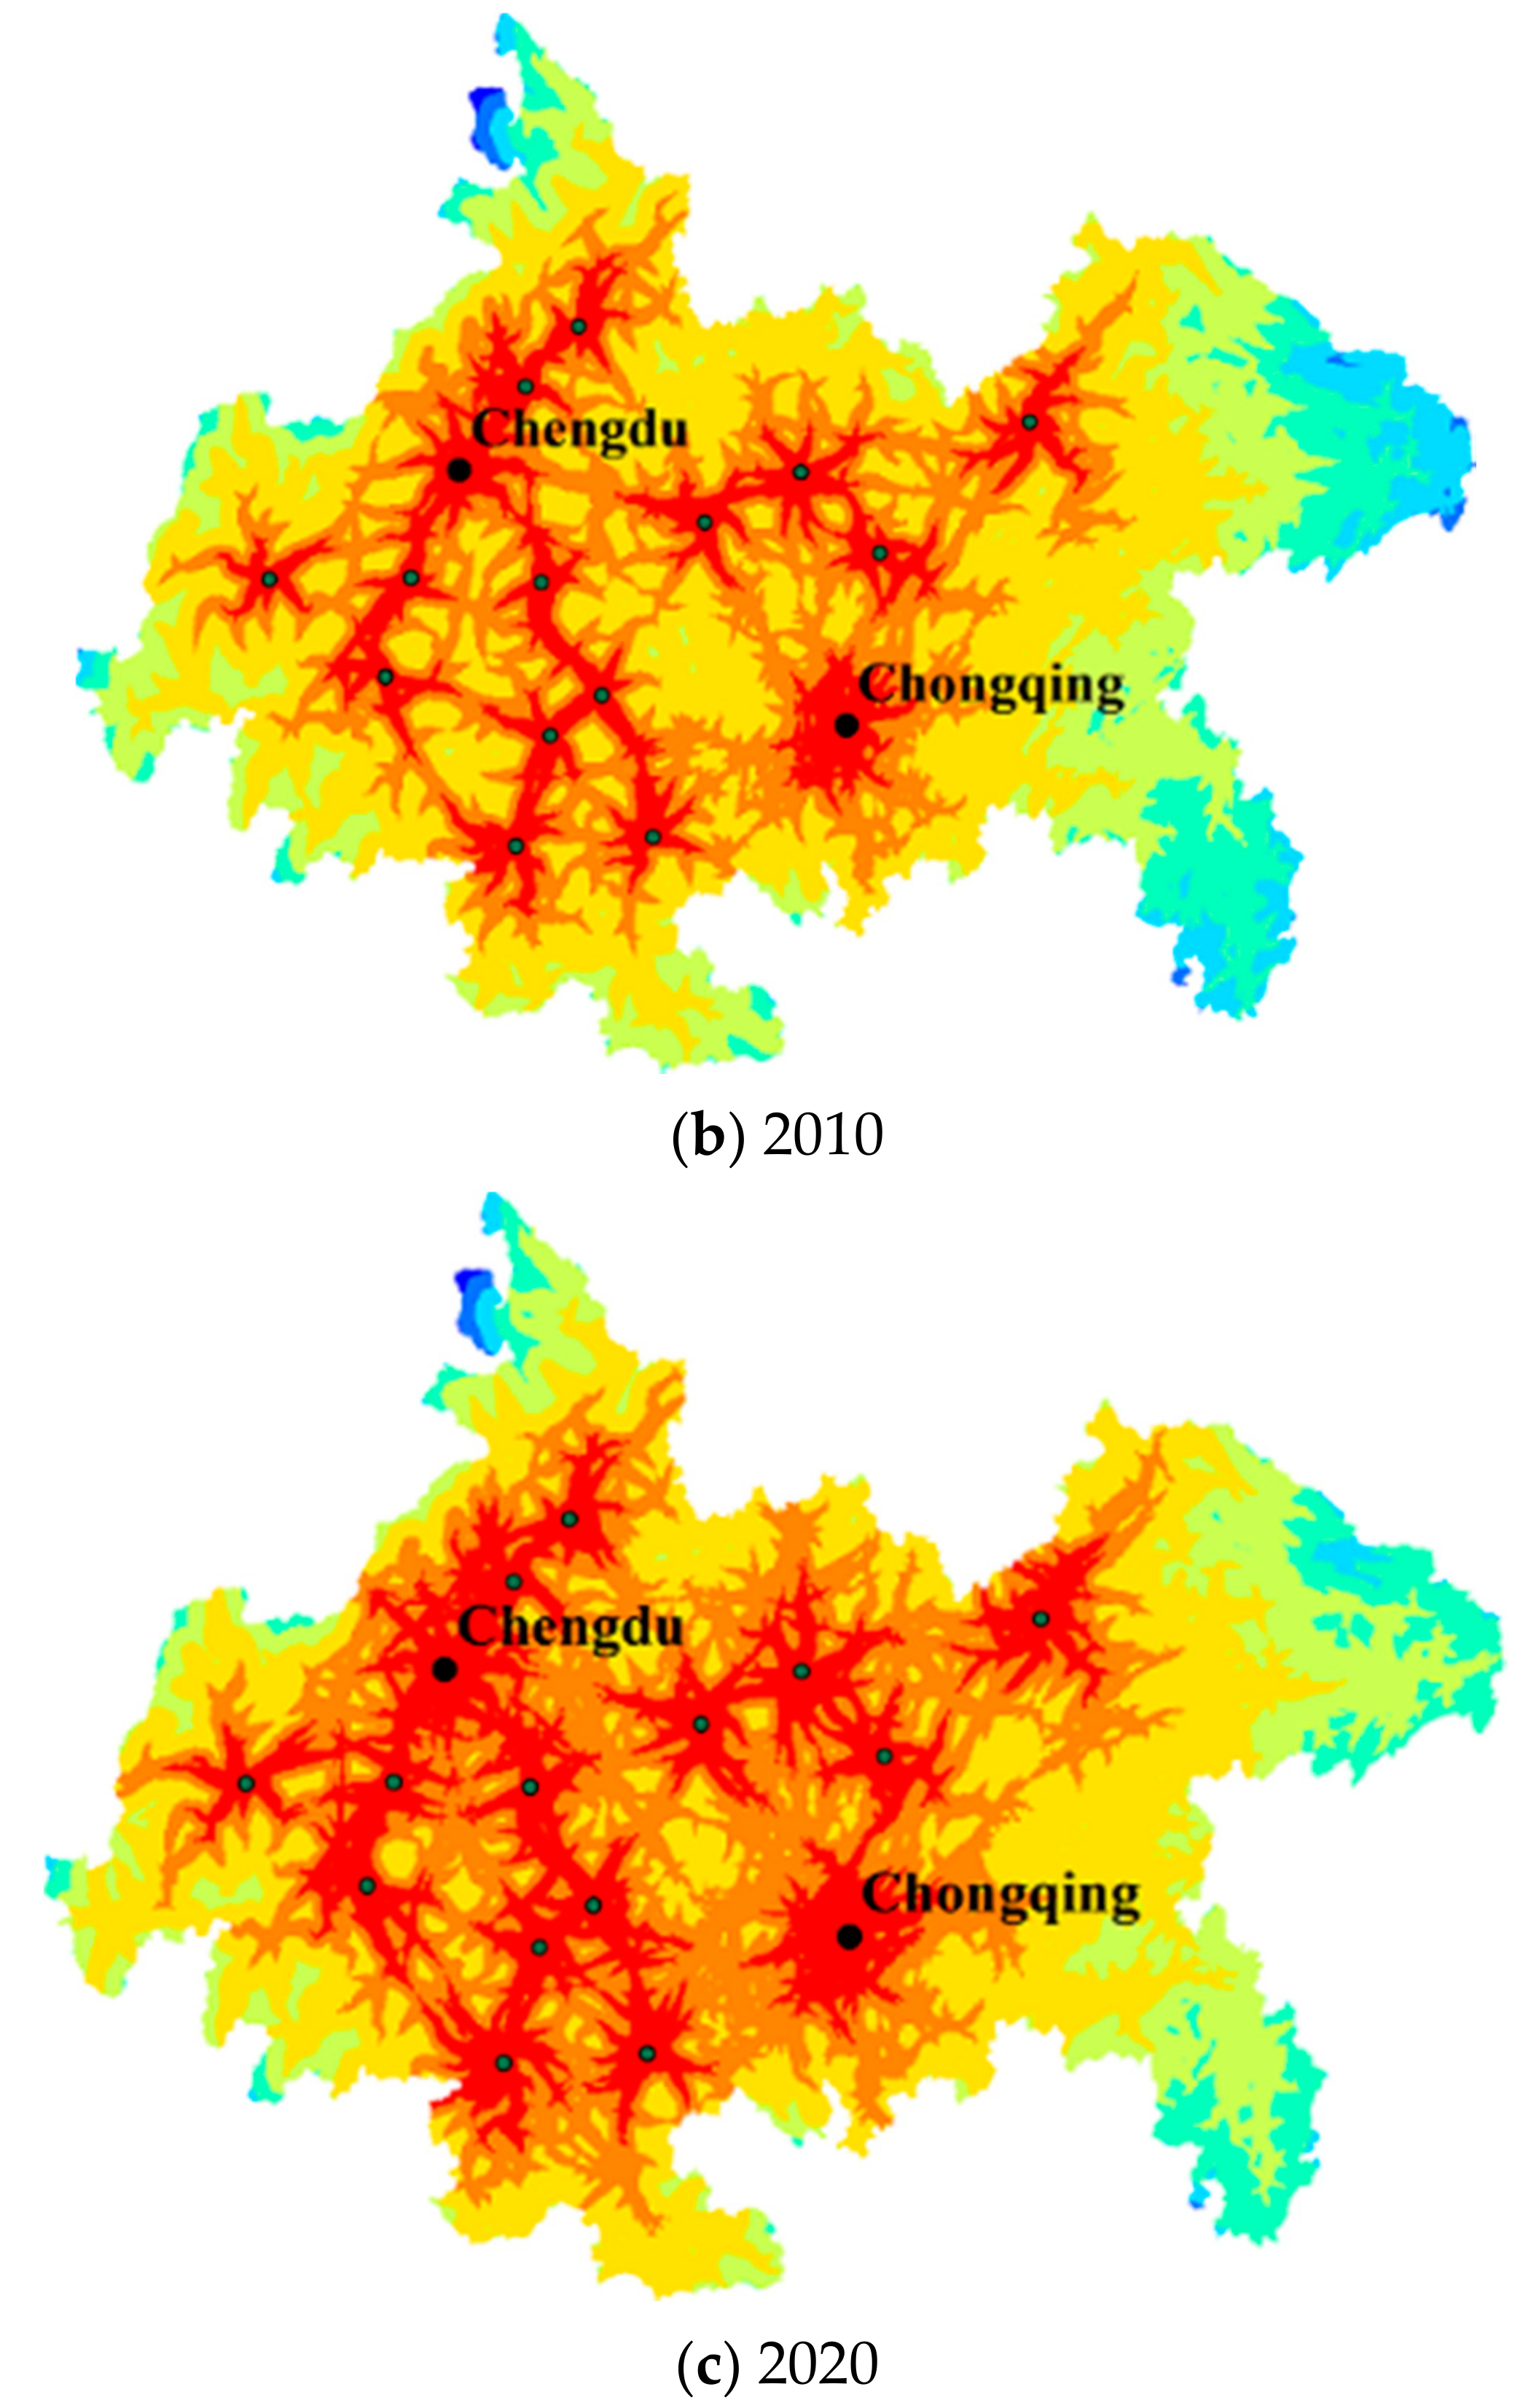
The traffic isochronous rings mirror the close spatial relationships between cities and the surrounding areas [50]. By treating the nineteen cities as original points, we used the cost distance module to extract the spatial diffusion pattern of accessibility for all CCUA cities. Eight isochronous rings of 0.5, 1, 2, 3, 4, 5, and 6 h, and >6 h, are framed in Figure 4. The CCUA accessibility presents a multicentric circular and dendritic structure, according to the CCUA’s existing traffic routes.
The land areas of every traffic isochronous ring are measured as listed in Table 3. It is found that 0.5- and 1-h isochronous rings developed most rapidly. The land area for the 1-h isochronous ring was 25.30% in 2000, and it increased to 49.58% by 2020. The proportion of the 6-h isochronous ring area in 2020 is 99.95%, suggesting that the whole region is shaded.
5.3. Radiation Sphere
(1) Overall transportation field strength.
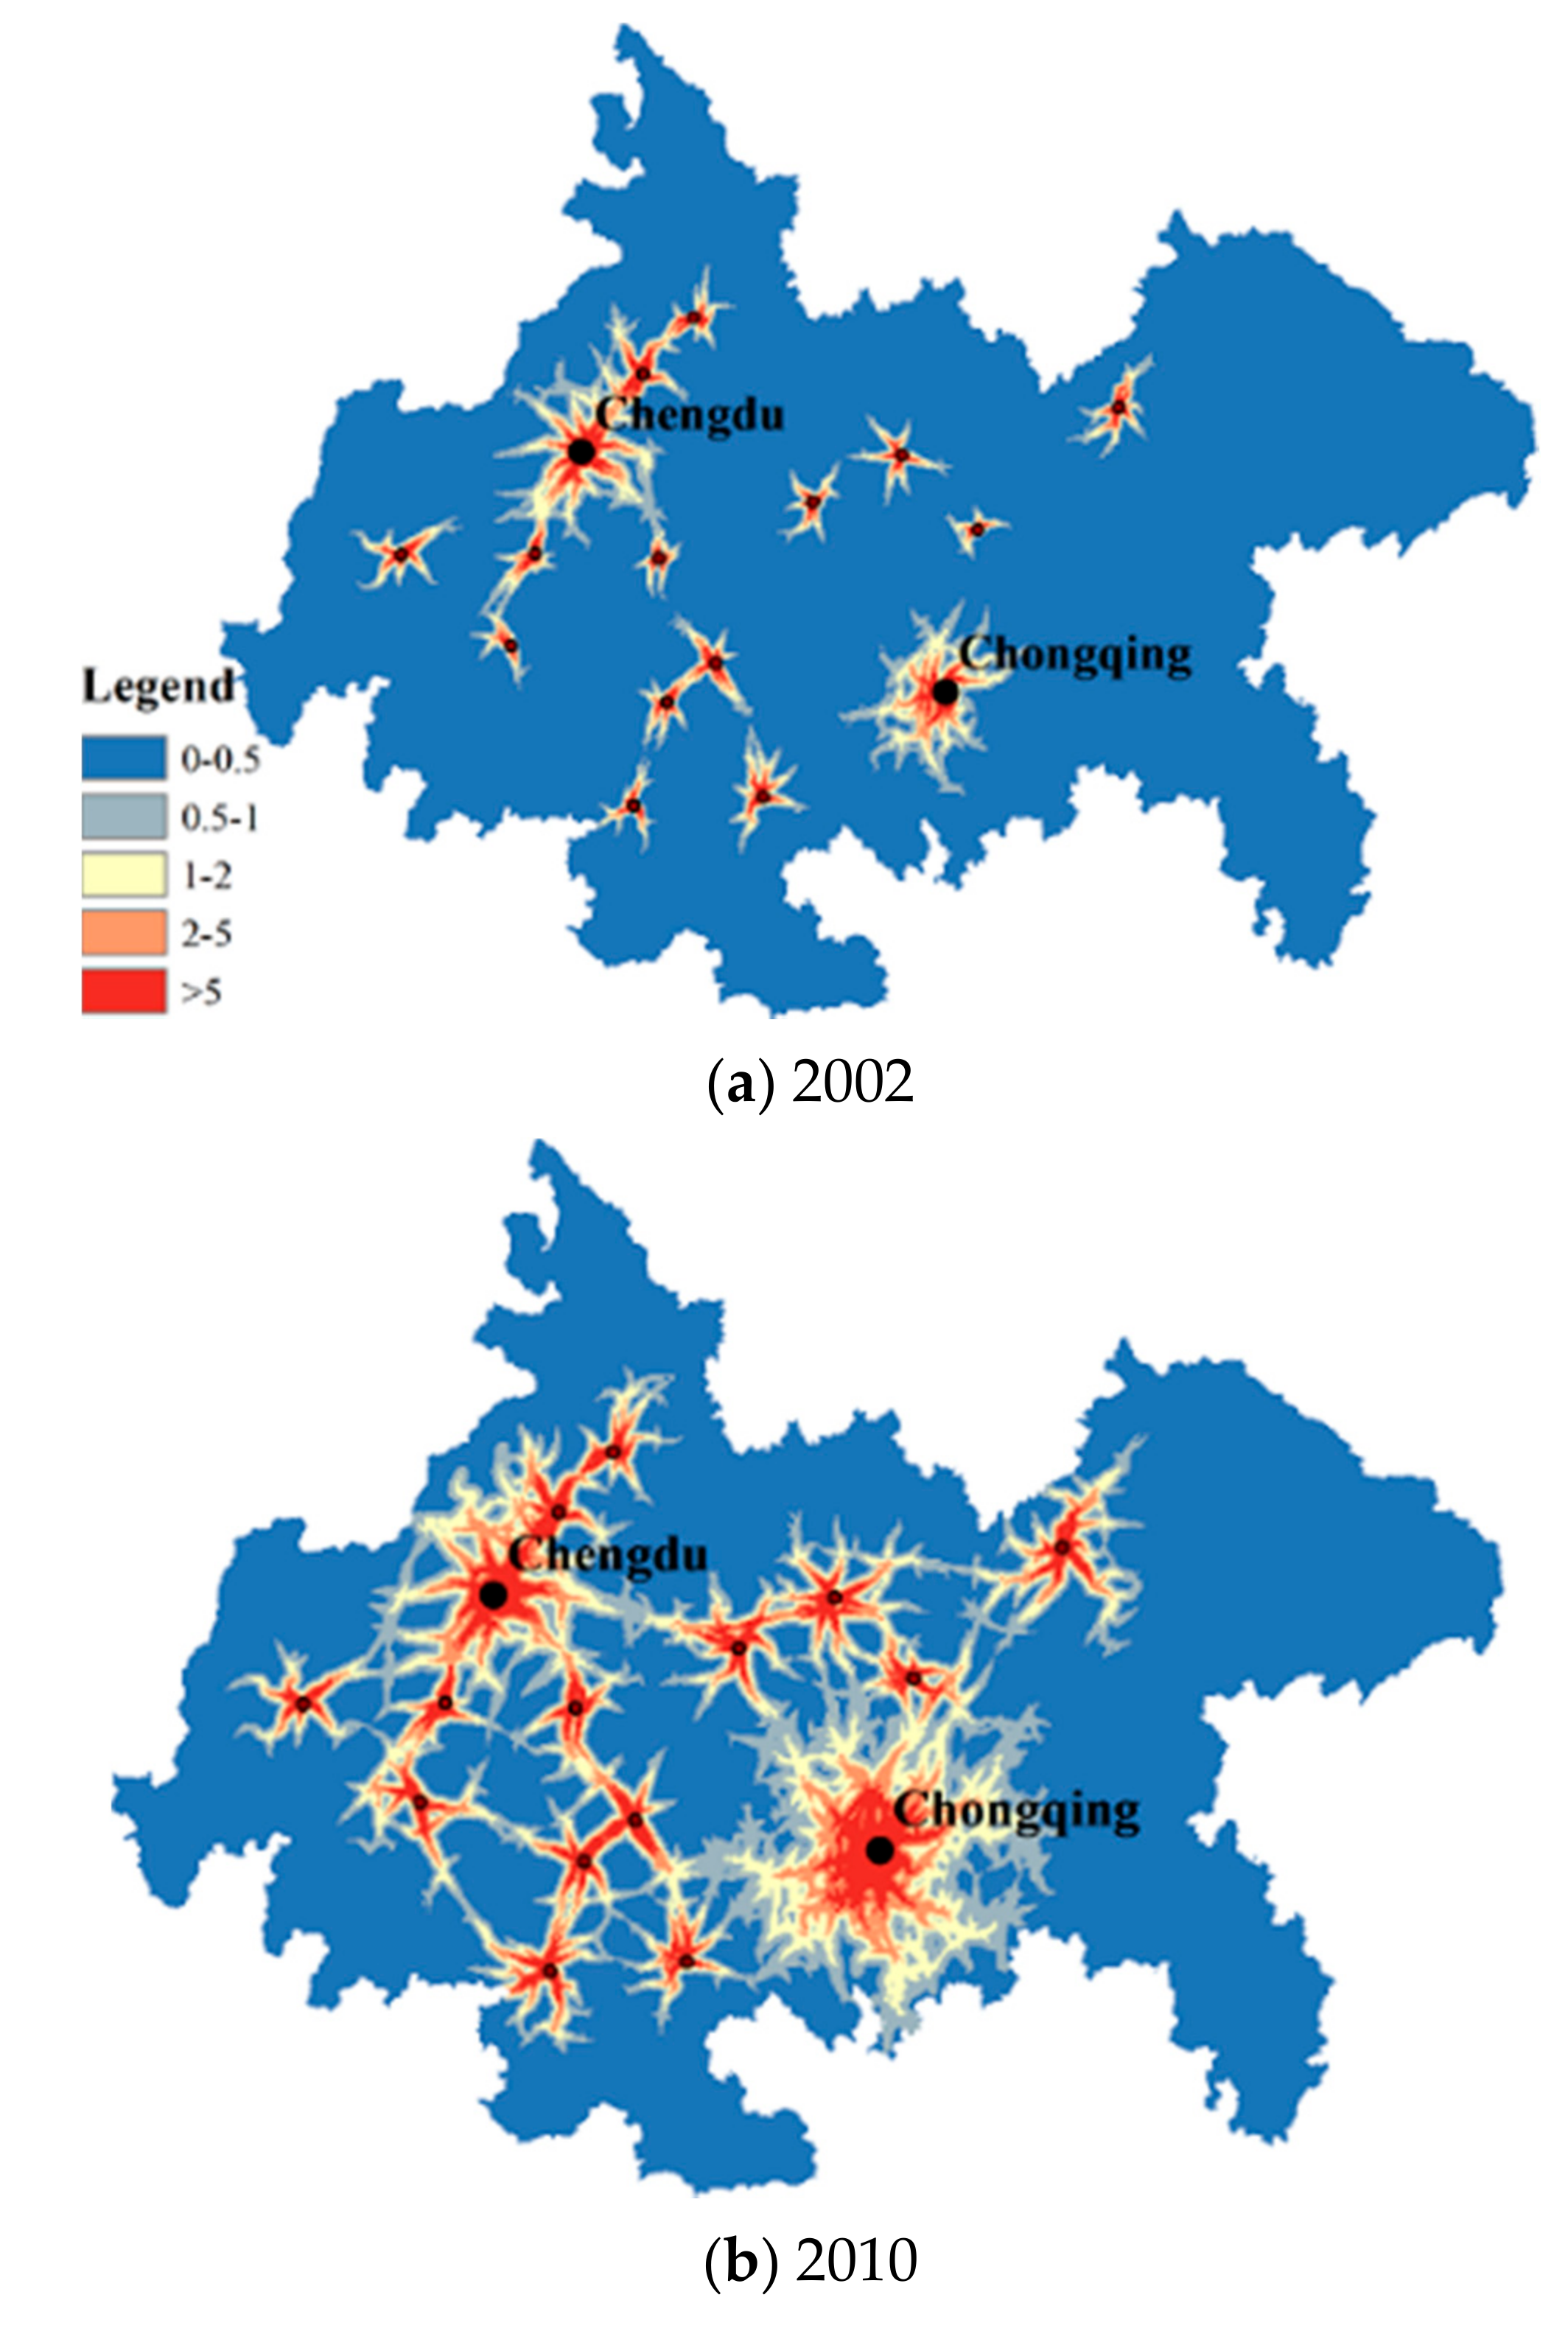
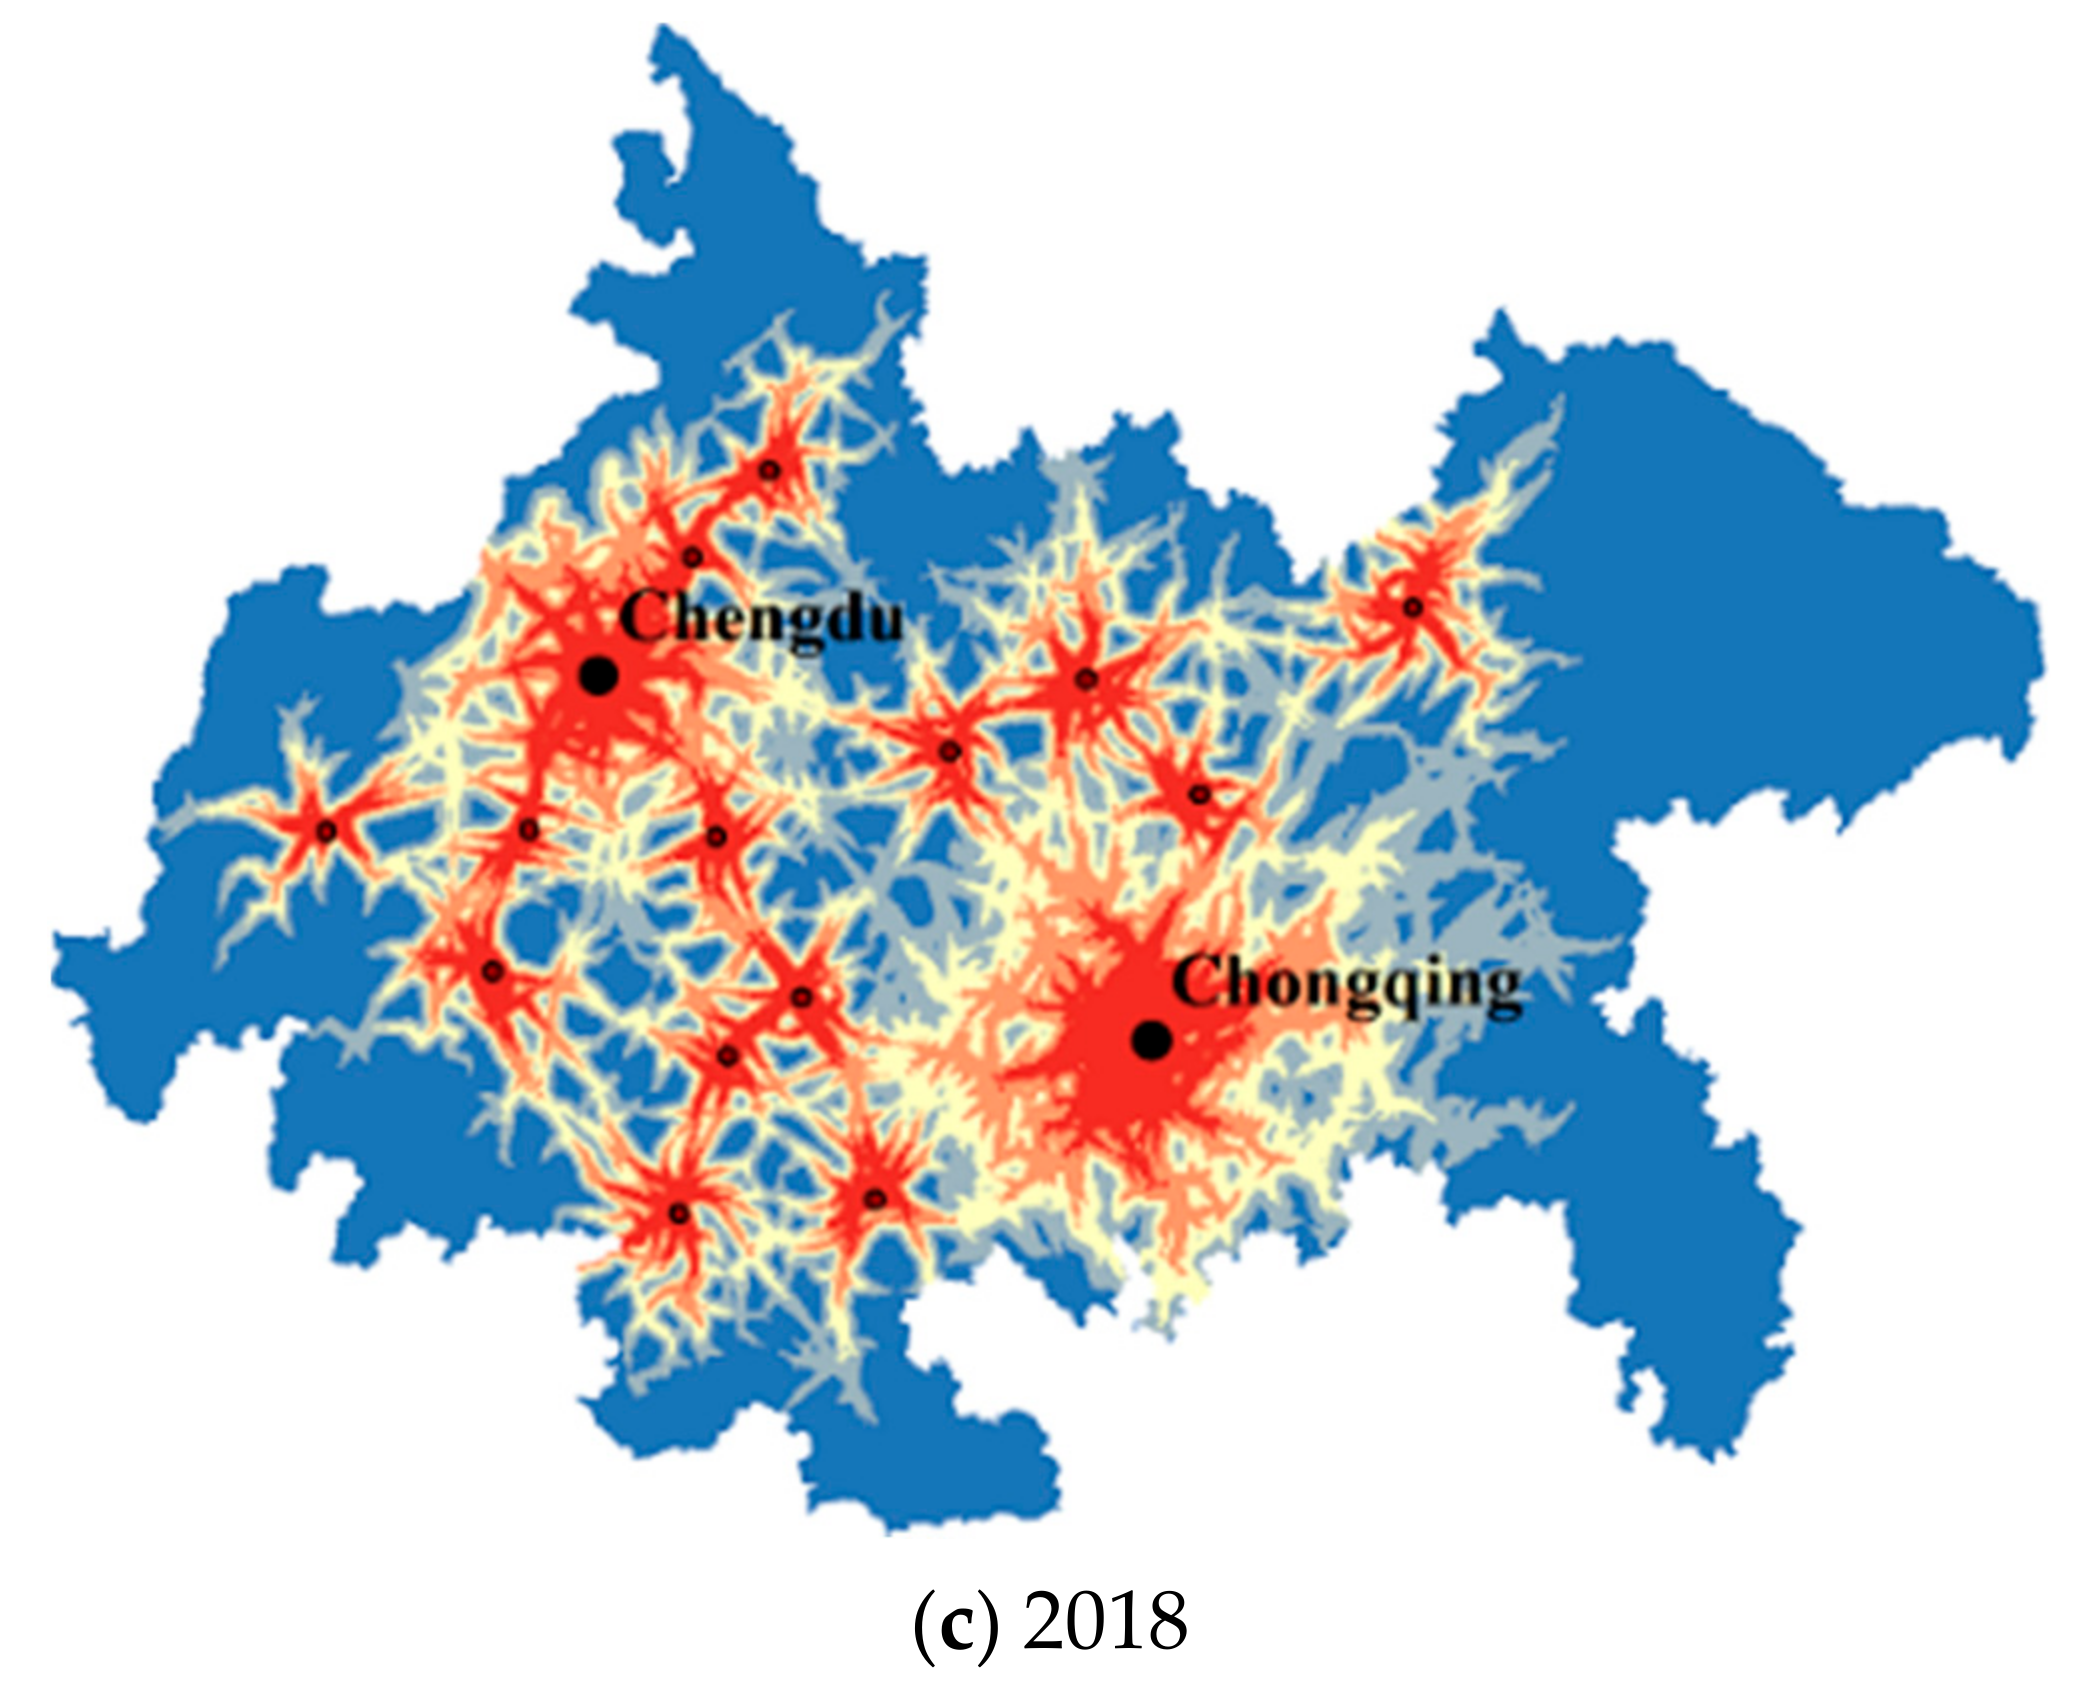
The transportation field strength is calculated per city based on the transportation field source mass and distance. The field strength maps of each city in the whole study area are superimposed according to the principle of taking the maximum value to draw the overall field strength map. The value of the overall field strength map of 2002 ranged from 0.0032 to 3535.51, from 0.016 to 13,673.1 in 2010, and from 0.0259 to 27,193 in 2018. According to the field strength values of 0–0.5, 0.5–1, 1–2, 2–5, and >5, the overall field strength map was further separated, as shown in Figure 5. In 2002, the cities had an isolated island state from the perspective of transportation field evolution. In 2010, each city’s areas were almost connected, and the areas expanded along the opposite direction of the axis. In 2018, all cities’ significant areas overlapped. It seems, therefore, that the transportation field strength has been evolving from “point” to “axis” and to “polygon. “
(2) Radiation sphere.
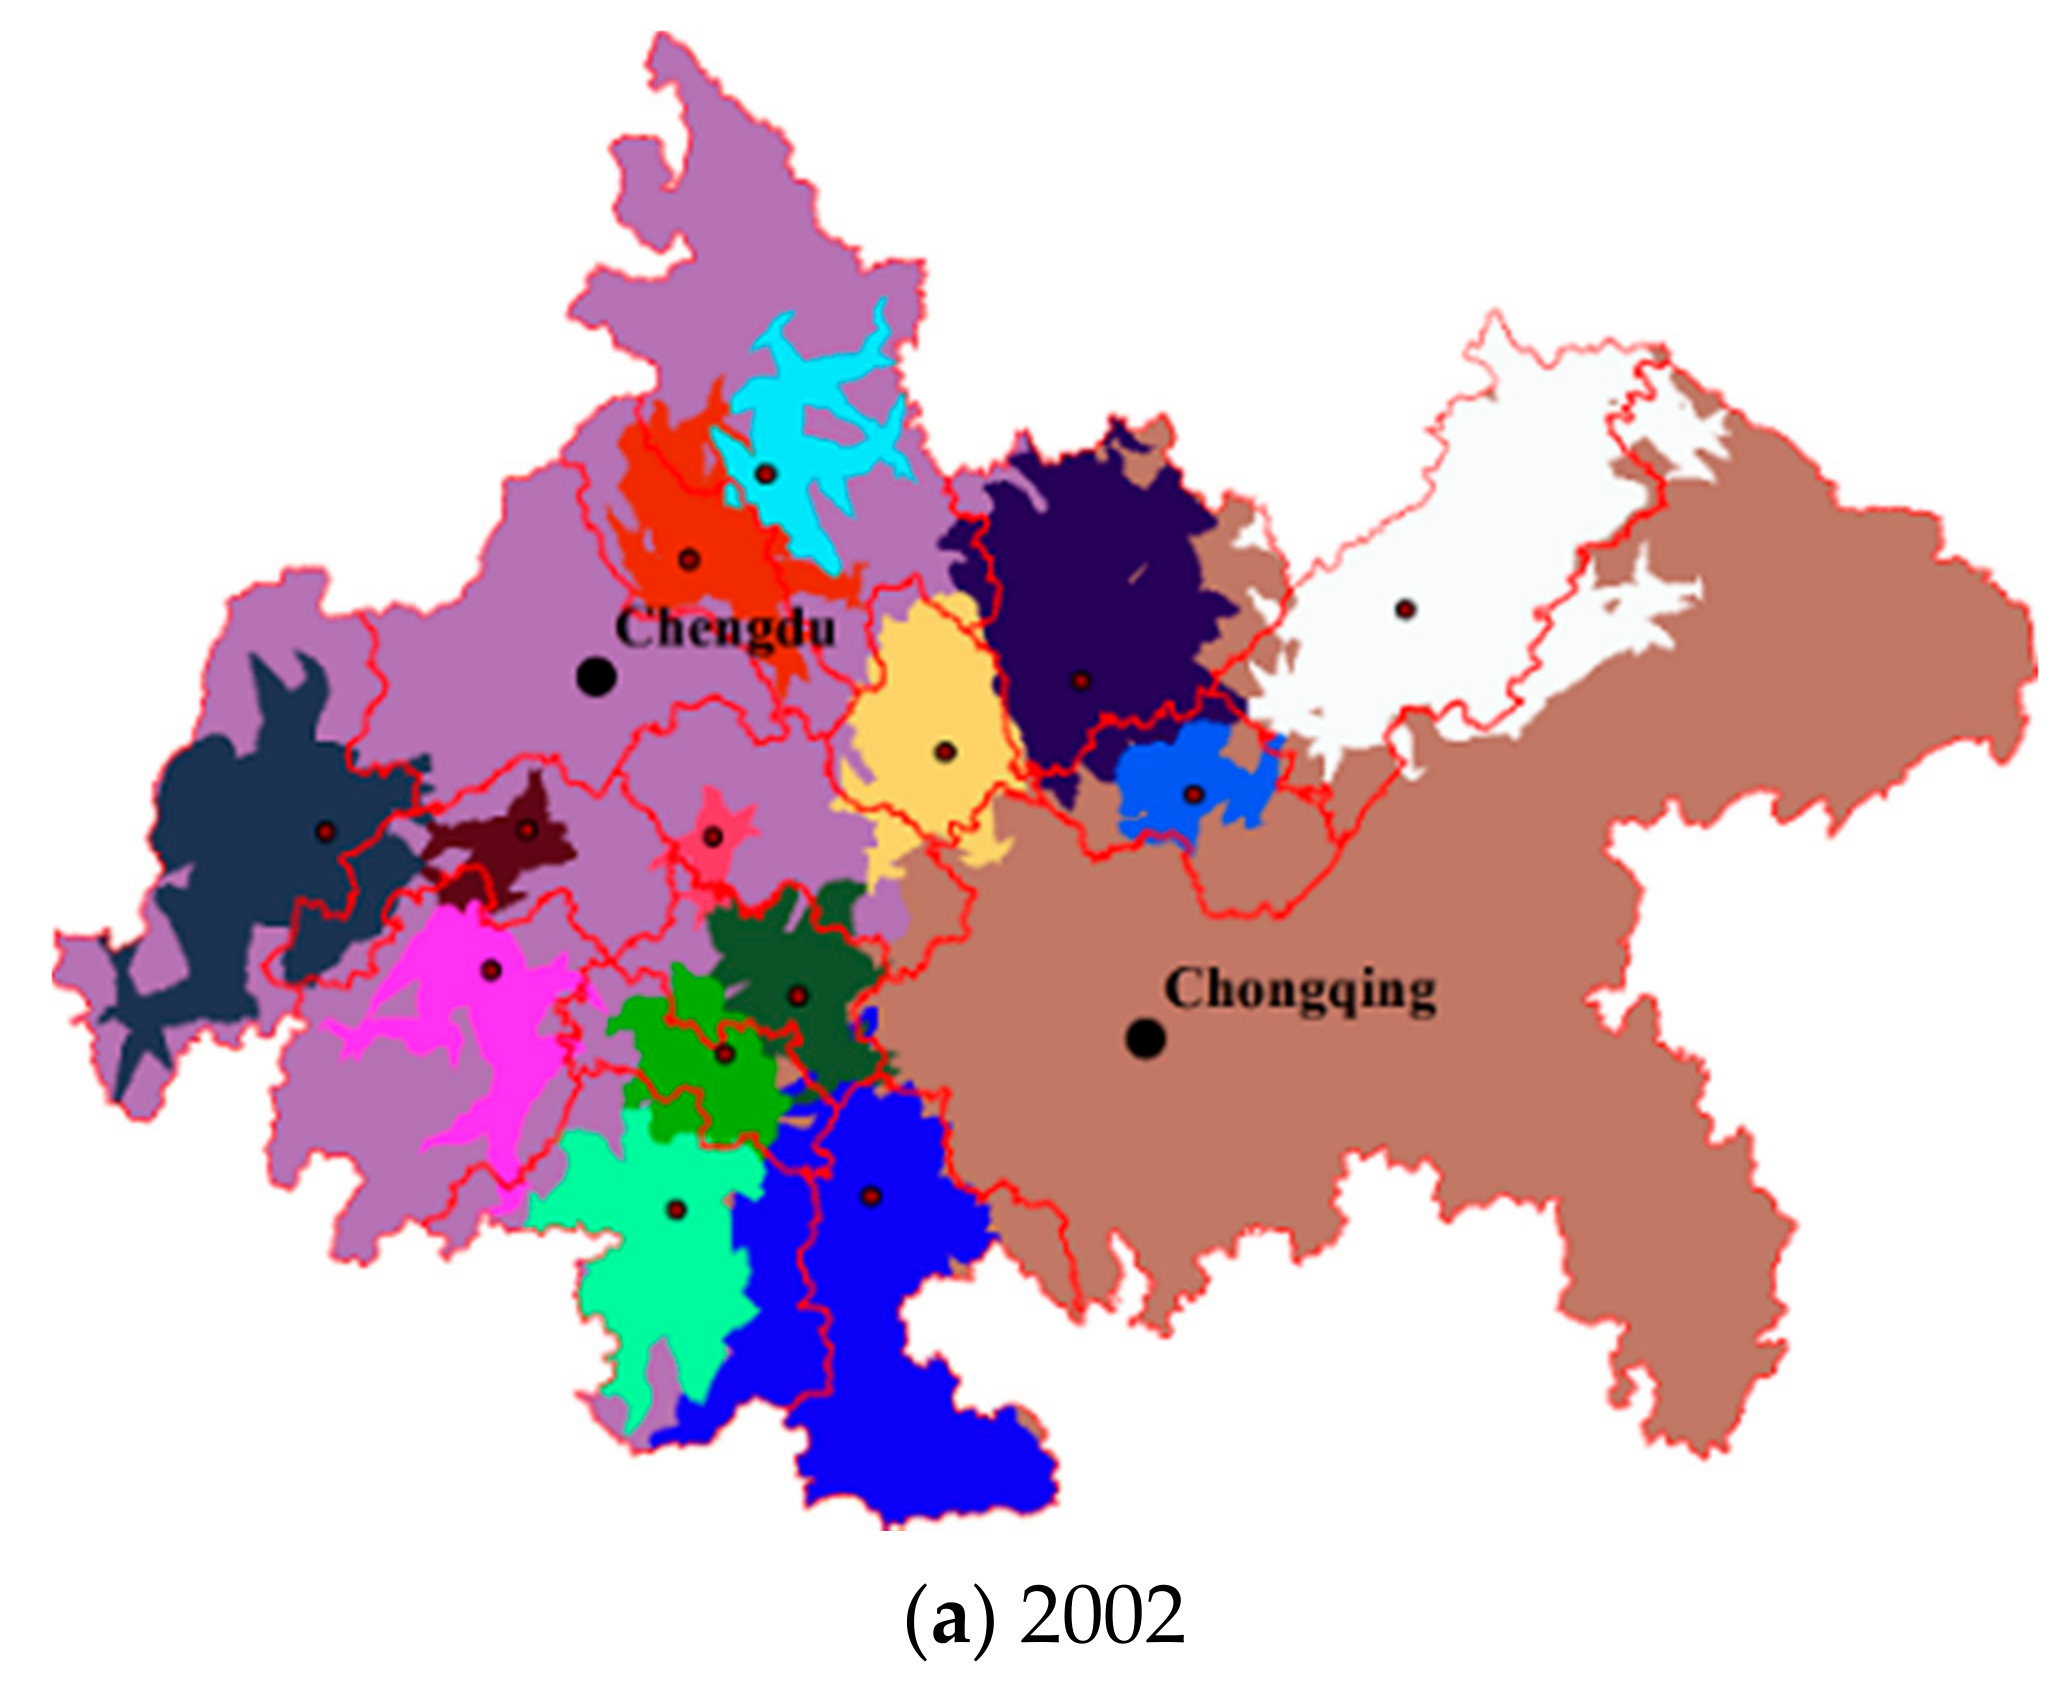
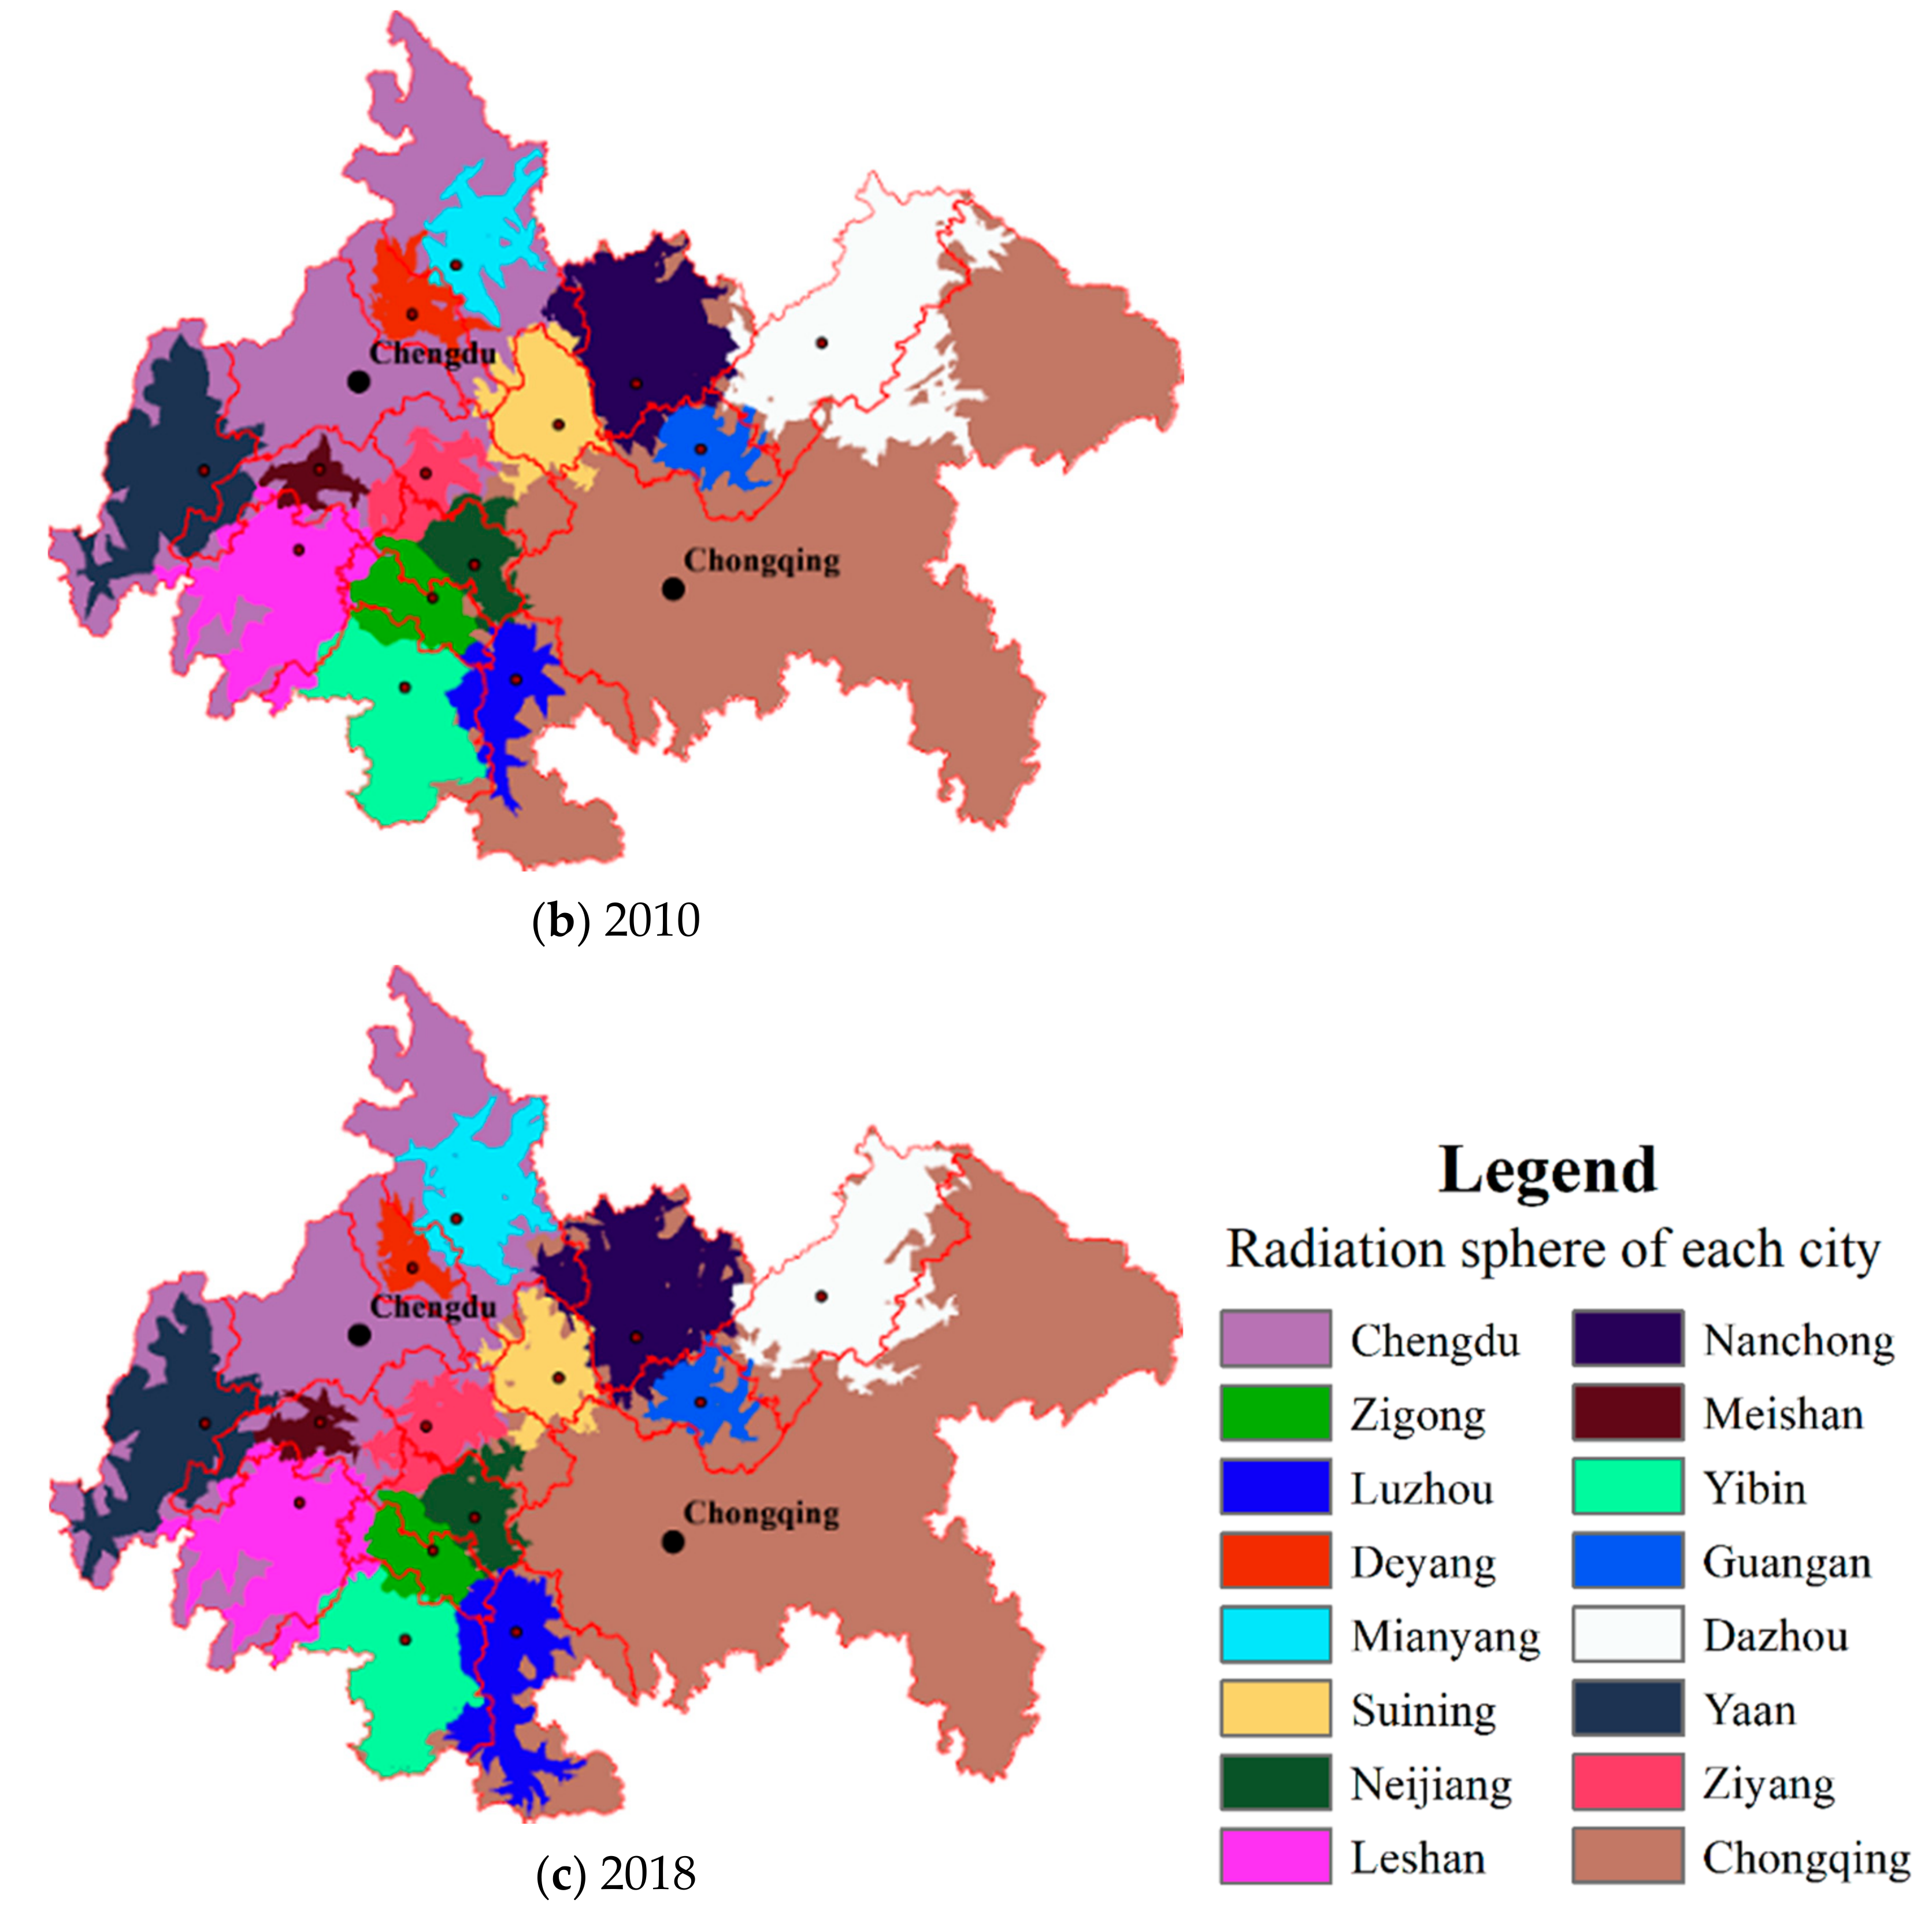
As indicated in the transportation field strength maps, each point’s membership in the study area can be determined by adhering to the maximum value principle (Figure 6). In effect, most cities are linked as any two points can be connected by a curve completely belonging to the graph. However, core cities (Chongqing and Chengdu) have unconnected graphs of radiation spheres to envelope the remainder.
The radiation sphere was counted for all cities (Table 4). It should be noted that Chongqing occupies the largest sphere in the CCUA. Chongqing’s radiation sphere (89,540 square kilometers) was 90.17 times that of Ziyang (993 square kilometers) in 2002, 49.83, and 45.92 times that of Meishan in 2010 (93,339 square kilometers) and 2018 (97,816 square kilometers), respectively. Chengdu remains in second place. Surprisingly, some cities, nearby core cities (e.g., Deyang), have a reduced radiation sphere due to the rapid development of transportation in core cities.
(3) Deviation of radiation sphere.
The derived deviation indexes are shown in Figure 7. In 2018, only five of the cities had a radiation sphere larger than their administrative areas; they had the deviation of the radiation sphere greater than 1. However, a few cities’ radiation spheres (e.g., Dazhou, Zigong, and Luzhou) were reduced to below the administrative areas under other cities’ extrusions. From the perspective of the whole UA, the spheres of radiation effect are unbalanced.
(4) Evolution of deviation range.
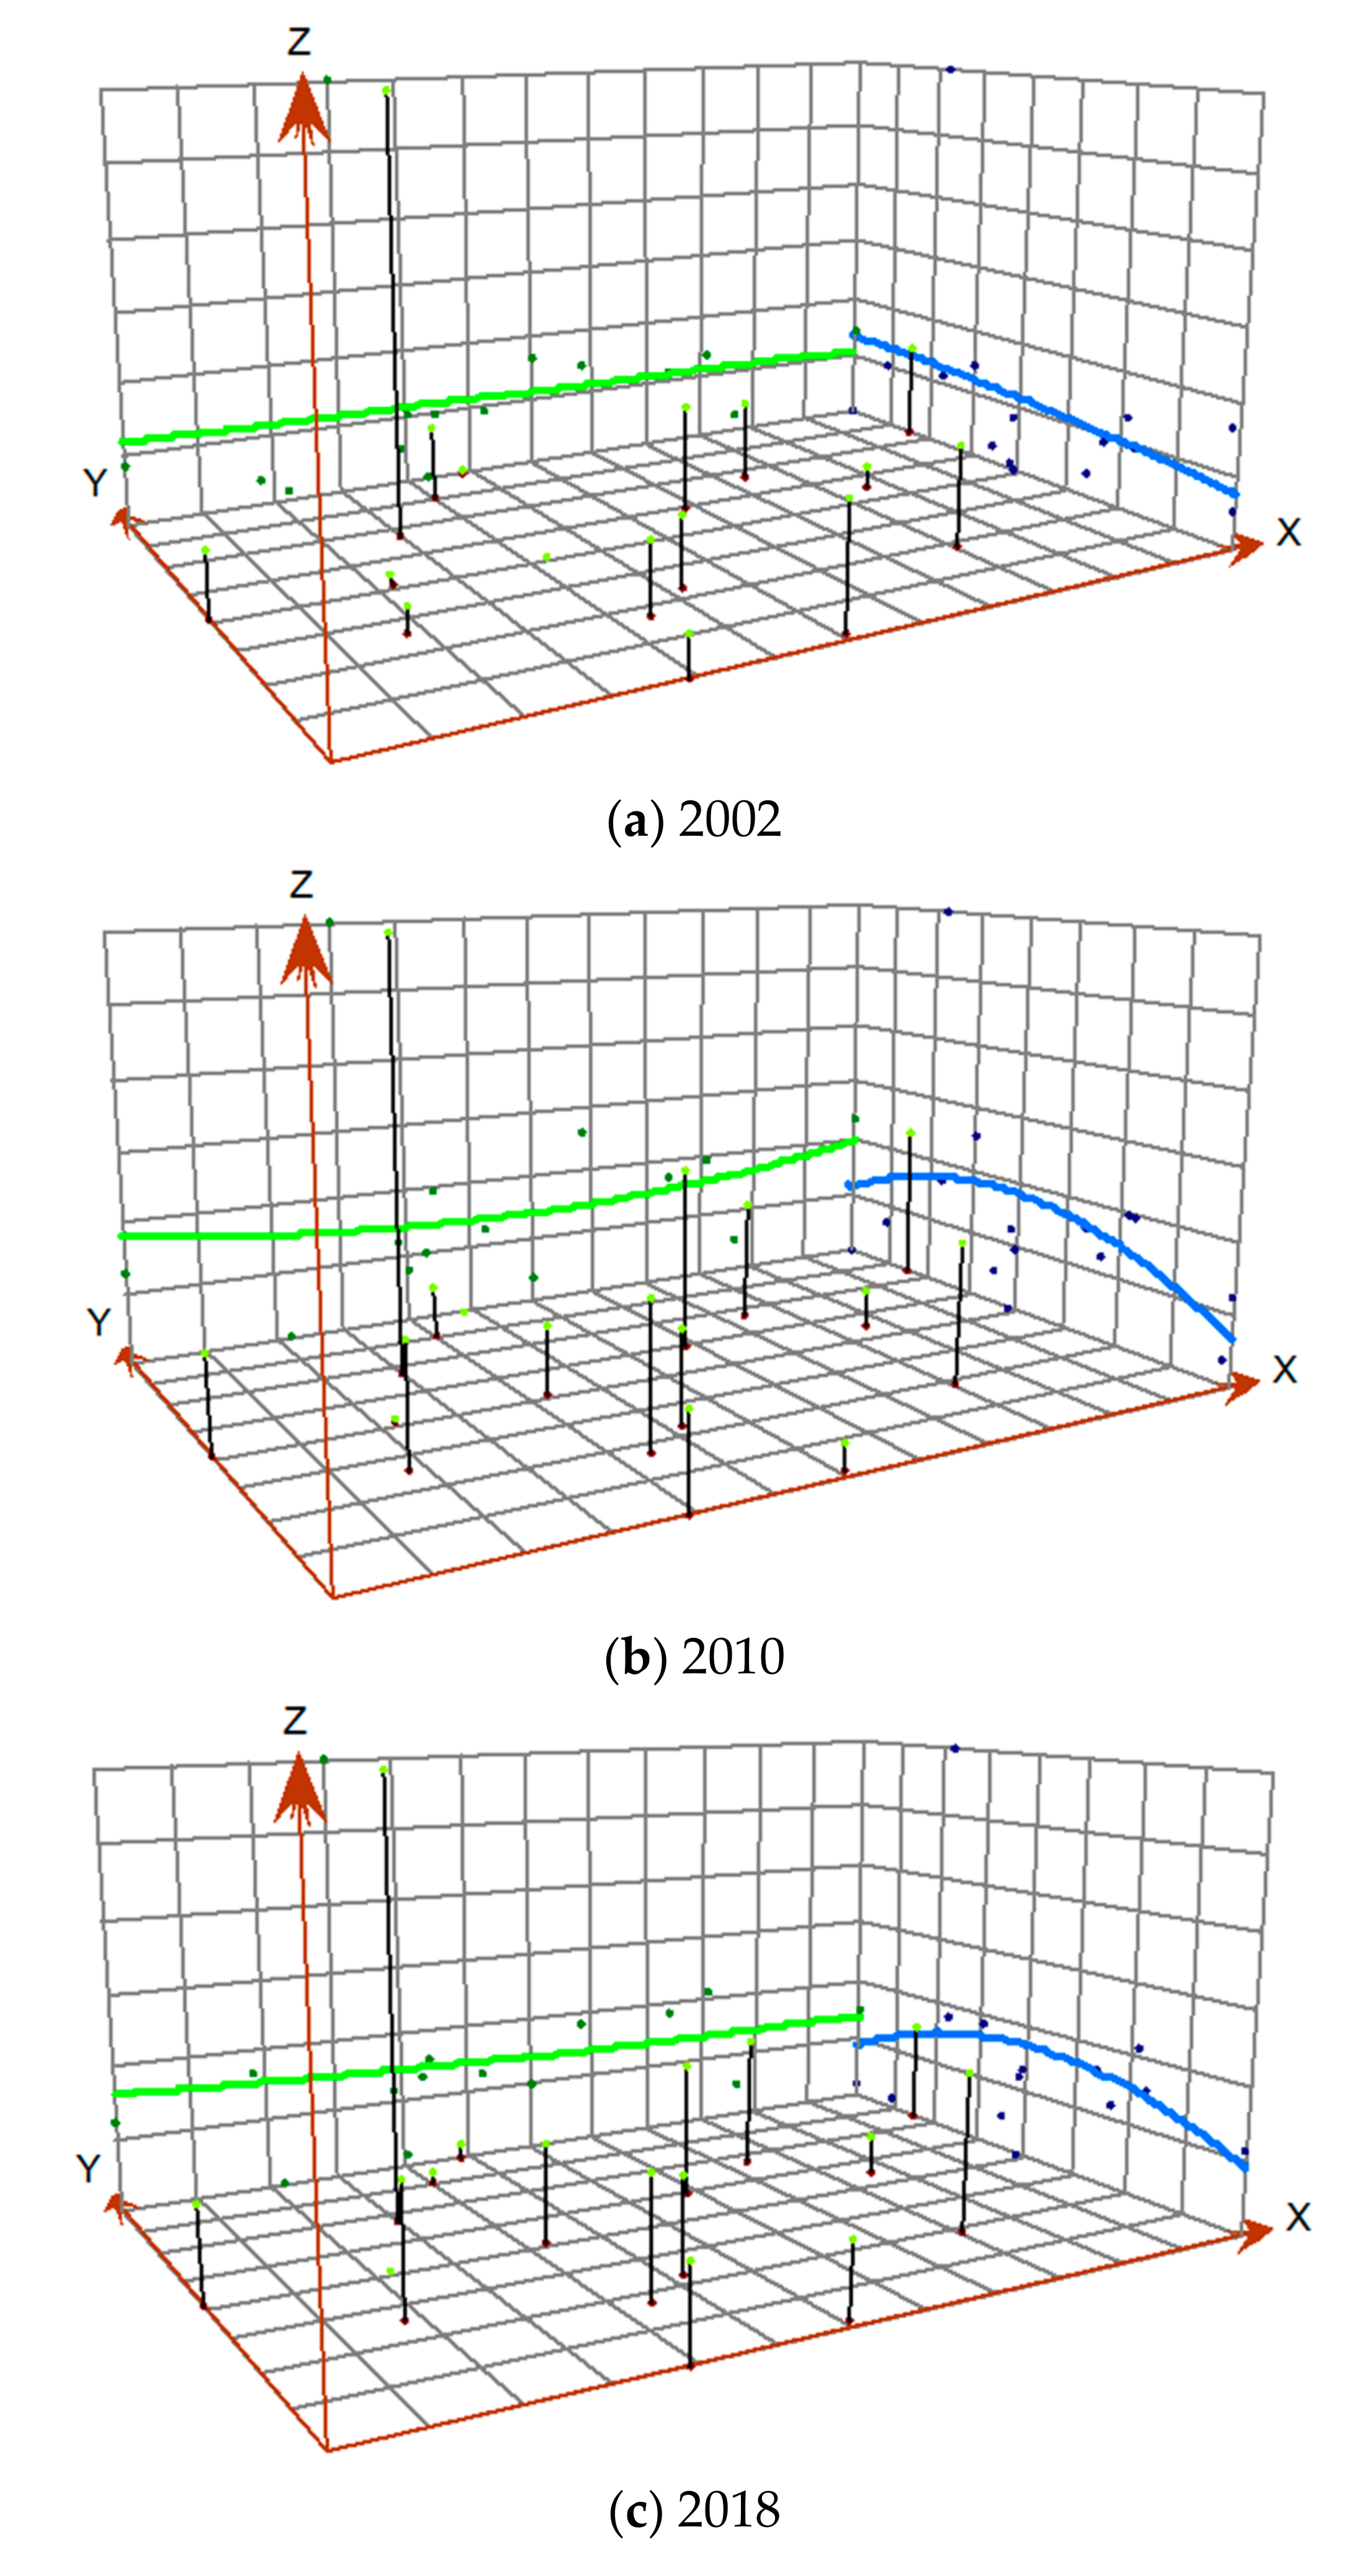
The evolution of deviation of radiation sphere was analyzed; the results are shown in Figure 8. In 2002, the polynomial curves followed a steady trend from east to west, dropped slightly from north to south (Figure 8a). In 2010, the curve showed a trend of east–west U-shaped and north–south inverted U-shaped (Figure 8b). Given the cities’ geographical situations, Chengdu and Chongqing’s transportation system radiation spheres expanded in the first period from 2002 to 2010. In 2018, the curves showed an inverted U-shaped trend from north to the south still, and a steady trend from east to west (Figure 8c). In the second period, the radiation spheres of non-core cities in the central region improved from 2010 to 2018.
6. Findings and Discussion
This work investigates the transportation system development levels of cities in a UA and explores the accessibility of the UA cities by treating the road network as the deciding factor. The CCUA is taken as the case study area integrating interdisciplinary approaches of principal component analysis, accessibility analysis, and the field strength model to investigate the radiation effects of cities and the corresponding spatial evolution principles in a transportation system.
Previous studies have shown that the imbalance of regional transportation obeys a downward development trend [23]. However, according to the result of field source mass, cities’ transportation systems in the CCUA are hierarchical, and the hierarchy sustains relatively stable. The transportation development had its ranking features. Core cities played a dominant position in the CCUA, and other cities might find it hard to surpass. The hierarchy remains relatively stable, determined by cities’ geographical location, history, and economic heritage. Core cities are regions’ political, cultural, and economic centers, and they have natural geographical advantages. The prosperity of social and economic activities makes core city transportation systems have a higher transportation development level.
As stressed previously, intercity rail transit construction expands the traffic isochronous rings along the route [60]. However, it is found that traffic isochronous ring areas in the CCUA increased with cities as the centers. Even if rail transits have extended to all cities and urban centers, the accessibility beyond urban centers was rarely improved due to the insufficient scale of road networks. In the past, UA transportation systems were centered on cities to develop cities’ agglomeration ring areas, but little attention has been paid to transportation accessibility away from city centers. Consequently, the accessibility of core cities had improved significantly, while the accessibility beyond urban centers had relatively development rates. This trend imposed a spatial inequality of transportation networks in the UA [61].
Technically, this study contributes a novelty model to measure the interaction between a city’s transportation system and peripheral regions or cities at the regional level. Instead of analyzing the traffic route [21,22] or traffic flows between cities [24,52,56,57,62,63], the radiation effect of the UA city’s transportation system is reasonably and vividly imaged by transportation field strength. The results show that the transportation field strength in the CCUA is characterized by polycentric annular and dendritic expansion with cities. The field strength had witnessed an “isolated island” state, universal axis connection, and overlapping. In other words, the radiation effect in the UA had evolved from “point” to “axis” and then to “polygon”. This is mainly due to the integrated improvement of the UA transportation network. The improvement of transportation field strength, namely, the mass of field source and traffic condition, causes all cities’ radiation spheres to grow. This evolutionary process concurred with the trend of compact development of UAs, which creates conditions for compact development of UAs and is also a manifestation of compact development of UAs in the aspect of transportation [30,64]. The overall promotion of UA’s traffic development depends heavily on the radiation effect of every city. To meet UA’s compactness development needs, the relatively isolated cities’ transportation system should be regarded as the key object of support and promotion.
The radiation sphere analysis proposed in this paper provides a new approach to graphically reveal how important the role each city’s transportation system plays in the hierarchically integrated UA transportation network. It is different from the previous studies devoted to calculating numerical indicators, such as centrality [65], density of network [54] and the Gini coefficient of network [23]. The result shows that the radiation sphere of core cities envelops the remainder. Two stages were further derived. First, core cities’ radiation sphere starts to grow, and other cities will follow thereafter. This phenomenon can be ascribed to core cities’ important role in the transportation networks. According to the growth-pole theory, investors should concentrate on a few limited locations to agglomerate urban activities to improve the region’s overall status [66]. In the first stage, core cities’ transportation advantages reflect traffic routes [19] and comprehensive transportation development level. To realize UA’s development in a point-to-polygon way, it is necessary to properly assess UA’s transportation development stages and foster the growth pole. In the second stage, improving the traffic conditions in the entire UA deserves consideration.
7. Conclusions, Policy Implications, and Limitations
As an instrument of spatial planning, transportation networks have been increasingly prominent in regional development. The radiation effect of transportation systems can be utilized to construct a powerful transportation network in the UA. In this paper, the radiation effect is imaged using the traffic field strength model. The results indicating the UA transportation networks present a relatively stable spatially hierarchical pattern but difficult to change without intervention. Insufficient attention has been paid to improving traffic conditions away from city centers. It is also revealed that the overall improvement of the UA transportation system benefits from the development of all cities’ transportation systems, and can be realized in a “point-to-polygon” way. Furthermore, it is implied that the growth pole theory applies to the development of UA transportation network.
It is recommended the strengthening of UA transportation networks to shape the spatial structure of UA and promote coordinated development in the integrated UA. Several policy suggestions are listed below.
- (1)
- The overall situation of UA accessibility should be improved in a systematical way by enhancing the density of road networks beyond urban centers to provide a basis for strengthening the interaction between cities and the radiation effect of cities’ transportation systems.
- (2)
- Greater efforts are needed to ensure the continuous improvement of each UA city’s transportation system. Thereby, the overall promotion of UA’s transportation network can depend on the transportation radiation effects of every city, and be realized in a “point-to-polygon” way.
- (3)
- In the plan of UA transportation development, the effect of growth poles should be considered. If a UA’s transportation development is arranged in the first stage, the limited resources of transportation construction and development should be tilted toward the growth-pole cities or used for the cultivation of new traffic growth poles. In the second stage, it should focus on the overall improvement of the traffic level of the entire UA.
- (4)
- The design of UA transport network spatial pattern should accord with the characteristics of UA spatial structure, so as to provide a basic framework for UA development in a polycentric or compact model.
The rise of UAs and UA transportation networks has become an important phenomenon around the world, and both developed and developing countries are confronted with similar development opportunities and challenges as in China [1]. Therefore, although this study is situated in China, the main conclusions are applicable worldwide. This study has two limitations largely due to data availability. First, due to the difficulty accessing historical data, the yearbook data and traffic network data might compete against each other in the research years. Second, the research objects are the same as the relevant yearbooks’ statistical objects, which can pose the research area as inconsistent with the real CCUA. Future studies are recommended to improve the study by solving these two main shortcomings to support UA transportation networks’ sustainable growth.
Author Contributions
Z.Y. and K.Y. participated in all phases; L.X. helped with data collection; X.W. helped in paper organization. All authors have read and agreed to the published version of the manuscript.
Funding
This research was supported by the National Natural Science Foundation of China (No. 71871033), and Chongqing University under the fundamental Research Funds for the Central Universities, China (No. 2018 CDJSK 03 PT 16).
Acknowledgments
The authors sincerely thank the editors and the anonymous reviewers for their constructive suggestions for this manuscript.
Conflicts of Interest
The authors declare no conflict of interest.
Appendix A

Table A1.
Indicators of the field strength model.
| Dimensions | Code | Indicator | Unit | 2002 | 2010 | 2018 | ||||||
|---|---|---|---|---|---|---|---|---|---|---|---|---|
| Max | Min | Mean | Max | Min | Mean | Max | Min | Mean | ||||
| Transportation infrastructure | X1 | Total highway mileage | km | 31,060 | 1769 | 5845.1053 | 116,949 | 4438 | 16994 | 157,483 | 4812.224 | 21,741.262 |
| X2 | Mileage of classified highway | km | 21,936 | 1046 | 4190.7368 | 80,006 | 2706 | 12,538.316 | 133,942 | 3929.294 | 19,332.706 | |
| X3 | The proportion of classified highway | km | 0.9333 | 0.4592 | 0.6995 | 0.8952 | 0.5898 | 0.7602 | 0.9950 | 0.7966 | 0.9045 | |
| X4 | Density of highway network (population) | km/104 persons | 17.8791 | 5.2257 | 10.6387 | 48.0877 | 17.6769 | 26.9853 | 66.3458 | 18.7867 | 34.1485 | |
| X5 | Density of highway network (land area) | km/102 km2 | 92.1227 | 17.8138 | 42.8899 | 179.1125 | 36.7599 | 116.1898 | 235.2120 | 44.6063 | 145.0333 | |
| Passenger transport | X6 | Highway passenger volume | 104 persons | 58,512 | 1850 | 10,832.474 | 122,125 | 2249 | 18,395.924 | 52,150 | 1654 | 6566.1053 |
| X7 | Waterway passenger volume | 104 persons | 2046 | 0 | 272.2105 | 1277 | 0 | 220.8432 | 735 | 0 | 170.3158 | |
| X8 | Airline passenger volume | 104 persons | 379.26 | 0 | 29.0167 | 1287.9 | 0 | 114.8249 | 5295 | 0 | 477.2105 | |
| X9 | Turnover of highway passenger | 104 persons·km | 1,938,700 | 52,822 | 315,770.16 | 3,510,300 | 86,248 | 569,851.84 | 2,604,300 | 59,718 | 347,165.26 | |
| X10 | Passenger traffic density of highway | 104 persons·km/km | 96.7224 | 21.8076 | 47.5189 | 129.8885 | 13.6998 | 31.5511 | 32.1042 | 4.9749 | 15.5006 | |
| Freight transport | X11 | Highway freight volume | 104 tons | 26,076 | 969 | 4246.6842 | 69438 | 2215 | 9618.2105 | 107,064 | 3832 | 13,807.263 |
| X12 | Waterway freight volume | 104 tons | 1907 | 0 | 235.8421 | 9660 | 0 | 767.8947 | 19,452 | 0 | 1453.1579 | |
| X13 | Airline freight volume | tons | 105,300 | 0 | 7178.4211 | 220,000 | 0 | 16,382.053 | 665,000 | 0 | 43,736.211 | |
| X14 | Turnover of highway freight | 104 tons·km | 899,100 | 57,873 | 153,869.37 | 6,103,100 | 168,910 | 787,257.63 | 11,527,546 | 304,937 | 1,449,173.5 | |
| X15 | Freight traffic density of highway | 104 tons·km/km | 44.4881 | 12.0310 | 25.4934 | 98.8644 | 12.2888 | 47.4079 | 129.2712 | 21.9923 | 68.6883 | |
References
- Huang, Y.; Hong, T.; Ma, T. Urban network externalities, agglomeration economies and urban economic growth. Cities 2020, 107, 102882. [Google Scholar] [CrossRef]
- Burger, M.J.; Meijers, E.J. Agglomerations and the rise of urban network externalities. Pap. Reg. Sci. 2016, 95, 5–15. [Google Scholar] [CrossRef]
- Li, K.X.; Qi, G. Transport Connectivity and Regional Development in China. J. Int. Logist. Trade 2016, 14, 142–155. [Google Scholar] [CrossRef]
- Deng, T.; Shao, S.; Yang, L.; Zhang, X. Has the transport-led economic growth effect reached a peak in China? A panel threshold regression approach. Transportation 2014, 41, 567–587. [Google Scholar] [CrossRef]
- Tierney, S. High-speed rail, the knowledge economy and the next growth wave. J. Transp. Geogr. 2012, 22, 285–287. [Google Scholar] [CrossRef]
- Vaidyanathan, V.; King, R.A.; De Jong, M. Understanding urban transportation in India as polycentric system. Policy Soc. 2013, 32, 175–185. [Google Scholar] [CrossRef] [Green Version]
- Ryder, A. High speed rail. J. Transp. Geogr. 2012, 22, 303–305. [Google Scholar] [CrossRef]
- Shaw, S.-L.; Fang, Z.; Lu, S.; Tao, R. Impacts of high speed rail on railroad network accessibility in China. J. Transp. Geogr. 2014, 40, 112–122. [Google Scholar] [CrossRef]
- Li, C.; He, J.; Duan, X. Modeling the Collaborative Evolution of Urban Land Considering Urban Interactions under Intermediate Intervention, in the Urban Agglomeration in the Middle Reaches of the Yangtze River in China. Land 2020, 9, 184. [Google Scholar] [CrossRef]
- Fang, C.; Yu, D. Urban agglomeration: An evolving concept of an emerging phenomenon. Landsc. Urban Plan. 2017, 162, 126–136. [Google Scholar] [CrossRef]
- Zhou, D.; Bonafoni, S.; Zhang, L.; Wang, R. Remote sensing of the urban heat island effect in a highly populated urban agglomeration area in East China. Sci. Total Environ. 2018, 628–629, 415–429. [Google Scholar] [CrossRef]
- Zhou, H.; Gao, H. The impact of urban morphology on urban transportation mode: A case study of Tokyo. Case Stud. Transp. Policy 2020, 8, 197–205. [Google Scholar] [CrossRef]
- Christoforou, Z.; Corbillé, E.; Farhi, N.; Leurent, F. Managing planned disruptions of mass transit systems. Transp. Res. Rec. J. Transp. Res. Board 2016, 2541, 46–55. [Google Scholar] [CrossRef] [Green Version]
- Schneider, A.; Mertes, C.M. Expansion and growth in Chinese cities, 1978–2010. Environ. Res. Lett. 2014, 9, 024008. [Google Scholar] [CrossRef]
- Sun, X. Multi-indicator Evaluation and Analysis of Coordinated Industrial Development of Urban Agglomerations. Chin. J. Urban Environ. Stud. 2017, 5, 1750006. [Google Scholar] [CrossRef]
- Faber, B. Trade integration, market size, and industrialization: Evidence from China’s National Trunk Highway System. Rev. Econ. Stud. 2014, 81, 1046–1070. [Google Scholar] [CrossRef] [Green Version]
- Ahlfeldt, G.M.; Feddersen, A. From periphery to core: Measuring agglomeration effects using high-speed rail. J. Econ. Geogr. 2017, 18, 355–390. [Google Scholar] [CrossRef]
- López, E.; Gutiérrez, J.; Gómez, G. Measuring Regional Cohesion Effects of Large-scale Transport Infrastructure Investments: An Accessibility Approach. Eur. Plan. Stud. 2008, 16, 277–301. [Google Scholar] [CrossRef] [Green Version]
- Monzón, A.; Ortega, E.; López, E. Efficiency and spatial equity impacts of high-speed rail extensions in urban areas. Cities 2013, 30, 18–30. [Google Scholar] [CrossRef] [Green Version]
- Zhang, L.; Lu, Y. Regional accessibility of land traffic network in the Yangtze River Delta. J. Geogr. Sci. 2007, 17, 351–364. [Google Scholar] [CrossRef]
- Jiao, J.; Wang, J.; Jin, F.; Dunford, M. Impacts on accessibility of China’s present and future HSR network. J. Transp. Geogr. 2014, 40, 123–132. [Google Scholar] [CrossRef]
- Levinson, D.M. Accessibility impacts of high-speed rail. J. Transp. Geogr. 2012, 22, 288–291. [Google Scholar] [CrossRef] [Green Version]
- Chen, J.; Chen, J.; Miao, Y.; Song, M.; Fan, Y. Unbalanced development of inter-provincial high-grade highway in China: Decomposing the Gini coefficient. Transp. Res. Part D Transp. Environ. 2016, 48, 499–510. [Google Scholar] [CrossRef]
- Derudder, B.; Liu, X.; Kunaka, C.; Roberts, M. The connectivity of South Asian cities in infrastructure networks. J. Maps 2013, 10, 47–52. [Google Scholar] [CrossRef]
- Lan, F.; Da, H.; Wen, H.; Wang, Y. Spatial Structure Evolution of Urban Agglomerations and Its Driving Factors in Mainland China: From the Monocentric to the Polycentric Dimension. Sustainability 2019, 11, 610. [Google Scholar] [CrossRef] [Green Version]
- Anas, A.; Arnott, R.; Small, K.A. Urban spatial structure. J. Econ. Lit. 1998, 36, 1426–1464. [Google Scholar]
- Stathakis, D.; Tsilimigkas, G. Measuring the compactness of European medium-sized cities by spatial metrics based on fused data sets. Int. J. Image Data Fusion 2014, 6, 42–64. [Google Scholar] [CrossRef]
- Kloosterman, R.C.; Musterd, S. The polycentric urban region: Towards a research agenda. Urban Stud. 2001, 38, 623–633. [Google Scholar] [CrossRef]
- Yang, T.; Jin, Y.; Yan, L.; Pei, P. Aspirations and realities of polycentric development: Insights from multi-source data into the emerging urban form of Shanghai. Environ. Plan. B Urban Anal. City Sci. 2019, 46, 1264–1280. [Google Scholar] [CrossRef]
- Qi, W.; Fang, C.; Song, J. Measurement and spatial distribution of urban agglomeration industrial compactness in China. Chin. Geogr. Sci. 2008, 18, 291–299. [Google Scholar] [CrossRef]
- Li, Z.; Wang, Y.; Zhao, S. Study of Intercity Travel Characteristics in Chinese Urban Agglomeration. Int. Rev. Spat. Plan. Sustain. Dev. 2015, 3, 75–85. [Google Scholar] [CrossRef] [Green Version]
- Bertinelli, L.; Black, D. Urbanization and growth. J. Urban Econ. 2004, 56, 80–96. [Google Scholar] [CrossRef]
- Zeng, C.; Zhao, Z.; Wen, C.; Yang, J.; Lv, T. Effect of Complex Road Networks on Intensive Land Use in China’s Beijing-Tianjin-Hebei Urban Agglomeration. Land 2020, 9, 532. [Google Scholar] [CrossRef]
- Garcia-López, M.-À. Urban spatial structure, suburbanization and transportation in Barcelona. J. Urban Econ. 2012, 72, 176–190. [Google Scholar] [CrossRef] [Green Version]
- Zheng, X.-P. Economies of Network, Urban Agglomeration, and Regional Development: A Theoretical Model and Empirical Evidence. Reg. Stud. 2007, 41, 559–569. [Google Scholar] [CrossRef]
- Dutta, I.; Das, A. Application of geo-spatial indices for detection of growth dynamics and forms of expansion in English Bazar Urban Agglomeration, West Bengal. J. Urban Manag. 2019, 8, 288–302. [Google Scholar] [CrossRef]
- Li, Y.; Xiong, W.; Wang, X. Does polycentric and compact development alleviate urban traffic congestion? A case study of 98 Chinese cities. Cities 2019, 88, 100–111. [Google Scholar] [CrossRef]
- He, Q.; Zeng, C.; Xie, P.; Tan, S.; Wu, J. Comparison of urban growth patterns and changes between three urban agglomerations in China and three metropolises in the USA from 1995 to 2015. Sustain. Cities Soc. 2019, 50, 101649. [Google Scholar] [CrossRef]
- Fageda, X.; Olivieri, C. Transport infrastructure and regional convergence: A spatial panel data approach. Pap. Reg. Sci. 2019, 98, 1609–1631. [Google Scholar] [CrossRef]
- Verma, A.; Sudhira, H.; Rathi, S.; King, R.; Dash, N. Sustainable urbanization using high speed rail (HSR) in Karnataka, India. Res. Transp. Econ. 2013, 38, 67–77. [Google Scholar] [CrossRef]
- Kruszyna, M.; Śleszyński, P.; Rychlewski, J. Dependencies between demographic urbanization and the agglomeration road traffic volumes: Evidence from Poland. Land 2021, 10, 47. [Google Scholar] [CrossRef]
- Chen, C.-L. Reshaping Chinese space-economy through high-speed trains: Opportunities and challenges. J. Transp. Geogr. 2012, 22, 312–316. [Google Scholar] [CrossRef]
- Mejia-Dorantes, L.; Paez, A.; Vassallo, J.M. Transportation infrastructure impacts on firm location: The effect of a new metro line in the suburbs of Madrid. J. Transp. Geogr. 2012, 22, 236–250. [Google Scholar] [CrossRef] [Green Version]
- Onofrio, R. Is the Law of Universal Gravitation Valid at Short Distances? Mod. Phys. Lett. A 1998, 13, 1401–1406. [Google Scholar] [CrossRef]
- Anderson, J.E. The Gravity Model. Annu. Rev. Econ. 2011, 3, 133–160. [Google Scholar] [CrossRef] [Green Version]
- De Benedictis, L.; Taglioni, D. The Gravity Model in International Trade. In The Trade Impact of European Union Preferential Policies; Springer Science and Business Media LLC: Berlin/Heidelberg, Germany, 2011; pp. 55–89. [Google Scholar]
- Tchrakian, D.H. Electric and Magnetic gravitational fields in vacuum. Gen. Relativ. Gravit. 1975, 6, 151–156. [Google Scholar] [CrossRef]
- Chen, Y. Urban gravity model based on cross-correlation function and Fourier analyses of spatio-temporal process. Chaos Solitons Fractals 2009, 41, 603–614. [Google Scholar] [CrossRef]
- Karemera, D.; Oguledo, V.I.; Davis, B. A gravity model analysis of international migration to North America. Appl. Econ. 2000, 32, 1745–1755. [Google Scholar] [CrossRef]
- Wang, D.; Niu, Y.; Sun, F.; Wang, K.; Qian, J.; Li, F. Evolution and spatial characteristics of tourism field strength of cities linked by high-speed rail (HSR) network in China. J. Geogr. Sci. 2017, 27, 835–856. [Google Scholar] [CrossRef]
- Camagni, R.; Capello, R.; Caragliu, A. The Rise of Second-Rank Cities: What Role for Agglomeration Economies? Eur. Plan. Stud. 2014, 23, 1069–1089. [Google Scholar] [CrossRef]
- Matsumoto, H. International urban systems and air passenger and cargo flows: Some calculations. J. Air Transp. Manag. 2004, 10, 239–247. [Google Scholar] [CrossRef] [Green Version]
- Jin, F.; Chen, Z. Evolution of transportation in China since reform and opening up: Patterns and principles. J. Geogr. Sci. 2019, 29, 1731–1757. [Google Scholar] [CrossRef] [Green Version]
- Magalhães, M.T. Spatial coverage index for assessing national and regional transportation infrastructures. J. Transp. Geogr. 2016, 56, 53–61. [Google Scholar] [CrossRef]
- Song, G.; Yang, J. Measuring the spatiotemporal variation and evolution of transport network of China’s megaregions. J. Geogr. Sci. 2016, 26, 1497–1516. [Google Scholar] [CrossRef]
- Liu, X.; Derudder, B.; Wu, K. Measuring Polycentric Urban Development in China: An Intercity Transportation Network Perspective. Reg. Stud. 2016, 50, 1302–1315. [Google Scholar] [CrossRef]
- Yang, H.; Dobruszkes, F.; Wang, J.; Dijst, M.; Witte, P. Comparing China’s urban systems in high-speed railway and airline networks. J. Transp. Geogr. 2018, 68, 233–244. [Google Scholar] [CrossRef]
- Guo, L.M.; Zhu, H.B.; Zhang, N.X. Numerical study of traffic flow considering the probability density distribution of the traffic density. Int. J. Mod. Phys. C 2017, 28, 1750026. [Google Scholar] [CrossRef]
- Lee, J.; Kim, J.H. Phantom Traffic: Platoon Formed at Low Traffic Density. J. Transp. Eng. Part A Syst. 2019, 145, 04018082. [Google Scholar] [CrossRef]
- Hong, W.; Su, M. Influence of Rapid Transit on Accessibility Pattern and Economic Linkage at Urban Agglomeration Scale in China. Open Geosci. 2019, 11, 804–814. [Google Scholar] [CrossRef]
- Campbell, K.B.; Rising, J.A.; Klopp, J.M.; Mbilo, J.M. Accessibility across transport modes and residential developments in Nairobi. J. Transp. Geogr. 2019, 74, 77–90. [Google Scholar] [CrossRef]
- Zhu, Z.; Zhang, A.; Zhang, Y. Connectivity of intercity passenger transportation in China: A multi-modal and network approach. J. Transp. Geogr. 2018, 71, 263–276. [Google Scholar] [CrossRef]
- Lee, H.-S. The networkability of cities in the international air passenger flows 1992–2004. J. Transp. Geogr. 2009, 17, 166–175. [Google Scholar] [CrossRef]
- Andreasen, M.H.; Møller-Jensen, L. Access to the city: Mobility patterns, transport and accessibility in peripheral settlements of Dar es Salaam. J. Transp. Geogr. 2017, 62, 20–29. [Google Scholar] [CrossRef] [Green Version]
- Prabhakar, N.; Anbarasi, L.J. Exploration of the global air transport network using social network analysis. Soc. Netw. Anal. Min. 2021, 11, 1–12. [Google Scholar] [CrossRef]
- Parr, J.B. Growth-pole strategies in regional economic planning: A retrospective view. Part 1. Origins and advocacy. Urban Stud. 1999, 36, 1195–1215. [Google Scholar] [CrossRef]
Figure 1.
A cost surface.

Figure 2.
Transportation Networks of the CCUA. Source: a Atlas of Traffic Mileage China (2000). Beijing, CHN: People’s Communications Publishing House. b Transport Atlas of China (2010). Shaanxi, CHN: Xi‘an Map Publishing House. c Transport Atlas of China (2000). Beijing, CHN: Sinomap press.
Figure 2.
Transportation Networks of the CCUA. Source: a Atlas of Traffic Mileage China (2000). Beijing, CHN: People’s Communications Publishing House. b Transport Atlas of China (2010). Shaanxi, CHN: Xi‘an Map Publishing House. c Transport Atlas of China (2000). Beijing, CHN: Sinomap press.


Figure 3.
Indexes for CCUA cities’ transportation field source mass.

Figure 4.
CCUA’s traffic isochronous rings.


Figure 5.
Overall field strength map of the CCUA.


Figure 6.
Radiation sphere of the CCUA.


Figure 7.
Deviation range indexes of radiation sphere in the CCUA.

Figure 8.
Evolution of deviation in the CCUA. Note: the locations of cities are plotted on the x, y axis. The height of a stick gives the deviation range index in the z dimension. Deviation range indexes are projected onto the x, z axis and the y, z axis as scatter plots. Polynomials are fit through the scatter plots on the projected axis. Polynomial curves in the x, z axis, and y, z axis show the deviation range in the east-west direction and north-south direction, respectively.

Table 1.
Indicators for the field strength model.
| Dimensions | Code | Indicator | Unit | Sources |
|---|---|---|---|---|
| Transportation infrastructure | X1 | Total highway mileage | km | [23] |
| X2 | Mileage of classified highway | km | [53] | |
| X3 | The proportion of classified highway | km | [23] | |
| X4 | Density of highway network (by population) | km/104 persons | [54] | |
| X5 | Density of highway network (by land area) | km/102 km2 | [54] | |
| Passenger transport | X6 | Highway passenger volume | 104 persons | [57] |
| X7 | Waterway passenger volume | 104 persons | [54] | |
| X8 | Airline passenger volume | 104 persons | [52,57] | |
| X9 | Turnover of highway passenger | 104 persons·km | [53] | |
| X10 | Passenger traffic density of highway | 104 persons·km/km | [58,59] | |
| Freight transport | X11 | Highway freight volume | 104 tons | [54,56] |
| X12 | Waterway freight volume | 104 tons | [54] | |
| X13 | Airline freight volume | tons | [52,56] | |
| X14 | Turnover of highway freight | 104 tons·km | [53] | |
| X15 | Freight traffic density of highway | 104 tons·km/km | [58,59] |
Table 2.
Average driving speeds of different types of traffic routes (unit: km/h).
| Year | Railway | Expressway | National Highway | Provincial Highway | County Highway |
|---|---|---|---|---|---|
| 2000 | 100 a | 90 d | 80 d | 60 d | 40 d |
| 2010 | 120 b | 100 e | 80 e | 70 e | 40 e |
| 2020 | 140 c | 100 f | 80 f | 70 f | 40 f |
Source: a Wang, D., Liu, K., and Geng, H.Z. (2001). Study on the division and study of the daily communication circle between Shanghai, Nanjing, and Hangzhou. Urban Planning Forum (05), 38–44 (in Chinese) b Pan Jinghu, Liu Weisheng and Yin Jun. (2014). The influence of prefecture-level and above cities on the hinterland and its evolution. Urban Problems (06), 37–45 (in Chinese) c Ding Ruxi and Ni Pengfei. (2017). New Pattern of China’s Economic Space: From the Perspective of Urban Real Estate. China Industrial Economics (05), 94–112 (in Chinese) d Ministry of Transport of the People’s Republic of China. (1997).Technical Standard for Highway Engineering (JTJ001-97). Beijing, CHN: China Communications Press. e Ministry of Transport of the People’s Republic of China. (2003). Technical Standard for Highway Engineering (JTG-B01-2003). Beijing, CHN: China Communications Press. f Ministry of Transport of the People’s Republic of China. (2014). Technical Standard for Highway Engineering (JTG-B01-2014). Beijing, CHN: China Communications Press.
Table 3.
Land areas for isochronous rings.
| Isochronous Traffic Rings | Area (km2) | Proportion for the Area | Ten-Year Growth Rate | |||||
|---|---|---|---|---|---|---|---|---|
| 2000 | 2010 | 2020 | 2000 | 2010 | 2020 | 2010 | 2020 | |
| 0.5 h | 18,332 | 28,496 | 46,153 | 7.45% | 11.57% | 18.74% | 55.44% | 61.96% |
| 1 h | 62,297 | 89,562 | 122,101 | 25.30% | 36.37% | 49.58% | 43.77% | 36.33% |
| 2 h | 152,402 | 180,446 | 198,864 | 61.91% | 73.28% | 80.76% | 18.40% | 10.21% |
| 3 h | 196,475 | 219,062 | 230,528 | 79.81% | 88.96% | 93.61% | 11.50% | 5.23% |
| 4 h | 218,983 | 237,072 | 244,243 | 88.95% | 96.28% | 99.18% | 8.26% | 3.02% |
| 5 h | 229,988 | 245,217 | 245,682 | 93.42% | 99.58% | 99.77% | 6.62% | 0.19% |
| 6 h | 238,986 | 246,087 | 246,138 | 97.08% | 99.94% | 99.95% | 2.97% | 0.02% |
Table 4.
Radiation spheres for CCUA cities (unit: km2).
| Year Cities | 2002 | 2010 | 2018 |
|---|---|---|---|
| Chongqing | 89,540 | 93,339 | 97,816 |
| Chengdu | 59,691 | 42,173 | 40,379 |
| Dazhou | 18,783 | 21,948 | 15,411 |
| Deyang | 5111 | 3502 | 2148 |
| Guangan | 2370 | 3110 | 3235 |
| Mianyang | 3922 | 5177 | 7732 |
| Meishan | 1817 | 1873 | 2130 |
| Nanchong | 11,476 | 12,778 | 13,256 |
| Neijiang | 4210 | 4411 | 4376 |
| Leshan | 5016 | 12,299 | 12,766 |
| Luzhou | 15,466 | 5140 | 8628 |
| Suining | 6085 | 7537 | 5689 |
| Yaan | 11,157 | 12,405 | 12,177 |
| Yibin | 7008 | 10,728 | 10,489 |
| Ziyang | 993 | 3979 | 4900 |
| Zigong | 3540 | 4918 | 4207 |
Publisher’s Note: MDPI stays neutral with regard to jurisdictional claims in published maps and institutional affiliations. |
© 2021 by the authors. Licensee MDPI, Basel, Switzerland. This article is an open access article distributed under the terms and conditions of the Creative Commons Attribution (CC BY) license (https://creativecommons.org/licenses/by/4.0/).
Share and Cite
MDPI and ACS Style
Yao, Z.; Ye, K.; Xiao, L.; Wang, X. Radiation Effect of Urban Agglomeration’s Transportation Network: Evidence from Chengdu–Chongqing Urban Agglomeration, China. Land 2021, 10, 520. https://0-doi-org.brum.beds.ac.uk/10.3390/land10050520
AMA Style
Yao Z, Ye K, Xiao L, Wang X. Radiation Effect of Urban Agglomeration’s Transportation Network: Evidence from Chengdu–Chongqing Urban Agglomeration, China. Land. 2021; 10(5):520. https://0-doi-org.brum.beds.ac.uk/10.3390/land10050520
Chicago/Turabian StyleYao, Zhangfeng, Kunhui Ye, Liang Xiao, and Xiaowei Wang. 2021. "Radiation Effect of Urban Agglomeration’s Transportation Network: Evidence from Chengdu–Chongqing Urban Agglomeration, China" Land 10, no. 5: 520. https://0-doi-org.brum.beds.ac.uk/10.3390/land10050520
Note that from the first issue of 2016, this journal uses article numbers instead of page numbers. See further details here.