Article

Study on the Spatial Classification of Construction Land Types in Chinese Cities: A Case Study in Zhejiang Province

1
Faculty of Geographical Science, Beijing Normal University, Beijing 100875, China
2
Academy of Disaster Reduction and Emergency Management, Beijing Normal University, Beijing 100875, China
3
Key Laboratory of Environmental Change and Natural Disaster, Ministry of Education, Beijing Normal University, Beijing 100875, China
4
State Key Laboratory of Surface Processes and Resource Ecology, Beijing Normal University, Beijing 100875, China
*
Author to whom correspondence should be addressed.
Submission received: 24 February 2021 / Revised: 9 May 2021 / Accepted: 11 May 2021 / Published: 13 May 2021
(This article belongs to the Section Urban Contexts and Urban-Rural Interactions)

Abstract

:
Identifying the land-use type and spatial distribution of urban construction land is the basis of studying the degree of exposure and the economic value of disaster-affected bodies, which are of great significance for disaster risk predictions, emergency disaster reductions, and asset allocations. Based on point of interest (POI) data, this study adopts POI spatialization and the density-based spatial clustering of applications with noise (DBSCAN) algorithm to accomplish the spatial classification of construction land. Zhejiang province is selected as a study area, and its construction land is divided into 11 land types using an accurate spatial classification method based on measuring the area of ground items. In the research, the POI dataset, which includes information, such as spatial locations and usage types, was constructed by big data cleaning and visual interpretation and approximately 620,000 pieces in total. The overall accuracy of the confusion matrix is 76.86%, which is greatly improved compared with that constructed with EULUC data (61.2%). In addition, compared with the official statistical data of 11 cities in Zhejiang Province, the differences between the calculated spatial proportions and statistics are not substantial. Meanwhile, the spatial characteristics of the studied land-use types are consistent with the urban planning data but with higher accuracy. The research shows that the construction land in Zhejiang Province has a high degree of land intensity, concentrated assets, and high economic exposure. The approach proposed in this study can provide a reference for city management including urbanization process, risk assessment, emergency management and asset allocation.

1. Introduction

Urban buildings are the most important places in which human social and economic activities occur, and exposure analyses of land-use types and economic values are of great significance for disaster risk assessments and emergency mitigation strategies [1]. With the rapid development of urbanization, urban land use, and spatial structures are undergoing significant changes, and the highly segmented division of labor in social industries imposes more refined and efficient requirements for urban spatial planning [2,3,4]. However, the traditional identification method of land-use types based on remote sensing and actual observation data requires considerable time and economic costs, and the data quality and update speed are also subject to the interference of weather and human-related factors [5]. In recent years, the extensive use of big data, such as Global System for Mobile (GSM), Global Position System (GPS), Point of Interest (POI), Smart Card Data (SCD), taxi trajectory and night light data has made it possible to acquire high-quality and large-scale spatial data quickly [6], which promotes the study of existing urban structure and functional areas.
Extracting land cover by remote sensing has been extensively used [7]. Land cover maps represent spatial information on different types of physical coverage of the Earth’s surface, e.g., forests, grasslands, croplands, lakes, wetlands [8]. Different from land cover, land use is widely understood as a man-made adjustment of the land surface and the types usually include farmlands, parks, residential areas, etc. [9]. At present, scholars have conducted in-depth studies on the identification of urban land-use types and their interaction rules by using multisource data [10,11]. Among these studies, POI data are proven to be very practical in urban zoning studies due to their advantages of rich semantics, short acquisition cycles, low costs, fast updating speeds, objectivity and strong current situations [12,13]. For example, POI density characteristics are used for similarity measurements [14], and when combined with remote sensing data, a wide range of land distribution patterns can be identified [15]. Among them, Essential Urban Land Use Categories in China (EULUC-China) data obtained by using the random forest law have been widely applied [14]. Integrating POI with Word2Vec [16] and Place2Vec [17], the semantic model can be used to deduce the training method to detect urban land use distributions. Based on Latent Dirichlet Allocation (LDA) topic modeling technology, a statistical framework has been developed to identify regional functions and explore potential POI topics [18]. Using POI as metadata and combining human mobility information to develop the framework of discovers regions of different functions (DROF), the relationship between regional land-use types and POI can be expressed in the form of a function [19]. POI and mobility data are utilized to identify urban functional areas by head/tail breaks and kernel density clustering [20], among other methods. Studies have attempted to research the relationship between POI information and urban land-use types from different perspectives. These studies include not only mining the POI attribute information and the distribution model of density frequency [21] but also mining the complementary relationships between POI data and other data types which include remote sensing, social media, road network and building footprint [22,23].
Clustering algorithms have been widely applied in the field of urban land-use type recognition [16,17,24,25]. There are two main methods depending on whether the attribute characteristics of geographical entities have obvious spatial correlation or not. In the case of spatial correlation, clustering is carried out based on the spatial autocorrelation, suitable for researches that location information is dominant. In another case, clustering focuses on individual differences and correlation analyses of the element’s own attributes. The Density-Based Spatial Clustering of Applications with Noise (DBSCAN) algorithm is a representative density-based clustering algorithm [26]. A cluster in DBSCAN is defined as the largest set of points connected by density, and its shape can be arbitrary. Due to the density in the noise area is lower than that in any cluster [27,28], the DBSCAN algorithm can effectively identify noise points in the research data. To identify regional industrial distributions and spatial structures under the spatial proximity effect, DBCSAN can be used to mine the spatial characteristics of ground-based objects in aggregation distributions.
To summarize, existing studies on the spatial classification of construction land types are exploring different approaches, but are still in infancy considering the availability of the classification results. There are few categories, and the spatial classification standards for specific use types are not unified. Based on POI data resources and measured data of the spatial occupation area of various land-use types, combined with inherent social and economic characteristics, such as residential complexes and commercial complexes, this study carries out spatial research on land-use types of construction land to provide support for accurate social and economic risk assessments and other work. This paper is structured as follows: Section 2 explains the sources of main data and classification methods; Section 3 presents the classification results and analyzes the accuracy in different ways; Section 4 discusses objectives and limits of the innovative methods; Section 5 concludes the significances and applications of this research.

2. Materials and Methods

2.1. Data Source

2.1.1. POI and Classification System

The POI data used in this study are derived from the Baidu Map Services (http://lbsyun.baidu.com/ (accessed on 9 May 2021)), which is one of the most popular and largest web map service providers in China. The original point data total, approximately, 700,000 pieces of original data, including 41 first-level (Level 1) categories, such as shopping areas, medical services and government agencies and several second-level (Level 2) POI categories, which are organized by industry affiliation (http://lbsyun.baidu.com/index.php?title=lbscloud/poitags (accessed on 9 May 2021)). According to the Code for classification of urban and rural land use and planning standards of development land (GB50137-2011) [29], the POI data are reclassified into 9 Level 1 categories and 8 Level 2 categories. The POI data are classified as Level 2 categories when they cannot be accurately described using Level 1 categories. The attributes of POI data include longitude, latitude, name, address, type, administrative region, and other indicators.

2.1.2. Nighttime Light Image

The nighttime light data represent visible light (e.g., city lights, fishing-fleet lights, fires) captured by remote sensing satellites in cloudless conditions at night. The nighttime light data are obtained from the NPP/VIIRS (Suomi National Polar-Orbiting Partnership’s Visible Infrared Imaging Radiometer Suite) data provided by the National Geophysical Data Center (NGDC) of the United States. The 2018 data are used in this study with a spatial resolution of 500 m.

2.1.3. Impervious Land Data

Artificial impervious areas are predominant indicators of human settlements, which are mainly man-made structures that are composed of any material that impedes or prevents natural infiltration of water into the soil [30]. The urban impervious land data are selected from GAIA data [31], a yearly dynamic raster product with a spatial resolution of 30 m. The data are clipped and merged to obtain spatial range data of the impervious land in Zhejiang Province in 2018.

2.1.4. Road Network

The Zhejiang road network data are obtained from the Baidu Electronic Map and include national roads, provincial roads, county roads, township roads, and village roads.

2.1.5. Land-Use Data

The land-use data of non-construction land in Zhejiang Province are selected from the global land cover data of FROM-GLC [32] with a spatial resolution of 30 m. The raster data are clipped to obtain the land cover of non-construction land in Zhejiang Province.

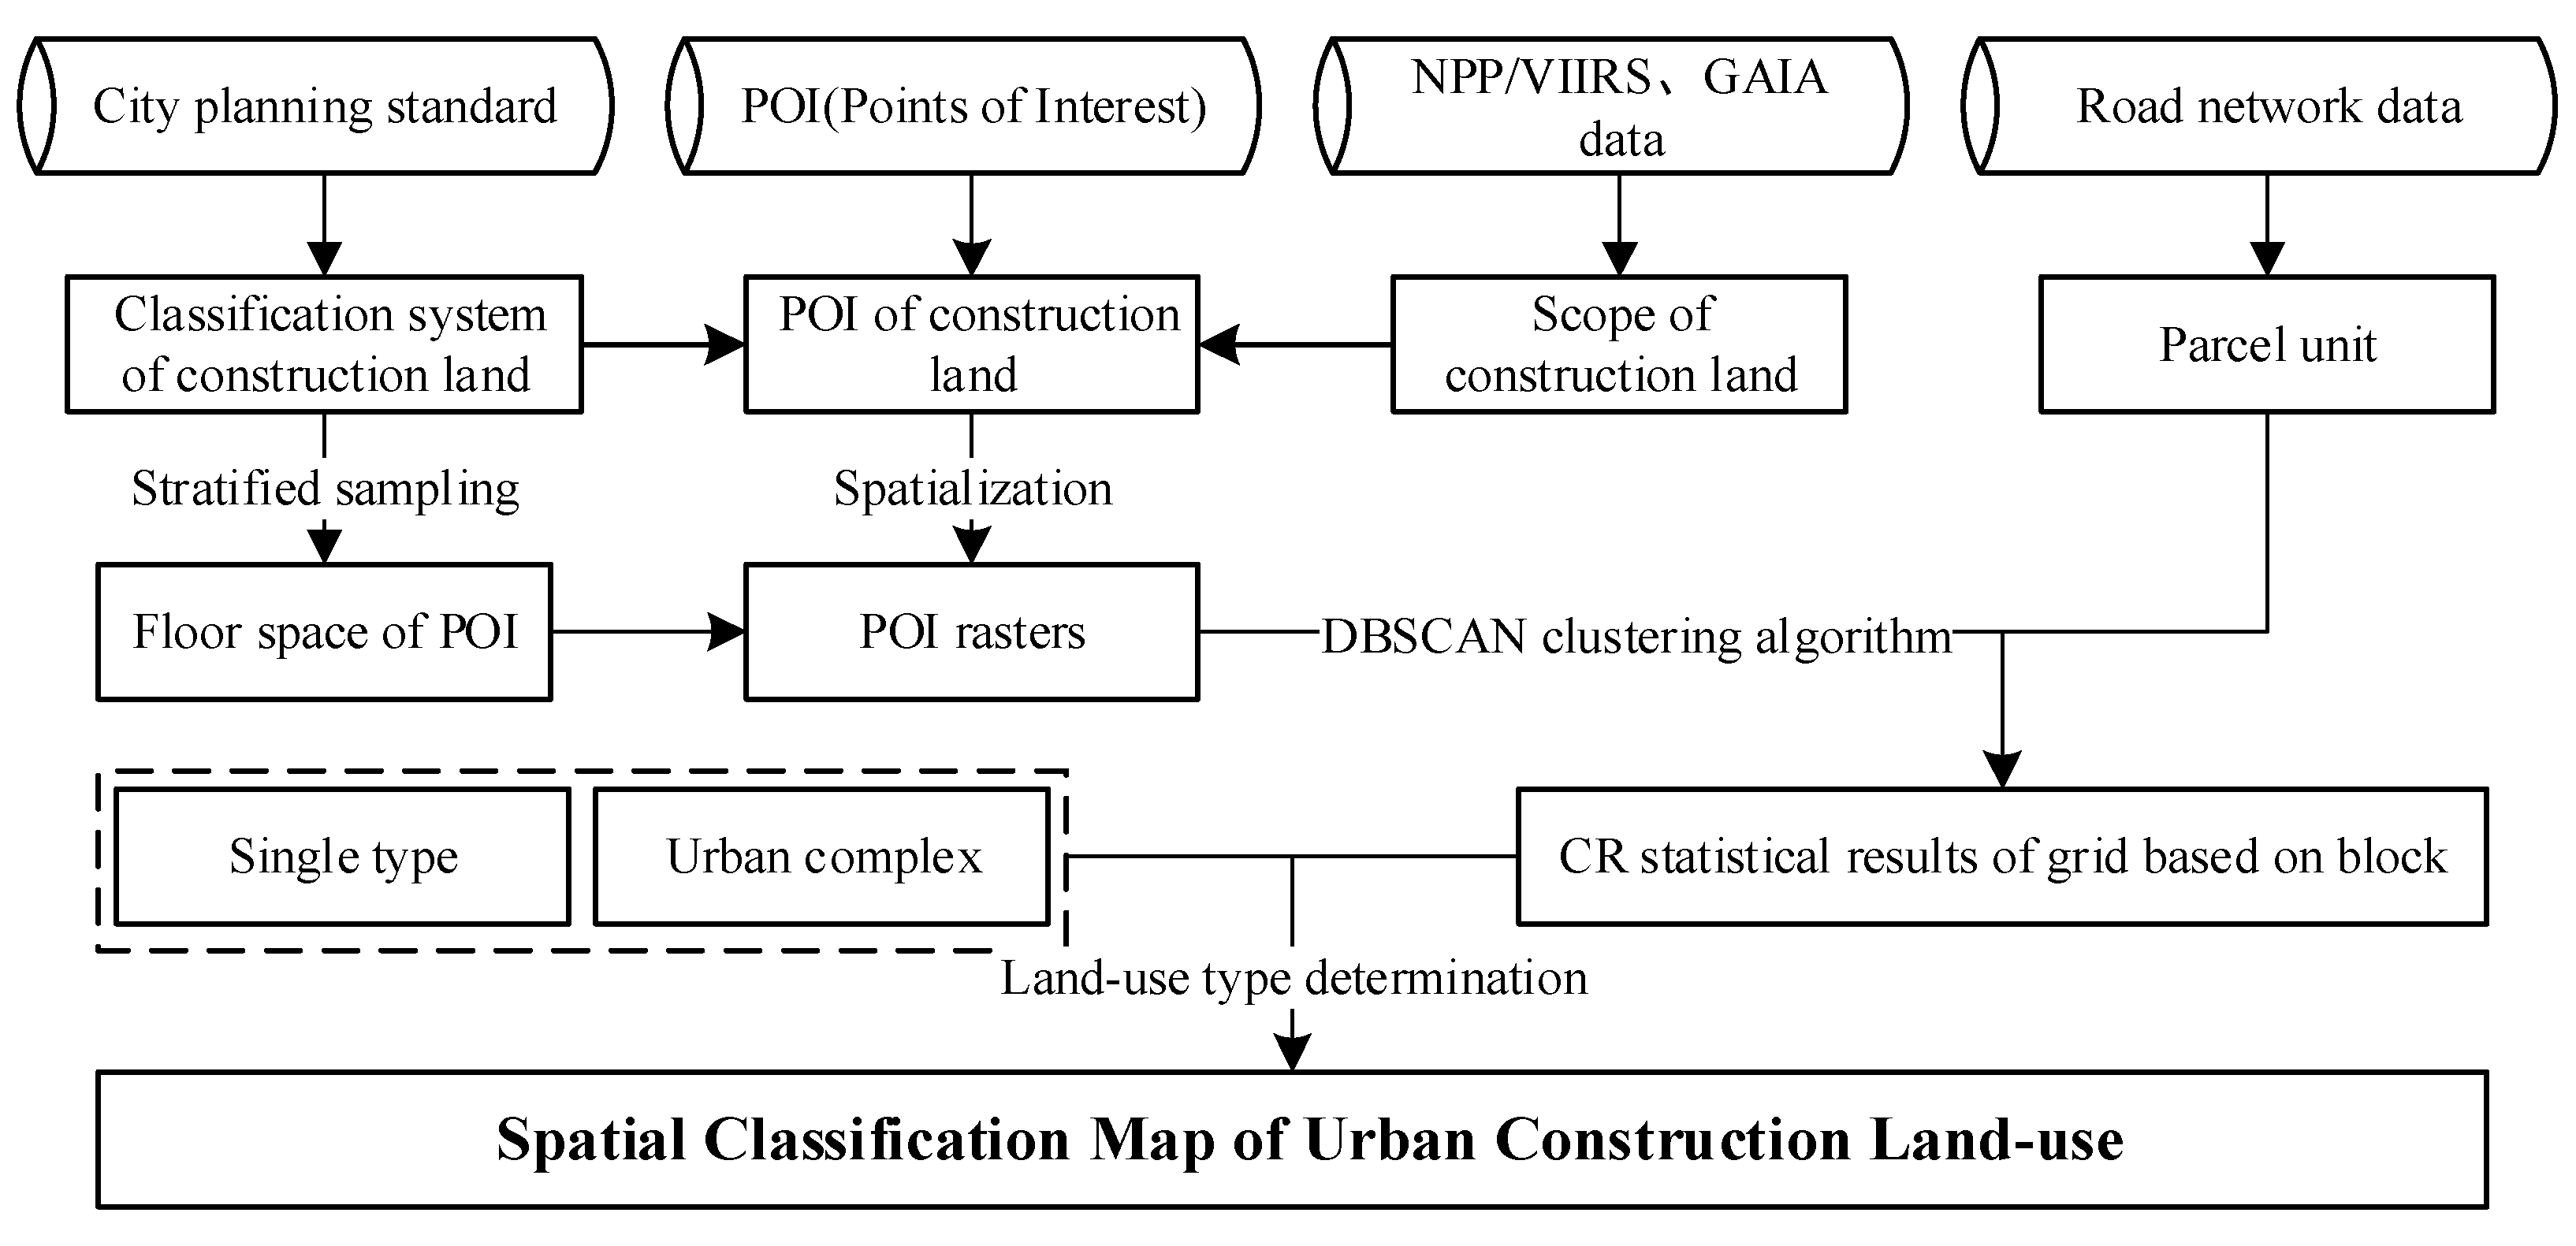
2.2. Classification Method

The overall methodological procedures of the research are shown in Figure 1. First, the original POI system is reclassified according to the Current land use classification (GB/T 21010-2017) [33], and remote sensing images are used to sample tests and estimate the occupation area of each type of ground objects. Second, the impervious land data are optimized by nighttime remotely sensed data to obtain the construction land scope of the study area and the ground areas are served as the basis to get POI grids of the construction land. Then, DBSCAN spatial clustering is carried out for the POI grids, and the parcels composed of closed road networks are taken as a unit [34] to calculate the distribution and proportion of all types of grids in the block. Finally, the land use type of per parcel is judged by statistical results and classification rules, and a spatial distribution map of urban construction land use types, including single types and urban complexes, is obtained.

2.2.1. Measurement of Floor Area by Visual Interpretation

According to the Code for classification of urban and rural land use and planning standards of development land and in accordance with the principle of universality and with the consistency of the POI classification [35,36], the original POI is reclassified, and a new classification system of urban construction land use types based on the reclassified POI is established. A sampling survey is used to extract approximately 100 samples from each category of target features under the Level 2 system, and remote sensing images are used to estimate the ground area. The overall trend of the original data of the sample area presented a positively skewed distribution, and the logarithmic trend showed a normal distribution (Figure A1).
The expectation of a normal distribution is taken as the estimated land area of the corresponding category of ground objects and as the basis and foundation of the POI spatialization to match the POI location information and land area scale. The corresponding relationship between the POI reclassification system and the area estimation results is shown in Table 1.

2.2.2. Assigning the Spatial Attributes of Urban Construction Land

As for any point i, the nuclear density of the POI, which is P i , is calculated as follows:
P i = 1 n π R 2 × j = 1 n K j ( 1 D i j 2 R 2 ) 2
where K j is the weight of point j, D i j is the Euclidean distance between spatial points i and j, R is the bandwidth of the calculation rule area ( D i j < R), and n is the number of points j in the calculation area. A 500-m bandwidth is selected according to the existing research results [37] to obtain the grid result of the kernel density calculation. Due to the agglomeration and scale effects of cities and towns, the POI density in urban built-up areas is higher than that in suburban and rural nonconstruction land areas.
The NTL and POI comprehensive index method [38,39] can be used to optimize the method of directly using nighttime lights and solve the problems of light overflow and low resolution. Based on the premise that the nighttime light data and POI data have the same weight, the average value method is selected to integrate the positive correlation between the two datasets and urban construction land, eliminate the transient noise of the nighttime light data, and correct the abnormal light value points. The calculation formula is as follows:
P O I N T L i = P i × N T L i
where P O I N T L i is the NTL and POI composite index, P i is the kernel density value of point i, and N T L i is the brightness value of the nighttime light at point i. Finally, by referring to the characteristics of the study area, the threshold value P O I N T L i was changed to 13 on the basis of the NTL and POI composite index method [31,32,34] to extract the initial urban construction land scope, and the intersecting operation was carried out with the data of the impervious land area. Then, the final extraction results of construction land are obtained after verification and modification of the original results.

2.2.3. Density-Based Spatial Clustering of Applications with Noise

Because some categories are not suitable for clustering, like street and transportation, a cluster feasibility determination is performed for all land-use types except residential land to identify clustering targets. All land-use types with aggregation and distribution characteristics are selected and shown in Table 2, including the following 7 types: type 03 industrial areas, type 41 government agencies, social institutions, service-oriented venues, type 43 schools and scientific research institutions, type 51 convention and exhibition centers, commercial venues, type 52 comprehensive markets, shopping malls, and other large entertainment and leisure places, type 53 commercial service institutions such as banks and gas stations, type 06 logistics storage facilities and warehouses. The points of these categories are abundant in quantity and relatively dense in distribution, showing the characteristics of aggregation distribution.
Density-based spatial clustering of applications with noise (DBSCAN) is based on the concepts of reachable density and connected density. The core idea of DBSCAN is that the number of adjacent grids in a given radius neighborhood (Eps) is greater than a given threshold (MinPts). The neighborhood shape is determined by the raster distance, dist(m,n), between two rasters, m and n. Eps and MinPts are regarded as key parameters in the clustering method, and these parameter values directly affect the quality of the clustering results. Referring to the improved, adaptive, fast AF-DBSCAN clustering algorithm put forward by Zhou Zhiping [40], 50*50 quadrangle areas are selected to fit the K-nearest neighbor (KNN) distance distribution curve by polynomial fitting, and the curve inflection point is solved to obtain the optimal value of Eps. According to the statistical distribution characteristics of the data, the mathematical expectation of the number of Eps objects in each grid is calculated to obtain MinPts as follows:
MinPts = 1 n i = 1 n P i
where n is the number of grids in the region and P i is the number of points in point i’s Eps neighborhood. The land-use type, clustering basis and parameter setting used in this calculation are shown in Table 2.
As the regions composed of clusters are not closed, many small patches are generated in the same region by clustering, on the basis of identifying the boundary patches and internal patches in the study region, a buffer algorithm is used to establish a buffer zone for patches inside the same region, and the patches are resampled to a uniform 30-m grid to obtain a complete clustering region efficiently and quickly. The buffer distance is shown in Equation (4).
L i = D i × E p s i 60
In the formula, L i is the buffer distance in the raster data of the area of land-use type i and D i and E p s i are the actual raster resolution and Eps parameter values of type i, respectively.

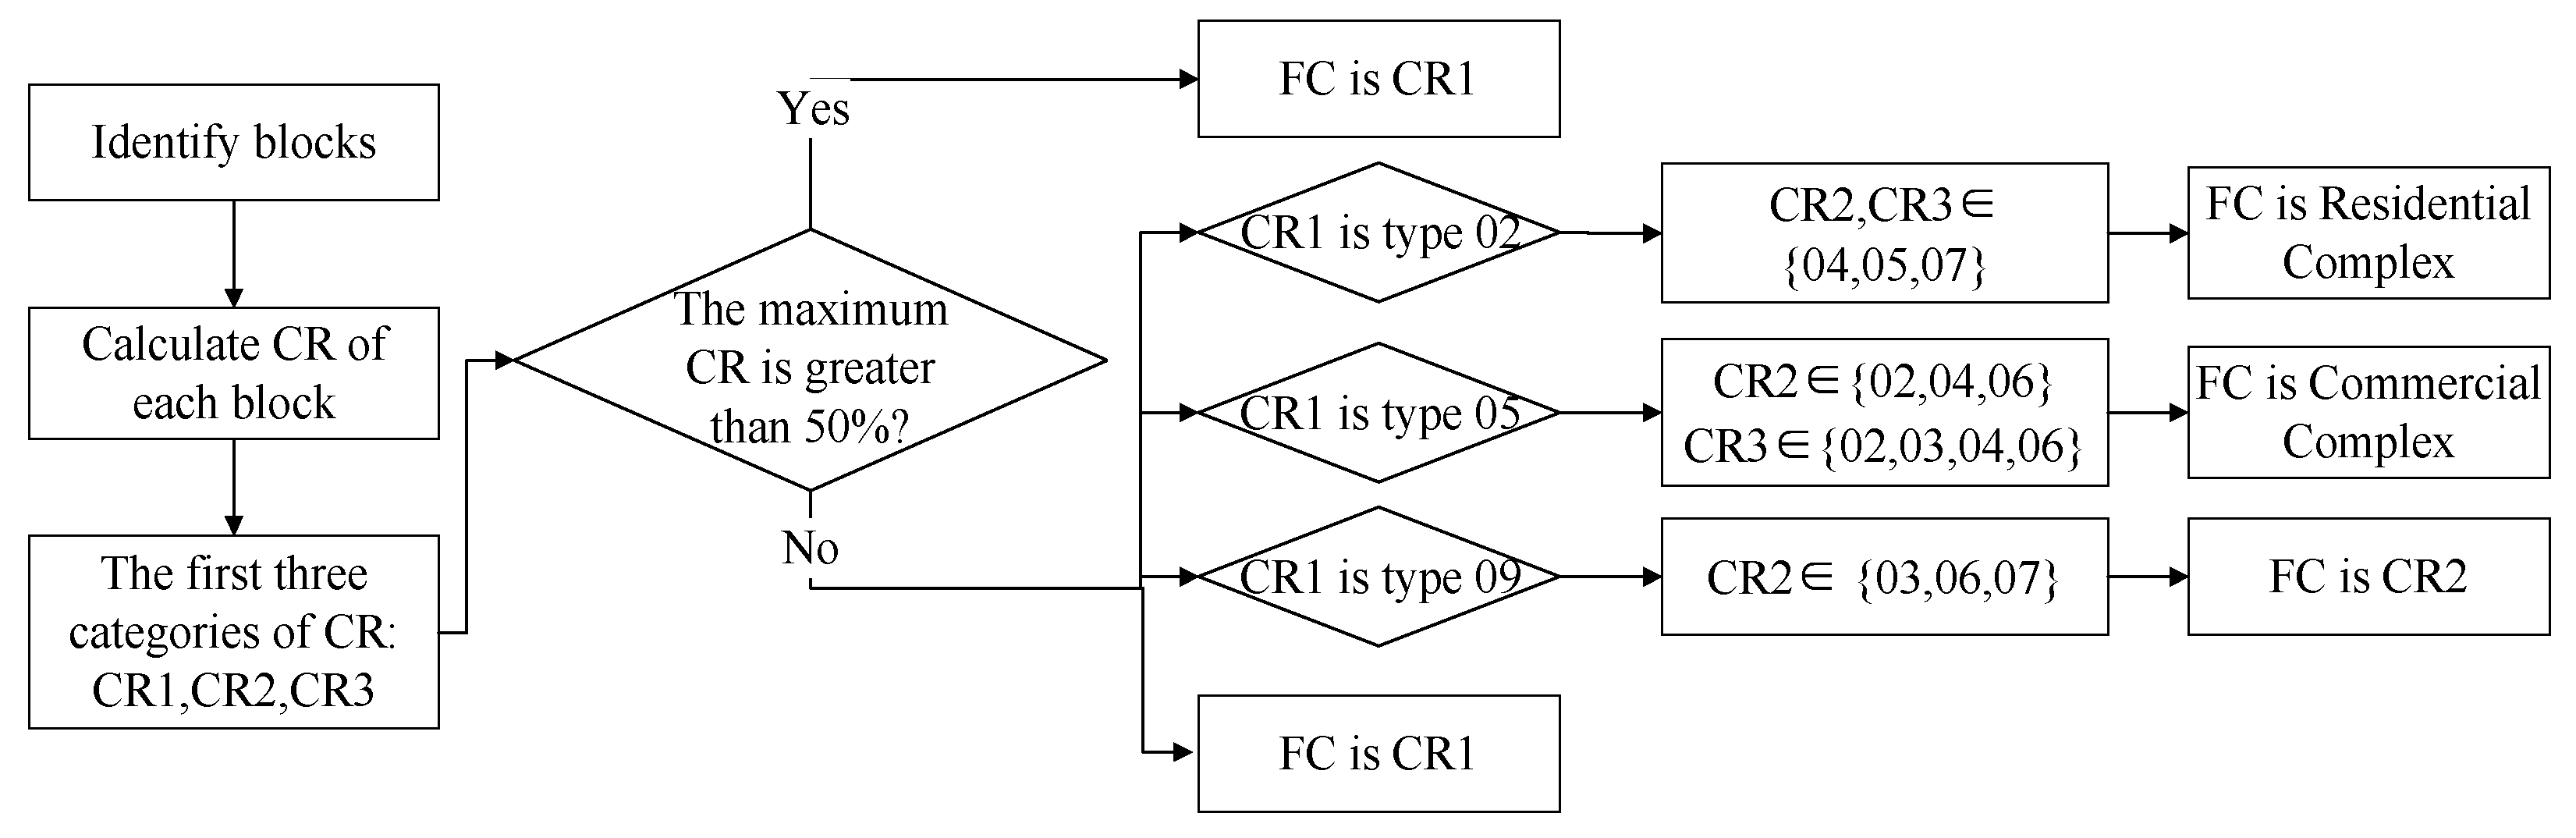
2.2.4. Classification Method Based on Parcel Unit

Considering a 30-m grid is inappreciable for the whole settlements, parcel is chosen as the elementary unit to the classification of urban construction land. After extending disconnected roads using tools provided by ArcGIS which is a map processing software, the vector surface of the road network is obtained by setting buffer zones for different levels of roads by referring to the Highway Route Design Specification (JTG D20-2017) [41]. Then, parcels within the range are identified by the road network closing rules.
Due to the low accuracy of the direct spatialization of type 02 residential land’s POI, the exclusive method is adopted to divide the no-data land (without grids of type 03–09) into type 02 residential land grids and type 09 green space grids. The target parcel of the no-data land can be divided into the 02 residential land type if there are POI residential land data in it; otherwise, the parcel can be divided into the 09 green space type. The POI proportion parameter CR is constructed to represent the proportion of the number of grids of each type in the target parcel to the total number of grids. The detailed classification rules are shown in Figure 2, wherein CR1, CR2, and CR3 represent the categories corresponding to the first, second and third CR ranking from large to small, respectively, and FC is the final category of the block determination.
The concept of urban complexes is introduced to describe the mixed land use type. Urban complexes are an organic combination of a variety of urban functions based on building groups, including functional aggregation, land use intensification and urban economic aggregation [42]. Urban complexes are introduced into land-use classification systems to more accurately describe the land-use type characteristics of mixed land-use areas [43]. A residential complex refers to a single building or building group that is dominated by residential functions and is composed of spaces with different functions, including several complex functions such as commercial, public services, and transportation functions. In this classification system, residential complexes represent a mixed type, composed of residential buildings, which are the main land type, commercial, and business facilities, administrative public service facilities, and roads, streets, and transportation facilities.
Commercial complexes are multiuse modern urban commercial facilities dominated by commercial functions that are gradually moving towards a comprehensive form integrated with various public functions, such as transportation, culture, community service, and business offices. Commercial complexes are characterized by complex functions, intensive scales and integrated operations [44] and are the product of the mixing of functions and spaces. Commercial complexes correspond to more mature mixed land-use types that are dominated by commercial and business facilities supplemented by administrative and public service facilities, residential buildings, logistics storage facilities and warehouses and replenished by industrial facilities.

3. Classification Accuracy and Results

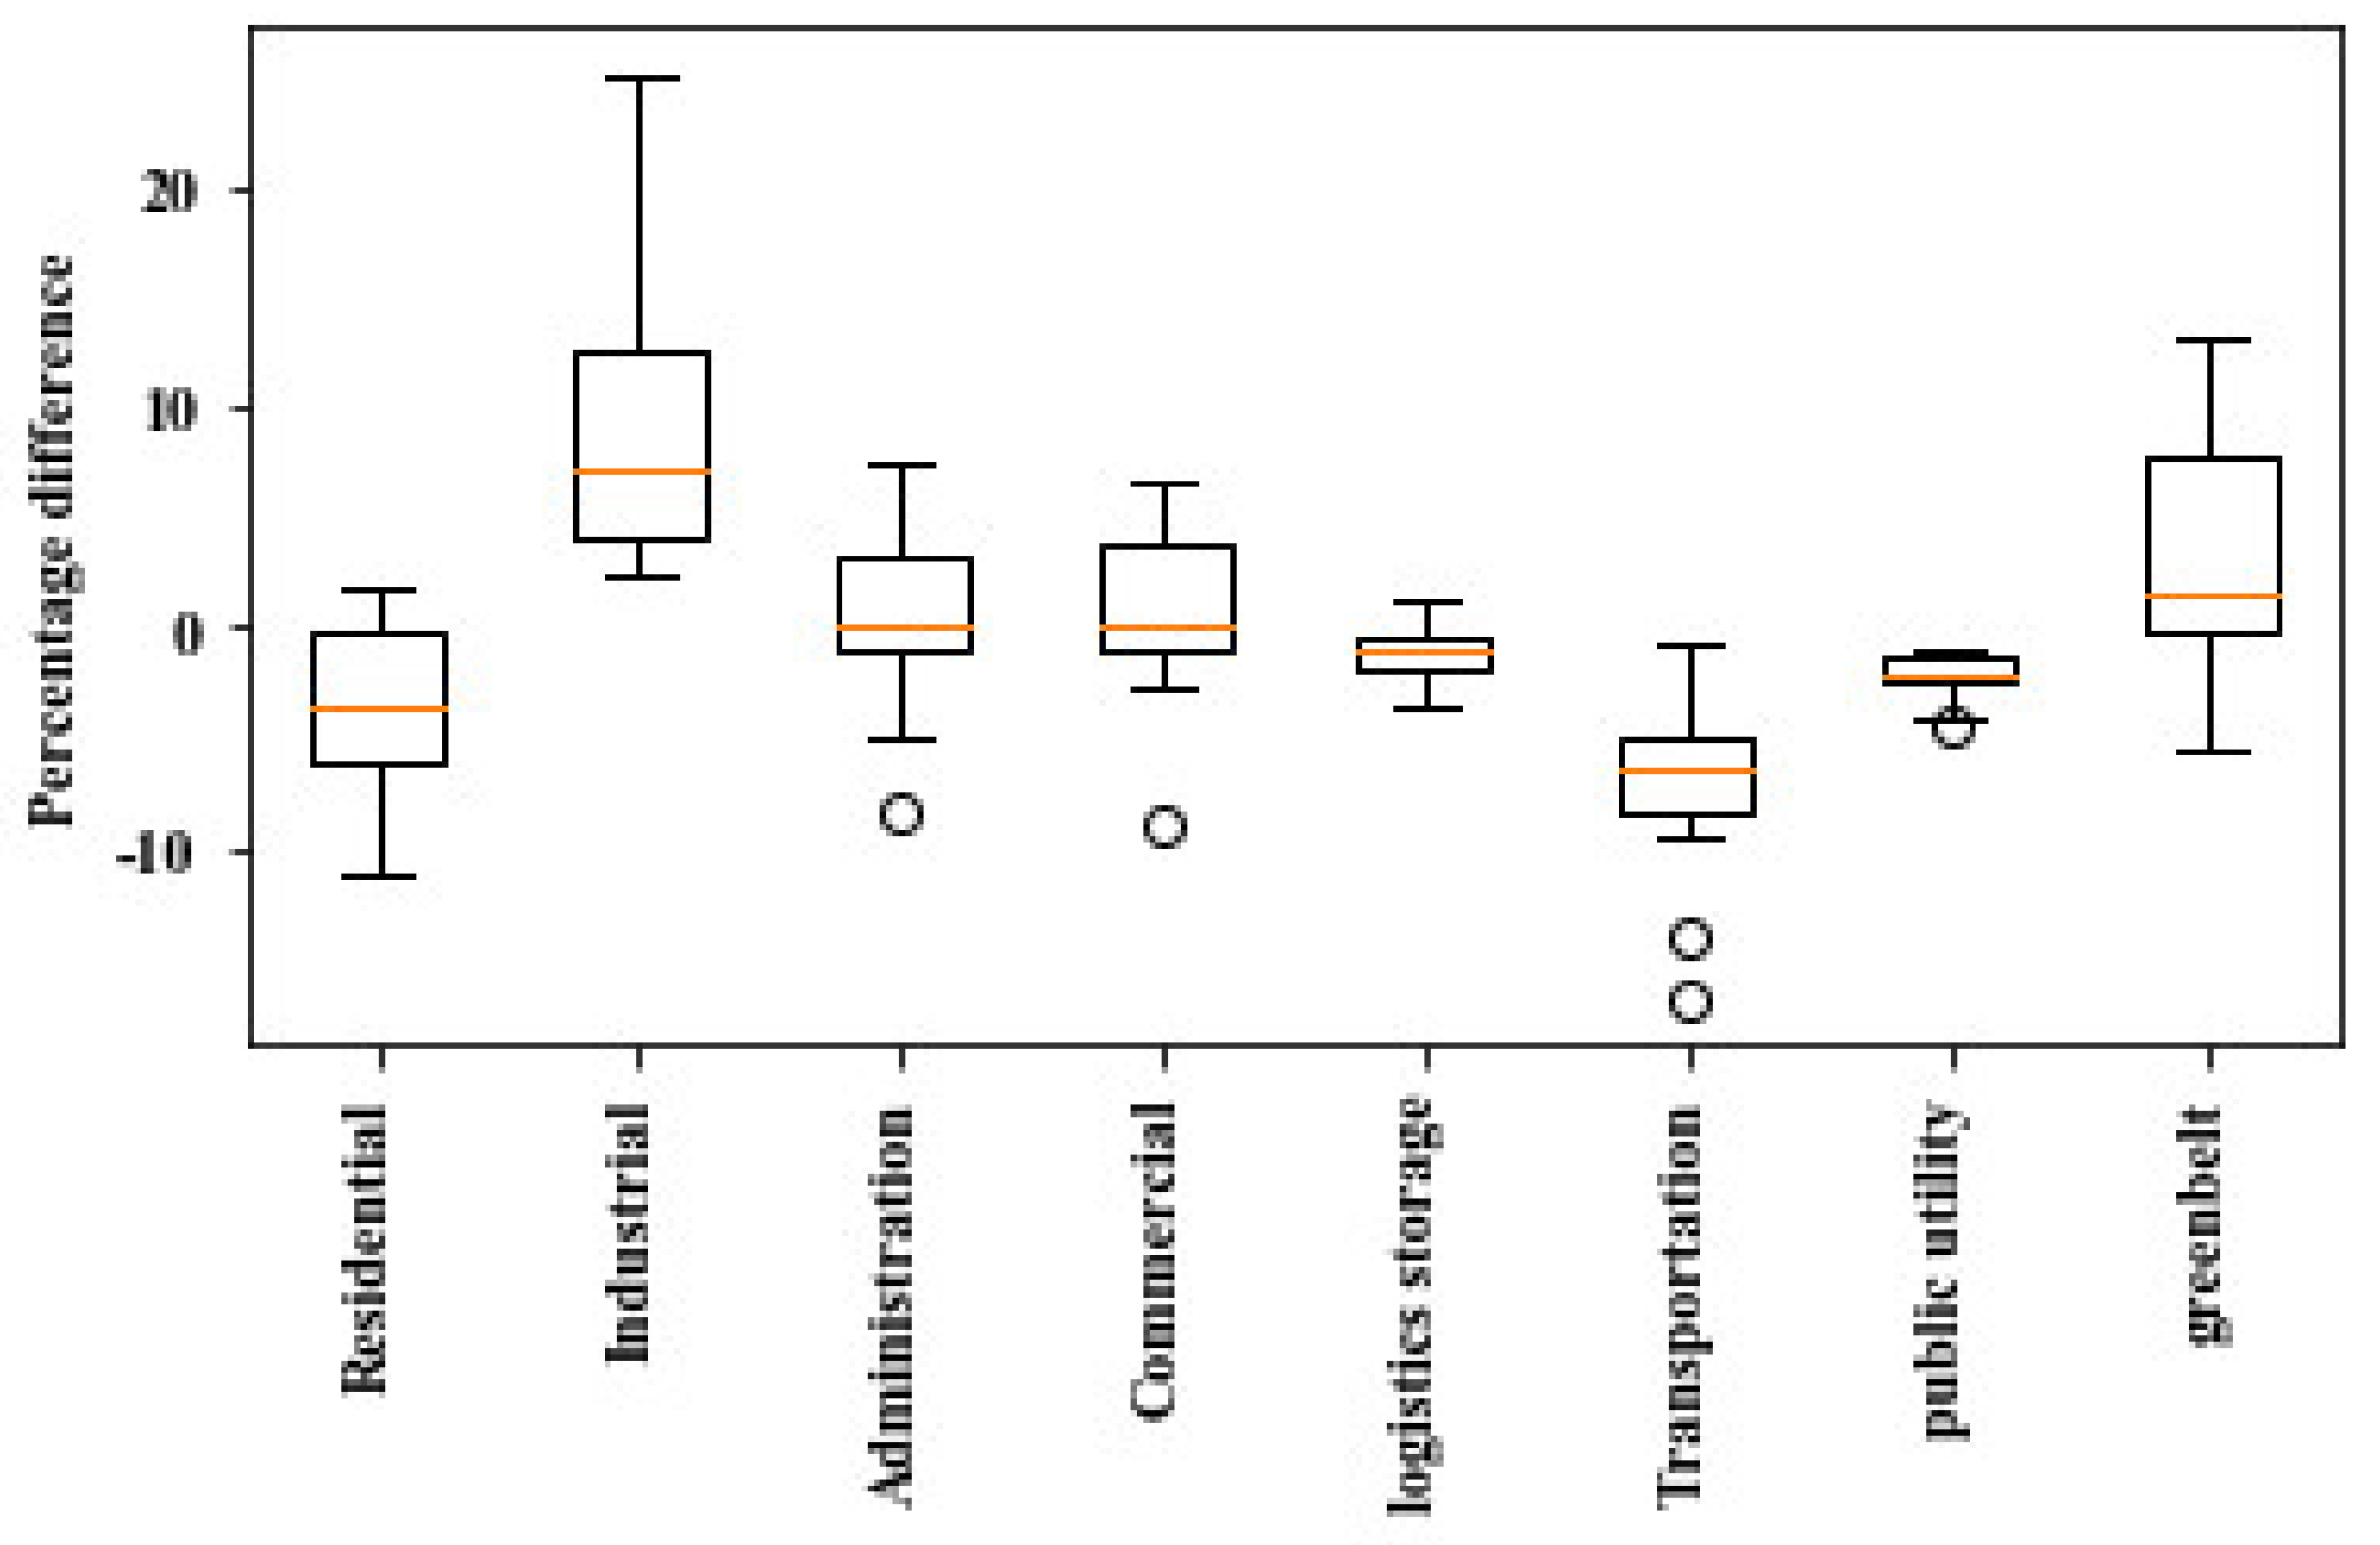
3.1. Verification of Classification Accuracy

To verify the accuracy of the spatial classification results of urban construction land-use types, a general verification based on the obtained confusion matrix and a spatial distribution verification comparing with remote sensing images are carried out. Taking 30-m grids of each land-use type as the basic units, a confusion matrix is constructed by counting the total number of matching grids and nonmatching grids of each land-use type. Since there is no one-to-one correspondence between residential or green space areas and their POIs, the matrix calculation was not involved. The analysis results show that the overall accuracy of the classification is 76.86%, and the user’s accuracy values of the various categories are shown in Table 3. In the confusion matrix, the rows are the map categories and the columns are the reference categories.
Comparing against the China Statistical Yearbook of 2018, released by China’s National Bureau of Statistics and including statistical data about various land-use types, the differences between the obtained percentages of land-use types and the percentages of yearbook-based land-use types are calculated as obtained percentage minus yearbook percentage for each land-use type for each region. Figure A2 is a boxplot of the differences. For the percentage differences, the mean absolute deviation is 4.13 percentage points. Two typical regions of Jianggan District in Hangzhou are selected to show detailed classification results as examples. The classification result map is compared with remote sensing images with road networks (supported by the Baidu Electronic Map), and the analysis shows that the classification result is basically accurate and matches the actual ground-based object distributions (Figure 3). Jianggan District, Hangzhou has good urban function agglomeration; industrial land is distributed along the river, including the Panasonic Hangzhou Industrial Park, Foxconn Qiantang Science and Technology Industrial Park, Beifang Industrial Park, etc. In the northern higher-education zone, there are many universities and research institutes which present spatial agglomeration characteristics; residential buildings and residential complexes are distributed continuously, including the Longhu-Yanlanshan Community, Xinyuan-Jinshacheng Community, and Xiasha Mingdu Community, and are interspersed with public service land and commercial service land to ensure the perfection of the residential functions. Figure 3 shows the comparison of the classification results.

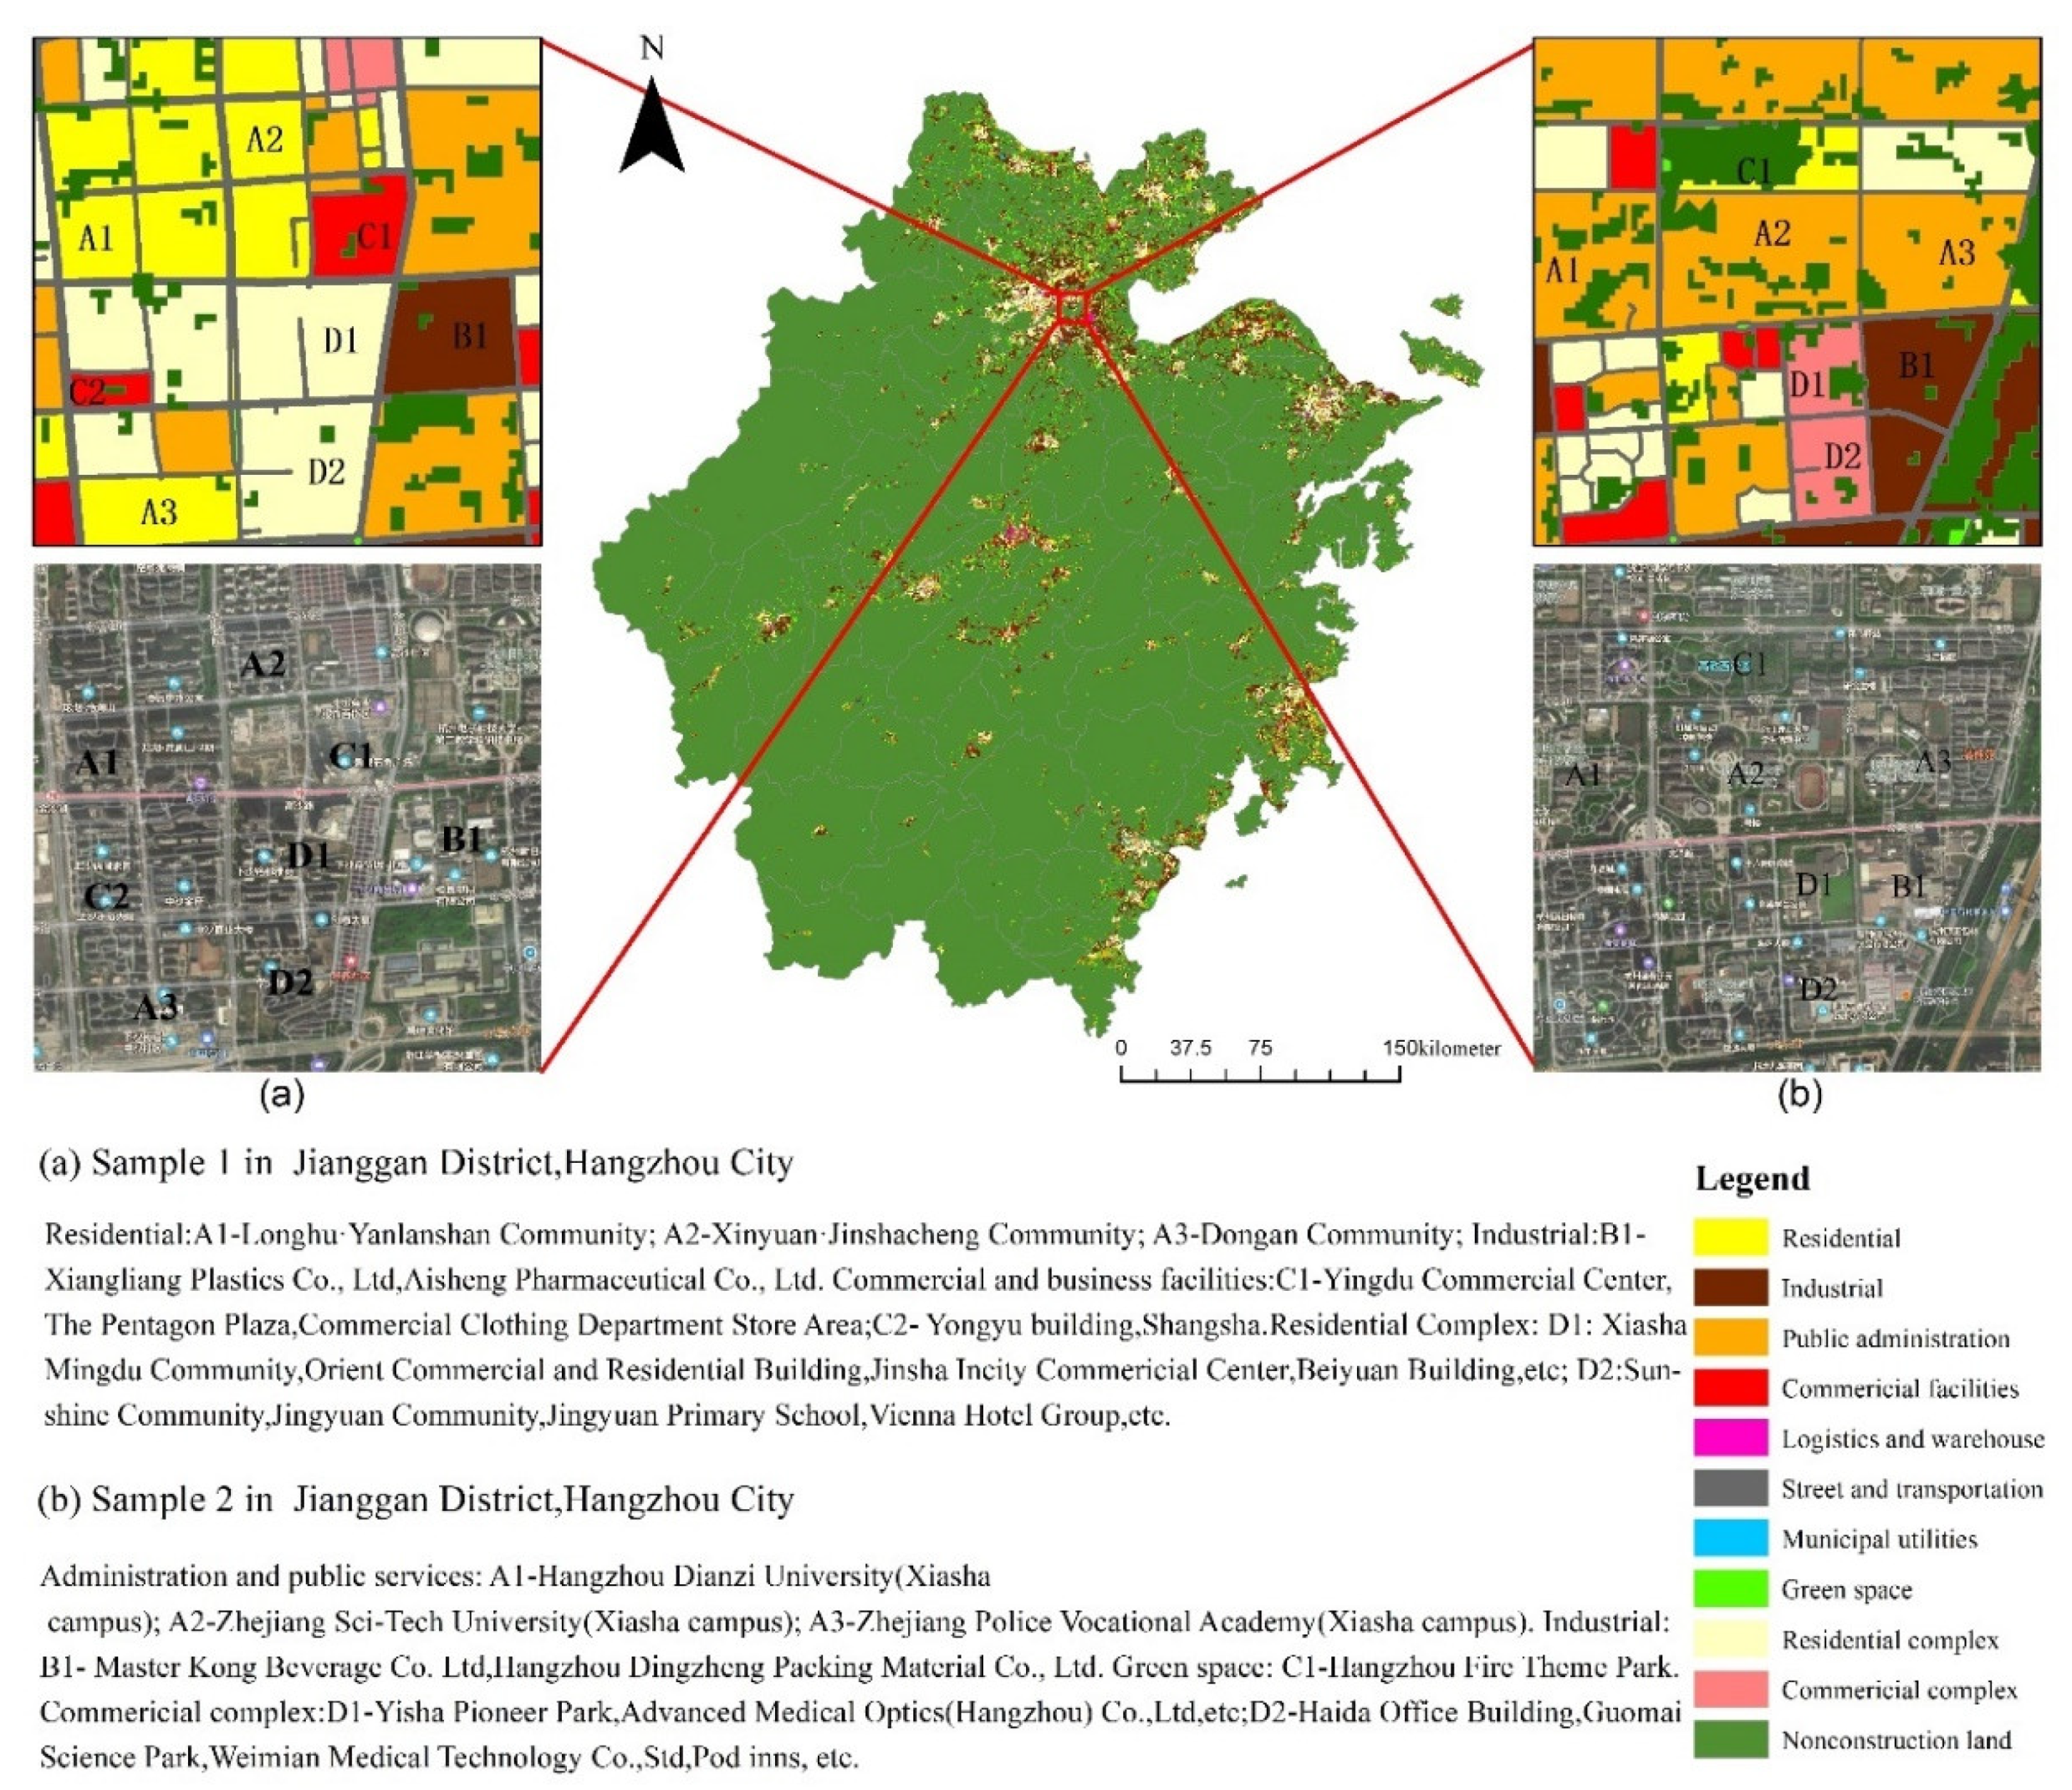
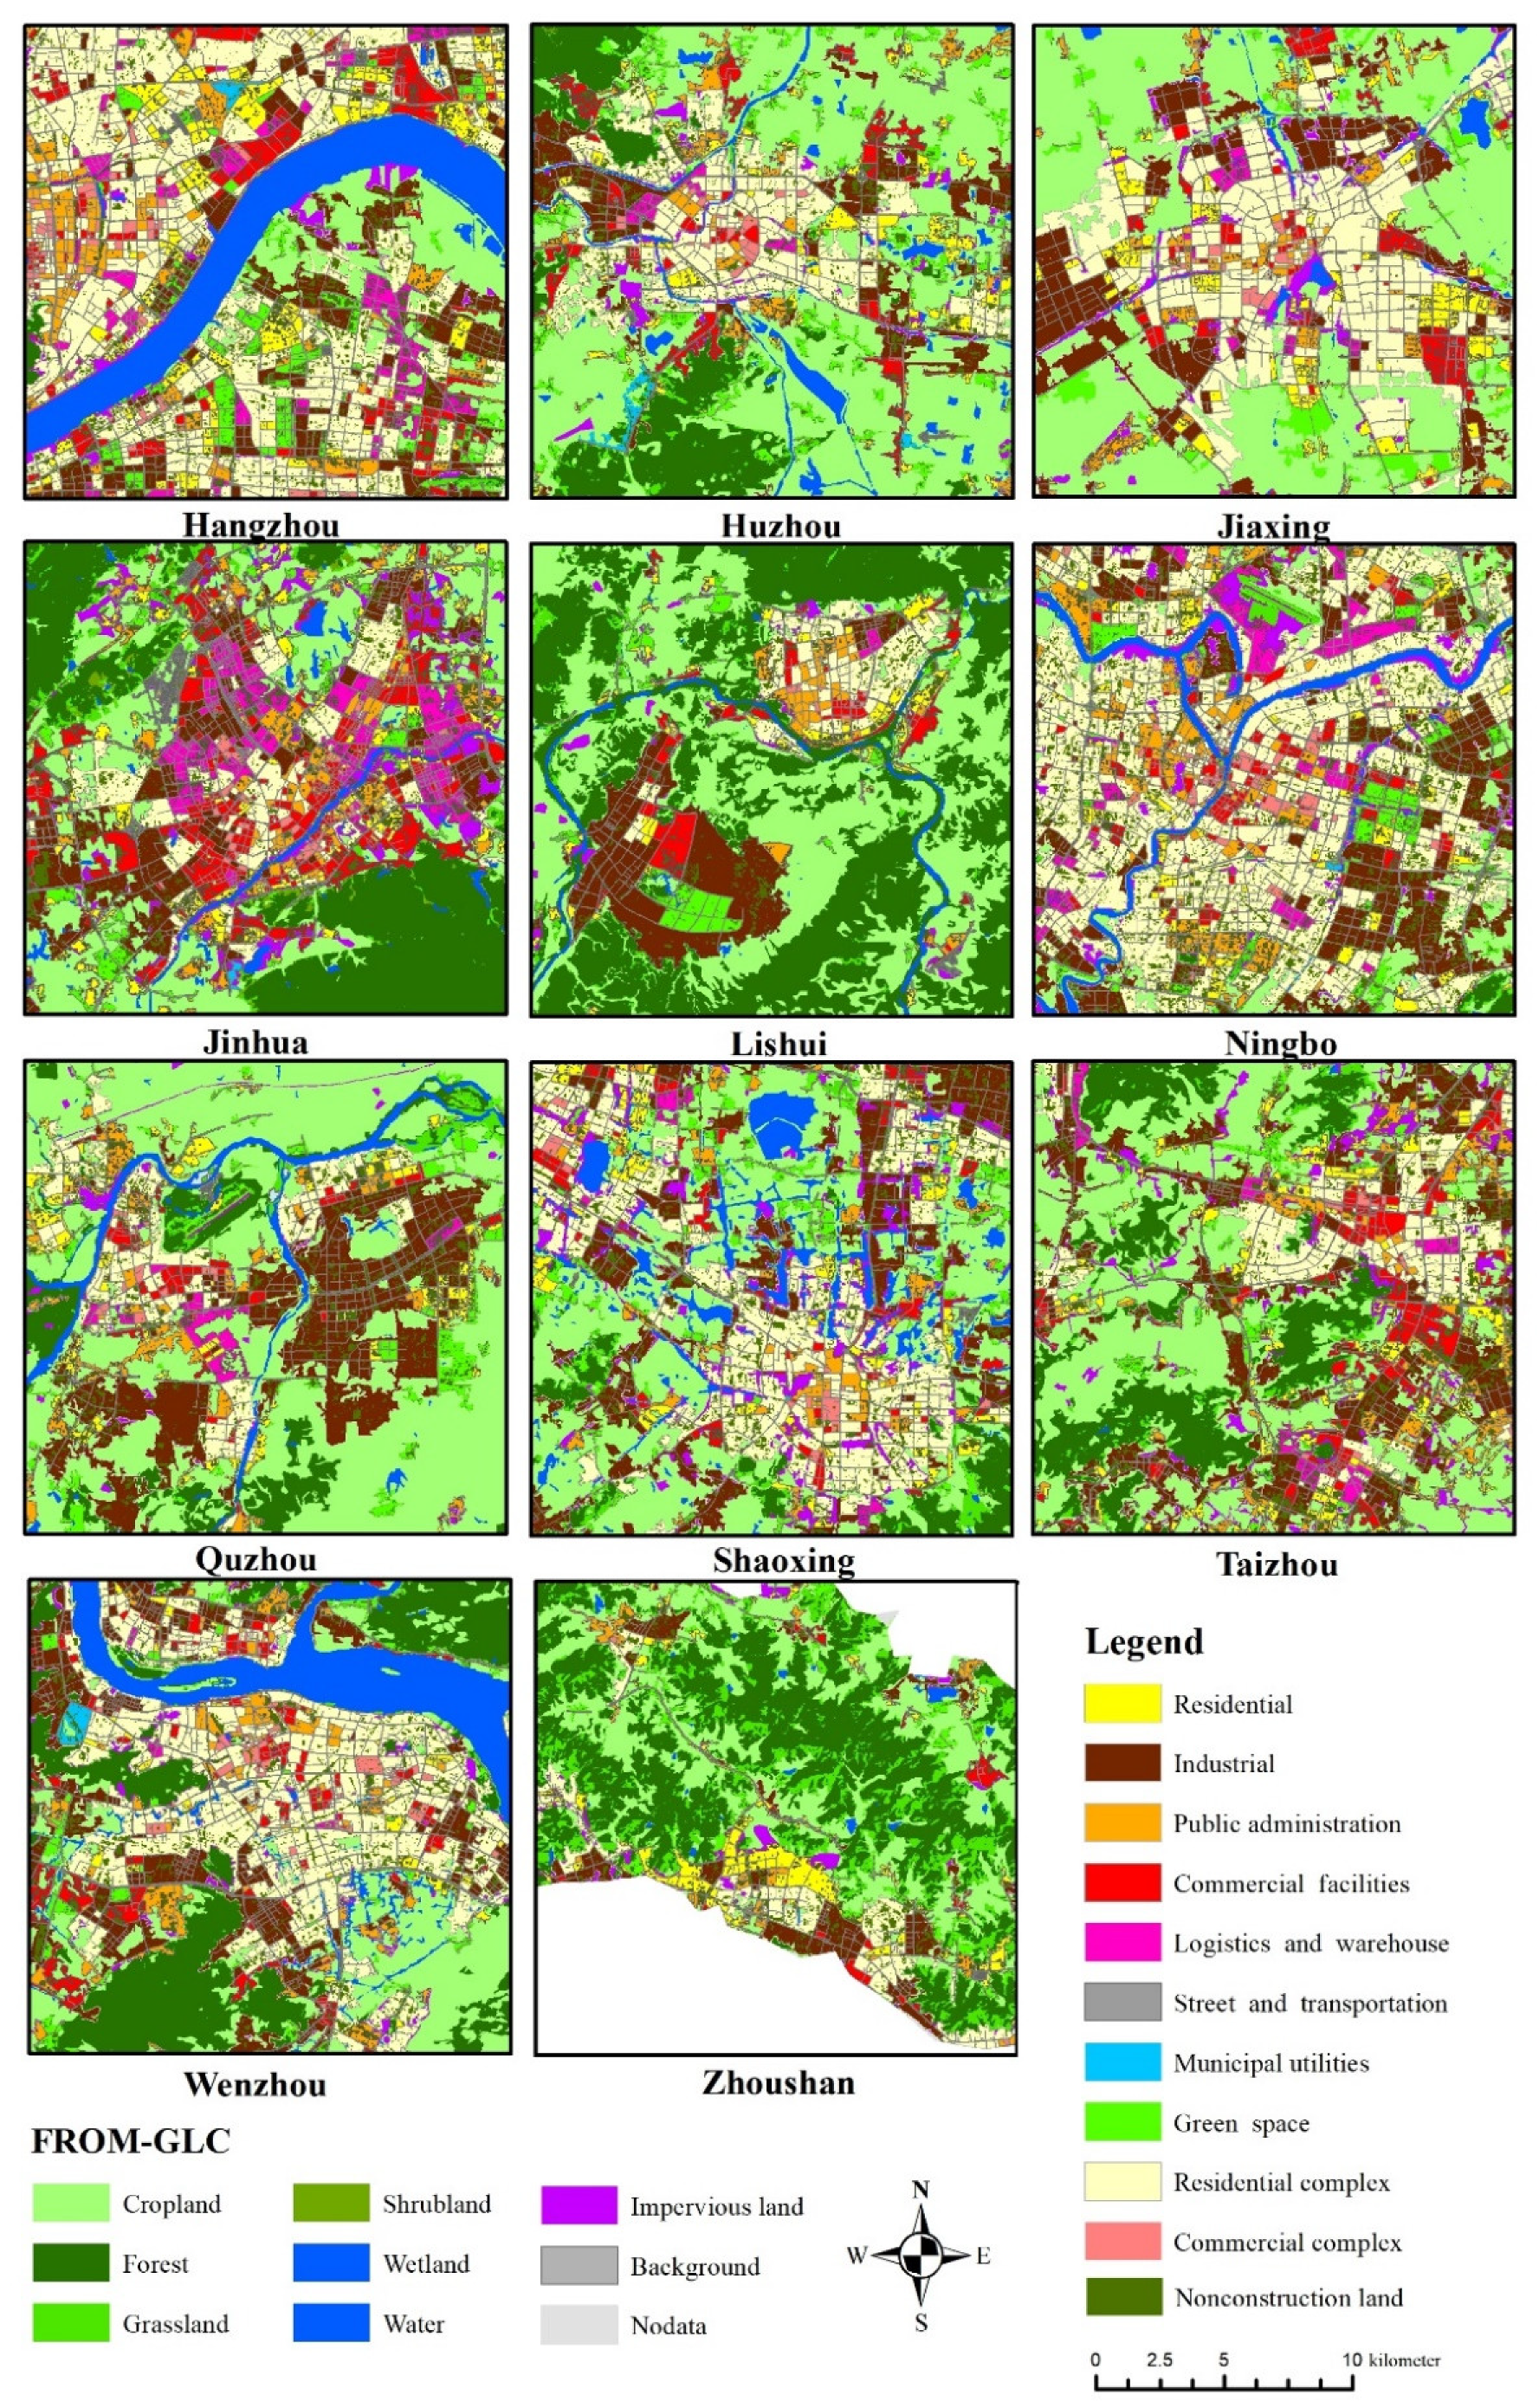
3.2. Results of the Construction Land Classification

Using the classification model, the urban construction land in Zhejiang Province is extracted and divided into 10 types: residential, industrial, administrative and public service, commercial and business facilities, logistics and warehouse, streets and transportation facilities, municipal utilities, green spaces, residential complexes, and commercial complexes. Classification maps of the central regions of 11 cities in Zhejiang Province are shown in Figure 4.
By the end of 2017, the Department of Natural Resources of Zhejiang Province announced that the construction land area was 13,116.67 square kilometers. Within our study, we calculated that the construction land area of the whole province is 12,714.19 square kilometers, which fits within the official data; the road area is 1339.93 square kilometers and is divided into 101,400 blocks. Based on the spatial classification results obtained in this paper, data regarding the land area proportion of each land-use type in 11 cities in Zhejiang Province are statistically obtained (Table 4).

4. Discussion

The POI data, a popular kind of social media data, is convenient both in generation and application. One of the main reasons why the applications of POI are limited is that there are no attributes about spatial scale. To solve the key problem, this research puts forward the concept of POI spatialization. The POI samples are obtained randomly by categories, a relatively accurate ground area is determined by the distribution of area values. Then, the POI is converted to an object with spatial scale in the form of raster. Due to various categories and individual differences, 100 samples from each category cannot fully reflect the overall trend, though can basically ensure the needs of the research. There is no doubt that the spatialization method is cost-effective, especially when compared with acquiring building footprint data. Additionally, the research can be improved in the directions of adding sample categories, increasing the amount of samples and improving probability distribution.
Urban complexes refer to the urban buildings with convergent and intensive functions. More and more complexes derived from the urban complexes appear in the modern economic system. In the process of determining the categories of construction land regions, there is a widely occurring question that too many kinds of buildings are clustered and multiple functions are interrelated in a region. With the traditional land use regulations, such regions can hardly be grouped into a single category. So we introduce the types of commercial complexes and residential complexes, which helps many parcels have a more suitable mixed-use category. The design and evaluation of the urban complexes should be included in future urban plannings and classification studies.

5. Conclusions

Based on POI spatial location and occupation area data, this research adopts raster spatial clustering, block constraints, and other methods to identify and divide urban construction land use types. On the basis of retaining the diversity and richness of parcel information to the greatest extent, this research introduces inherent socioeconomic spatial characteristics of residential complexes and commercial complexes to optimize the mixed use land classification system of urban construction land. The results of research show the following:
The POI dataset have accurate location information and rich usage type information. After cleaning, its data quality, data size, and excellent coupling ability with other data ensure its extremely high availability. Spatialization based on the statistics of the ground area helps the POI data better reflect the industrial distribution and urban layout.
The spatial classification method of construction land using spatial clustering and block constraints can ensure the natural constraints of the classification unit and fully exploit the spatial characteristics of the data. It is an effective method with strong applicability, accuracy and efficiency, and portability. The accuracy of the overall obfuscation matrix is 76.86%, which is greatly improved compared with that of the EULUC, and the calculated proportions do not deviate substantially from official statistics of all land-use types.
The spatial distribution of construction land-use types complements and improves overall urban planning and social and economic statistics, and the high-precision classification results can be used to better analyze the land-use structure. Residential complexes and commercial complexes are densely distributed in the central city regions, while industrial land is mostly distributed in the periphery of the cities, showing obvious marginal clustering, which can promote further research. Furthermore, rationality of functional zones should be paid more attention in the urban management because inappropriate plans can lead to heavy traffic, poor environmental conditions, and lack of emergency response.

Author Contributions

Conceptualization, H.Z. and Y.X.; methodology, L.D. and J.L.; software, L.D. and J.L.; formal analysis, L.D. and Y.Y.; investigation, L.D. and J.L.; resources, L.D. and Y.X.; data curation, Y.Y.; writing—original draft preparation, L.D.; writing—review and editing, X.L.; visualization, L.D.; supervision, X.L.; project administration, H.Z.; funding acquisition, H.Z. All authors have read and agreed to the published version of the manuscript.

Funding

This research was funded by the National Key Research and Development Program of China, grant number 2017YFA0604903 and 2017YFA0604904, which are funded by the Ministry of Science and Technology of the People’s Republic of China.

Data Availability Statement

The collection and preprocessing of data are in Section 2.1. The data used are primarily reflected in the article. Other relevant data are available from the authors upon request.

Conflicts of Interest

The authors declare no conflict of interest.

Appendix A

Figure A1. Sampling area distribution of industrial land after logarithm.
Land 10 00523 g0a1
Figure A2. Box plots.
Land 10 00523 g0a2

References

  1. Greenberg, M.; Goldstein, B.D.; Anderson, E.; Dourson, M.; Landis, W.; North, D.W. Whither Risk Assessment: New Challenges and Opportunities a Third of a Century After the Red Book. Risk Anal. 2015, 35, 1959–1968. [Google Scholar] [CrossRef] [PubMed]
  2. The World Bank. Available online: https://documents.worldbank.org/en/publication/documents-reports/documentdetail/229791468159607825/economics-of-coastal-zone-adaptation-to-climate-change (accessed on 15 January 2021).
  3. Wu, J.; Han, G.; Zhou, H.; Li, N. Economic development and declining vulnerability to climate-related disasters in China. Environ. Res. Lett. 2018, 13, 034013. [Google Scholar] [CrossRef]
  4. Adger, W.N. Vulnerability. Glob. Environ. Chang. 2006, 16, 268–281. [Google Scholar] [CrossRef]
  5. Li, G.; Sun, S.; Fang, C. The varying driving forces of urban expansion in China: Insights from a spatial-temporal analysis. Landsc. Urban Plan. 2018, 174, 63–77. [Google Scholar] [CrossRef]
  6. Neuhaus, F. Emergent Spatio Temporal Dimensions of the City; Springer: Cham, Switzerland, 2015; pp. 13–36. [Google Scholar] [CrossRef]
  7. Foody, G.M. Status of land cover classification accuracy assessment. Remote Sens. Environ. 2002, 80, 185–201. [Google Scholar] [CrossRef]
  8. Copernicus Global Land Services. Available online: https://land.copernicus.eu/global/products/lc (accessed on 20 March 2021).
  9. Xie, H. Towards Sustainable Land Use in China: A Collection of Empirical Studies. Sustainability 2017, 9, 2129. [Google Scholar] [CrossRef] [Green Version]
  10. Zhong, Y.; Su, Y.; Wu, S. Open-source data-driven urban land-use mapping integrating point-linepolygon semantic objects: A case study of Chinese cities. Remote Sens. Environ. 2020, 247, 111838. [Google Scholar] [CrossRef]
  11. Soliman, A.; Soltani, K.; Yin, J. Social sensing of urban land use based on analysis of twitter users’ mobility patterns. PLoS ONE 2017, 12, e0181657. [Google Scholar] [CrossRef] [Green Version]
  12. McKenzie, G.; Janowicz, K.; Gao, S. Poi pulse: A multi-granular, semantic signature-based information observatory for the interactive visualization of big geosocial data. Cartographica 2015, 50, 71–85. [Google Scholar] [CrossRef]
  13. Gong, P.; Chen, B.; Li, X. Mapping essential urban land use categories in china (EULUC-China): Preliminary results for 2018. Sci. Bull. 2020, 65, 182–187. [Google Scholar] [CrossRef] [Green Version]
  14. Hu, T.; Yang, J.; Li, X.; Gong, P. Mapping Urban Land Use by Using Landsat Images and Open Social Data. Remote Sens. 2016, 8, 151. [Google Scholar] [CrossRef]
  15. Li, X.; Hu, T.; Gong, P.; Du, S.; Chen, B.; Li, X.; Dai, Q. Mapping Essential Urban Land Use Categories in Beijing with a Fast Area of Interest (AOI)-Based Method. Remote Sens. 2021, 13, 477. [Google Scholar] [CrossRef]
  16. Yao, Y.; Li, X.; Liu, X.; Liu, P.; Liang, Z.; Zhang, J.; Mai, K. Sensing spatial distribution of urban land use by integrating points-of-interest and google word2vec model. Int. J. Geogr. Inf. Sci. 2017, 31, 825–848. [Google Scholar] [CrossRef]
  17. Zhai, W.; Bai, X.; Shi, Y. Beyond word2vec: An approach for urban functional region extraction and identification by combining place2vec and pois. Comput. Environ. Urban Syst. 2019, 74, 1–12. [Google Scholar] [CrossRef]
  18. Gao, S.; Janowicz, K.; Couclelis, H. Extracting urban functional regions from points of interest and human activities on location-based social networks. Trans. GIS 2017, 21, 446–467. [Google Scholar] [CrossRef]
  19. Yuan, J.; Zheng, Y.; Xie, X. Discovering Regions of Different Functions in a City Using Human Mobility and POIs. In Proceedings of the 18th ACM SIGKDD International Conference on Knowledge Discovery and Data Mining, Beijing, China, 12–16 August 2012; Association for Computing Machinery: New York, NY, USA, 2012. [Google Scholar] [CrossRef]
  20. Gu, Y.; Jiao, L.; Dong, T. Spatial distribution and interaction analysis of urban functional areas based on multi-source data. Geomat. Inf. Sci. Wuhan Univ. 2018, 43, 1113–1121. (In Chinese) [Google Scholar] [CrossRef]
  21. Xu, S.; Qing, L.; Han, L.; Liu, M.; Peng, Y.; Shen, L. A New Remote Sensing Images and Point-of-Interest Fused (RPF) Model for Sensing Urban Functional Regions. Remote Sens. 2020, 12, 1032. [Google Scholar] [CrossRef] [Green Version]
  22. Song, J.; Lin, T.; Li, X.; Prishchepov, A.V. Mapping Urban Functional Zones by Integrating Very High Spatial Resolution Remote Sensing Imagery and Points of Interest: A Case Study of Xiamen, China. Remote Sens. 2018, 10, 1737. [Google Scholar] [CrossRef] [Green Version]
  23. Sun, J.; Wang, H.; Song, Z.; Lu, J.; Meng, P.; Qin, S. Mapping Essential Urban Land Use Categories in Nanjing by Integrating Multi-Source Big Data. Remote Sens. 2020, 12, 2386. [Google Scholar] [CrossRef]
  24. Zhou, Y.; Smith, S.J.; Elvidge, C.D.; Zhao, K.; Thomson, A.; Imhoff, M. A cluster-based method to map urban area from DMSP/OLS nightlights. Remote Sens. Environ. 2014, 147, 173–185. [Google Scholar] [CrossRef]
  25. Schwarz, N. Urban form revisited—Selecting indicators for characterising European cities. Landsc. Urban Plan. 2010, 96, 29–47. [Google Scholar] [CrossRef]
  26. Ester, M.; Kriegel, H.; Sander, J. A Density-Based Algorithm for Discovering Clusters in Large Spatial Databases with Noise. In Proceedings of the Second International Conference on Knowledge Discovery and Data Mining (KDD-96), Portland, OR, USA, 2–4 August 1996; AAAI Press: Portland, OR, USA, 1996. [Google Scholar]
  27. Schubert, E.; Sander, J.; Ester, M. Dbscan revisited, revisited: Why and how you should (still) use dbscan. ACM Trans. Database Syst. 2017, 42, 1–21. [Google Scholar] [CrossRef]
  28. Shen, J.; Hao, X.; Liang, Z. Real-time superpixel segmentation by dbscan clustering algorithm. IEEE Trans. Image Process. 2016, 25, 5933–5942. [Google Scholar] [CrossRef] [PubMed] [Green Version]
  29. Ministry of Housing and Urban-Rural Development of People’s Republic China. Code for Classification of Urban and Rural Land Use and Planning Standards of Development Land (GB50137-2011); China Architecture & Building Press: Beijing, China, 2011; (In Chinese).
  30. Elvidge, C.D.; Baugh, K.E.; Zhizhin, M.; Hsu, F.-C. Why VIIRS data are superior to DMSP for mapping nighttime lights. In Proceedings of the Asia-Pacific Advanced Network, Honolulu, HI, USA, 13–16 January 2013. [Google Scholar]
  31. Gong, P.; Li, X.; Wang, J. Annual maps of global artificial impervious area (gaia) between 1985 and 2018. Remote Sens. Environ. 2020, 236, 111510. [Google Scholar] [CrossRef]
  32. Gong, P.; Wang, J.; Yu, L. Finer resolution observation and monitoring of global land cover: First mapping results with Landsat TM and ETM+ data. Int. J. Remote Sens. 2013, 34, 2607–2654. [Google Scholar] [CrossRef] [Green Version]
  33. Ministry of Natural Resources of the People’s Republic of China. Current Land Use Classification (GB/T 21010-2017); Standards Press of China: Beijing, China, 2017; (In Chinese).
  34. Liu, X.; Long, Y. Automated identification and characterization of parcels with openstreetmap and points of interest. Environ. Plan. B Plan. Des. 2016, 43, 341–360. [Google Scholar] [CrossRef]
  35. Zhang, L. Research on poi classification standard. Bull. Surv. Mapp. 2012, 10, 82–84. (In Chinese) [Google Scholar]
  36. Xu, H.; Zhu, J.; Wang, Z. Exploring the spatial pattern of urban block development based on poi analysis: A case study in Wuhan, China. Sustainability 2019, 11, 6961. [Google Scholar] [CrossRef] [Green Version]
  37. Li, X.; Xue, X. Estimation method of nighttime light images’electric power consumption based on the boston matrix. Geomat. Inf. Sci. Wuhan Univ. 2018, 43, 1994–2002. (In Chinese) [Google Scholar]
  38. Li, F.; Yan, Q.; Zou, Y.; Liu, B. Improving the Accuracy of Built-up Area Extraction Based on Nighttime Light Data and POI: A Case Study of NPP/VIIRS and Luojia 1-01 Nighttime Light Images. Wuhan Univ. Nat. Sci. 2019, 1–14. (In Chinese) [Google Scholar] [CrossRef]
  39. Silverman, B.W. Density Estimation for Statistics and Data Analysis. Technometrics 2012, 29, 495. [Google Scholar] [CrossRef]
  40. Zhou, Z.; Wang, J.; Zhu, S. An improved adaptive and fast af-dbscan clustering algorithm. CAAI Trans. Intell. Syst. 2016, 11, 93–98. (In Chinese) [Google Scholar]
  41. CCCC FIRST HIGHWAY CONSULTANTS. The Highway Route Design Specification (JTG D20-2017); China Communication Press: Beijing, China, 2018. (In Chinese) [Google Scholar]
  42. Hu, M.Z.; Fan, Y.H.; Zhao, Q.Q. A Study of HOPSCA Development under the Intensive Land Use. Appl. Mech. Mater. 2011, 71, 589–593. [Google Scholar] [CrossRef]
  43. Qin, Z.; Yu, Y.; Liu, D. The effect of hopsca on residential property values: Exploratory findings from Wuhan, China. Sustainability 2019, 11, 471. [Google Scholar] [CrossRef] [Green Version]
  44. Jiang, H. Commercial Complex and Urban Public Space. Mod. Urban Res. 2009, 24, 48–52. (In Chinese) [Google Scholar]
Figure 1. Methodological procedures of the research.
Land 10 00523 g001
Figure 2. The classification process of the construction land use type based on road network blocks.
Land 10 00523 g002
Figure 3. Comparison of classification results and remote sensing images of typical regions. (a) Comparison map of sample 1 in Jianggan District, Hangzhou City; (b) Comparison map of sample 2 in Jianggan District, Hangzhou.
Land 10 00523 g003
Figure 4. Classification results of 11 cities in Zhejiang Province (covering nonconstruction land).
Land 10 00523 g004
Table 1. POI classification schemes and estimated ground areas.
Land-Use TypeCodePOI TypeGround Area95% Confidence Interval
Nonconstruction01Agricultural, forestry, animal husbandry and fishery bases--
Residential02Living quarters--
Industrial03Companies, factories, industrial parks, well-known enterprises59214320–8118
Administrative and public services0441Government agencies, social institutions, service-oriented venues14,7379665–22,470
42General hospitals, emergency centers2078806–5361
43Schools and research institutes41122485–6802
Commercial and business facilities0551Convention and exhibition centers, commercial venues18601388–3494
52Comprehensive markets, shopping malls and large commercial places816621–1073
53Commercial service institutions such as banks and gas stations543423–698
Logistics and warehouse06Logistics storage9874–130
Street and transportation0771Wharves, airports, railway stations and transit ports33362177–5232
72Parking lots, long-distance bus stations, subways, etc.463366–587
Municipal utilities08Emergency shelters27101989–3695
Green space09Scenic spots, parks and squares31832013–5034
Table 2. Clustering parameters.
CodePOI TypeClusterEpsMinPts
03Companies, factories, industrial parks, well-known enterprises35
0441Government agencies, social institutions, service-oriented venues46
42General hospital, emergency center --
43Schools and research institutes43
0551Convention and exhibition centers, commercial venues35
52Comprehensive market, shopping mall and other large commercial places410
53Commercial service institutions such as Banks and gas stations44
06logistics storage203
0771Wharves, airports, railway stations and transit ports×--
72Parking lots, long-distance bus stations, subways, etc.×--
08Emergency shelter×--
09Scenic spots, parks and squares×--
Table 3. Confusion matrix for Level I classification.
Code030405060708TotalUA (%)
033302371308823856579029064337390488.32
041600614831151560359911835121994567.43
05201523122614124526922539019565872.19
06136895902145075737957359156962.66
07721237282334382.22
0818082921761356178775.88
ACC 1 (%)76.86
1 ACC represents the overall accuracy and UA represents user’s accuracy.
Table 4. Statistics on the proportion of classified area in the city (%).
Type0203040506070809
City ResIndPACFLWSTMFGS
Hangzhou27.0531.985.297.143.1510.090.4714.80
Huzhou26.8331.396.497.650.278.210.7418.09
Jiaxing28.3335.016.296.230.608.250.6314.67
Jinhua25.5727.698.8911.692.0812.480.2611.34
Lishui20.6932.3612.829.910.1710.641.1812.23
Ningbo22.9436.217.106.301.7110.760.2114.76
Quzhou25.3033.5111.217.621.300.450.6619.97
Shaoxing23.4036.516.817.160.4910.420.5614.65
Taizhou27.8129.9013.439.380.8911.080.237.27
Wenzhou22.0127.5215.118.570.1610.900.4315.29
Zhoushan37.9724.407.934.560.9211.010.1013.10
Publisher’s Note: MDPI stays neutral with regard to jurisdictional claims in published maps and institutional affiliations.

