Article

How to Perceive the Trade-Off of Economic and Ecological Intensity of Land Use in a City? A Functional Zones-Based Case Study of Tangshan, China

1
School of Land Science and Technology, China University of Geosciences, 29 Xueyuan Road, Haidian District, Beijing 100083, China
2
Key Laboratory of Land Consolidation and Rehabilitation, Ministry of Natural Resources, Beijing 100083, China
3
Tangshan Real Estate Appraisal and Consultation Center, Beixinxi St., Lubei District, Tangshan 63000, China
*
Author to whom correspondence should be addressed.
Submission received: 6 April 2021 / Revised: 18 May 2021 / Accepted: 19 May 2021 / Published: 22 May 2021
(This article belongs to the Special Issue Land Use Optimisation)

Abstract

:
China, in a rapid urbanization process, is accompanied by the expansion of built-up land, population accumulation, and intensive land investment, while the improvement of the urban environment cannot keep up with the population and economic density growth. Therefore, the purpose of this paper is to discuss the balance between urban land use economic intensity (built-up area density, population density, land price) and ecological intensity (the depth, breadth, and integration of ecological spaces) in Tangshan. From the perspective of functional zones (FZs), the trade-off of economic and ecological intensity of different types of land use is detailed from the evaluation system. Finally, this paper explores a common intensive development model for different FZs to reach both reasonable economic and ecological purposes in Tangshan. The upshot indicates that the economic and ecological intensity of all FZs in Tangshan follows an opposite spatial distribution, and different types of FZ own their characteristics. The Gini index and Theil index for measuring the typical FZ indicate the unbalanced state between ecological spaces and population in residential areas. To sum up, a resource-based city, such as Tangshan, in the rapid development stage of urbanization tends to pay more attention to economic output and neglect ecological benefits.

1. Introduction

With the expansion of urbanization, urban core areas are often in the awkward situation of the tense relationship between population and land, deterioration of urban environment, and imbalance of urban functions [1]. Cities are no longer compact, isodiametric aggregations, but rather sprawl in fractal or web-like configurations. An ecological understanding of urbanization requires less dense populations to capture the impact of the entire city and the existence of thresholds for change across spaces [2]. In general, to pursue the intensity of land use alone causes the socioeconomic growth of a city, but the value of ecosystem services decreases [3]. Therefore, how to balance the economic development of the city and the ecological environment protection of the city is a worldwide problem [4]. The rational use of land under the background of new urbanization and environmental conservation is a problem that must be a concern for densely populated cities, especially in developing countries. The main problem is how to build a sustainable city, which means a city that has a balance between economic development and ecological well-being of residents [5,6,7,8]. Therefore, the trade-off between the urban land use intensity and the ecological use of urban land is conducive to alleviating the contradiction and conflict between urbanization development and ecological environment protection [9,10]. Thus, it is urgently needed to investigate how land use intensity and urban patterns interact to affect ecological conditions [11].
Urban land use intensity and population density can be regarded as two major indicators of urban density [12]. In general, it follows with the interest of economic output per unit of land. The method of intensive land use was first proposed in the theory of land rent, mainly by economists such as Ricardo for the study of agricultural land [13]. Most of them mainly emphasize the input and output of land and the adjustment of land use structure [14]. The nature of improving land use intensity is a relatively reasonable investment process [15]. Therefore, the improvement of land intensification, as an investment process affects all aspects of output; for example, the concentration of cultivated land affects food security, and it also causes energy budget differences [16,17].
As engines of socioeconomic development and centers of cultural transformation and technological innovation, cities, as spatially heterogeneous, complex adaptive systems, must play a critical role in achieving sustainability at the regional and global scale [18,19]. As such, the dynamic trajectory of cities can never be fully predicted or controlled but can be influenced or guided in more desirable directions through planning activities that are based on urban ecological knowledge and sustainability principles [20]. Park, Burgess, and McKenzie (1925) defined urban ecology as “the study of the relationship between people and their urban environment”, which is essentially human ecology of the city [21]. Human ecology is regarded as “one of the oldest areas of specialization in sociology” [22]. In the late 1960s, the ecological use of the land became an important way of land use [23]. In addition, the purpose of relevant research is to improve the natural environment in which people live, which is comprehensively measured from the aspects of nature, society, and urban ecological spaces [24,25,26,27]. In general, the ecological land in the central urban area has a positive effect on residents’ health [28,29,30,31], human amenities [32,33], and economic activities [34].
Furthermore, a sustainable city must have a harmonious relationship between “space” and “society” [35]. The core problem is the contradiction between the limited space resources and the complexity or diversity of the needs of different social groups (residents) [36]. There is a pressing need for comprehensive deployment, unified arrangement, and management of urban ecological spaces and economic spaces in a certain period in order to maximize the benefits of allocating resources, improving the urban environment, and upgrading the ultimate goal of quality of life for urban residents [37,38,39,40].
Economic, demographic, and environmental considerations are inevitable and unavoidable in the sustainability of a city. Plenty of empirical studies give view to clarify the distribution and provision of ecological spaces as a consequence driven by an economic, demographic, and social transformation in urbanization [41,42,43]. Additionally, some studies have also paid attention to the problem of environmental justice caused by the uneven distribution of urban green spaces [30,44]. With the emphasis of ecological well-being, the pursuit of a city is being turned from the economic end to dual ends. China, in an accelerated urbanization process, with dramatic changes in its economy, society, and land use in the past decade [45,46,47,48,49], is facing the contradictions and conflicts between urban land demand and environmental conservation. China’s urbanization rate has reached 56.1%, and as is estimated by 2020, the rate will increase to 60% [50], and this growth will inevitably expand the scope of urban land use. The development model of “spreading the pie” causes the blind expansion of urban areas and neglect of ecological spaces.
Therefore, the most pressing issue is whether land with its own function has different economic and ecological function positioning, whether urban expansion has squeezed the value of ecological land, and whether built-up land has achieved economic intensive development. This paper establishes an evaluation system of economic intensity and ecological intensity based on FZs. Economic intensity refers to the degree of urban land use intensity, population density, and the level of socioeconomic development. The evaluation indicators of ecological intensity include the proportion of ecological land identified by remote sensing, the Normalized Difference Vegetation Index (NDVI), and the Plaque cohesion degree analyzed from the perspective of landscape ecology.
There is no unified connotation in this aspect in China [51]. To date, rather few studies have been conducted regarding land use to track the economic and ecological properties of different FZs in China. This paper hereby attempts to establish a theoretical framework of rationalizing land use of a resource-based city by involving economic and ecological input–output indicators, which aims at (1) obtaining the economic and ecological intensity of each FZ in Tangshan, (2) exploring the economic and ecological attributes of different types of FZs, and (3) judging whether different FZs have reached their optimal economic and ecological intensive level.

2. Materials and Methods

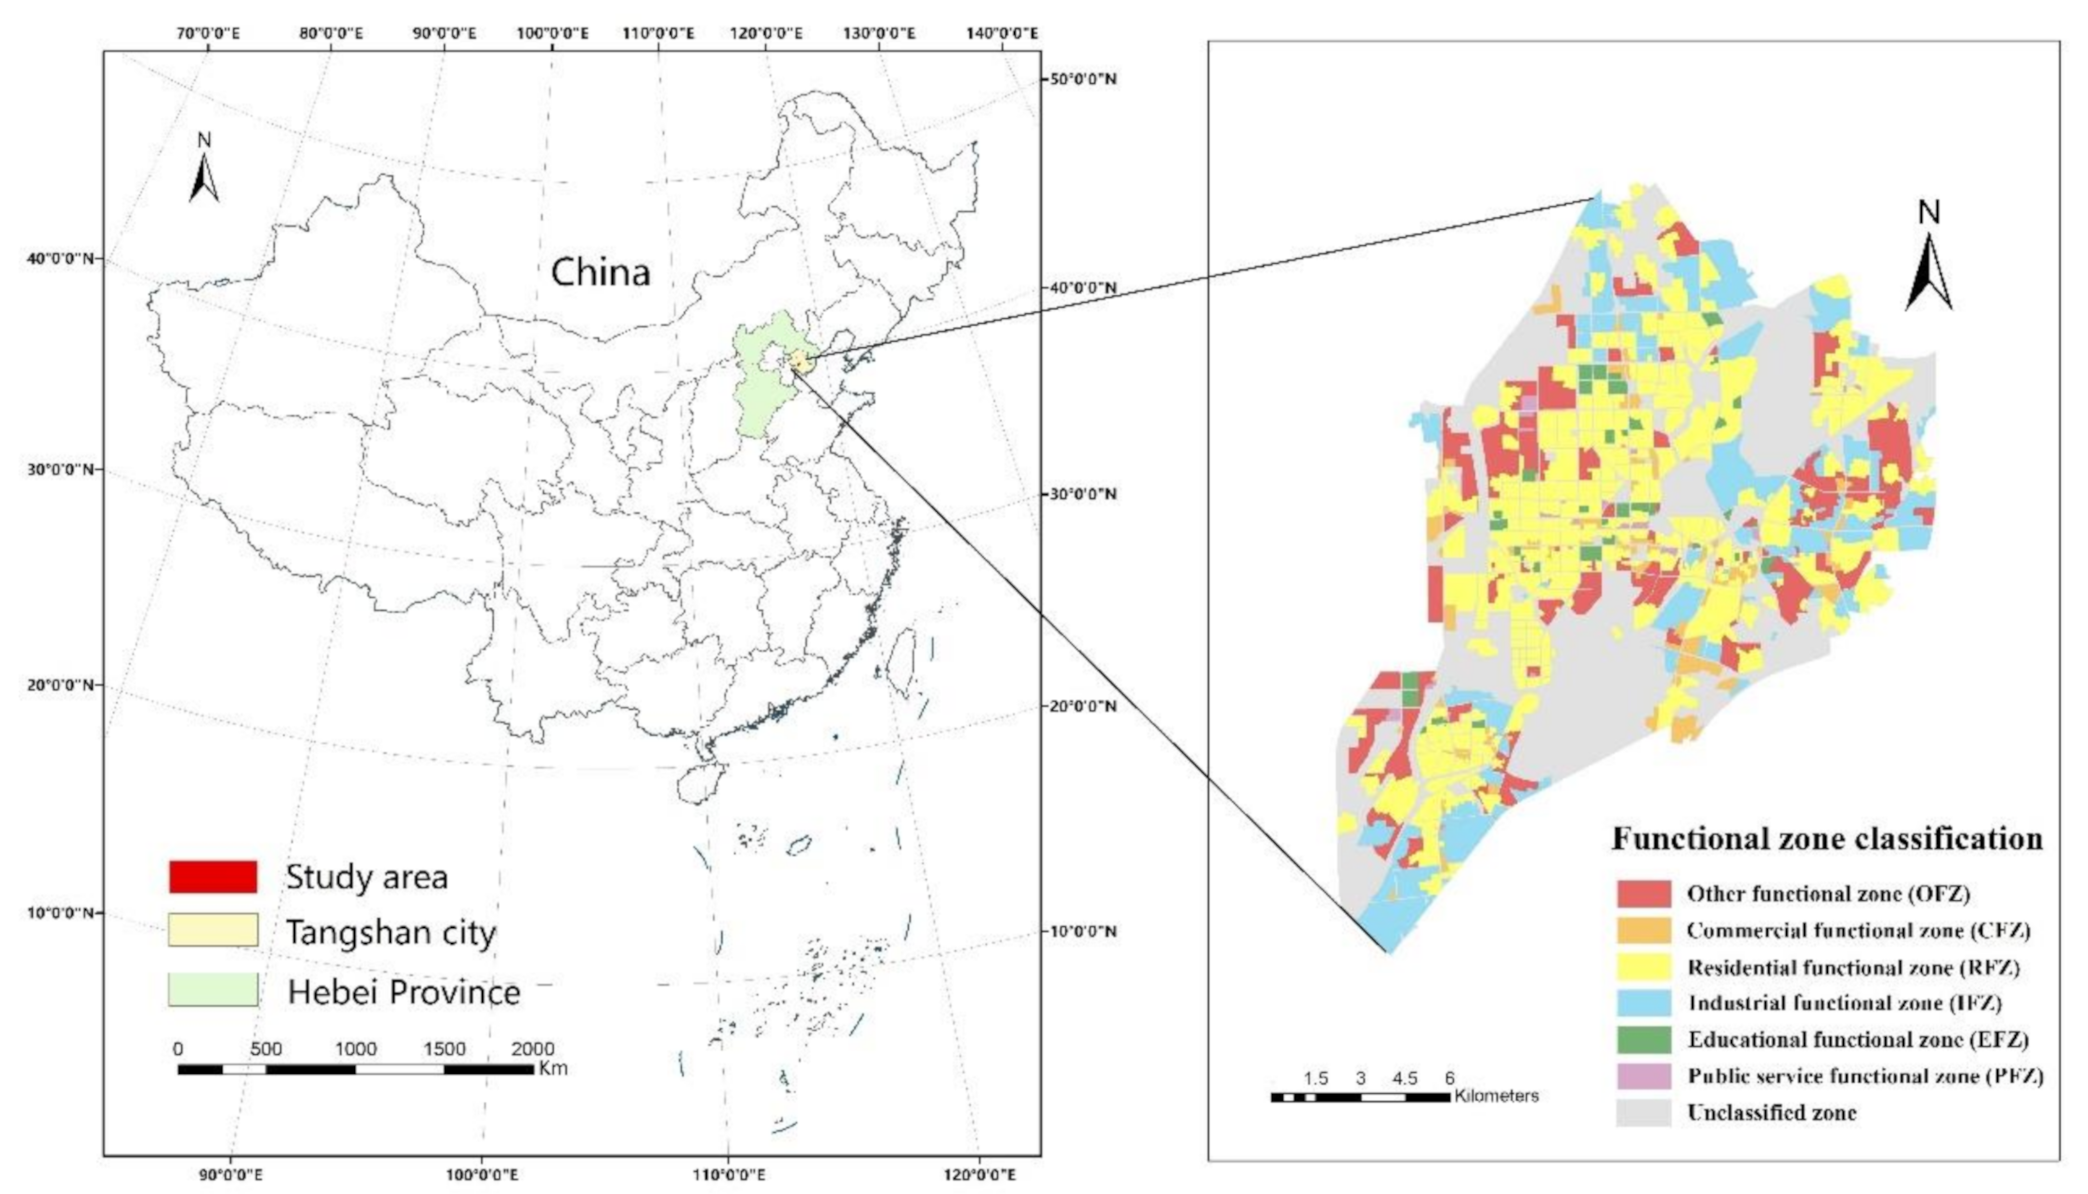
2.1. Study Area and Research Units

Located in the center of Bohai Bay, Tangshan City (Figure 1) is 117°31′–119°19′ east longitude and 38°55′–40°28′ north latitude. It is an important part of the Bohai Sea, Beijing-Tianjin-Hebei metropolitan area. The east–west length is about 130 km, and the north–south width is about 150 km. The total land area is 27,025.52 ha. The research area of this paper is the downtown area of Tangshan City. The downtown area of Tangshan includes Lubei District, Lunan District, Fengnan District, and Kaiping District. Tangshan is one of the economic centers of Hebei Province. As a resource-based city, it has a very developed industry. Tangshan is a city built by coal and prospered by steel. Abundant resources once made Tangshan’s glory, and simultaneously caused the path dependence of economic development. In recent years, Tangshan has been transforming from a traditional resource-based city to a regenerative city, so the issue of ecological protection has received great attention.
The functional zone (FZ) is an area where land use, benchmark land price, and future land use conditions are the same in urban construction land. Different FZs have different requirements for economic and ecological needs. On the basis of the layout of the main planning function of Tangshan, the distribution of roads at all levels in Tangshan, and the street and administrative boundaries of Tangshan, according to the principle of Tangshan’s overall planning map boundary, functional land use, and the relative integrity of street and administrative boundaries, this paper divides the different land types in the downtown area of Tangshan into six types of FZ, including residential (RFZ), commercial (CFZ), industrial (IFZ), public service (PFZ), educational (EFZ), and other (OFZ). Specifically, the research units include: 294 RFZs, 81 CFZs, 72 IFZs, 34 PFZs, 34 EFZs, and 66 OFZs; 581 in total (described in Figure 1).

2.2. Data Sources

The data in this paper mainly include three aspects: statistical data (the 2015 yearbook counts the information of 2014), research report data, and spatial data. The first type of data is used for establishing a Land Economic Intensive Evaluation System, the second to understand the current status of urban development in Tangshan, and the last for extracting spatial data of Tangshan City: classification of land use status, identification of FZ boundaries, and extraction of vegetation cover information. The details are explicated in Table 1.

2.3. Research Framework

In this paper, the target was to calculate the economic and ecological levels of different FZs, to understand characteristics of different types of FZ, and to analyze the status of the trade-off of different FZs. Additionally, from the perspective of people–land, analyze whether a resource-based city has left ecological issues in the process of pursuing economic output. Therefore, an economic intensive evaluation index system was established for different FZs in Tangshan; an ecological intensive evaluation system was established through the breadth and depth of green spaces and the combination of green patches. According to the development status of the economy and ecology, the trade-off status of each FZ was analyzed. Finally, the RFZs were used as a typical example to study the matching relationship of population and ecological spaces. Using the spatial distribution and statistical curves, this paper hoped to find a balanced development way. The study framework and construction of methods is shown in Figure 2.

2.4. Estimation of Economic Intensity of Land Use

2.4.1. Indicator System Establishment

Economic intensity reflects the economic output and the efficiency of land use in the built-up area, which is positively related to building density, population, capital investment, and infrastructure completeness. The orientation of land use in each type of FZ in Tangshan City is different, so the indicator system for intensive use evaluation of each type also varies [52].
The main basis for determining the ideal value of the evaluation index of the land intensive use in each functional area studied in this paper is as follows:
(1)
The level of land price realization, the amount of fixed asset investment in unit land, the number of administrative staff in unit land service, the number of students in unit land service, and the total industrial income in unit land use 1/4 quantiles as ideal values;
(2)
The commercial property occupancy rate and infrastructure completeness adopt the extreme value method as the ideal value;
(3)
The population density is based on the per capita residential land use control index stipulated in the “Urban Residential Area Planning and Design Code”, with 138 people/ha as the ideal value; the comprehensive plot ratio is based on the “Tangshan City Master Plan (2011–2020)”. Select the highest control interval of floor area ratio, and at the same time select the floor area ratio of land sold in Tangshan City from 2012 to 2014, calculate the average floor area ratio of each functional area, and then make reasonable corrections to obtain the ideal interval value of the comprehensive floor area ratio of each FZ. The ideal value of the building density is based on the comprehensive floor area ratio; its value is the ratio of the comprehensive floor area ratio and the floor (comprehensive method).
In this paper, the factor pair comparison method was used to determine the weight of the index, and each index was assigned according to the important order of the indicators in each type of FZ. The evaluation indicator, indicator ideal value determination, and indicator weights of each FZ of Tangshan City are shown in Table 2.

2.4.2. Economic Intensity of Land Use within FZs

The land use intensity of each FZ in Tangshan City was calculated as the following Equation (1).
E c o n I i = j = 1 n W i j × V i j
where i means the type of FZ, j means the j-th indicator. EconIi is land use intensification in various FZs of Tangshan City, Wij is the weight value of the j-th indicator of i-th FZ, Vij is normalized value of the j-th indicator of i-th FZ. The intensification degree EconIi of each FZ in Tangshan City is between 0 and 1.

2.5. Estimation of Ecological Intensity of Land Use

2.5.1. Determining Indicator System

Ecological intensity reflects the breadth (proportion of ecological land), density (NDVI), and the integration (Plaque cohesion) of ecological spaces [52].
(1) NDVI calculation
This paper directly obtains NDVI from ENVI5.0 based on the remote sensing image, and then uses the Raster to Point function of the ArcToolbox tool in Arcgis10.0 to extract the values of different cells to the point of obtaining the specific NDVI value of the cell. The value of NDVI ≤ 0 is deleted, and finally the average value of NDVI in each FZ is counted.
(2) Proportion of ecological land
This study uses remote sensing to interpret green spaces and waters as ecological land. In order to reflect the level of ecological land sharing and realize the local micro-circulation of ecology, according to the scale of the study area and the size of each FZ, this study selected 1 km as the service radius of ecological land, then used the ArcGIS grid tool to divide the study area into a 1 km×1 km grid, calculated the ecological land proportion of each grid, and interpolated the grid center point using the Kriging method, obtaining the average value of the proportion of ecological land in the study area, and finally calculated the proportion of ecological land in each FZ of Tangshan City.
(3) Plaque cohesion degree
The Plaque cohesion degree index was calculated by FRAGSTATS 3.4. There are 581 FZs studied in this paper. Each FZ needed to be cut into a single plaque as a landscape. Model Builder was used to build a model for data batch processing. Finally, the application software FRAGSTATS 3.4 calculated the Plaque cohesion degree of each FZ (Equation (2)).
C O H E S I O N = 1 j = 1 m P i j j = 1 m P i j a i j 1 1 A 1 × 100
where Pij is for the perimeter of the plaque ij, aij is for the area of plaque ij, and A is the total number of sheds in the landscape (0 ≤ COHESION < 100).

2.5.2. Ecological Intensity Land Use within FZs

In this paper, it was agreed that the ecological land use ratio, NDVI, and Plaque cohesion degree have the same impact on the urban ecological effects. Therefore, this paper gave them approximately the same index weight value; that is, the ecological land ratio and NDVI was 0.33, and the Plaque cohesion degree was 0.34.
The ecological utilization level of land in each FZ is a comprehensive reflection of the proportion of ecological land use, NDVI, and Plaque cohesion indicators. The land ecological utilization level was calculated according to Equation (3).
E c o l I i = i = 1 n W i × V i
where i is the i-th indicator, EcolI is land use ecological intensity in various FZs of Tangshan City, Wi is the weight value of the i-th indicator, Vi is normalized value of the i-th indicator. The intensification degree EcolI of each FZ in Tangshan City is between 0 and 1.

2.6. Spatial Autocorrelation

The global spatial autocorrelation is used to measure the overall spatial autocorrelation and is characterized by Moran’s I. The calculation method is shown in Equation (4):
I d = n i = 1 n j = 1 n W i j X i X ¯ X j X ¯ j = 1 n X i X ¯ i = 1 n j = 1 n W i j
where xi and xj are the values of the variable x at the adjacent pairing space point; x x is the average value; wij is the adjacent weight (if the space points i and j are adjacent, wij = 1, otherwise wij = 0); n is the total number of spatial points. The value of Moran’s I coefficient is [−1, 1], less than 0 means negative correlation, equal to or close to 0 means irrelevant, and greater than 0 means positive correlation.
Local autocorrelation uses hotspot analysis methods to identify statistically significant hotspots and cold spots using Getis–Ord G i * statistics. The spatially occurring locations of hotspots and cold spots were analyzed by statistically significant z-scores and p-values. The calculation method is as follows (Equation (5)):
G i * = j = 1 n w i j x j x ¯ j = 1 n w i j j = 1 n x j 2 n n j = 1 n w i j 2 j = 1 n w i j 2
where the G i * statistic is z score; wi, j is the spatial weight between elements i and j (adjacent to 1, not adjacent to 0); S is standard deviation. If G i * > 0 and passes the significance test, the higher the G i * , the denser the hot spot aggregation; if G i * < 0 and passes the significance test, the lower the G i * , the denser the cold spot aggregation.
In short, Moran’s I can determine whether there is agglomeration and overall agglomeration in the region, and the Getis–Ord G i * statistics can know the exact location of the agglomeration.

2.7. Economic and Ecological Positioning of Different Types of FZ

The Gini coefficient method, Theil index method, and other statistical methods are widely used to evaluate the fairness of income distribution. Ecological spaces can provide valuable ecological and social benefits, and they have the same unfairness and disintegrability as income distribution. Therefore, the method used to measure income inequality is also applicable to the study of urban green spaces.
The Gini coefficient is widely used to measure income and distribution inequality [53], energy resource consumption [54], and inequality of pollution load. The calculation method of the Gini coefficient refers to the research of Kabisch and Haase [55] (Equation (6)):
G = i = 1 k B i 1 + B i a i 1
where G is the Gini coefficient, and K is the number of space units. According to the ascending order of per capita green spaces in the space unit, Bi is the cumulative proportion of the total green spaces owned by the corresponding population of the first to i-th space units in the total green spaces in the city, and ai is taken as the population of the i-th FZ percentage of the total population. Its value is between 0 and 1. The closer it is to 0, the more equal the distribution is, and vice versa.
The Theil index is derived from the concept of drops in information theory [56], and its calculation formula is (Equation (7)):
T = V i × log V i / P i
In the formula, Vi and Pi refer to the proportion of vegetation index and population index of a certain space unit to the total amount of the group. The advantage of the Theil index is that it can decompose the overall regional mismatch differences into intra-group and inter-group differences at different spatial scales and measure the contribution of intra-group and inter-group differences to the total difference [34,35].
When the value of the Theil index is 0, it means that the allocation of ecological spaces in all spatial analysis units is based on the proportion of the population; that is, an absolute equilibrium state of distribution. A larger value indicates that a small number of people have a large amount of ecological space. Different difference measurement methods have their own advantages, disadvantages, and priorities. The Gini coefficient is more sensitive to changes at medium levels, and the Theil index is more sensitive to changes at both ends [57].

3. Results

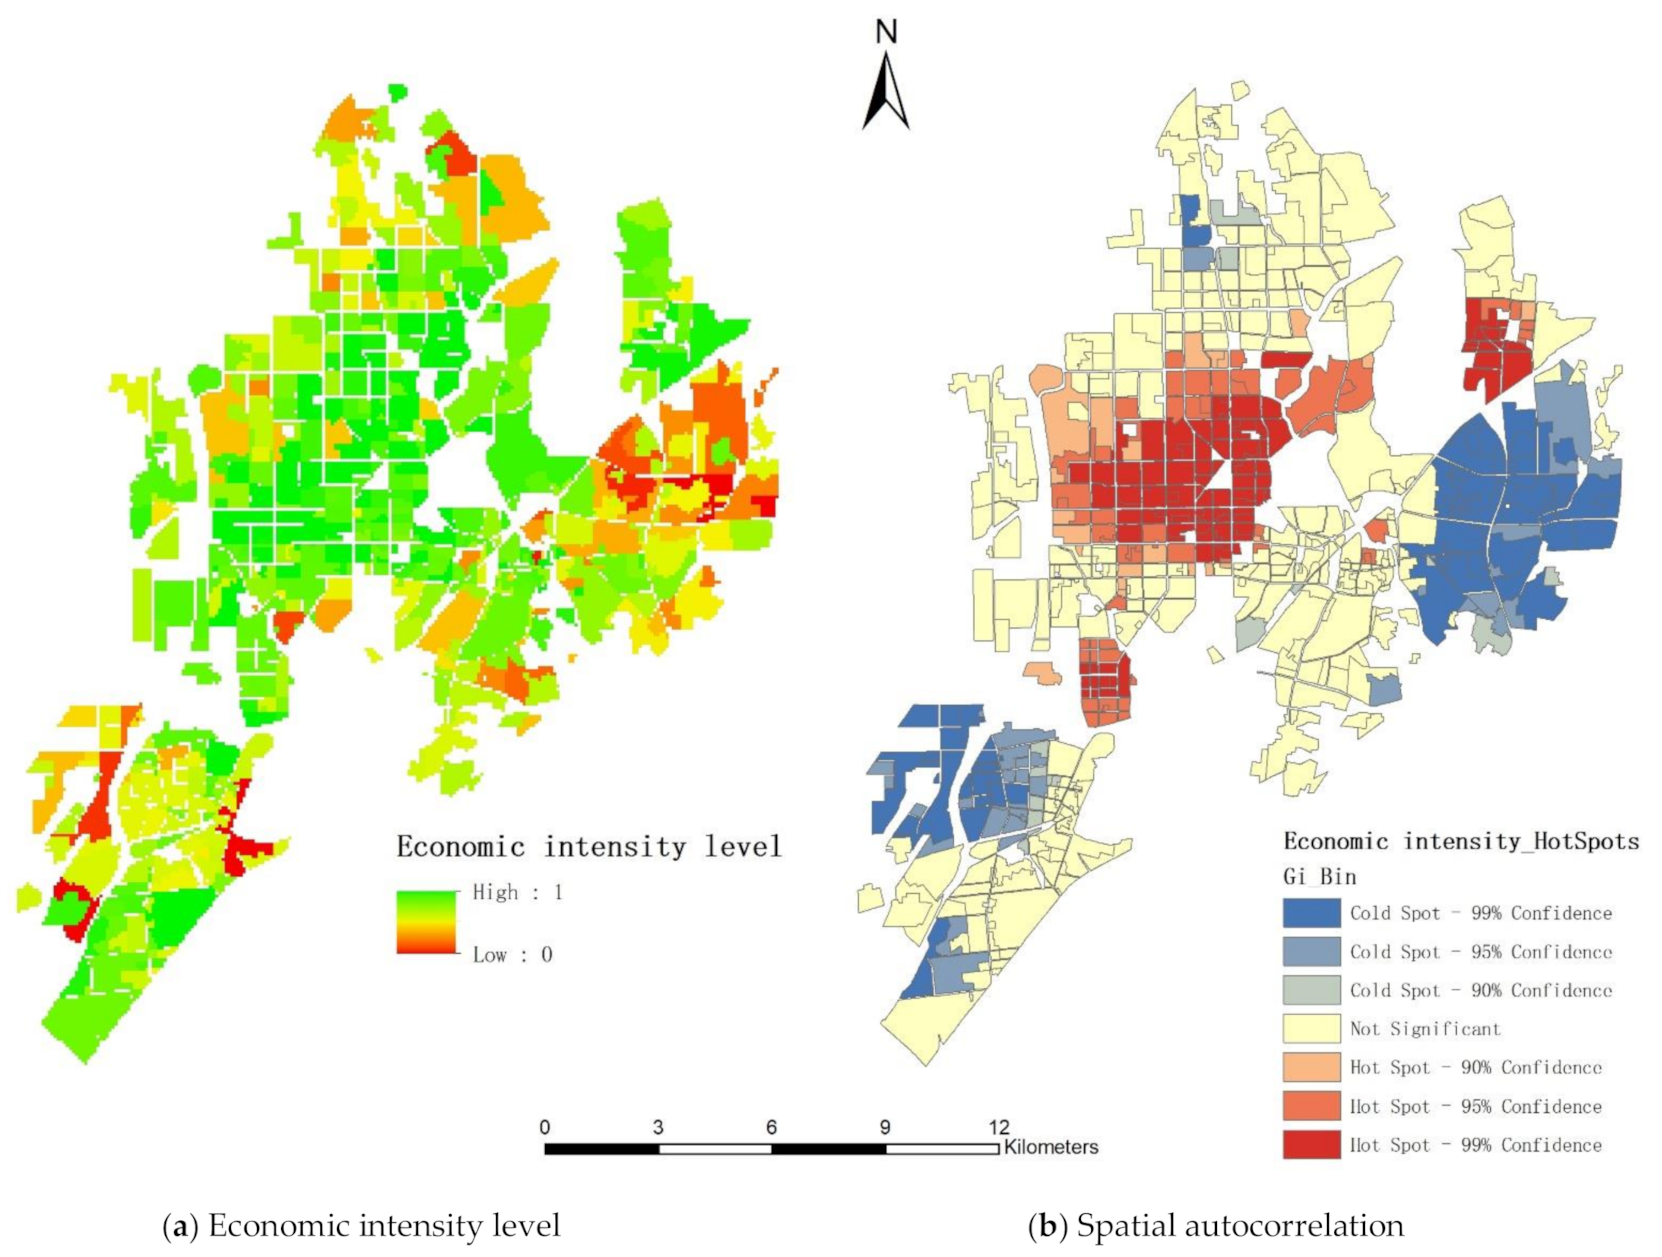
3.1. Economic Intensity of FZ

By constructing the evaluation system of different FZs and the calculation of indicators, the land intensive utilization level of the 581 FZs was obtained. This paper manually divides the results into three levels (Figure 3, Table 3). The result indicates that the economic intensity of the RFZ is relatively high and most of the high values are concentrated in the central city area, while the low values are distributed in the periphery, which mainly belong to IFZ and OFZ.
It is given that Moran’s Index is 0.14, and the p-value has passed the 5% significance level test, which shows that there are significant spatial autocorrelation phenomena in the intensity level of FZs. The local autocorrelation analysis indicates that most of the hot spots are concentrated in the central and northwestern parts of the study area, and the cold spots are concentrated in the east and southwest of the area. Furthermore, the hot spots are mostly RFZs, EFZs, PFZs, and CFZs, and the cold spots are gathered in OFZ where vegetation and forest are located.

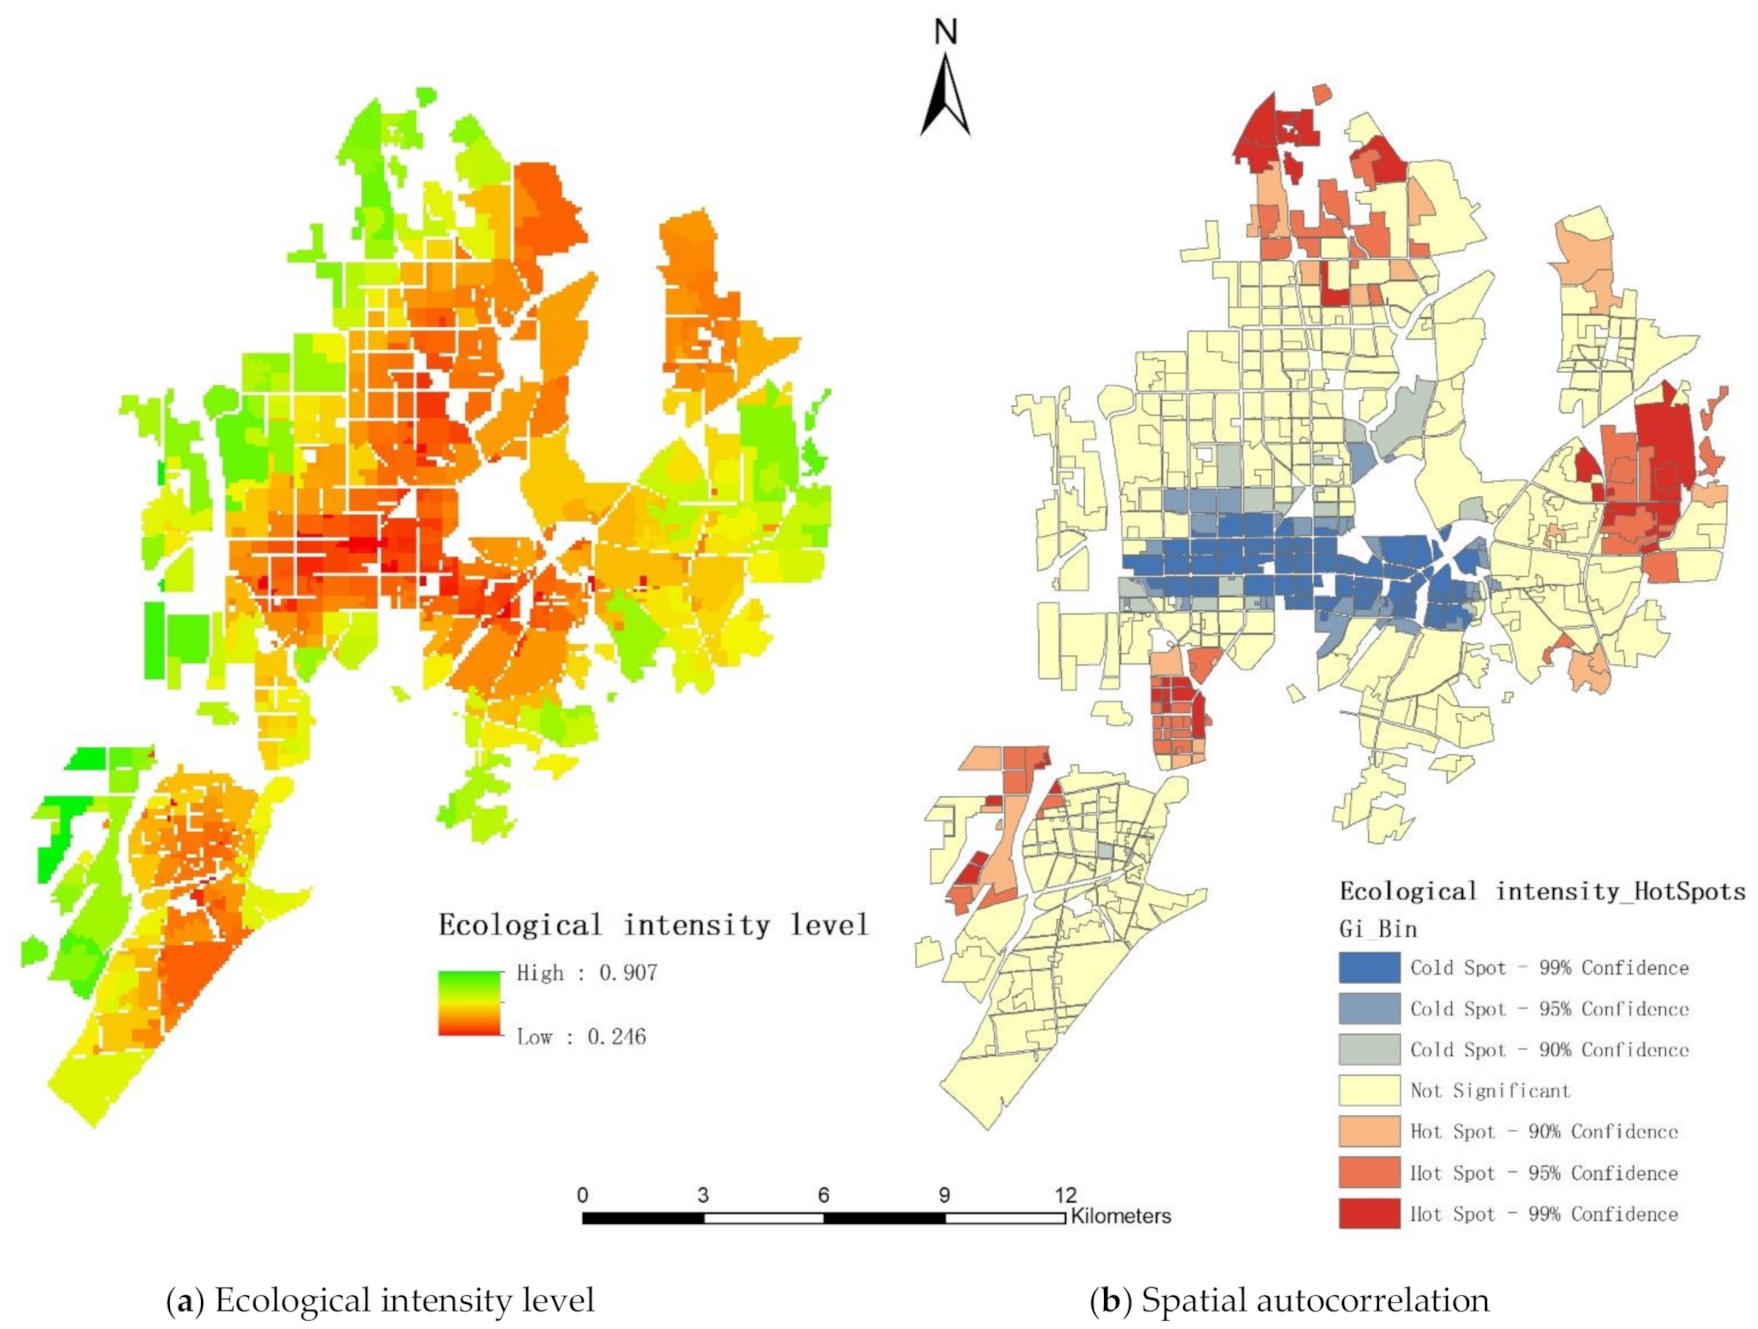
3.2. Ecological Intensity of FZ

The result (Figure 4, Table 4) indicates that ecological intensity of the central area is lower than that of the surrounding areas, which performs an opposite result to economic intensity. This shows that in areas with high capital density and high population density, this economic advantage has not brought any signs of improvement in ecology. The overall level of ecological intensity in the study area is low, which means the development potential of land ecological construction is relatively large.
It is given that Moran’s Index is 0.22, and the P-value has passed the 5% significance level test, which shows that there are significant spatial autocorrelation phenomena in the ecological level of FZs. Then, the local autocorrelation analysis indicates that the cold spots are gathered in center of the study area, while the hot spots are scattered in several corners. The result is exactly the opposite of the distribution of economic intensity.

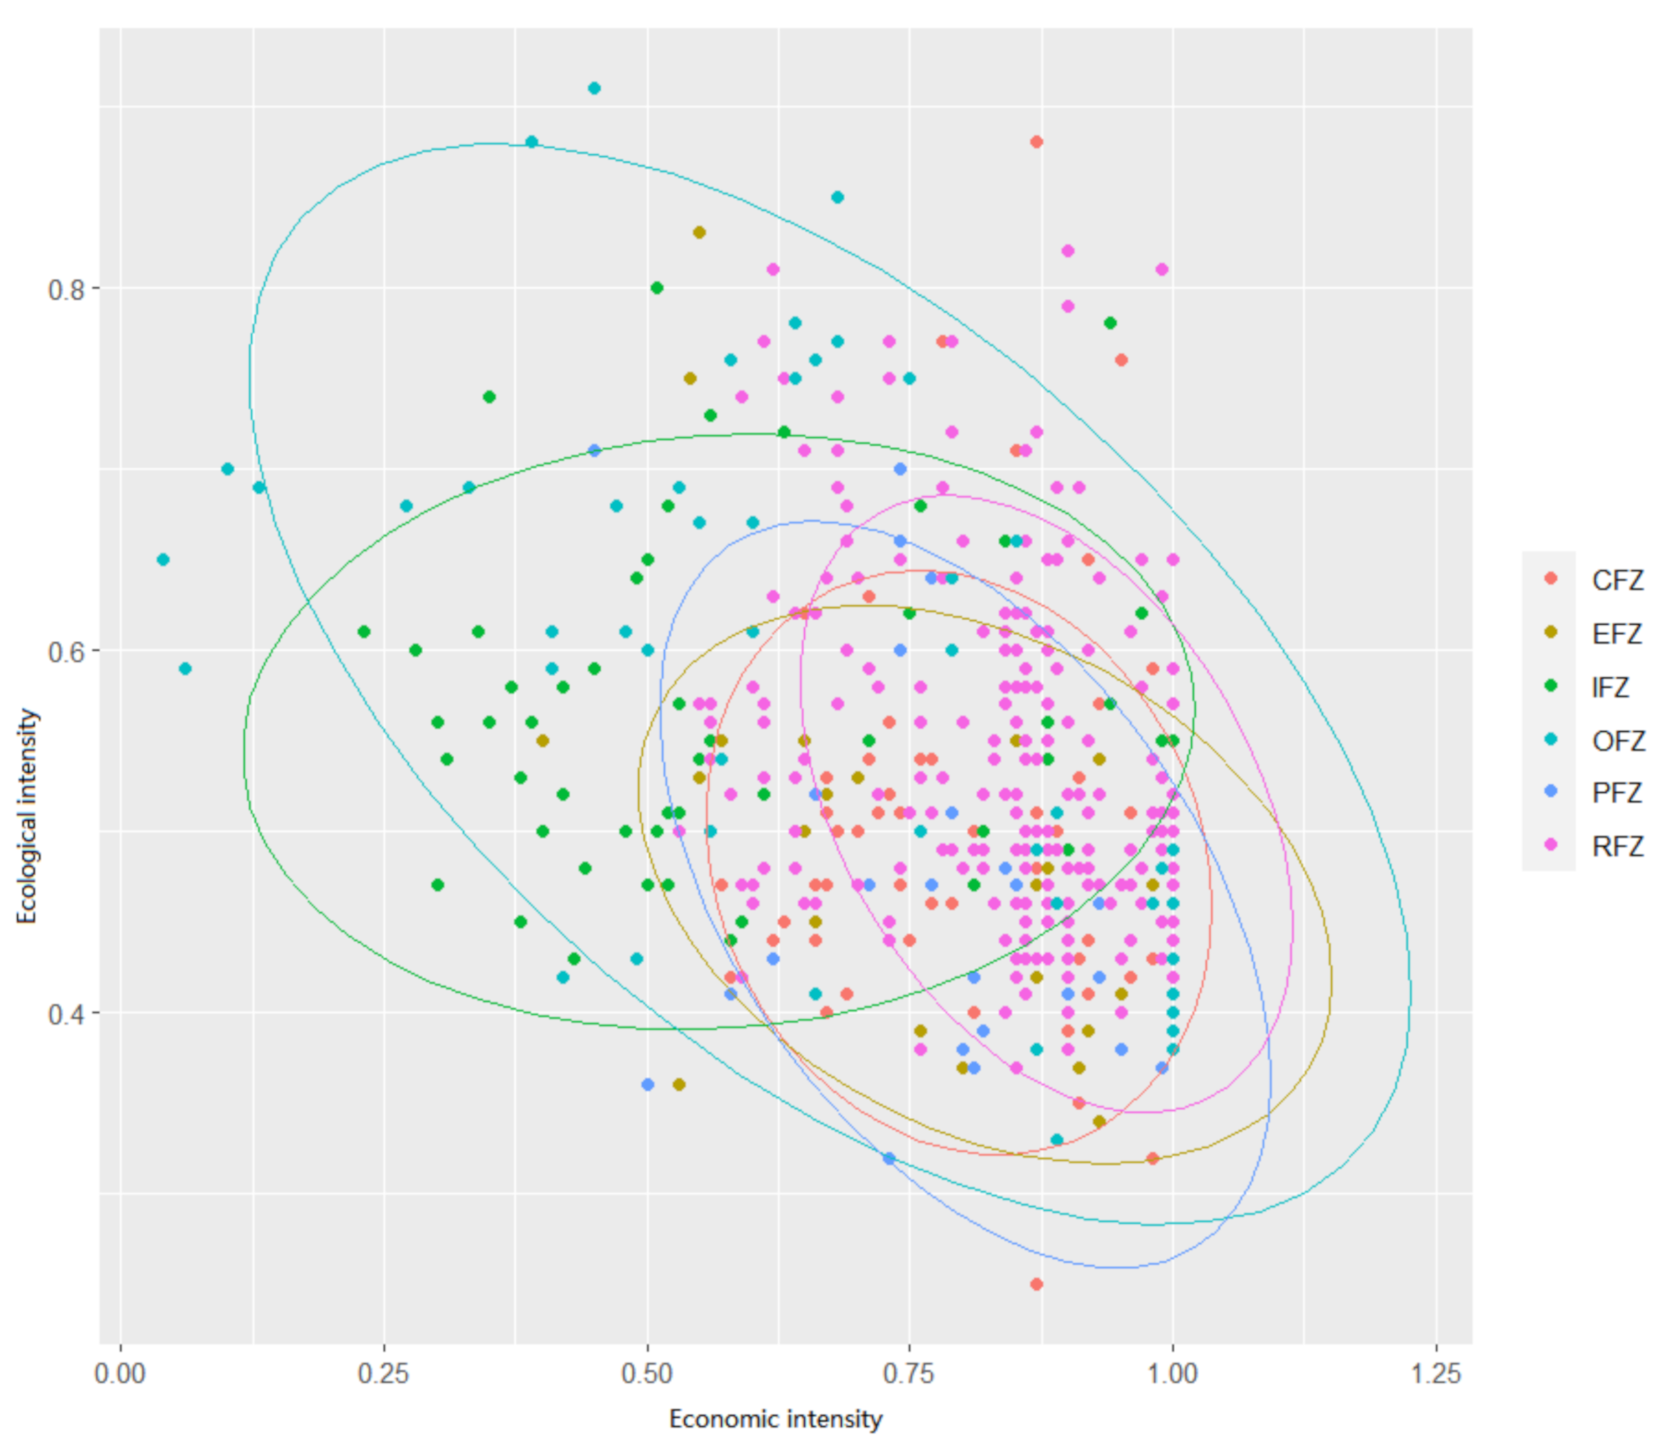
3.3. Trade-Off between Economic Intensity and Ecological Intensity

The scatter plot of each FZ with 90% confidence ellipses for each type of FZ (Figure 5) clarifies that: (1) The RFZs, CFZs, PFZs, and EFZs have high economic intensity whose ellipses are gathered in the lower right side. (2) The OFZs and IFZs have a discrete distribution without obvious concentration. The ellipse of RFZs, CFZs, PFZs, and EFZs shows that these FZs have a high economic intensity while the ecological intensity of most RFZs is relatively low. The IFZs have a more scattered distribution in economic intensity and the ecological intensity is relatively higher, because the industry land is mainly in suburbs where there is a low land intensification, and the environment has a natural status. The OFZs are those natural reserve lands or unused lands without specific functions, so the distribution of intensities is scattered. All in all, RFZs have the highest economic intensities. The ecological intensities of EFZs and CFZs are the lowest overall, and the intensities of OFZs and IFZs are the most discrete. The upshot shows that many IFZs and OFZs almost lack effective control and utilization, and own a low economic intensity, while these lands are often located on the edge of urban areas and can be further exploited. As for RFZs, CFZs, PFZs, and EFZs, their economic output is at a high level, so the adjustment and allocation of ecological spaces should be more reasonable to match the high economic intensity.
The characteristics of residential FZs are the most typical, which best reflect the current development of urbanization in Tangshan. Firstly, the area and number of RFZs account for the majority in this study. Secondly, the RFZs, most closely related to people’s lives, are the largest carrying areas for the population.

3.4. Further Verification of Economic–Ecological Status of Typical Zones

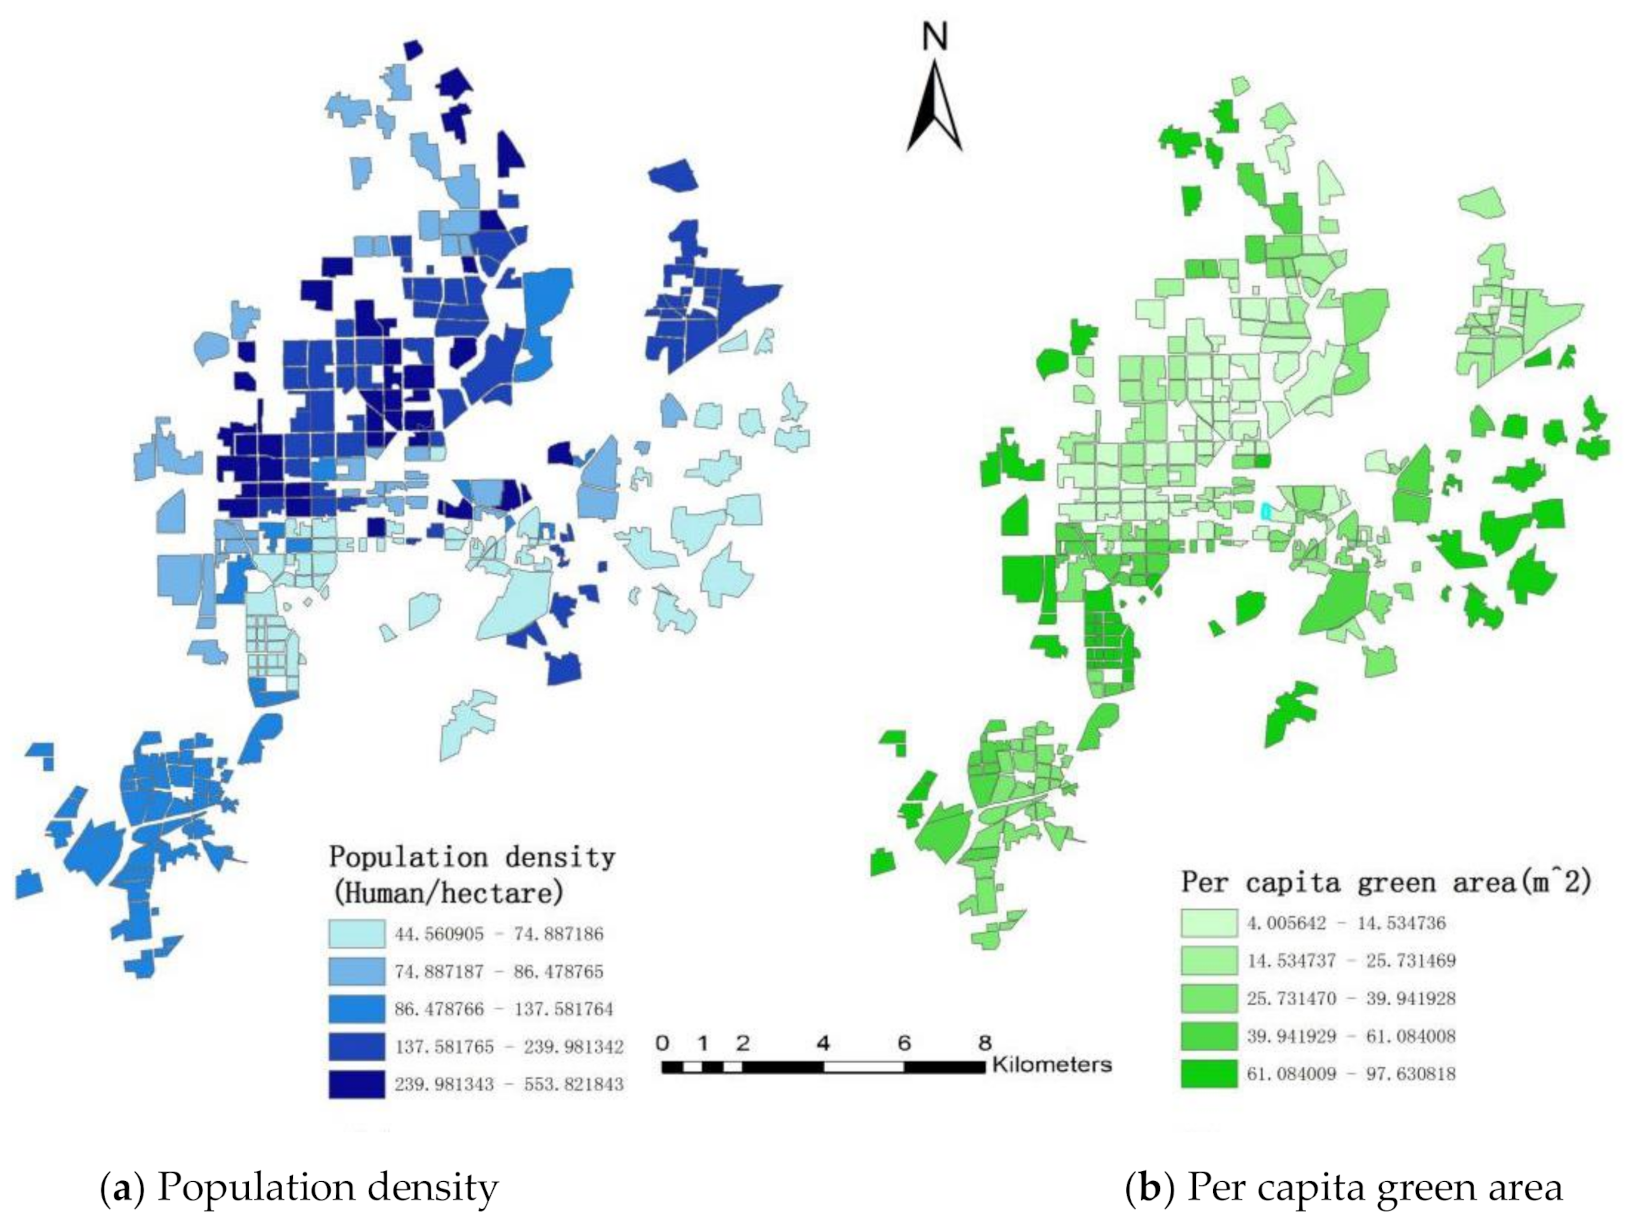
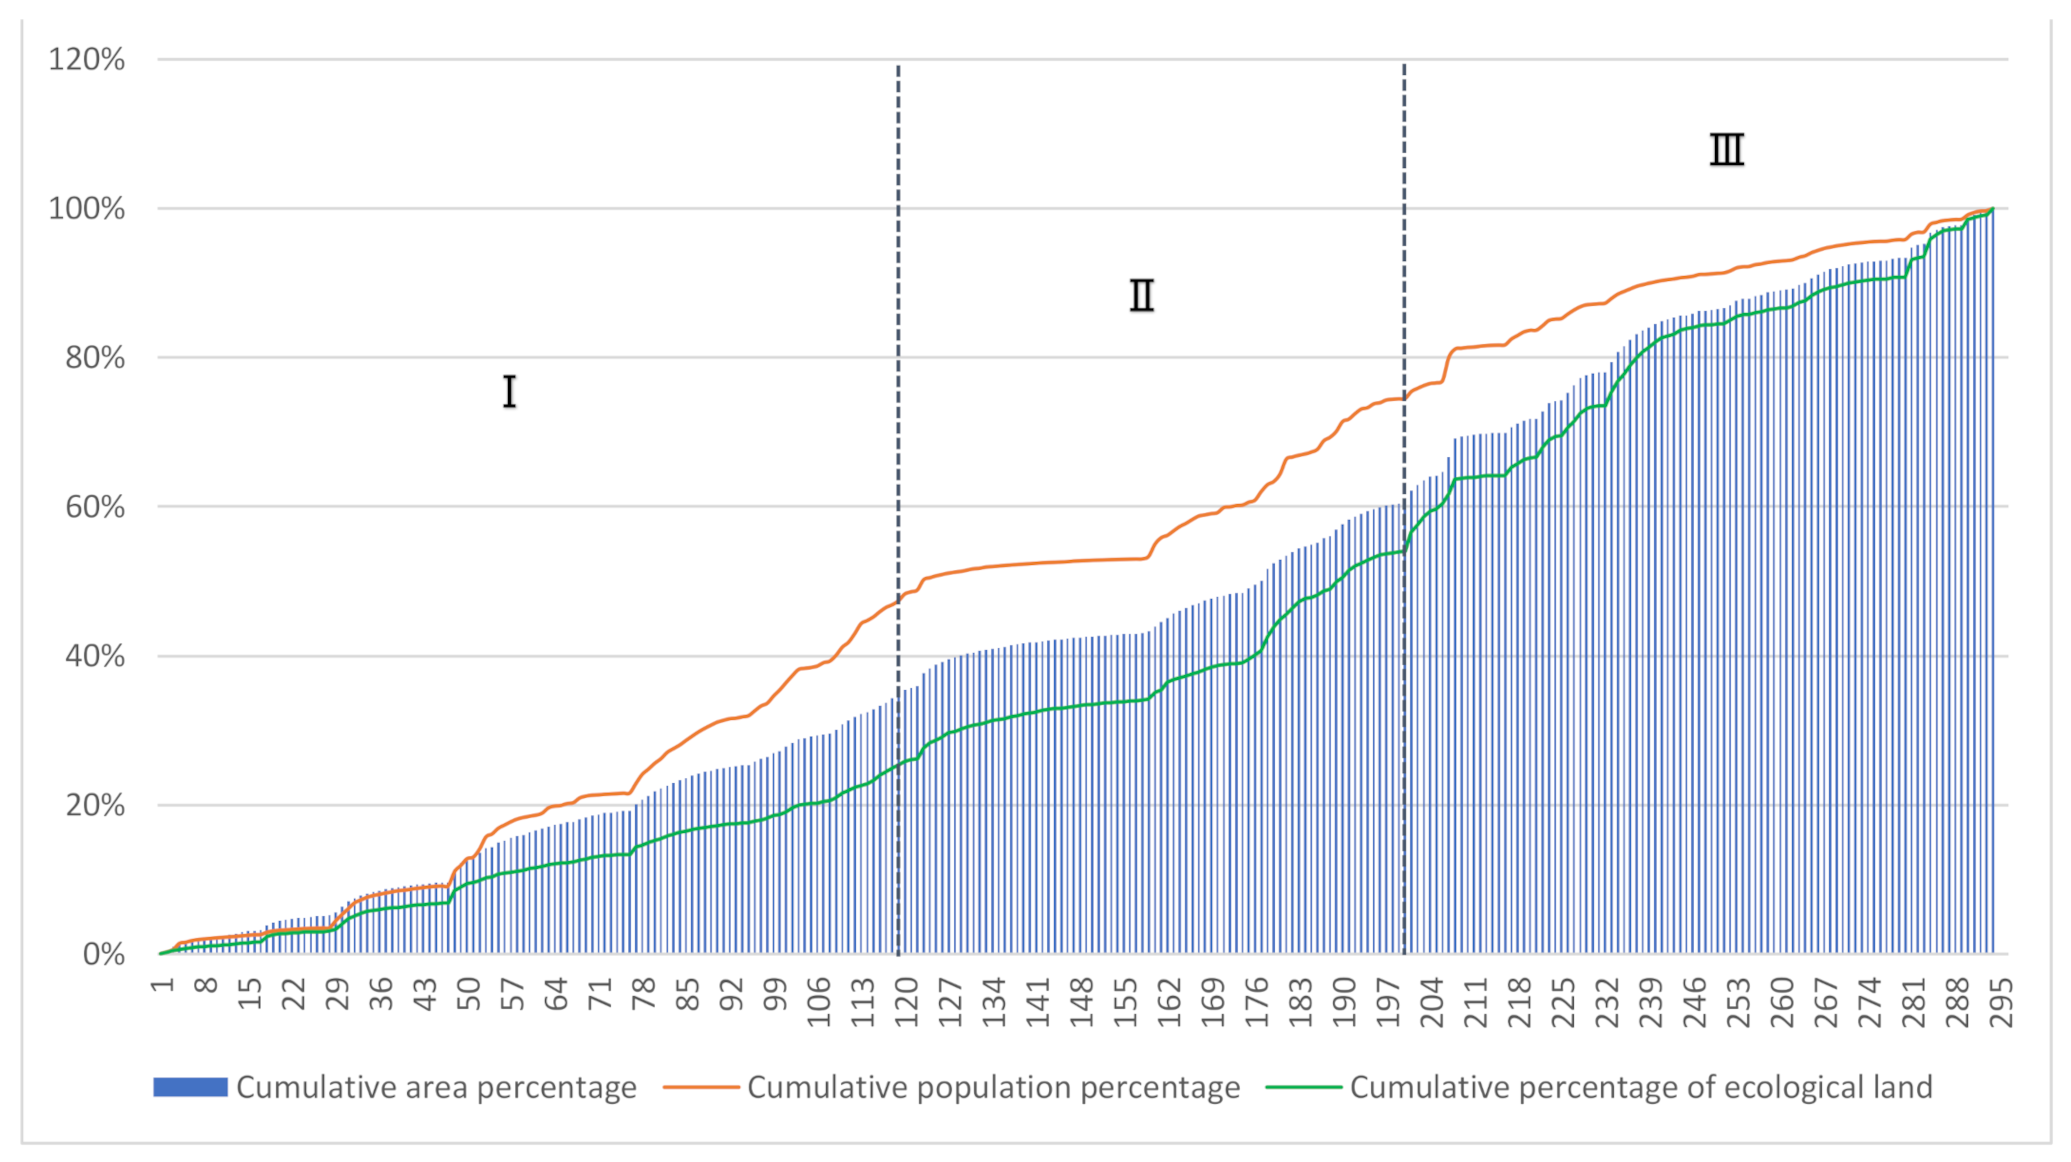
Analysis of Trade-Off Results of Population and Ecological Spaces

As the RFZs nearly cover half of the total area of built-up land in Tangshan and accommodate most of the population, which supports the city’s economic actives and enjoys ecological benefits, these zones are selected for further verification as typical zones. Using each RFZ as a unit, this paper calculated the mismatch coefficients of the study area. It is clarified that the ecological space allocation and population distribution of the whole district are mismatched (Gini index is 0.62, Theil index is 0.15), which indicates that the region does not pay enough attention to the ecological environment, and the allocation of ecological spaces has not kept pace with the intensive development of urban land. On the whole, the ecological environment of a city lags behind urban development.
According to the Urban Green Spaces Classification Standard, the per capita public ecological spaces in many FZs in Tangshan City has not reached the standard of 11 m2. Figure 6 provides spatial statistics on the population density and the spatial distribution of green in the RFZ. The population distribution generally shows a decreasing trend from the urban center to fringe, while the distribution of ecological spaces is just the opposite. The population density or per capita green area is less than 10, and according to China’s per capita green area standard, the ecological spaces are completely substandard. This distribution is against healthy and environmentally friendly urban development.
In the above, this study has obtained the economic and ecological intensive status of all FZs, in order to determine in which case the two will reach a relatively balanced state. This paper sorted the residential population, green area, and total area in descending order of regional benchmark land prices and analyzed the results as cumulative percentages. There is a positive correlation between population and local economic intensity, and there is also a positive correlation between green spaces and ecological intensity. The comparison of the cumulative increasing trend between the two and the total area can indicate the level of regional economy and ecology. It is assumed that in a balanced state, the growth trends of the three are even. When the growth trend of one side is greater than the growth of the total area, then this side is the dominant side. The results are shown in Figure 7.
As the result shows, that in the descending order of the land market price, the increasing trend of the population is significantly greater than that of the green spaces. Firstly, the ecological land curve has always been below the total area curve, while the residential population is the opposite, which indicates that the ecological intensive level of the whole region is not up to standard, and the economic intensive level is excessive. At the beginning (Stage I), the two curves are flush and below the total area curve. This shows that in FZs with high land prices, population and green spaces are more compatible and well-coordinated. In the next stage (Stage II), the population curve grows rapidly, far exceeding the other two. Additionally, the curve of ecological land is always lower than the one of total area, which indicates that the ecological level of the functional zone at this stage is relatively backward, and the population density is too high, and the economy and ecology have lost coordination. For FZs between 120th and 150th, the growth rate of the three curves is even and keeps increasing steadily. Next (Stage III), the gap between the ecological land curve and the total area curve gradually decreases, while the population curve growth rate slows.

4. Discussion and Conclusions

4.1. Main Achievements

The theory of economic intensity and ecological intensity was introduced into the research of urban functional land use, which provides a specific assessment method in the scope of FZ. The economic intensity evaluates the input and output for different functional areas, and the ecological factors are averaged in each FZ, which reflects the level of ecological land sharing and detection of the breadth, depth, and cohesion of ecological land use. This paper uses horizontal contrast in space to analyze different types of FZs and different plots of the same type of FZs and provides the ideal economic and ecological positioning of different types of FZs. This paper also uses typical areas to perform a mismatch analysis in order to find the current economic–ecological imbalance in Tangshan. Consequently, the status of land intensive use about economy and ecology in various types of FZs and different trade-offs in different FZs in Tangshan have come into focus.
The results show that Tangshan is currently in the developing stage of urbanization, where the dynamics of further development are mainly occupying the original ecological land and increasing land capital investment. The FZs in the center of the study area (such as RFZ and CFZ) present a state of high economy intensity and low ecology intensity, while the OFZs in the periphery of the city present a high degree of ecological intensity. Further verification of the CFZ reveals that it has the problems of economic surplus, overcrowded population, and insufficient ecological spaces.

4.2. Implications for Policy-Making and Urban Management

A resource-based city such as Tangshan always goes through rapid development, and at the same time, sacrifices the environment, which will cause congestion in the central city, insufficient per capita ecological spaces, and imbalance in the distribution of economic and ecological functions of various FZs. These models break the social trade-off between the economic input and the amount of urban public ecological spaces, indicating that local governments need to pay attention to the phenomenon of excessive economic investment in the old central city and substandard living environments.
According to the principle of diminishing marginal returns, in the process of continuous input, the marginal benefits will decrease after reaching the maximum value, so the output peaks at a certain stage. In this study, economic intensity in the process of urbanization fits this principle. The central area of Tangshan has reached the peak of economic output, accompanied by excessive economic investment. More consideration should be given to the layout of ecological spaces to achieve a more advanced urbanization.
Urban land use includes complex adaptive systems with spatially heterogeneous characteristics [20]. For certain types of cities (large population base, scarce land resources, in a rapid urbanization process), the higher the level of trade-off and the more reasonable land use will provide a more pleasant environment. For FZs such as residence, commercial, business, and capital investment can not only sustain the economic activities, but also accelerate the ecological space optimization. For OFZs outside the downtown area, policy-makers should protect their natural environment to improve their ecological intensity, and provide suburban parks for the city.

4.3. Limitation and Uncertainties

The research in this paper is based on the analysis of cross-section data and lacks the corresponding time series analysis. In the future, panel data can be used to verify the synergistic relationship between urban land economic and ecological use. The intensive land use and ecological cooperative use studied in this article is only a relative concept for comparison within the study area. This article does not distinguish the role of specific ecological spaces and does not specifically analyze the ecological spaces accessible to residents. The coordinated classification is uniform, but in the actual evaluation of urban land use, each FZ needs different land use efficiency and ecological benefits. In the future, the specific situation of urban land for each function can be further analyzed. It is considered that Tangshan may be in its infancy in the process of developing as an eco-city, and the pattern of spatial distribution may not be obvious. From a micro perspective, ecological data do not reflect the specific contact between people and ecological spaces at street scale. In the future, researchers can further analyze people’s subjective acceptance of the neighborhood’s ecological spaces.

Author Contributions

Conceptualization, W.S. and J.Z.; methodology, X.Z. and W.S.; software, W.S.; validation, J.Z. and W.S.; investigation, X.G. and S.L.; resources, X.Z.; writing—original draft preparation, W.S.; writing—review and editing, W.S.; visualization, W.S. All authors have read and agreed to the published version of the manuscript.

Funding

This article is supported by the National Natural Science Foundation of China (Grant No: 41971260, 41571507) and the Program for evaluation of land use intensity of Tangshan.

Institutional Review Board Statement

Not applicable.

Informed Consent Statement

Not applicable.

Data Availability Statement

Data sharing not applicable.

Conflicts of Interest

The authors declare no conflict of interest.

References

  1. Zeng, H.; Xia, J.; Zhang, L. The Current Status of Urban Landscape Ecology Study and Its Perspectives. Sci. Geogr. Sinica 2003, 23, 484–492. [Google Scholar]
  2. Pickett, S.; Cadenasso, M.; Grove, J.; Boone, C.G.; Groffman, P.M.; Irwin, E.; Kaushal, S.S.; Marshall, V.; McGrath, B.P.; Nilon, C.; et al. Urban ecological systems: Scientific foundations and a decade of progress. J. Environ. Manag. 2011, 92, 331–362. [Google Scholar] [CrossRef]
  3. Chen, S.-Y.; Liu, Y.-L.; Chen, C.-F. Evaluation of Land-Use Efficiency Based on Regional Scale: A Case Study in Zhanjiang, Guangdong Province. J. China Univ. Min. Technol. 2007, 17, 215–219. [Google Scholar] [CrossRef]
  4. Eickhouta, B.; Van Meijl, H.; Tabeau, A.; Van Rheenen, T. Economic and ecological consequences of four European land use scenarios. Land Use Policy 2007, 24, 562–575. [Google Scholar] [CrossRef]
  5. Li, G.; Jiang, C.; Du, J.; Jia, Y.; Bai, J. Spatial differentiation characteristics of internal ecological land structure in rural settlements and its response to natural and socio-economic conditions in the Central Plains, China. Sci. Total Environ. 2020, 709, 135932. [Google Scholar] [CrossRef]
  6. Zhang, J.; Fu, M.; Zhang, Z.; Tao, J.; Fu, W. A trade-off approach of optimal land allocation between socio-economic development and ecological stability. Ecol. Model. 2014, 272, 175–187. [Google Scholar] [CrossRef]
  7. Lambin, E.F.; Meyfroidt, P. Land use transitions: Socio-ecological feedback versus socio-economic change. Land Use Policy 2010, 27, 108–118. [Google Scholar] [CrossRef]
  8. Cotter, M.; Berkhoff, K.; Gibreel, T.; Ghorbani, A.; Golbon, R.; Nuppenau, E.-A.; Sauerborn, J. Designing a sustainable land use scenario based on a combination of ecological assessments and economic optimization. Ecol. Indic. 2014, 36, 779–787. [Google Scholar] [CrossRef]
  9. Cooper, A.; Shine, T.; McCann, T.; Tidane, D. An ecological basis for sustainable land use of Eastern Mauritanian wetlands. J. Arid Environ. 2006, 67, 116–141. [Google Scholar] [CrossRef]
  10. Zhang, S.L.; Wang, Z.S.; Hou, H.P. Comment on the Intensive and Ecological Cooperative Use of Built-up Land. China Land 2014, 7, 29–30. (In Chinese) [Google Scholar]
  11. Alberti, M. Maintaining ecological integrity and sustaining ecosystem function in urban areas. Curr. Opin. Environ. Sustain. 2010, 2, 178–184. [Google Scholar] [CrossRef]
  12. Wellmann, T.; Haase, D.; Knapp, S.; Salbach, C.; Selsam, P.; Lausch, A. Urban land use intensity assessment: The potential of spatio-temporal spectral traits with remote sensing. Ecol. Indic. 2018, 85, 190–203. [Google Scholar] [CrossRef]
  13. Yang, S.H. The Content of Intensive Exploitation in City Land and Its Evaluating Index Sign System to Set up. Inq. Econ. Issues 2007, 1, 27–31. [Google Scholar]
  14. Li, Z.; Luan, W.; Zhang, Z.; Su, M. Relationship between urban construction land expansion and population/economic growth in Liaoning Province, China. Land Use Policy 2020, 99, 105022. [Google Scholar] [CrossRef]
  15. Tao, Z.H. Discussion on Several Basic Problems of Urban Intensive Land Use. China Land Sci. 2000, 14, 1–5. [Google Scholar]
  16. Li, Q.; Dong, Z.; Du, G.; Yang, A. Spatial Differentiation of Cultivated Land Use Intensification in Village Settings: A Survey of Typical Chinese Villages. Land 2021, 10, 249. [Google Scholar] [CrossRef]
  17. Zhou, S.; Wang, K.; Yang, S.; Li, W.; Zhang, Y.; Zhang, B.; Fu, Y.; Liu, X.; Run, Y.; Chubwa, O.G.; et al. Warming Effort and Energy Budget Difference of Various Human Land Use Intensity: Case Study of Beijing, China. Land 2020, 9, 280. [Google Scholar] [CrossRef]
  18. Wu, J. (Jingle) Making the Case for Landscape Ecology: An Effective Approach to Urban Sustainability. Landsc. J. 2008, 27, 41–50. [Google Scholar] [CrossRef] [Green Version]
  19. Wu, J. Urban sustainability: An inevitable goal of landscape research. Landsc. Ecol. 2010, 25, 1–4. [Google Scholar] [CrossRef] [Green Version]
  20. Wu, J. Urban ecology and sustainability: The state-of-the-science and future directions. Landsc. Urban Plan. 2014, 125, 209–221. [Google Scholar] [CrossRef]
  21. Park, R.; Burgess, E.; McKenzie, R. The City: Suggestions for the Investigation of Human Behavior in the Urban Environment; The University of Chicago Press: Chicago, IL, USA, 1925. [Google Scholar]
  22. Wilson, F. Urban Ecology: Urbanization and Systems of Cities. Annu. Rev. Sociol. 1984, 10, 283–307. [Google Scholar] [CrossRef] [PubMed]
  23. Guihe, J. Ecoevaluation and ecodevice of land. Acta Geogr. Sin. 1986, 41, 1–7. [Google Scholar]
  24. Luck, M.; Wu, J. A gradient analysis of urban landscape pattern: A case study from the Phoenix metropolitan region, Arizona, USA. Landsc. Ecol. 2002, 17, 327–339. [Google Scholar] [CrossRef]
  25. Getter, K.L.; Rowe, D.B. The Role of Extensive Green Roofs in Sustainable Development. HortScience 2006, 41, 1276–1285. [Google Scholar] [CrossRef] [Green Version]
  26. Govindarajulu, D. Urban green space planning for climate adaptation in Indian cities. Urban Clim. 2014, 10, 35–41. [Google Scholar] [CrossRef]
  27. Niemelä, J. Ecology of urban green spaces: The way forward in answering major research questions. Landsc. Urban Plan. 2014, 125, 298–303. [Google Scholar] [CrossRef]
  28. Bosch, M.A.V.D.; Mudu, P.; Uscila, V.; Barrdahl, M.; Kulinkina, A.; Staatsen, B.; Swart, W.; Kruize, H.; Zurlyte, I.; Egorov, A.I. Development of an urban green space indicator and the public health rationale. Scand. J. Public Health 2015, 44, 159–167. [Google Scholar] [CrossRef]
  29. Van den Berg, M.; Wendel-Vos, W.; Van Poppel, M.; Kemper, H.; van Mechelen, W.; Maas, J. Health benefits of green spaces in the living environment: A systematic review of epidemiological studies. Urban For. Urban Green. 2015, 14, 806–816. [Google Scholar] [CrossRef]
  30. Jennings, V.; Larson, L.; Yun, J. Advancing Sustainability through Urban Green Space: Cultural Ecosystem Services, Equity, and Social Determinants of Health. Int. J. Environ. Res. Public Health 2016, 13, 196. [Google Scholar] [CrossRef] [Green Version]
  31. Su, S.; Zhang, Q.; Pi, J.; Wan, C.; Weng, M. Public health in linkage to land use: Theoretical framework, empirical evidence, and critical implications for re-connecting health promotion to land use policy. Land Use Policy 2016, 57, 605–618. [Google Scholar] [CrossRef]
  32. Richardson, E.A.; Pearce, J.; Mitchell, R.; Kingham, S. Role of physical activity in the relationship between urban green space and health. Public Health 2013, 127, 318–324. [Google Scholar] [CrossRef] [PubMed] [Green Version]
  33. Cohen, D.A.; McKenzie, T.L.; Sehgal, A.; Williamson, S.; Golinelli, D.; Lurie, N. Contribution of Public Parks to Physical Activity. Am. J. Public Health 2007, 97, 509–514. [Google Scholar] [CrossRef] [PubMed]
  34. Schüle, S.A.; Gabriel, K.M.A.; Bote, G. Relationship between neighbourhood socioeconomic position and neighbourhood public green space availability: An environmental inequality analysis in a large German city applying generalized linear models. Int. J. Hyg. Environ. Health 2017, 220, 711–718. [Google Scholar] [CrossRef] [PubMed]
  35. WEI, L.; LIU, Y.; LI, B. Construction of new countryside in the pearl river delta: Gradual improvement vs. thorough reconstruction. City Plan. Rev. 2010, 36–41. (In Chinese) [Google Scholar]
  36. Soja, E.W. The socio-spatial dialectic. Ann. Assoc. Am. Geogr. 1980, 70, 207–225. [Google Scholar] [CrossRef]
  37. Barbosa, O.; Tratalos, J.A.; Armsworth, P.R.; Davies, R.G.; Fuller, R.A.; Johnson, P.; Gaston, K.J. Who benefits from access to green space? A case study from Sheffield, UK. Landsc. Urban Plan. 2007, 83, 187–195. [Google Scholar] [CrossRef]
  38. Pincetl, S.; Gearin, E. The Reinvention of Public Green Space. Urban Geogr. 2005, 26, 365–384. [Google Scholar] [CrossRef]
  39. Tzoulas, K.; Korpela, K.; Venn, S.; Yli-Pelkonen, V.; Kaźmierczak, A.; Niemela, J.; James, P. Promoting ecosystem and human health in urban areas using Green Infrastructure: A literature review. Landsc. Urban Plan. 2007, 81, 167–178. [Google Scholar] [CrossRef] [Green Version]
  40. Van Zoest, J.; Hopman, M. Taking the economic benefits of green space into account: The story of the Dutch TEEB for Cities project. Urban Clim. 2014, 7, 107–114. [Google Scholar] [CrossRef]
  41. Baycan-Levent, T.; Nijkamp, P. Planning and Management of Urban Green Spaces in Europe: Comparative Analysis. J. Urban Plan. Dev. 2009, 135, 1–12. [Google Scholar] [CrossRef]
  42. James, P.; Tzoulas, K.; Adams, M.; Barber, A.; Box, J.; Breuste, J.; Elmqvist, T.; Frith, M.; Gordon, C.; Greening, K.; et al. Towards an integrated understanding of green space in the European built environment. Urban For. Urban Green. 2009, 8, 65–75. [Google Scholar] [CrossRef]
  43. Chen, W.Y.; Wang, D. Economic development and natural amenity: An econometric analysis of urban green spaces in China. Urban For. Urban Green. 2013, 12, 435–442. [Google Scholar] [CrossRef]
  44. Wolch, J.R.; Byrne, J.; Newell, J.P. Urban green space, public health, and environmental justice: The challenge of making cities just green enough. Landsc. Urban Plan. 2014, 125, 234–244. [Google Scholar] [CrossRef] [Green Version]
  45. Lin, G.C.S.; Yi, F. Urbanization of Capital or Capitalization on Urban Land? Land Development and Local Public Finance in Urbanizing China. Urban Geogr. 2011, 32, 50–79. [Google Scholar] [CrossRef]
  46. Shen, J.; Wu, F. Restless Urban Landscapes in China: A Case Study of Three Projects in Shanghai. J. Urban Aff. 2012, 34, 255–277. [Google Scholar] [CrossRef]
  47. Wang, H.B.; Li, H.; Ming, H.B.; Hu, Y.H.; Chen, J.K.; Zhao, B. Past land use decisions and socioeconomic factors influence urban greenbelt development: A case study of Shanghai, China. Landsc. Ecol. 2014, 29, 1759–1770. [Google Scholar] [CrossRef]
  48. Yang, J.; Huang, C.; Zhang, Z.; Wang, L. The temporal trend of urban green coverage in major Chinese cities between 1990 and Urban For. Urban Green. 2014, 13, 19–27. [Google Scholar] [CrossRef]
  49. Zhang, L. Conceptualizing China’s urbanization under reforms. Habitat Int. 2008, 32, 452–470. [Google Scholar] [CrossRef]
  50. Tan, M.; Li, X.; Lu, C. Urban land expansion and arable land loss of the major cities in China in the 1990s. Sci. China 2005, 48, 1492–1500. [Google Scholar] [CrossRef]
  51. Wang, G. The Current Status of Urban Landscape Ecology Study and Its Perspectives. Land Resour. 2008, 22–23. [Google Scholar]
  52. Wang, Z.; Zhang, S.; Jia, R.; Zhang, Y.; Zhang, J.; Zhao, J. Synergistic mechanism on intensive and ecological utilization of urban construction land. J. Jiangsu Normal Univ. 2019, 35, 14–17. [Google Scholar]
  53. Cerqueti, R.; Ausloos, M. Statistical assessment of regional wealth inequalities: The Italian case. Qual. Quant. 2014, 49, 2307–2323. [Google Scholar] [CrossRef]
  54. Wang, J.-N.; Lu, Y.-T.; Zhou, J.-S.; Li, Y.; Dong, C. Analysis of China resource-environment Gini coefficient based on GDP. China Environ. Sci. 2006, 26, 111–115. [Google Scholar]
  55. Kabisch, N.; Haase, D. Green spaces of European cities revisited for 1990–2006. Landsc. Urban Plan. 2013, 110, 113–122. [Google Scholar] [CrossRef]
  56. Kanbur, R.; Zhang, X. Which regional inequality? The evolution of rural–urban and inland–coastal inequality in China from 1983 to 1995. J. Comp. Econ. 1999, 27, 686–701. [Google Scholar] [CrossRef] [Green Version]
  57. Conceicao, P.; Ferreira, P. The Young Person’s Guide to the Theil Index: Suggesting Intuitive Interpretations and Exploring Analytical Applications; Social Science Electronic Publishing: Rochester, NY, USA, 2000. [Google Scholar]
Figure 1. Location of study area and classification of FZs in Tangshan.
Land 10 00551 g001
Figure 2. Research framework.
Land 10 00551 g002
Figure 3. Evaluation results and spatial distribution of economic intensity of FZs.
Land 10 00551 g003
Figure 4. Evaluation results and spatial distribution of ecological intensity of FZs.
Land 10 00551 g004
Figure 5. Scatter plot and confidence ellipse of economic and ecological intensity of FZs.
Land 10 00551 g005
Figure 6. Population density and per capita green area.
Land 10 00551 g006
Figure 7. People–land–greenspace percentage accumulation trend.
Land 10 00551 g007
Table 1. Data resources and descriptions.
TypeDataFormatSource
StatisticalGDPText2015 Tangshan Statistical Yearbook
DemographyTextThe Sixth National Population Census of China
Benchmark land price and Transaction land priceText2015 Tangshan Statistical Yearbook
Reports/plans relatedLand presentTextTangshan City Land Use Master Plan (2006–2020)
City planTextTangshan City Master Plan (2011–2020)
Land transfer dataTextTangshan City Land Transfer Records (2014)
SpatialFZ classificationVectorThe second national land survey cadastral data (2009)
Land presentVectorLand use change survey database (2014)
Remote sensing imagesRasterRemote sensing image (MODIS; Landsat8, 30 M, 2014, www.gscloud.cn)
Field research vector dataVectorField survey (land category and building information)
Table 2. Indicator system based on FZ type.
TypeIndicatorIdeal ValueDetermination BasisWeight
RFZComprehensive floor area ratio0.8–5.6Comprehensive method0.28
Population density138 people/hm2Control indicator0.24
Infrastructure completeness100%Extreme value method0.2
Residential land price level1.51/4 quartile method0.16
Building density33–53%Comprehensive method0.12
CFZComprehensive floor area ratio0.6–6Comprehensive method0.28
Infrastructure completeness100%Extreme value method0.16
Commercial land price level1.31/4 quartile method0.24
Building density35–55%Comprehensive method0.12
Commercial property occupancy rate95%Extreme value method0.2
IFZComprehensive floor area ratio0.46–4.3Comprehensive method0.28
Infrastructure completeness100%Extreme value method0.16
Total fixed assets of the unit landCNY 45 million/hm21/4 quartile method0.2
Total revenue of unit land use industryCNY 80 million/hm21/4 quartile method0.24
Building density35–45%Comprehensive method0.12
PFZComprehensive floor area ratio0.85–1.77Comprehensive method0.34
Infrastructure completeness100%Extreme value method0.22
Number of administrative staff per unit area200 people/hm21/4 quartile method0.28
Building density36–47%Comprehensive method0.16
EFZComprehensive floor area ratio0.77–6.5Comprehensive method0.34
Infrastructure completeness100%Extreme value method0.22
Number of students per unit area260 people/hm21/4 quartile method0.28
Building density32–60%Comprehensive method0.16
OFZComprehensive floor area ratio0.47–3.5Comprehensive method0.6
Building density32–62%Comprehensive method0.4
Table 3. Results of economic intensity in FZs.
FZ TypeHigh Level (0.8–1.0)Medium Level (0.6–0.8)Low Level (0–0.6)Total
AreaQuantityAreaQuantityAreaQuantityAreaQuantity
ha%No.%ha%No.%ha%No.%haNo.
RFZ4869.8661.2819767.011876.3823.616020.411201.1315.113712.597947.38294
CFZ293.8533.523239.51569.7164.984656.7913.141.533.7876.781
IFZ1440.4338.511419.44200.815.3768.332099.6356.135272.223740.8872
PFZ66.5340.671647.0668.6741.981235.2928.3617.34617.65163.5734
EFZ286.3559.871955.8885.7617.93926.47106.1822.2617.65478.334
OFZ199.466.281624.24866.3727.281218.182110.2966.443857.583176.1266
Total7156.4843.6829450.63667.7222.3914524.965558.7333.9314224.4416,382.94581
Table 4. Results of ecological intensity in FZs.
FZ TypeHigh Level (0.8–1.0)Medium Level (0.6–0.8)Low Level (0–0.6)Total
AreaQuantityAreaQuantityAreaQuantityAreaQuantity
ha%No.%ha%No.%ha%No.%haNo.
RFZ211.852.6741.362451.4630.846823.135284.0766.4922275.517947.38294
CFZ13.131.522.47369.9542.21113.58493.6156.36883.95876.781
IFZ124.943.3422.781393.3137.252737.52222.6359.414359.723740.8872
PFZ000059.3536.28720.59104.2363.722779.41163.5734
EFZ29.66.1912.9431.546.5912.94417.1587.223294.12478.334
OFZ525.3916.5457.582148.8267.653248.49501.9115.82943.943176.1266
Total904.915.52142.416454.4239.414625.139023.6155.0842172.4616,382.94581
Publisher’s Note: MDPI stays neutral with regard to jurisdictional claims in published maps and institutional affiliations.

