
Predicting Bioaccumulation of Potentially Toxic Element in Soil–Rice Systems Using Multi-Source Data and Machine Learning Methods: A Case Study of an Industrial City in Southeast China

 ,
,
Abstract
:1. Introduction
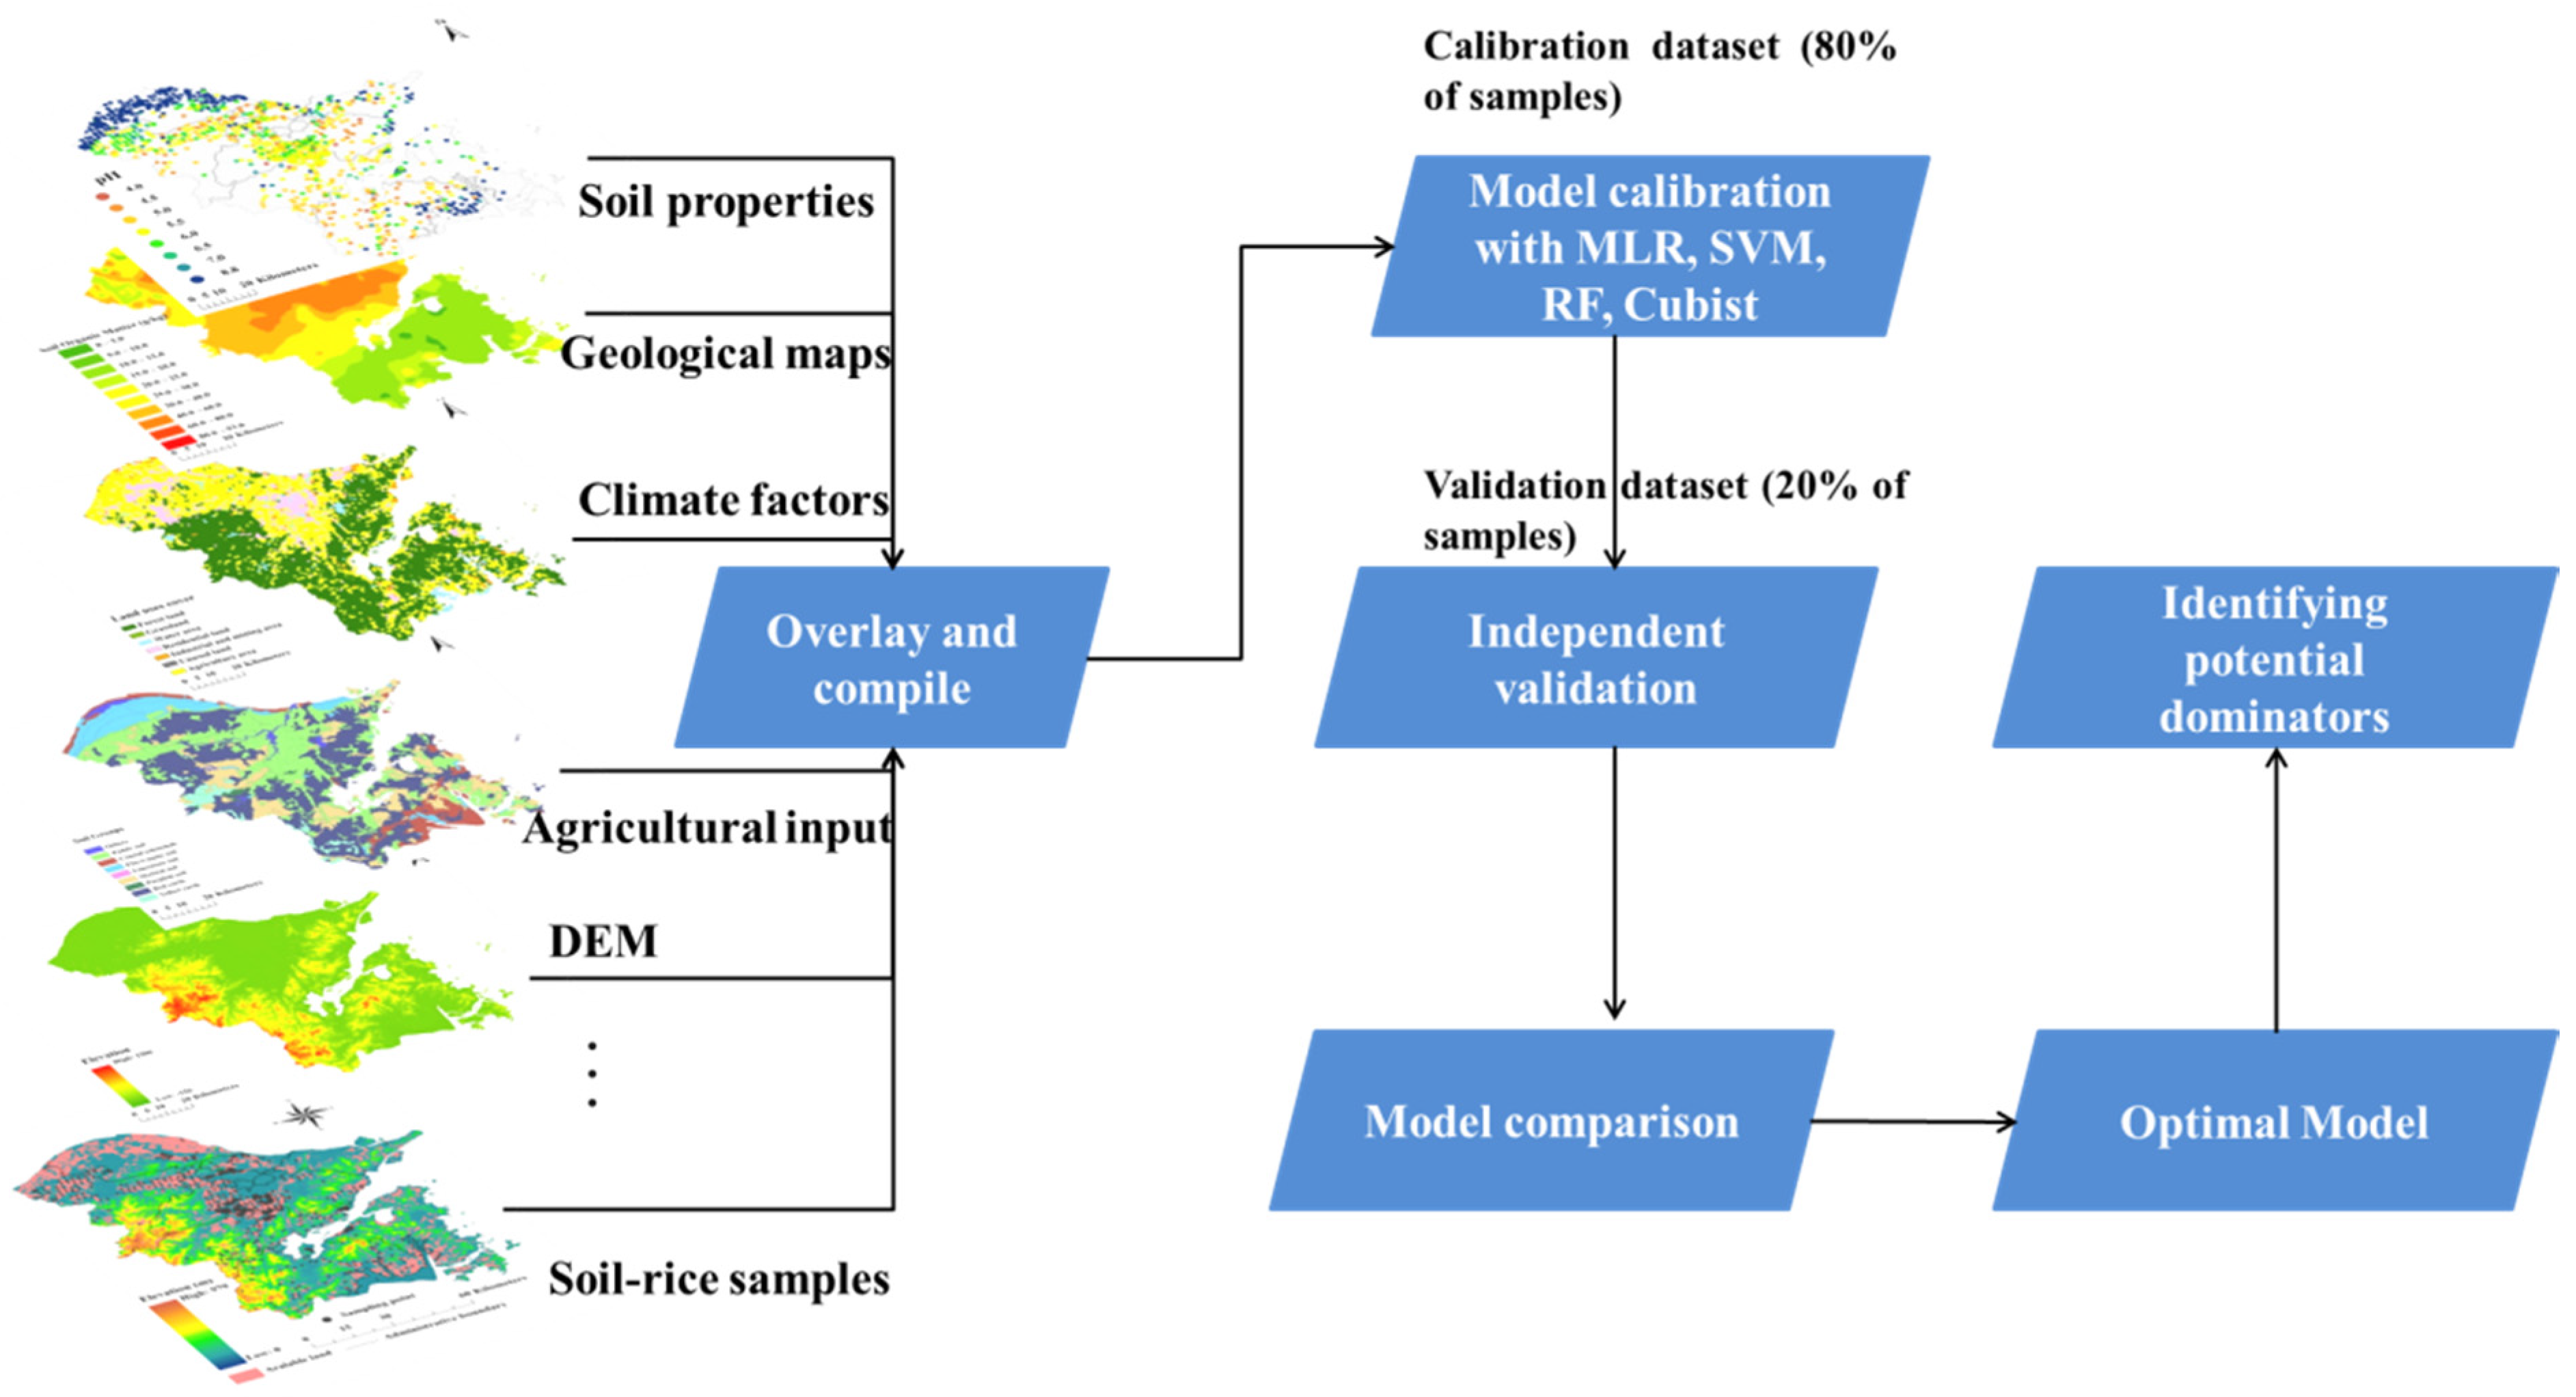
2. Materials and Methods
2.1. Study Area
2.2. Sampling and Chemical Analysis
2.3. Model Construction Algorithms
2.3.1. Multiple Linear Regression (MLR)
2.3.2. Support Vector Machines (SVM)
2.3.3. Random Forest (RF)
2.3.4. Cubist
2.4. Data Collection
2.5. Data Analysis
3. Results
3.1. PTE Content in Soil and Rice Grains
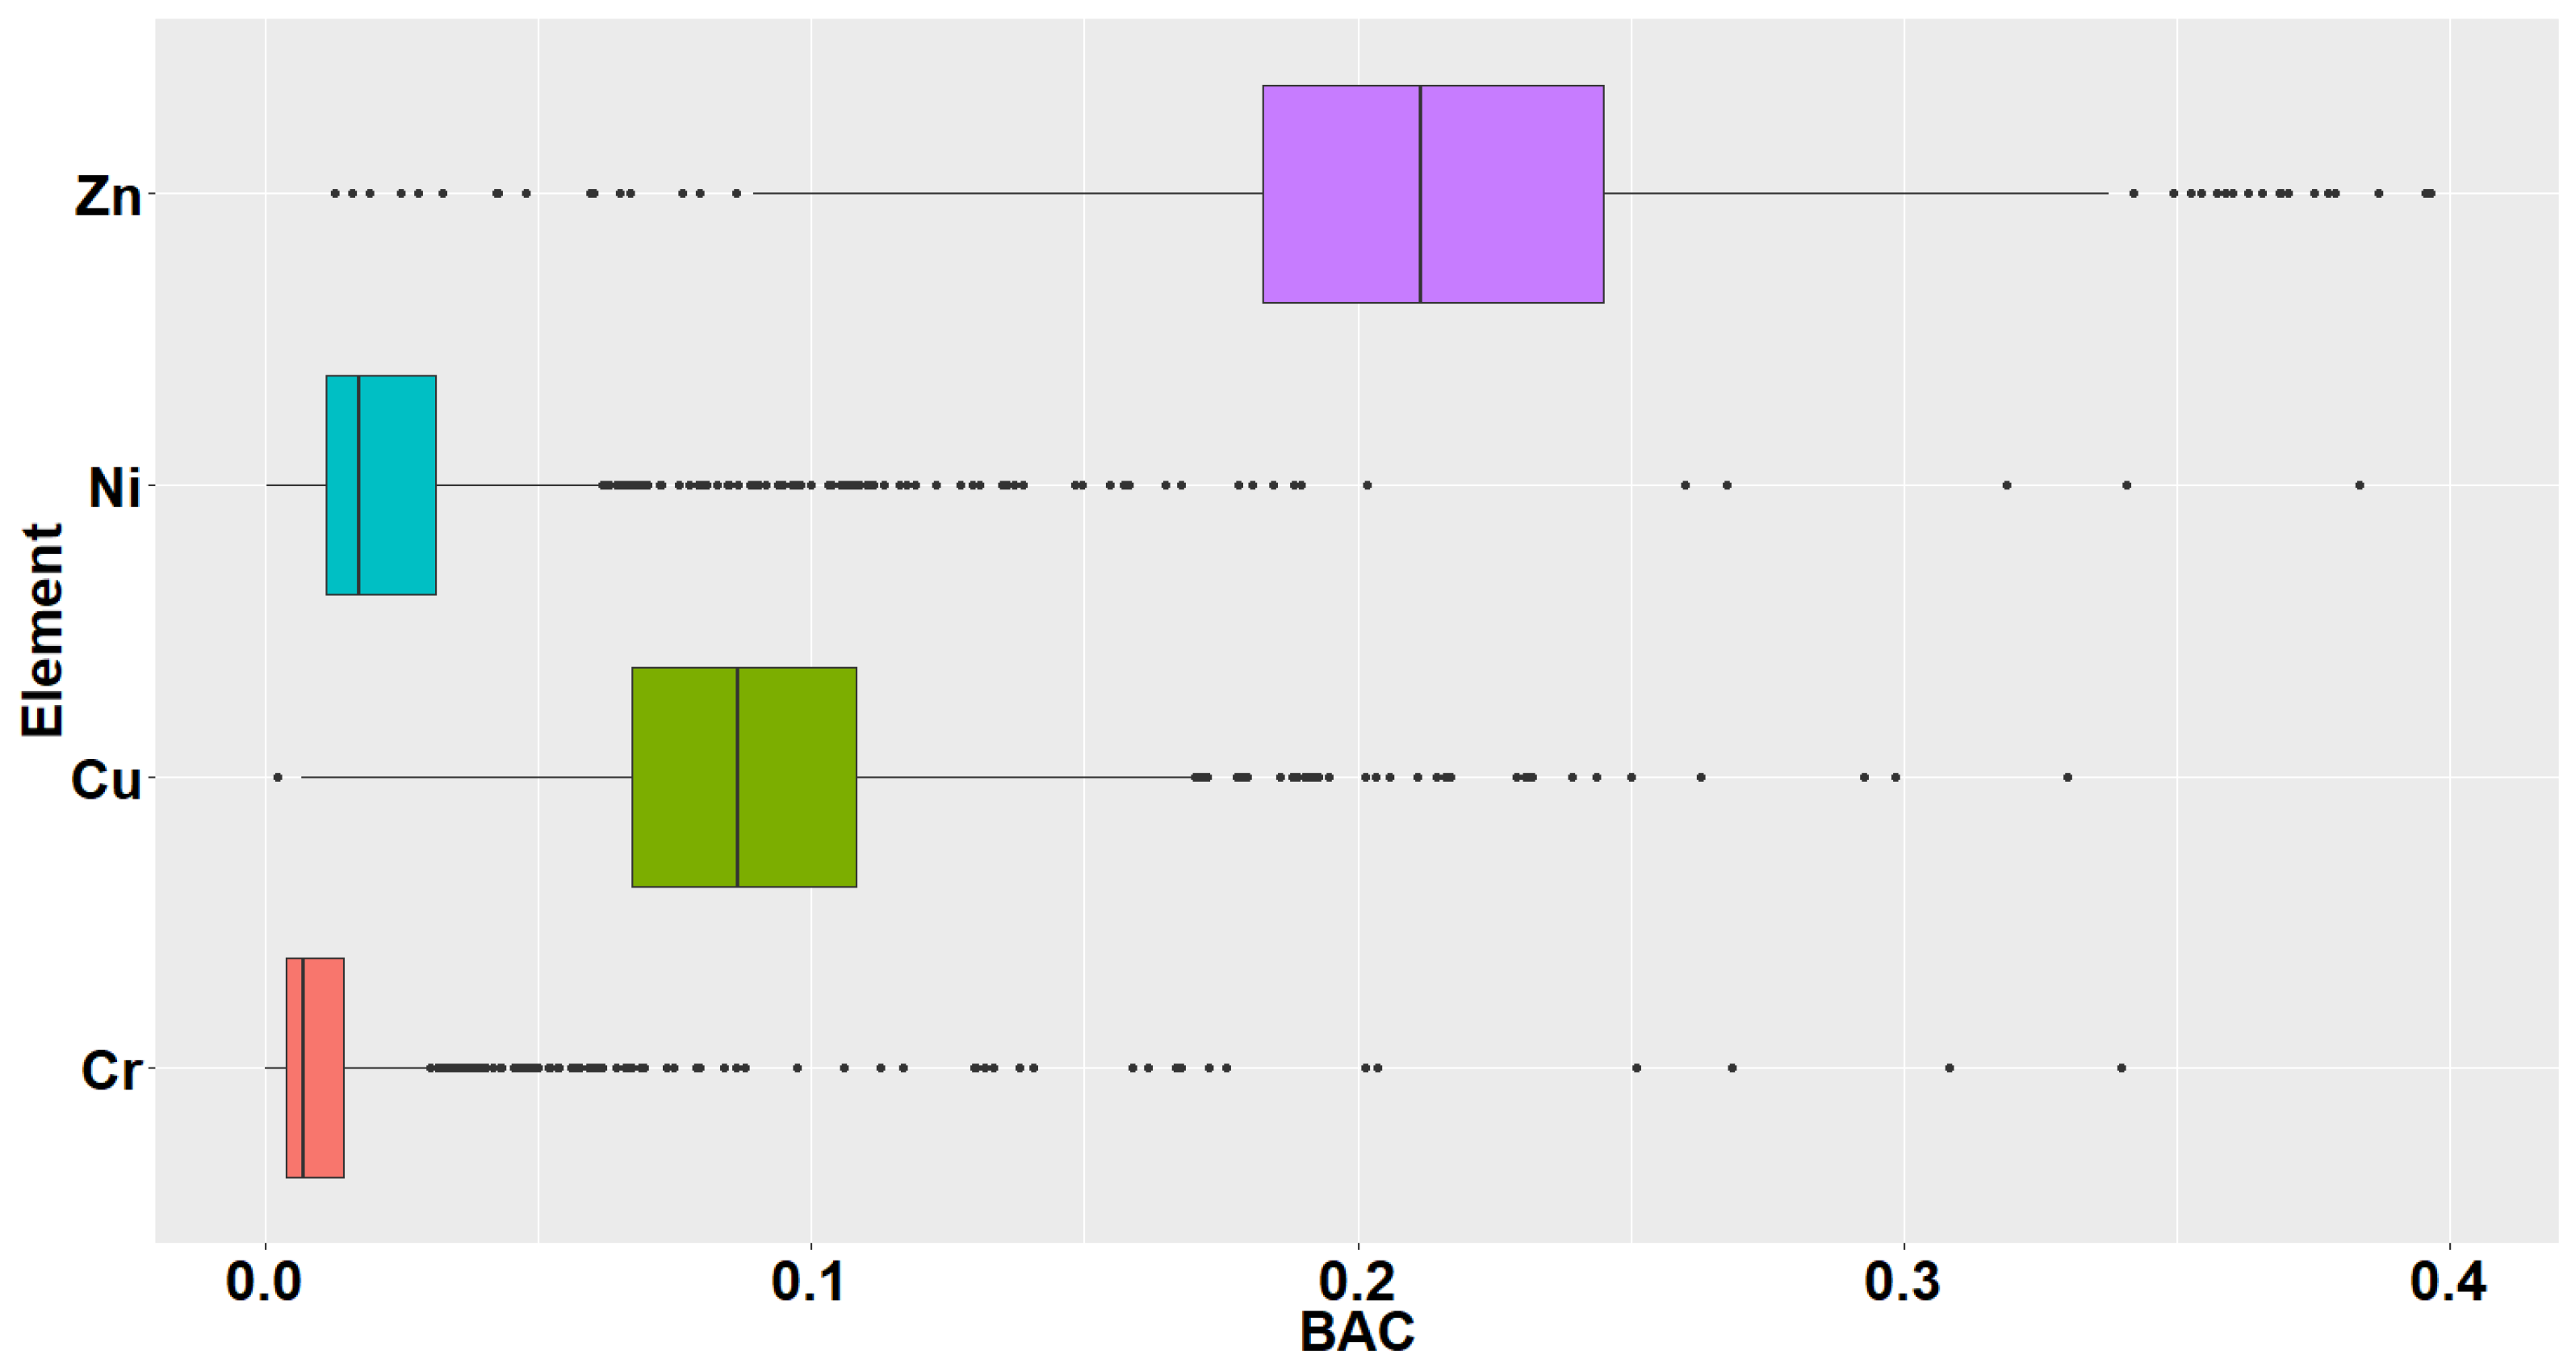
3.2. BAC of PTEs from Soil to Rice
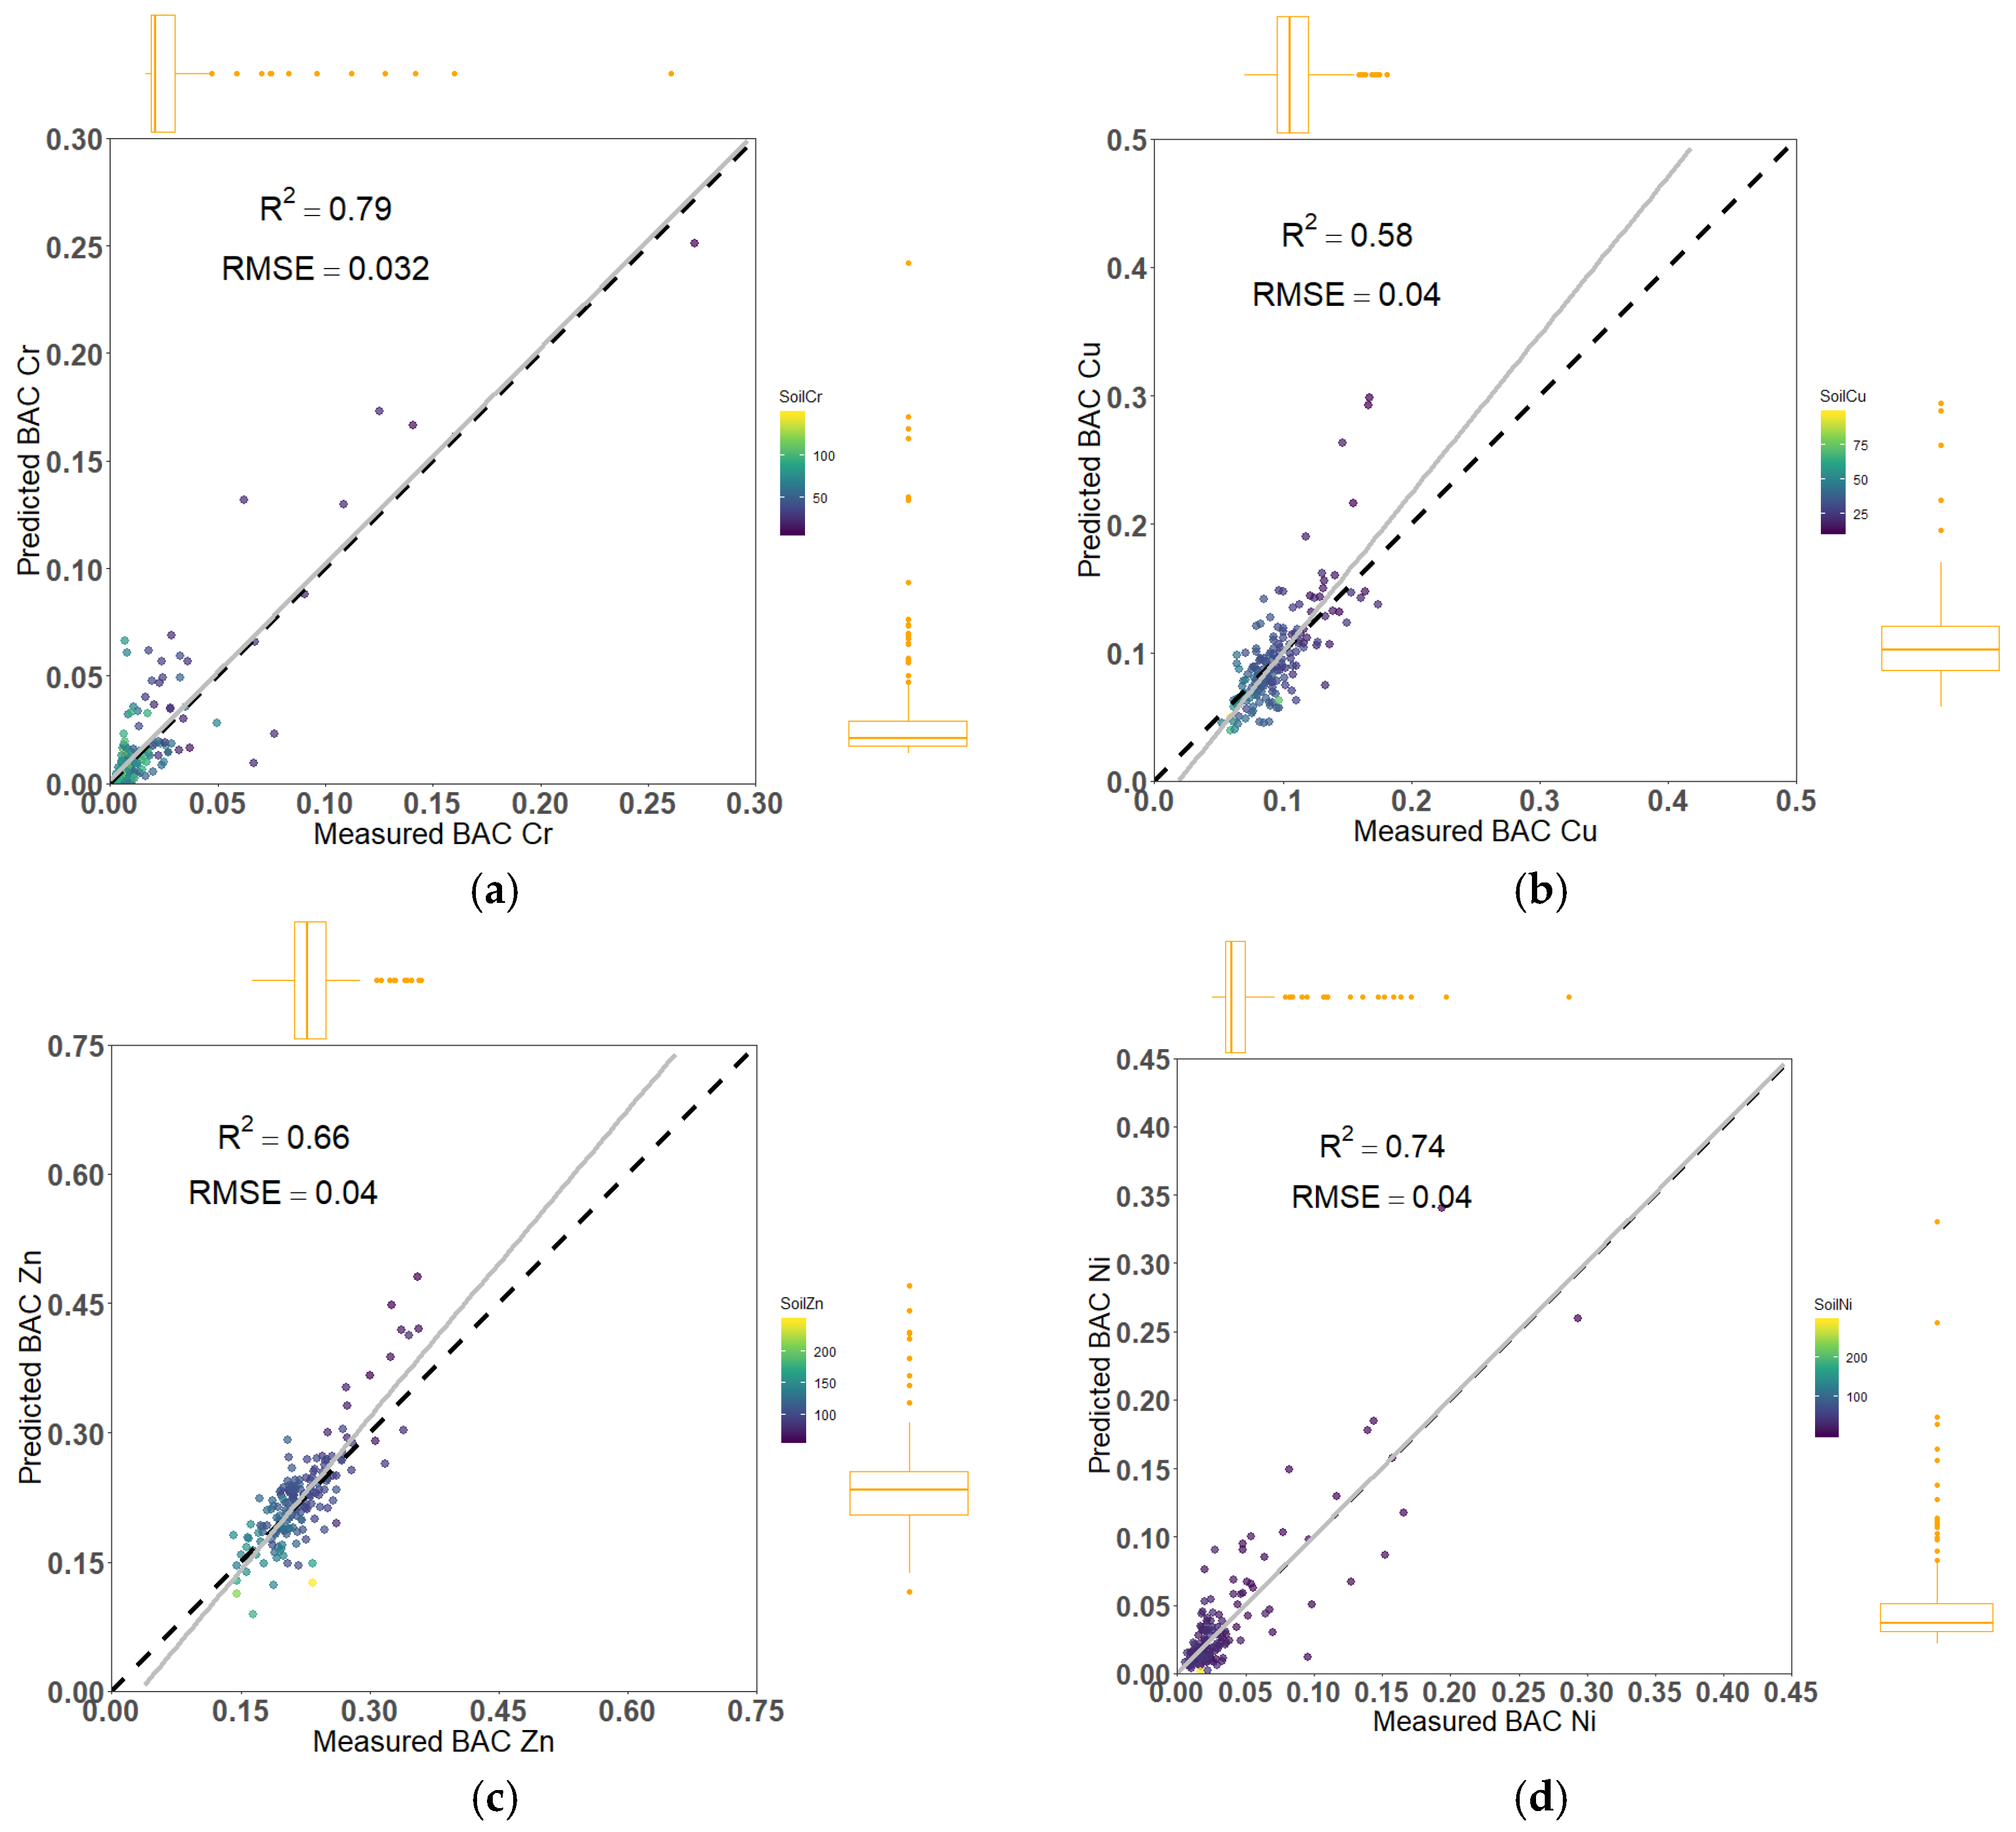
3.3. Modeling the Transfer of PTEs from Soil to Rice
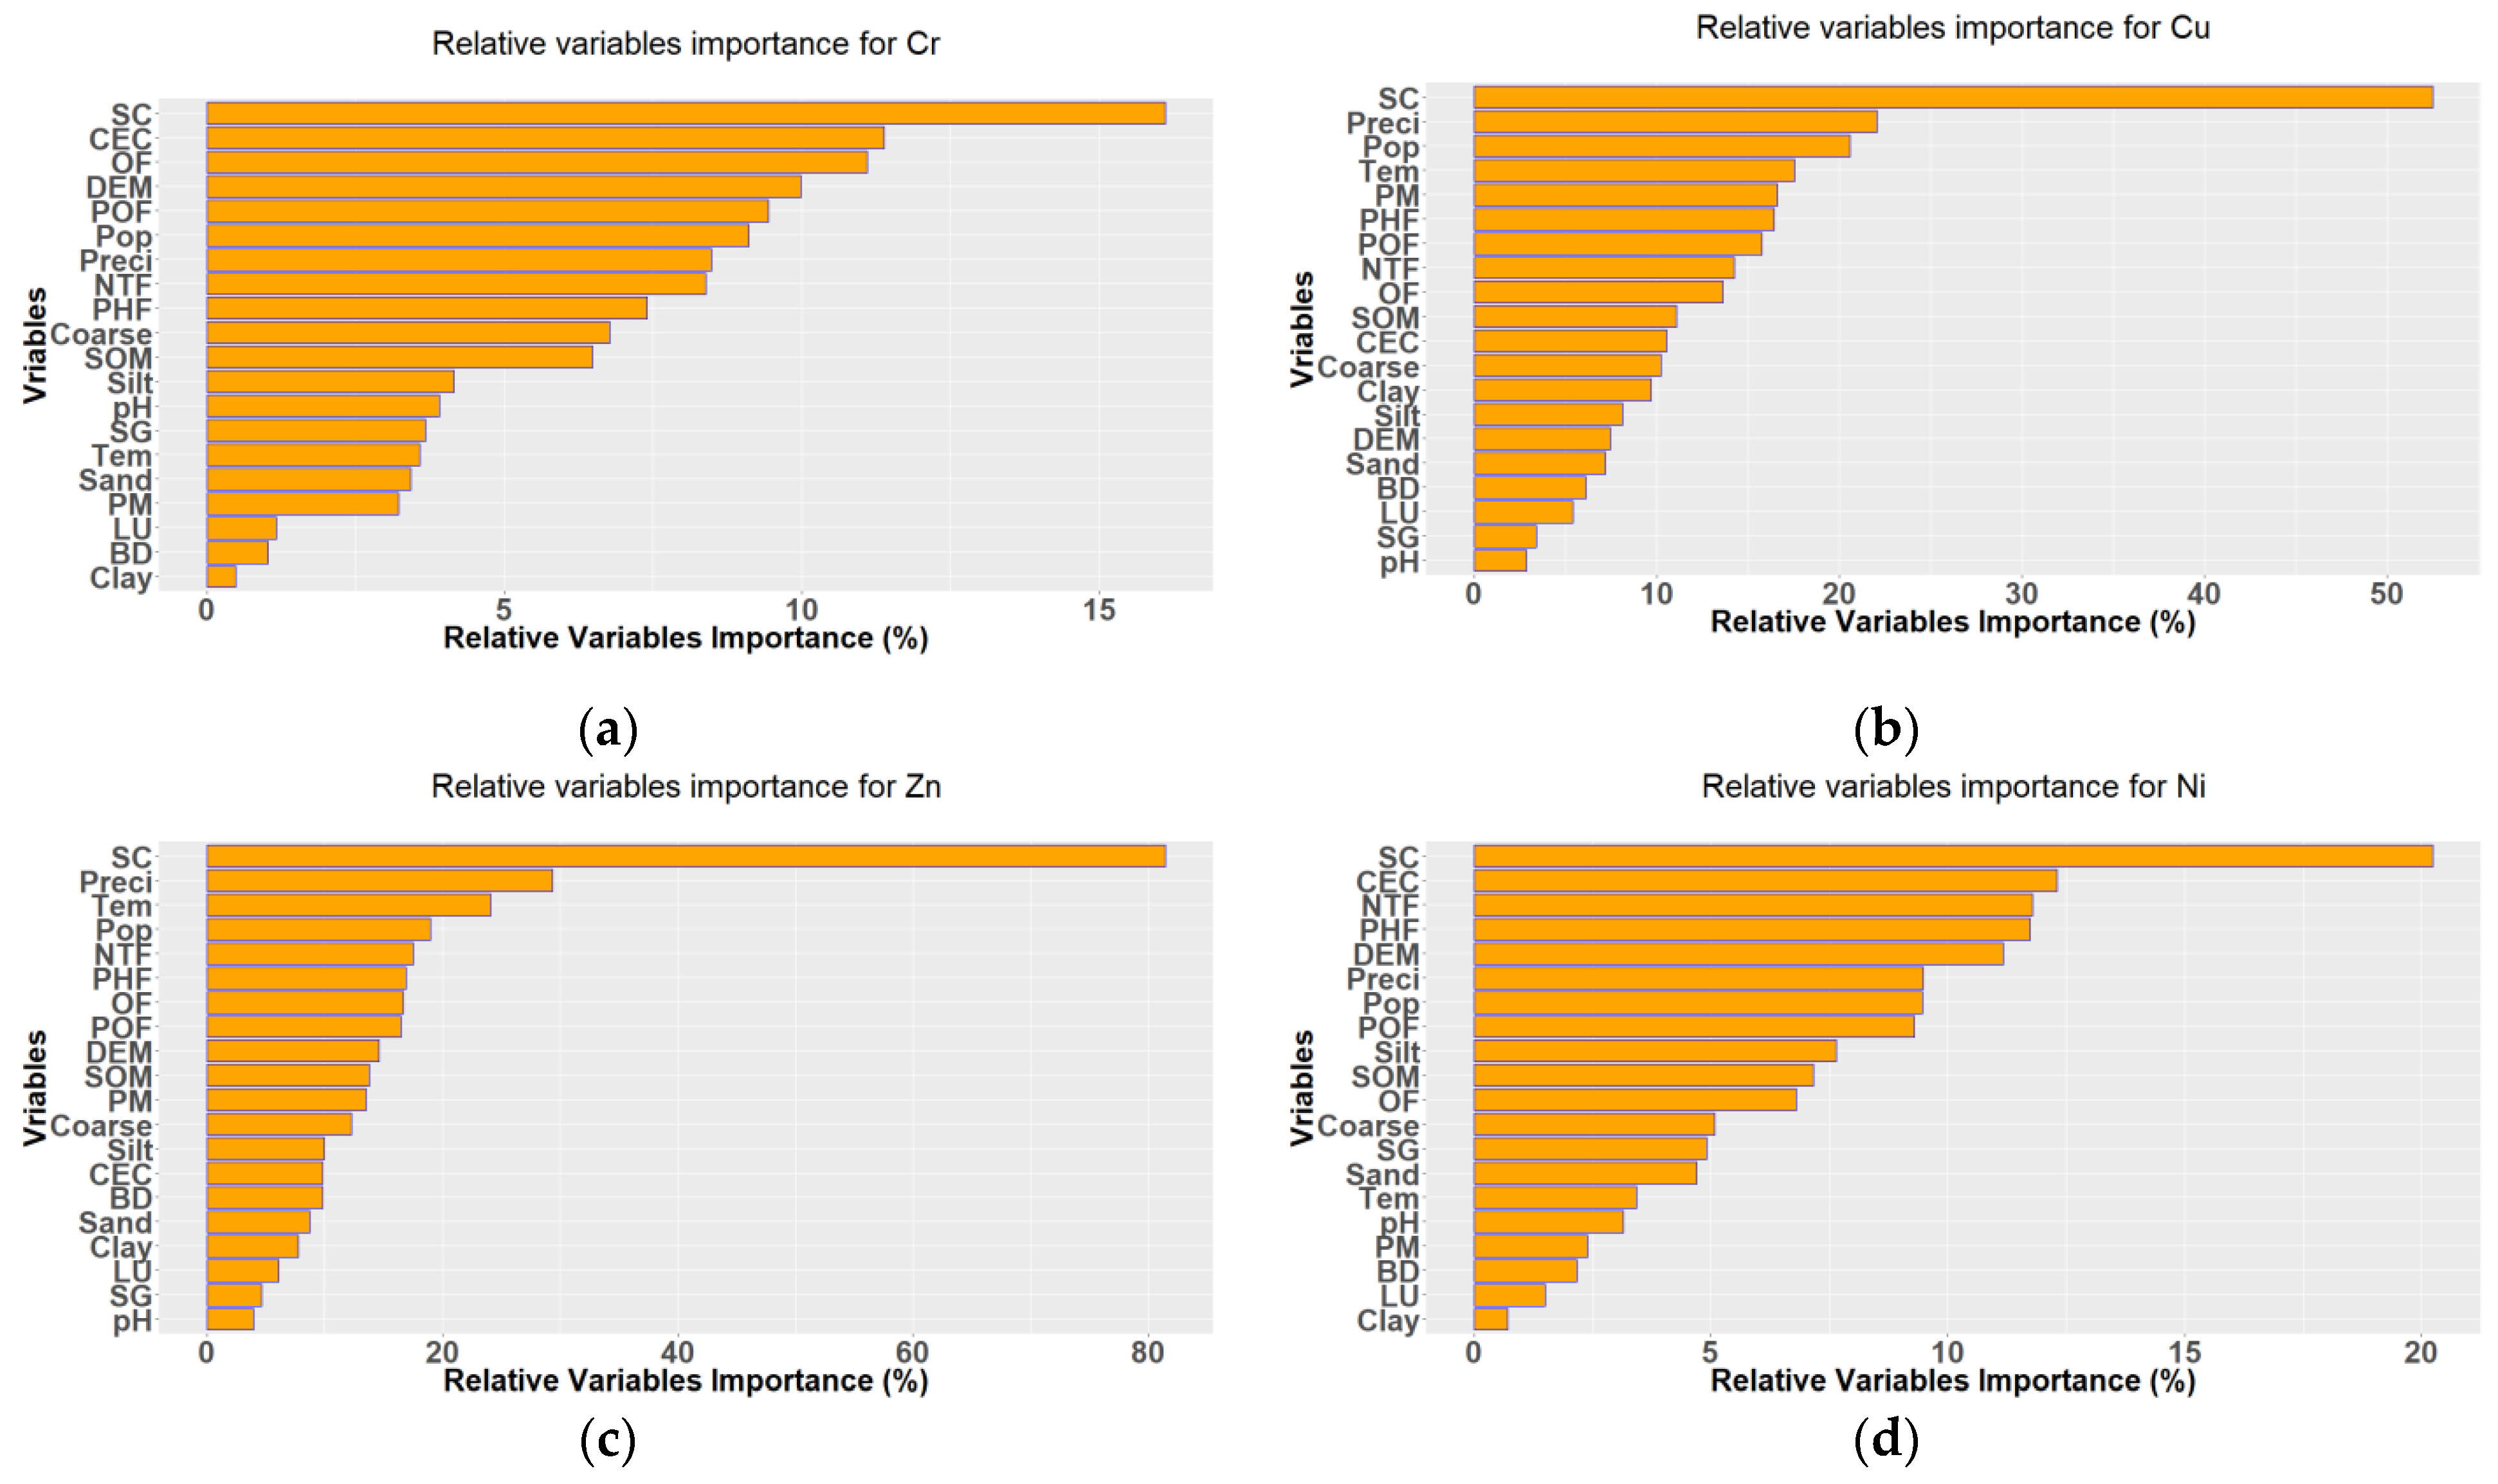
3.4. Variable Importance for Modeling PTE Bioaccumulation in Soil-Rice Systems
4. Discussion
4.1. PTE Content in Soil-Rice Systems
4.2. Model Performance Employing the Different Methods and Elements
4.3. Potential Dominators for PTE Bioaccumulation in Soil-Rice Systems
4.4. Policy Recommendations
4.5. Limitations and Perspectives
5. Conclusions
Author Contributions
Funding
Acknowledgments
Conflicts of Interest
References
- Hu, B.F.; Chen, S.C.; Hu, J.; Xia, F.; Xu, J.F.; Li, Y.; Shi, Z. Application of portable XRF and VNIR sensors for rapid assessment of soil heavy metal pollution. PLoS ONE 2017, 12, e0172438. [Google Scholar] [CrossRef] [Green Version]
- Lequy, E.; Saby, N.P.A.; Ilyin, I.; Bourin, A.; Sauvage, S.; Leblond, S. Spatial analysis of trace elements in a moss bio-monitoring data over France by accounting for source, protocol and environmental parameters. Sci. Total. Environ. 2017, 590–591, 602–610. [Google Scholar] [CrossRef]
- Marchant, B.P.; Saby, N.P.A.; Arrouays, D. A survey of topsoil arsenic and mercury concentrations across France. Chemosphere 2017, 181, 635–644. [Google Scholar] [CrossRef]
- Ono, K.; Yasutaka, T.; Hayashi, T.I.; Kamo, M.; Iwasaki, Y.; Nakamori, T.; Fujii, Y.; Kamitani, T. Model construction for estimating potential vulnerability of Japanese soils to cadmium pollution based on intact soil properties. PLoS ONE 2019, 14, e0218377. [Google Scholar] [CrossRef] [PubMed] [Green Version]
- Xia, F.; Hu, B.F.; Shao, S.; Xu, D.Y.; Zhou, Y.; Zhou, Y.; Huang, M.X.; Li, Y.; Chen, S.C.; Shi, Z. Improvement of Spatial Modeling of Cr, Pb, Cd, As and Ni in Soil Based on Portable X-ray Fluorescence (PXRF) and Geostatistics: A Case Study in East China. Int. J. Environ. Res. Public Health 2019, 16, 2694. [Google Scholar] [CrossRef] [Green Version]
- Fu, T.T.; Zhao, R.Y.; Hu, B.F.; Jia, X.L.; Wang, Z.G.; Zhou, L.Q.; Huang, M.X.; Li, Y.; Shi, Z. Novel framework for modelling the cadmium balance and accumulation in farmland soil in Zhejiang Province, East China: Sensitivity analysis, parameter optimisation, and forecast for 2050. J. Clean. Prod. 2021, 279, 123674. [Google Scholar] [CrossRef]
- Infante, E.F.; Dulfo, C.P.; Dicen, G.P.; Hseu, Z.Y.; Navarrete, I.A. Bioaccumulation and human health risk assessment of chromium and nickel in paddy rice grown in serpentine soils. Environ. Sci. Pollut. Res. 2021, 28, 17146–17157. [Google Scholar] [CrossRef] [PubMed]
- Hu, B.F.; Zhou, Y.; Jiang, Y.F.; Ji, W.J.; Fu, Z.Y.; Shao, S.; Li, S.; Huang, M.X.; Zhou, L.Q.; Shi, Z. Spatio-temporal variation and source changes of potentially toxic elements in soil on a typical plain of the Yangtze River Delta, China (2002–2012). J. Environ. Manag. 2020, 271, 110943. [Google Scholar] [CrossRef] [PubMed]
- Shao, S.; Hu, B.F.; Fu, Z.Y.; Wang, J.Y.; Lou, G.; Zhou, Y.; Jin, B.; Li, Y.; Shi, Z. Source Identification and Apportionment of Trace Elements in Soils in the Yangtze River Delta, China. Int. J. Environ. Res. Public Health 2018, 15, 1240. [Google Scholar] [CrossRef] [Green Version]
- Jia, X.L.; Hu, B.F.; Marchant, B.P.; Zhou, L.Q.; Shi, Z.; Zhu, Y.W. A methodological framework for identifying potential sources of soil heavy metal pollution based on machine learning: A case study in the Yangtze Delta, China. Environ. Pollut. 2019, 250, 601–609. [Google Scholar] [CrossRef] [PubMed]
- Xia, F.; Hu, B.F.; Zhu, Y.W.; Ji, W.J.; Chen, S.C.; Xu, D.Y.; Shi, Z. Improved Mapping of Potentially Toxic Elements in Soil via Integration of Multiple Data Sources and Various Geostatistical Methods. Remote Sens 2020, 12, 3775. [Google Scholar] [CrossRef]
- Yang, S.; Zhao, J.; Chang, S.X.; Collins, C.; Xu, J.; Liu, X. Status assessment and probabilistic health risk modeling of metals accumulation in agriculture soils across China: A synthesis. Environ. Int. 2019, 128, 165–174. [Google Scholar] [CrossRef]
- Tang, M.; Lu, G.; Fan, B.; Xiang, W.; Bao, Z. Bioaccumulation and risk assessment of heavy metals in soil-crop systems in Liujiang karst area, Southwestern China. Environ. Sci. Pollut. Res. 2021, 28, 9657–9669. [Google Scholar] [CrossRef]
- Fei, X.F.; Lou, Z.; Xiao, R.; Ren, Z.; Lv, X.N. Contamination assessment and source apportionment of heavy metals in agricultural soil through the synthesis of PMF and GeogDetector models. Sci. Total Environ. 2020, 747, 141293. [Google Scholar] [CrossRef]
- Guo, G.; Zhang, D. Source apportionment and source-specific health risk assessment of heavy metals in size-fractionated road dust from a typical mining and smelting area, Gejiu, China. Environ. Sci. Pollut. Res. 2021, 28, 9313–9326. [Google Scholar] [CrossRef]
- Liu, J.; Li, Y.; Zhang, M.; Zhang, N.M.; Han, D.J. Health risk assessment and benchmark of lead pollution in agricultural soils in East Yunnan, China. Trans. Chin. Soc. Agric. Eng. 2021, 37, 241–250, (In Chinese with English abstract). [Google Scholar]
- Hu, B.F.; Shao, S.; Ni, H.; Fu, Z.Y.; Hu, L.S.; Zhou, Y.; Min, X.X.; She, S.F.; Chen, S.C.; Huang, M.X.; et al. Current status, spatial features, health risks, and potential driving factors of soil heavy metal pollution in China at province level. Environ. Pollut. 2020, 266, 114961. [Google Scholar] [CrossRef] [PubMed]
- Jia, X.L.; Fu, T.T.; Hu, B.F.; Zhou, L.Q.; Shi, Z.; Zhu, Y.W. Identification of the potential risk areas for soil heavy metal pollution based on the source-sink theory. J. Hazard Mater. 2020, 393, 122424. [Google Scholar] [CrossRef] [PubMed]
- Yang, S.H.; Qu, Y.J.; Ma, J.; Liu, L.L.; Wu, H.W.; Liu, Q.Y.; Gong, Y.W.; Chen, Y.X.; Wu, Y.H. Comparison of the concentrations, sources, and distributions of heavy metal (loid) s in agricultural soils of two provinces in the Yangtze River Delta, China. Environ. Pollut. 2020, 264, 114688. [Google Scholar] [CrossRef]
- Zhang, J.R.; Li, H.Z.; Zhou, Y.Z.; Dou, L.; Cai, L.M.; Mo, L.P.; You, J. Bioavailability and soil-to-crop transfer of heavy metals in farmland soils: A case study in the Pearl River Delta, South China. Environ. Pollut. 2018, 235, 710–719. [Google Scholar] [CrossRef]
- Men, C.; Liu, R.; Xu, F.; Wang, Q.; Guo, L.; Shen, Z. Pollution characteristics, risk assessment, and source apportionment of heavy metals in road dust in Beijing, China. Sci. Total Environ. 2018, 612, 138–147. [Google Scholar] [CrossRef]
- Yang, L.; Yang, M.; Wang, L.; Peng, F.; Li, Y.; Bai, H. Heavy metal contamination and ecological risk of farmland soils adjoining steel plants in Tangshan, Hebei, China. Environ. Sci. Pollut. Res. 2018, 25, 1231–1242. [Google Scholar] [CrossRef]
- Lian, M.H.; Wang, J.; Sun, L.N.; Xu, Z.; Tang, J.X.; Yan, J.; Zeng, X.F. Profiles and potential health risks of heavy metals in soil and crops from the watershed of Xi River in Northeast China. Ecotoxicol. Environ. Saf. 2019, 169, 442–448. [Google Scholar] [CrossRef]
- Xiao, Q.; Zong, Y.; Malik, Z.; Lu, S. Source identification and risk assessment of heavy metals in road dust of steel industrial city (Anshan), Liaoning, Northeast China. Hum. Ecol. Risk Assess. Int. J. 2020, 26, 1359–1378. [Google Scholar] [CrossRef]
- Liu, X.M.; Song, Q.J.; Tang, Y.; Li, W.L.; Xu, J.M.; Wu, J.J.; Wang, F.; Brooks, P.C. Human health risk assessment of heavy metals in soil–vegetable system: A multi-medium analysis. Sci. Total Environ. 2013, 463–464, 530–540. [Google Scholar] [CrossRef]
- Chen, H.P.; Yang, X.; Wang, P.; Wang, Z.X.; Li, M.; Zhang, F.J. Dietary cadmium intake from rice and vegetables and potential health risk: A case study in Xiangtan, southern China. Sci. Total Environ. 2018, 639, 271–277. [Google Scholar] [CrossRef] [PubMed]
- Yu, Y.J.; Zhu, X.H.; Li, L.Z.; Lin, B.G.; Xiang, M.D.; Zhang, X.H.; Chen, X.C.; Yu, Z.L.; Wang, Z.D.; Wan, Y. Health implication of heavy metals exposure via multiple pathways for residents living near a former e-waste recycling area in China: A comparative study. Ecotoxicol. Environ. Saf. 2019, 169, 178–184. [Google Scholar] [CrossRef]
- Hu, B.F.; Shao, S.; Fu, T.T.; Fu, Z.Y.; Zhou, Y.; Li, Y.; Qi, L.; Chen, S.C.; Shi, Z. Composite assessment of human health risk from potentially toxic elements through multiple exposure routes: A case study in farmland in an important industrial city in East China. J. Geochem. Explor. 2020, 210, 106443. [Google Scholar] [CrossRef]
- Liu, X.; Yu, T.; Yang, Z.F.; Hou, Q.Y.; Yang, Q.; Li, C.; Ji, W.B.; Li, B.; Duan, Y.R.; Zhang, Q.Z.; et al. Transfer mechanism and bioaccumulation risk of potentially toxic elements in soil–rice systems comparing different soil parent materials. Ecotoxicol. Environ. Saf. 2021, 216, 112214. [Google Scholar] [CrossRef]
- Hu, B.F.; Jia, X.L.; Hu, J.; Xu, D.Y.; Xia, F.; Li, Y. Assessment of heavy metal pollution and health risks in the soil-plant-human system in the Yangtze river delta, China. Int. J. Environ. Res. Public Health 2017, 14, 1042. [Google Scholar] [CrossRef] [PubMed] [Green Version]
- Lu, A.; Li, B.; Li, J.; Chen, W. Heavy metals in paddy soil-rice systems of industrial and township areas from subtropical China: Levels, transfer and health risks. J. Geochem. Explor. 2018, 194, 210–217. [Google Scholar] [CrossRef]
- Aslam, M.W.; Ali, W.; Meng, B.; Abrar, M.M.; Lu, B.; Qin, C.Y.; Zhao, L.; Feng, X.B. Mercury contamination status of rice cropping system in Pakistan and associated health risks. Environ. Pollut. 2020, 263, 114625. [Google Scholar] [CrossRef]
- Bocardi, J.M.B.; Pletsch, A.L.; Quinaia, S.P. Quality reference values for heavy metals in soils developed from basic rocks under tropical conditions. J. Geochem. Explor. 2020, 217, 106591. [Google Scholar] [CrossRef]
- Zhao, L.; Meng, B.; Feng, X.B. Mercury methylation in rice paddy and accumulation in rice plant: A review. Ecotoxicol. Environ. Saf. 2020, 195, 110462. [Google Scholar] [CrossRef] [PubMed]
- Shao, S.; Hu, B.F.; Tao, Y.; You, Q.H.; Huang, M.X.; Zhou, L.Q.; Chen, Q.X.; Shi, Z. Comprehensive source identification and apportionment analysis of five heavy metals in soils in Wenzhou City, China. Environ. Geochem. Health 2021, 1–24. [Google Scholar] [CrossRef]
- Chen, H.Y.; Yuan, X.Y.; Li, T.Y.; Sun, H.; Ji, J.F.; Wang, C. Characteristics of heavy metal transfer and their influencing factors in different soil–crop systems of the industrialization region, China. Ecotoxicol. Environ. Saf. 2016, 126, 193–201. [Google Scholar] [CrossRef] [PubMed]
- Hu, B.F.; Xue, J.; Zhou, Y.; Shao, S.; Fu, Z.Y.; Li, Y.; Chen, S.C.; Qi, L.; Shi, Z. Modelling bioaccumulation of heavy metals in soil-crop ecosystems and identifying its controlling factors using machine learning. Environ. Pollut. 2020, 262, 114308. [Google Scholar] [CrossRef] [PubMed]
- Römkens, P.F.A.M.; Guo, H.Y.; Chu, C.L.; Liu, T.S.; Chiang, C.F.; Koopmans, G.F. Prediction of cadmium uptake by brown rice and derivation of soil–plant transfer models to improve soil protection guidelines. Environ. Pollut. 2009, 157, 2435–2444. [Google Scholar] [CrossRef] [PubMed]
- Hu, B.F.; Shao, S.; Fu, Z.Y.; Li, Y.; Ni, H.; Chen, S.C.; Zhou, Y.; Jin, B.; Shi, Z. Identifying heavy metal pollution hot spots in soil-rice systems: A case study in South of Yangtze River Delta, China. Sci. Total Environ. 2019, 658, 614–625. [Google Scholar] [CrossRef] [PubMed]
- Deng, M.H.; Zhu, Y.; Shao, K.; Zhang, Q.; Ye, G.H.; Shen, J. Metals source apportionment in farmland soil and the prediction of metal transfer in the soil-rice-human chain. J. Environ. Manag. 2020, 260, 110092. [Google Scholar] [CrossRef]
- Deng, S.; Yu, J.; Wang, Y.T.; Xie, S.Q.; Ran, Z.X.; Wei, W. Distribution, transfer, and time-dependent variation of Cd in soil-rice system: A case study in the Chengdu plain, Southwest China. Soil Till. Res. 2019, 195, 104367. [Google Scholar] [CrossRef]
- Du, F.; Yang, Z.G.; Liu, P.; Lin, W. Accumulation, translocation, and assessment of heavy metals in the soil-rice systems near a mine-impacted region. Environ. Sci. Pollut. Res. 2018, 25, 32221–32230. [Google Scholar] [CrossRef] [PubMed]
- Wan, Y.; Huang, Q.; Wang, Q.; Ma, Y.; Su, D.; Qiao, Y.; Li, H. Ecological risk of copper and zinc and their different bioavailability change in soil-rice system as affected by biowaste application. Ecotoxicol. Environ. Saf. 2020, 192, 110301. [Google Scholar] [CrossRef] [PubMed]
- Zhang, X.F.; Liu, T.X.; Li, F.B.; Li, X.M.; Du, Y.H.; Yu, H.Y.; Wang, X.Q.; Liu, C.P.; Feng, M.; Liao, B. Multiple effects of nitrate amendment on the transport, transformation and bioavailability of antimony in a paddy soil-rice plant system. J. Environ. Sci. 2021, 100, 90–98. [Google Scholar] [CrossRef]
- Brus, D.J.; Li, Z.B.; Song, J.; Koopmans, G.F.; Temminghoff, E.J.M.; Yin, X.B.; Yao, C.X.; Zhang, H.B.; Luo, Y.M.; Japenga, J. Predictions of spatially averaged cadmium contents in rice grains in the Fuyang Valley, PR China. J. Environ. Qual. 2009, 38, 1126–1136. [Google Scholar] [CrossRef]
- Zhao, K.L.; Zhang, W.W.; Zhou, L.; Liu, X.M.; Xu, J.M.; Huang, P.M. Modeling transfer of heavy metals in soil–rice system and their risk assessment in paddy fields. Environ. Earth Sci. 2009, 59, 519–527. [Google Scholar] [CrossRef]
- Mu, T.; Wu, T.; Zhou, T.; Li, Z.; Ouyang, Y.; Jiang, J.; Zhou, D.; Hou, J.Y.; Wang, Z.Y.; Luo, Y.M.; et al. Geographical variation in arsenic, cadmium, and lead of soils and rice in the major rice producing regions of China. Sci. Total Environ. 2020, 677, 373–381. [Google Scholar] [CrossRef]
- Liu, X.; Gu, S.; Yang, S.; Deng, J.; Xu, J. Heavy metals in soil-vegetable system around E-waste site and the health risk assessment. Sci. Total Environ. 2021, 779, 146438. [Google Scholar] [CrossRef] [PubMed]
- Ma, H.H.; Peng, M.; Guo, F.F.; Liu, F.; Tang, S.Q.; Yang, Z.; Zhang, F.G.; Zhou, Y.L.; Yang, K.; Li, K.; et al. Factors Affecting the Translocation and Accumulation of Cadmium in a Soil-Crop System in a Typical Karst Area of Guangxi Province, China. Environ. Sci. 2021, 42, 1514–1522, (In Chinese with English abstract). [Google Scholar]
- Myers, R.H. Classical and Modern Regression with Applications; Duxbury Press: Belmont, CA, USA, 1990. [Google Scholar]
- Cortes, C.; Vapnik, V. Support-vector networks. Mach. Learn. 1995, 20, 273–297. [Google Scholar] [CrossRef]
- Cristianini, N.; Shaw-Taylor, J. An Introduction to Support Vector Machines and Other Kernel Based Learning Methods; Cambridge University Press: Cambridge, UK, 2000. [Google Scholar]
- Bordoni, M.; Bittelli, M.; Valentino, R.; Chersich, S.; Persichilloet, M.G.; Meisina, C. Soil water content estimated by support vector machine for the assessment of shallow landslides triggering: The role of antecedent meteorological conditions. Environ. Model. Assess. 2018, 23, 333–352. [Google Scholar] [CrossRef]
- Breiman, L. Random forests. Mach. Learn. 2001, 45, 5–32. [Google Scholar] [CrossRef] [Green Version]
- Pouladi, N.; Møller, A.B.; Tabatabai, S.; Greve, M.H. Mapping soil organic matter contents at field level with Cubist, Random Forest and kriging. Geoderma 2019, 342, 85–92. [Google Scholar] [CrossRef]
- Quinlan, J.R. C4.5: Programs for Machine Learning; Morgan Kaufmann Publishers Inc.: San Francisco, CA, USA, 1993. [Google Scholar]
- Peng, J.; Biswas, A.; Jiang, Q.S.; Zhao, R.Y.; Hu, B.F.; Shi, Z. Estimating soil salinity from remote sensing and terrain data in southern Xinjiang Province, China. Geoderma 2019, 337, 1309–1319. [Google Scholar] [CrossRef]
- Kuhn, M.; Wing, J.; Weston, S.; Williams, A.; Keefer, C.; Engelhardt, A.; Cooper, T.; Mayer, Z.; Kenkel, B.; R Core Team; et al. Package ‘caret’. R J. 2020, 223. [Google Scholar]
- National Soil Survey Office. Chinese Soil Genus Records; China Agriculture Press: Beijing, China, 1995. (In Chinese)
- Hengl, T.; de Jesus, J.M.; Heuvelink, G.B.; Gonzalez, M.R.; Kilibarda, M.; Blagotić, A.; Shangguan, W.; Wright, M.N.; Geng, X.Y.; Bauer-Marschallinger, B.; et al. SoilGrids250m: Global gridded soil information based on machine learning. PLoS ONE 2017, 12, e0169748. [Google Scholar] [CrossRef] [Green Version]
- National Soil Survey Office. Chinese Soils; China Agriculture Press: Beijing, China, 1998; p. 1e1252. (In Chinese)
- Kuhn, M. Caret: Classification and Regression Training. In Astrophysics Source Code Library; 2015; Available online: https://ascl.net/1505.003 (accessed on 20 April 2021).
- Ministry of Health of the People’s Republic of China (MHPRC). National Hygienic Standard for Food in China GB2762-2017; China Standard Press: Beijing, China, 2017. Available online: http://www.jlfsstd.net/db/files/Std1_6735986214439267.pdf (accessed on 14 April 2021).
- Ministry of Health of the People’s Republic of China (MHPRC). Maximum Levels of Contaminants in Foods GB15199-1994; China Standard Press: Beijing, China, 1994. Available online: http://www.bzxzk.net/gjbz/24122011/88880.html (accessed on 14 April 2021).
- Ministry of Health of the People’s Republic of China (MHPRC). Maximum Levels of Contaminants in Foods GB13106-1991; China Standard Press: Beijing, China, 1991. Available online: http://www.bzxzk.net/gjbz/24122011/88784.html (accessed on 14 April 2021).
- Zhu, Z.Q.; Zhu, Y.W.; Shi, Z. Research of Agricultural Soil Environment and Agricultural Product Safety; China Agriculture Press: Beijing, China, 2009. [Google Scholar]
- Wang, X.; Zeng, X.; Chuanping, L.; Li, F.; Xu, X.; Lv, Y. Heavy metal contaminations in soil-rice system: Source identification in relation to a sulfur-rich coal burning power plant in Northern Guangdong Province, China. Environ. Monit. Assess. 2016, 188, 460. [Google Scholar] [CrossRef]
- Yin, Y.M.; Zhao, W.T.; Huang, T.; Cheng, S.G.; Zhao, Z.L.; Yu, C.C. Distribution characteristics and health risk assessment of heavy metals in a soil-rice system in an e-waste dismantling area. Huan Jing Ke Xue 2018, 39, 916–926. (In Chinese) [Google Scholar]
- Mao, C.; Song, Y.; Chen, L.; Ji, J.; Li, J.; Yuan, X.; Yang, Z.F.; Ayoko, A.G.; Frost, R.L.; Theiss, F. Human health risks of heavy metals in paddy rice based on transfer characteristics of heavy metals from soil to rice. Catena 2019, 175, 339–348. [Google Scholar] [CrossRef]
- Hu, B.F.; Shao, S.; Ni, H.; Fu, Z.Y.; Huang, M.X.; Chen, Q.X.; Shi, Z. Assessment of potentially toxic element pollution in soils and related health risks in 271 cities across China. Environ. Pollut. 2021, 270, 116196. [Google Scholar] [CrossRef]
- Liu, S.; Zhao, H.F.; Wu, K.N.; Zhang, Z.; Hou, Y.X.; Chen, T.Y.; Jin, Q. Evaluation of heavy metal distribution characteristics of agricultural soil–rice system in a high geological background area according to the influence index of comprehensive quality (IICQ). Environ. Sci. Pollut. Res. 2020, 27, 20920–20933. [Google Scholar] [CrossRef]
- Yu, Z.Y.; Dong, J.Q.; Fu, W.J.; Ye, Z.Q.; Li, W.Y.; Zhao, K.L. The transfer characteristics of potentially toxic trace elements in different soil-rice systems and their quantitative models in southeastern China. Int. J. Environ. Res. Public Health 2009, 16, 2503. [Google Scholar] [CrossRef] [Green Version]
- He, M.J.; Shen, H.R.; Li, Z.T.; Wang, L.; Wang, F.; Zhao, K.L.; Liu, X.M.; Wendroth, O.; Xu, J.M. Ten-year regional monitoring of soil-rice grain contamination by heavy metals with implications for target remediation and food safety. Environ. Pollut. 2019, 244, 431–439. [Google Scholar] [CrossRef]
- Xiao, R.; Guo, D.; Ali, A.; Mi, S.S.; Liu, T.; Ren, C.Y.; Li, R.H.; Zhang, Z.Q. Accumulation, ecological-health risks assessment, and source apportionment of heavy metals in paddy soils: A case study in Hanzhong, Shaanxi, China. Environ. Pollut. 2019, 248, 349–357. [Google Scholar] [CrossRef] [PubMed]
- Kong, X.Y.; Liu, T.; Yu, Z.H.; Chen, Z.; Lei, D.; Wang, Z.W.; Zhang, H.; Li, Q.H.; Zhang, S.S. Heavy metal bioaccumulation in rice from a high geological background area in Guizhou Province, China. Int. J. Environ. Res. Public Health 2018, 15, 2281. [Google Scholar] [CrossRef] [Green Version]
- CNEMC (China National Environmental Monitoring Center). The Background Concentrations of Soil Elements of China; China Environmental Science Press: Beijing, China, 1990. (In Chinese)
- Cakmak, I. Enrichment of cereal grains with Zinc: Agronomic or generic biofortification. Plant Soil 2008, 302, 1–17. [Google Scholar] [CrossRef]
- Nan, Z.; Li, J.; Zhang, J.; Cheng, G. Cadmium and zinc interactions and their transfer in soil-crop system under actual field conditions. Sci. Total Environ. 2002, 285, 187–195. [Google Scholar] [CrossRef]
- Mohammad, A.; Moheman, A. The effects of cadmium and zinc interactions on the accumulation and tissue distribution of cadmium and zinc in tomato (Lycopersicon esculentum Mill.). Arch. Agron. Soil Sci. 2010, 56, 551–561. [Google Scholar] [CrossRef]
- Bonfatti, B.R.; Hartemink, A.E.; Giasson, E.; Tornquist, C.G.; Adhikari, K. Digital mapping of soil carbon in a viticultural region of Southern Brazil. Geoderma 2016, 261, 204–221. [Google Scholar] [CrossRef]
- Mosleh, Z.; Salehi, M.H.; Jafari, A.; Borujeni, I.E.; Mehnatkesh, A. The effectiveness of digital soil mapping to predict soil properties over low-relief areas. Environ. Monit. Assess. 2016, 188, 195. [Google Scholar] [CrossRef] [PubMed]
- Mahmoudabadi, E.; Karimi, A.; Haghnia, G.H.; Sepehr, A. Digital soil mapping using remote sensing indices, terrain attributes, and vegetation features in the rangelands of northeastern Iran. Environ. Monit. Assess. 2017, 189, 500. [Google Scholar] [CrossRef]
- da Silva Chagas, C.; de Carvalho Junior, W.; Bhering, S.B.; Calderano Filho, B. Spatial prediction of soil surface texture in a semiarid region using random forest and multiple linear regressions. Catena 2016, 139, 232–240. [Google Scholar] [CrossRef]
- Ottoy, S.; De Vos, B.; Sindayihebura, A.; Hermy, M.; Van Orshoven, J. Assessing soil organic carbon stocks under current and potential forest cover using digital soil mapping and spatial generalization. Ecol. Indic. 2017, 77, 139–150. [Google Scholar] [CrossRef]
- Campbell, P.M.D.M.; Fernandes Filho, E.I.; Francelino, M.R.; Demattê, J.A.M.; Pereira, M.G.; Guimarães, C.C.B.; Pinto, L.A.D.S.R. Digital Soil Mapping of Soil Properties in the “Mar de Morros” Environment Using Spectral Data. Rev. Bras. Ciência Solo 2018, 42, 42. [Google Scholar] [CrossRef] [Green Version]
- Barman, U.; Choudhury, R.D. Soil texture classification using multi class support vector machine. Information Inf. Process. Agric. 2020, 7, 318–332. [Google Scholar] [CrossRef]
- Peng, Y.; Xiong, X.; Adhikari, K.; Knadel, M.; Grunwald, S.; Greve, M.H. Modeling soil organic carbon at regional scale by combining multi-spectral images with laboratory spectra. PLoS ONE 2015, 10, e0142295. [Google Scholar] [CrossRef] [PubMed] [Green Version]
- Peng, H.; Chen, Y.L.; Weng, L.P.; Ma, J.; Ma, Y.L.; Li, Y.T.; Islam, M.S. Comparisons of heavy metal input inventory in agricultural soils in North and South China: A review. Sci. Total Environ. 2019, 660, 776–786. [Google Scholar] [CrossRef]
- Rossel, R.V.; Chen, C.; Grundy, M.J.; Searle, R.; Clifford, D.; Campbell, P.H. The Australian three-dimensional soil grid: Australia’s contribution to the GlobalSoilMap project. Soil Res. 2015, 53, 845–864. [Google Scholar] [CrossRef] [Green Version]
- Peng, Y.; Kheir, R.B.; Adhikari, K.; Malinowski, R.; Greve, M.B.; Knadel, M.; Greve, M.H. Digital mapping of toxic metals in Qatari soils using remote sensing and ancillary data. Remote Sens. 2016, 8, 1003. [Google Scholar] [CrossRef] [Green Version]
- Khaledian, Y.; Miller, B.A. Selecting appropriate machine learning methods for digital soil mapping. Appl. Math. Model. 2020, 81, 401–418. [Google Scholar] [CrossRef]
- Zeng, F.; Ali, S.; Zhang, H.; Ouyang, Y.; Qiu, B.; Wu, F.; Zhang, G. The influence of pH and organic matter content in paddy soil on heavy metal availability and their uptake by rice plants. Environ. Pollut. 2011, 159, 84–91. [Google Scholar] [CrossRef]
- Osman, H.E.M.; Abdel-Hamed, E.M.W.; Al-Juhani, W.S.M.; AI-Maroai, Y.A.O.; EI-Morsy, M.H.E.M. Bioaccumulation and human health risk assessment of heavy metals in food crops irrigated with freshwater and treated wastewater: A case study in Southern Cairo, Egypt. Environ. Sci. Pollut. R 2021, 1–13, Online ahead of print. [Google Scholar] [CrossRef]
- Wang, Y.; Xu, W.; Li, J.; Song, Y.; Hua, M.; Li, W.; He, X. Assessing the fractionation and bioavailability of heavy metals in soil–rice system and the associated health risk. Environ. Geochem. Health 2021, 1–18, Online ahead of print. [Google Scholar] [CrossRef]
- Cao, X.R.; Wang, X.Z.; Tong, W.B.; Gurajala, H.K.; Liu, M.; Hamid, Y.; Feng, Y.; He, Z.L.; Yang, X.E. Distribution, availability and translocation of heavy metals in soil-oilseed rape (Brassica napus L.) system related to soil properties. Environ. Pollut. 2019, 252, 733–741. [Google Scholar] [CrossRef] [PubMed]
- Zhou, Y.J.; Jia, Z.Y.; Wang, J.X.; Chen, L.; Zou, M.M.; Li, Y.; Zhou, S.L. Heavy metal distribution, relationship and prediction in a wheat-rice rotation system. Geoderma 2019, 354, 113886. [Google Scholar] [CrossRef]
- Ata-Ul-Karim, S.T.; Cang, L.; Wang, Y.; Wang, Y.; Zhou, D. Interactions between nitrogen application and soil properties and their impacts on the transfer of cadmium from soil to wheat (Triticum aestivum L.) grain. Geoderma 2020, 357, 113923. [Google Scholar] [CrossRef]
- Vega, F.A.; Andrade, M.L.; Covelo, E.F. Influence of soil properties on the sorption and retention of cadmium, copper and lead, separately and together, by 20 soil horizons: Comparison of linear regression and tree regression analyses. J. Hazard Mater. 2010, 174, 522–533. [Google Scholar] [CrossRef]
- Gupta, S.; Nayek, S.; Saha, R.N.; Satpati, S. Assessment of heavy metal accumulation in macrophyte, agricultural soil, and crop plants adjacent to discharge zone of sponge iron factory. Environ. Earth Sci. 2008, 55, 731–739. [Google Scholar] [CrossRef]
- Shen, X.Y.; Chen, S.G.; Wang, Y.; Wang, Y.M.; Cai, W.X. Study on different clays as adsorbents in heavy metals-containing waste water treatment. Environ. Pollut. Control 1998, 20, 15–18. [Google Scholar]
- Gu, H.H.; Qiu, H.; Tian, T.; Zhan, S.S.; Deng, T.H.B.; Chaney, R.L.; Wang, S.Z.; Tang, Y.T.; Morel, J.L.; Qiu, R.L. Mitigation effects of silicon rich amendments on heavy metal accumulation in rice (Oryza sativa L.) planted on multi-metal contaminated acid soil. Chemosphere 2011, 83, 1234–1240. [Google Scholar] [CrossRef]
- Zhao, F.J.; Ma, Y.; Zhu, Y.G.; Tang, Z.; McGrath, S.P. Soil contamination in China: Current status and mitigation strategies. Environ. Sci. Technol. 2015, 49, 750–759. [Google Scholar] [CrossRef]
- Zhou, H.; Zeng, M.; Zhou, X.; Liao, B.H.; Peng, P.Q.; Hu, M.; Zhu, W.; Wu, Y.J.; Zou, Z.J. Heavy metal translocation and accumulation in iron plaques and plant tissues for 32 hybrid rice (Oryza sativa L.) cultivars. Plant Soil 2015, 386, 317–329. [Google Scholar] [CrossRef]
- Zhang, M.; Shan, S.D.; Chen, Y.G.; Wang, F.; Yang, D.Y.; Ren, J.K.; Lu, H.Y.; Ping, L.F.; Chai, Y.J. Biochar reduces cadmium accumulation in rice grains in a tungsten mining area-field experiment: Effects of biochar type and dosage, rice variety, and pollution level. Environ. Geochem. Health 2019, 41, 43–52. [Google Scholar] [CrossRef]
- Guo, F.Y.; Ding, C.F.; Zhou, Z.G.; Huang, G.X.; Wang, X.X. Effects of combined amendments on crop yield and cadmium uptake in two cadmium contaminated soils under rice-wheat rotation. Ecotoxicol. Environ. Saf. 2018, 148, 303–310. [Google Scholar] [CrossRef]
- Huang, Y.; Sheng, H.; Zhou, P.; Zhang, Y.Z. Remediation of Cd-contaminated acidic paddy fields with four-year consecutive liming. Ecotoxicol. Environ. Saf. 2020, 188, 109903. [Google Scholar] [CrossRef]
- Wuana, R.A.; Okieimen, F.E. Heavy metals in contaminated soils: A review of sources, chemistry, risks and best available strategies for remediation. ISRN Ecol. 2011, 2011, 1–20. [Google Scholar] [CrossRef] [Green Version]
- Liu, P.; Liu, Z.H.; Hu, Y.M.; Shi, Z.; Pan, Y.C.; Wang, L. A hybrid back propagation neural network and particle swarm optimization for estimating soil heavy metal contents using hyper-spectral data. Sustainability 2019, 11, 419. [Google Scholar] [CrossRef] [Green Version]
- Wen, Y.B.; Li, W.; Yang, Z.F.; Zhuo, X.X.; Guan, D.X.; Song, Y.Y.; Guo, C.; Ji, J.F. Evaluation of various approaches to predict cadmium bioavailability to rice grown in soils with high geochemical background in the karst region, Southwestern China. Environ. Pollut. 2020, 258, 113645. [Google Scholar] [CrossRef] [PubMed]
- Liu, B.; Mo, C.H.; Zhang, Y. Using cadmium bioavailability to simultaneously predict its accumulation in crop grains and the bioaccessibility in soils. Sci. Total Environ. 2019, 665, 246–252. [Google Scholar] [CrossRef]


| Auxiliary Variable | Abbreviation | Resolution | Type a | Source |
|---|---|---|---|---|
| Content of PTE in soil b | SC | -- | Q | This study |
| Soil organic matter | SOM | -- | C | This study |
| pH | pH | -- | Q | This study |
| Soil group | SG | -- | C | National Soil Survey Office c |
| Population density | PD | 1 km | Q | REDC d |
| Land use types | LU | 1 km | C | REDC d |
| Annual temperature | Tem | 1 km | Q | REDC d |
| Annual precipitation | Preci | 1 km | Q | REDC d |
| Elevation | DEM | -- | Q | This study |
| Amount of phosphate fertiliser applied annually | PHF | -- | Q | This study |
| Amount of organic fertiliser applied annually | OF | -- | Q | This study |
| Amount of nitrogen fertiliser applied annually | NTF | -- | Q | This study |
| Amount of potash fertiliser applied annually | POF | -- | Q | This study |
| Soil bulk density | BD | 250 m | Q | ISRIC SoilGrids e |
| Parent material | PM | -- | C | National Soil Survey Office f |
| Cation exchange capacity | CEC | 250 m | Q | ISRIC SoilGrids e |
| Soil sand content | Sand | 250 m | Q | ISRIC SoilGrids e |
| Soil clay content | Clay | 250 m | Q | ISRIC SoilGrids e |
| Soil silt content | Silt | 250 m | Q | ISRIC SoilGrids e |
| Soil coarse fraction | Coarse | 250 m | Q | ISRIC SoilGrids e |
| Element | Min (mg/kg) | Median (mg/kg) | Mean (mg/kg) | Max (mg/kg) | SD a | CV (%) b | Percentage above the National Standard | |
|---|---|---|---|---|---|---|---|---|
| Cr | Soil | 9.16 | 74.20 | 71.87 | 246.00 | 26.46 | 36.81 | 0 |
| Rice grain | 0.01 | 0.52 | 0.79 | 13.00 | 0.92 | 117.08 | 20.75% | |
| Cu | Soil | 8.92 | 34.10 | 35.76 | 116.00 | 13.19 | 36.89 | 0 |
| Rice grain | 0.15 | 3.00 | 2.98 | 6.90 | 0.80 | 26.92 | 0 | |
| Zn | Soil | 34.30 | 110.00 | 115.50 | 714.00 | 34.39 | 29.76 | 1.32% |
| Rice grain | 1.30 | 24.00 | 23.89 | 52.00 | 4.31 | 18.04 | 0.11% | |
| Ni | Soil | 3.81 | 30.40 | 29.94 | 293.00 | 50.17 | 50.17 | 0.88% |
| Rice grain | 0.01 | 0.50 | 0.64 | 5.40 | 0.49 | 75.79 | 65.75% |
| Model | Index | Cr | Cu | Zn | Ni |
|---|---|---|---|---|---|
| Cubist | R2 | 0.72 | 0.05 | 0.09 | 0.20 |
| CCC a | 0.83 | 0.21 | 0.29 | 0.35 | |
| RMSE (mg kg−1) b | 0.04 | 0.69 | 3.22 | 0.36 | |
| Bias (mg kg−1) | −5.31E−03 | 6.33E−02 | −2.23E−02 | −7.07E−02 | |
| RF | R2 | 0.79 | 0.58 | 0.66 | 0.74 |
| CCC a | 0.86 | 0.69 | 0.77 | 0.85 | |
| RMSE (mg kg−1) b | 0.03 | 0.04 | 0.04 | 0.04 | |
| Bias (mg kg−1) | −4.41E−03 | 1.91E−03 | −3.58E−03 | 7.93E−07 | |
| SVM | R2 | 0.69 | 0.05 | 0.13 | 0.21 |
| CCC a | 0.62 | 0.15 | 0.24 | 0.35 | |
| RMSE (mg kg−1) b | 0.05 | 0.66 | 2.95 | 0.36 | |
| Bias (mg kg−1) | −1.10E−02 | 5.45E−02 | −1.81E−01 | −8.26E−02 | |
| MLR | R2 | 0.67 | 0.49 | 0.51 | 0.46 |
| CCC a | 0.72 | 0.66 | 0.67 | 0.63 | |
| RMSE (mg kg−1) b | 0.04 | 0.05 | 0.06 | 0.06 | |
| Bias (mg kg−1) | −5.67E−03 | −1.11E−15 | −3.11E−15 | −3.55E−15 |
| Location | Cr (mg kg−1) Soil/Rice/BAC | Cu (mg kg−1) Soil/Rice/BAC | Zn (mg kg−1) Soil/Rice/BAC | Ni (mg kg−1) Soil/Rice/BAC | Source |
|---|---|---|---|---|---|
| Zhejiang | 71.37/0.79/0.018 | 35.76/2.98/0.093 | 115.50/23.89/0.219 | 29.94/0.64/0.032 | This study |
| Zhuhai, Guangdong | -- | 49.34/3.98/0.081 | 120.2/21.51/0.179 | -- | [71] |
| Qingyuan, Guangdong | -- | 96.9/5.23/0.054 | 104/25.1/0.241 | 8.07/0.83/0.103 | [72] |
| Shengyang, Liaoning | -- | -- | 109.5/18.4/0.168 | -- | [23] |
| Wenzhou, Zhejiang | 74.8/0.61/0.008 | 52.6/3.51/0.067 | 144.0/26.8/0.186 | 35.0/0.41/0.012 | [73] |
| Hanzhong, Hubei | -- | 32.9/0.40/0.012 | 217/22.5/0.104 | -- | [74] |
| Jiangsu, Zhejiang, Shanghai | 64.3/0.19/0.003 | 30.47/11.77/0.386 | 102.21/22.79/0.223 | -- | [69] |
| Huzhou, Zhejiang | -- | 31.06/2.49/0.080 | 106.82/14.28/0.134 | 32.14/0.12/0.004 | [72] |
| Shaoxing, Zhejiang | -- | 28.64/2.98/0.104 | 98.74/22.41/0.227 | 27.03/0.35/0.013 | [72] |
| Wenzhou, Zhejiang | -- | 41.13/3.09/0.075 | 98.74/20.69/0.210 | 27.03/0.22/0.008 | [72] |
| Guizhou | -- | -- | 135/11.56/0.086 | 40.5/1.57/0.039 | [75] |
| Shantou, Guangdong | 60.2/0.21/0.003 | 78.4/3.01/0.038 | 111.9/17.32/0.155 | 37.8/1.37/0.036 | [68] |
| Changsha, Hunan | 53.6/0.44/0.008 | 23.9/3.69/0.154 | 82.7/17.7/0.214 | 23.3/0.34/0.015 | [43] |
| Jiangsu, Zhejiang, Shanghai | -- | 38.7/5.02/0.130 | 105/22.09/0.210 | -- | [36] |
| Shaoguan, Guangdong | 29.1/0.34/0.012 | 67.2/3.63/0.054 | 129/29.1/0.226 | 15.1/0.83/0.055 | [67] |
| China | 54.6 a/1.0 b | 23.5 c/10 d | 82.1 e/50 f | 28 g/0.4 h | [63,64,65,66,76] |
| Element | Method | R2 | Study Area | Covariates | Source |
|---|---|---|---|---|---|
| Cr | LR | 0.456 | Shaoxing, China | pH, SC | [46] |
| Cu, Zn, Ni | LR | 0.52, 0.52, 0.55 | Zhejiang China | pH, SOM, EC, sand, silt, clay | [27] |
| Cu, Zn | MLR | 0.24, 0.63 | YRD, China | SC, pH, SOM | [36] |
| Cr, Cu, Zn, Ni | MLR | 0.13, 0.15, 0.37, 0.20 | Zhejiang China | SC, pH | [46] |
| Cr, Cu, Zn | SR | 0.22, 0.06, 0.37 | Zhejiang China | SC, pH | [92] |
| Cr, Cu, Zn, Ni | RF | 0.79, 0.58, 0.66, 0.74 | -- | Table 1 | This study |
Publisher’s Note: MDPI stays neutral with regard to jurisdictional claims in published maps and institutional affiliations. |
© 2021 by the authors. Licensee MDPI, Basel, Switzerland. This article is an open access article distributed under the terms and conditions of the Creative Commons Attribution (CC BY) license (https://creativecommons.org/licenses/by/4.0/).
Share and Cite
Xie, M.; Li, H.; Zhu, Y.; Xue, J.; You, Q.; Jin, B.; Shi, Z. Predicting Bioaccumulation of Potentially Toxic Element in Soil–Rice Systems Using Multi-Source Data and Machine Learning Methods: A Case Study of an Industrial City in Southeast China. Land 2021, 10, 558. https://0-doi-org.brum.beds.ac.uk/10.3390/land10060558
Xie M, Li H, Zhu Y, Xue J, You Q, Jin B, Shi Z. Predicting Bioaccumulation of Potentially Toxic Element in Soil–Rice Systems Using Multi-Source Data and Machine Learning Methods: A Case Study of an Industrial City in Southeast China. Land. 2021; 10(6):558. https://0-doi-org.brum.beds.ac.uk/10.3390/land10060558
Chicago/Turabian StyleXie, Modian, Hongyi Li, Youwei Zhu, Jie Xue, Qihao You, Bin Jin, and Zhou Shi. 2021. "Predicting Bioaccumulation of Potentially Toxic Element in Soil–Rice Systems Using Multi-Source Data and Machine Learning Methods: A Case Study of an Industrial City in Southeast China" Land 10, no. 6: 558. https://0-doi-org.brum.beds.ac.uk/10.3390/land10060558