Article

Forests, Farms, and Fallows: The Dynamics of Tree Cover Transition in the Southern Part of the Uluguru Mountains, Tanzania

1
EU Delegation to Tanzania, Dar es Salaam P.O. Box 6114, Tanzania
2
Forestry Training Institute, Olmotonyi, Arusha P.O. Box 943, Tanzania
3
World Agroforestry (ICRAF), P.O. Box 30677, Nairobi 00100, Kenya
4
World Agroforestry (ICRAF), Dar es Salaam P.O. Box 6226, Tanzania
5
School of Life Sciences and Bio-Engineering, The Nelson Mandela African Institution of Science and Technology, Arusha P.O. Box 447, Tanzania
*
Author to whom correspondence should be addressed.
Submission received: 12 March 2021 / Revised: 13 May 2021 / Accepted: 14 May 2021 / Published: 28 May 2021
(This article belongs to the Special Issue Mountains under Pressure)

Abstract

:
Forests and woodlands remain under threat in tropical Africa due to excessive exploitation and inadequate management interventions, and the isolated success stories of tree retention and tree cover transition on African agricultural land are less well documented. In this study, we characterize the status of tree cover in a landscape that contains forest patches, fallows, and farms in the southern part of Uluguru Mountains. We aimed to unveil the practices of traditional tree fallow system which is socially acceptable in local settings and how it provides a buffering effects to minimize forest disturbances and thus represents an important step towards tree cover transition. We assessed land cover dynamics for the period of 1995 to 2020 and compared tree stocking for forest patches, fallows, and farms. We found that tree biomass carbon stocks were 56 ± 5 t/ha in forest patches, 33 ± 7 t/ha in fallows, and 9 ± 2 t/ha on farms. In terms of land cover, farms shrank at intensifying rates over time for the entire assessment period of 1995–2020. Forest cover decreased from 1995–2014, with the reduction rate slowing from 2007–2014 and the trend reversing from 2014–2020, such that forest cover showed a net increase across the entire study period. Fallow consistently and progressively increased from 1995–2020. We conclude that traditional tree fallows in the study site remain a significant element of land management practice among communities, and there appears to be a trend towards intensified tree-based farming. The gains in fallowed land represent an embracing of a traditional land management system that supports rotational and alternate uses of cropping space as well as providing a buffering effect to limit over-exploitation of forests. In order to maximize tree cover and carbon stocks in the farm landscape, this well-known traditional tree fallow system can be further optimized through the incorporation of additional innovations.

1. Introduction

Tropical forests account for 45% of global forest cover, and their deforestation significantly contributes to CO2 emissions from biogenic sources [1,2]. Broad scientific recognition of the considerable leverage of forest management in the global climate system has catalyzed efforts to better understand trends in deforestation and forest degradation [3,4]. In the tropics, swidden agriculture is strongly associated with deforestation [5]. Farmers practice swiddens by clearing forest vegetation, burning it, and then planting crops. Swiddens are believed to reduce carbon in the landscape via the destruction of relatively large aboveground carbon stocks, including forest resources [6,7]. For example, swidden is estimated to have removed one-third to one-half the aboveground carbon stocks in primary forest across Brazil, Cameroon, and Indonesia [8]. Nevertheless, the exact impact of swiddens and land use change on carbon dynamics differs with vegetation types and management models [9], and the varying types of swidden techniques used to fell forests, ranging from selective to total clearance, add further complexity. Varying swidden techniques create uncertainties and variability in the rates of deforestation and regrowth, as well as in the carbon density of various land uses throughout the landscapes [10,11].
One of the attempts to counter the challenges of swiddens is the use of fallow systems, which fosters alternate cropping-and-cessation cycles in the landscapes. Traditional fallows remain common tropical smallholder agricultural practices even as legal and social contexts shift [12]. Fallow entails a temporal cessation of cultivation after several cropping seasons and can serve various purposes [8,13]. In some areas, the complexities of land tenure, forest tenure, and tree tenure limit and shape how landscape management is conducted and may contribute to the presence or absence of swidden and fallow practices [14]. When it is economically viable, complete forest restoration may be achievable after shifting cultivation. More practically, fallows have remained the optimal trajectory of most tree cover restoration efforts on agricultural lands [15].
In Tanzania, community-held forestlands remain largely without legal protection except for village forest reserves under decentralized forest management regimes and traditionally protected sacred forests used for rituals [16]. Forests and woodlands cover 48.1 million ha, of which almost 50% is under legal protection [5]. The absence of proper incentives to protect forests undermine the sustainable management of forestlands in villages, despite some success stories in parts of Tanzania. Deforestation in the country is estimated to stand at approximately 470,000 ha/year, mostly affecting unprotected forestlands within community-held areas, and agriculture accounts for 80% of the causes [17,18]. Agriculture is the primary force behind this deforestation and is also the main source of food and livelihood for the majority of rural households [17]. Policies on decentralized forest management in the late 1990s led to upscaling of best practices in many parts of Tanzania and strengthened institutional capacities at the local level [19], but deforestation has continued, particularly in unprotected forests [20].
Traditional fallows form an integral part of agricultural landscape mosaics in some parts of Tanzania, with varying degree of composition in terms of crops, other land uses, and their spatial arrangement. In the southern part of Uluguru Mountains of Tanzania, trees and shrubs are prominently featured in the traditional fallow systems, thus contributing to forest cover and aboveground carbon, as well as the availability of woody and non-woody tree products [21]. The practice is highly socially acceptable and widespread among smallholders.
In the current study, we examine the significance of traditional fallows in the Kolero sub-catchment of the southern Uluguru Mountains through tree stocking and land cover analyses in the forest–agriculture interface. Attempts to study forest recovery following agricultural-induced disturbances have been gaining momentum in the recent past [22]. In our current study we focused on understanding how the traditional fallows are important to land use, on-farm natural resource stock, and carbon storage. Therefore, our objectives were to quantify tree cover and above ground carbon stocks in different land use types, quantify trends and patterns of land cover and forest fragmentation changes between 1995 and 2020 in the southern part of Uluguru Mountains of Tanzania.

2. Materials and Methods

2.1. Study Site

The study was conducted in the Kolero sub-catchment in the southern part of the Uluguru Mountains, Tanzania. The Uluguru Mountains are part of the Eastern Afromontane Biodiversity hotspot, known for its biological diversity, species richness, and high degree of species endemism [23]. The richness of strict- and near- endemic species in the Uluguru Mountains is highest for shrubs, herbs, trees, and climbers [24]. Located at 6°50′–7°25′ S and 37°33′–37°52′ E, the Kolero sub-catchment covers 35,405 ha and is comprised of four administrative wards: Kolero, Kasanga, Bungu, and Bwakila Juu (Figure 1). The study area ranges from 260 to 1250 m elevation and has an average annual precipitation of 1800 mm; temperatures range from 22 °C and 33 °C [25]. As of 2012, the sub-catchment had an estimated population of 26,241 people with an annual growth rate of 2.4%, of which 9301 are in Kolero, 6558 in Kasanga, 4406 in Bungu, and 5976 in Bwakila Juu [26].
The study site is adjacent to three state-owned forest protected areas: Uluguru Nature Reserve (24,115 ha), Mvuha Forest Reserve (758 ha), and Chamanyani Forest Reserve (806 ha). The Kolero sub-catchment is largely comprised of agricultural land but contains numerous remnants of forests, including sub-montane forests, riverine forests, and dry forests. Most of these remnants are traditionally protected as sacred forests owned by clans, while others are unprotected forests within village lands. Parts of state-owned Kasanga Forest Reserve (429 ha) and an extension of Uluguru Nature Reserve (1707 ha) are also found within the boundaries of the study site.

2.2. Land Tenure and Farming Systems

Land tenure in the Uluguru Mountains is complex due to an amalgamation of traditional practices based on customary law and modern statutory arrangements. According to tradition, land is owned by clan or a family within a clan, and inheritance is matrilineal. In this system a piece of land is held in common by all members of the clan or family, and allocations for use are decided by clan leaders. Despite stable tenure for use after allocation, individuals cannot claim perpetual ownership of the piece of cropping land. Changes and redistribution can happen any time; hence, individuals are hesitant to make long-term investments in their farms, such as tree planting or other costly investments like terraces.
In addition, a considerable proportion of land is owned by individuals, especially in areas near their homesteads where permanent cropping is exercised, and the stability of land tenure is high. However, most individually owned farms are small in size, and so are not involved in the traditional fallow system. Swidden agriculture is the main practice, which entails clearing forests, followed by crop cultivation and then by fallow. Traditional tree fallows are maintained for more than 5 years. The cycle repeats when fallows are cleared for farms. Ownership of cropland is restricted to clan and family members; hence, outsiders must rent the land for use over a short duration that may be as brief as one cropping season. Farms are characterized by sparse tree vegetation and open fields on hilltops, hillsides and in valleys. Common crops include maize, upland and paddy rice, and cassava. Perennial crops such as bananas and fruit trees are common near homesteads and in valleys.

2.3. Tree Inventory on Farms, in Forests, and in Fallows

The landscape of the study area is a mosaics of forest patches, farms, and fallows. Through a combination of remote sensing and ground-based techniques, we stratified the study area into sampling units by dividing the area into forest, farm, and fallow land use categories. We then laid 48 sample plots, sized 50 m × 20 m, at least with 1 km intervals within farmland areas, including forest patches (n = 20), fallow (n = 15), and farms (n = 13). The plot spread was independent of individual management units, and we optimally distributed them to cover the landscape to compensate on low sampling intensity. Next, we identified and recorded the diameter at breast height (dbh in cm) of all trees with a dbh greater than or equal to 10 cm. Heights (m) were not measured. A separate set of 300 trees of various sizes, categorized as large, medium, and small, were randomly selected adjacent to the sampled plots. We measured these trees for height and dbh to develop height-dbh relationship (Equation (1)), which we used to determine the heights (m) of trees that were not directly measured. Due to accessibility challenges and our intention to limit the study to community-managed land, we did not include in the tree inventory parts of state-owned forest reserves that fall in the study site.
Ln(Ht) = 1.1734 + 0.6026 × Ln(dbh), (R2 = 0.72, SE = 3.14)
where Ln = natural logarithm, Ht = height (m), dbh = diameter at breast height (cm), R2 = coefficient of determination, and SE = standard error.
We summarized tree stocking parameters by plot and transformed them into per-hectare values for number of stems (N), basal area (G), and volume (V) [27]. We then computed above-ground biomass (ABG) using an allometric equation (Equation (2)) developed for tropical trees [28] and transformed the results on a per-hectare basis:
AGB = 0.0673 × (ρdbh2H) 0.976
where AGB = above ground biomass, ρ = wood-specific gravity obtained from the literature (g cm−3) [29,30], dbh = diameter at breast height (cm), and H = height (m). Carbon was computed as 0.5 of the biomass.
We used histogram plots, the Shapiro-Wilk test, and the Anderson-Darling test to assess the normality of our sample data. First, we compared a histogram of density, basal area, volume, and carbon data to a normal probability curve. Next, we subjected each histogram to both Shapiro-Wilk and Anderson-Darling tests in R [31]. We found that our data followed a normal or Gaussian distribution. We then used a one-way analysis of variance (ANOVA) for Gaussian distribution sample data to compare differences in stand parameters—density, basal area, volume, and carbon data—between land uses. We further applied the Tukey honestly significant difference (HSD) test for post-hoc multiple comparisons to compare differences in stand parameters within land uses in R [31].

2.4. Land Use Land Cover Assessment and Landscape Fragmentation

To produce land cover maps for the study area, we acquired readily available Landsat Thematic Mapper (TM) and Landsat 8 Operational Land Imager (OLI) datasets from the U.S. Geological Survey Earth Explorer for the dry season. Our choice of satellite imaging was based on absence of cloud cover and availability between 1995 and 2020. We used the fast line-of-sight atmospheric analysis of spectral hypercubes (FLAASH) to correct the TM and OLI images, minimize atmospheric effects, and produce surface reflectance images. We collected 80 training samples through transect walks in additional to 48 training sites collected in the tree inventory to support a supervised classification based on major land uses (Table 1). These transect walks involved a group of ten people comprised of community elders, village leaders, and other people knowledgeable of the area.
We chose paths that passed through all the major land uses to ensure good coverage of our training samples. Through a supervised classification approach using a support vector machine algorithm [32], we classified the satellite images into three major land cover classes. Using 128 validation GPS points across the study area, we selected the Kappa coefficient, overall accuracy, user’s accuracy, and producer’s accuracy to assess the accuracy of classifications. In order to detect land cover changes, we used a cross-tabulation tool to produce a land cover change matrix that provides directions of change, specifying gains or losses.
Fragmentation analysis was conducted in ArcGIS landscape fragmentation tool (LFT v2.0, www.arcgis.com, accessed 7 June 2020). Following a standard procedure, for each year, we reclassified forest and fallow classes as forest, and cropland as non-forest, ergo, fragmenting land cover. Then, we classified forest into 4 major categories: (i) core forest, defined as forest pixels that are not degraded and are more than 100 m from the nearest farms; (ii) patch forest, defined as forest fragments that are degraded and do not contain any core forest pixels; (iii) edge forest, defined as forest along the periphery of a forest patch where it meets non-forest areas; and (iv) perforated forest, defined as areas along the inside edge of small forest gaps [33]. The core category was further divided into the following three classifications: (i) small-core forest, meaning an area of less than 101 ha; (ii) medium-core forest, or an area between 101.17 and 202 ha; and (iii) large-core forest, an area greater than 202 ha.

3. Results

3.1. Tree Cover Stocking

A number of sacred forests owned by clans and families were identified within the study site as part of forested areas scattered among farmlands (Table 2). The small size and large number of the forests signifies that forests are fragmented in the study landscape. On the other hand, the large number of sacred forests afforded protection suggests that traditional beliefs and customary practices offer strong tools for the preservation of forests.
The stand parameters on a per-hectare basis indicated that forest was more heavily stocked with woody biomass and carbon storage than fallow and farmland, respectively (Table 3). Forests had on average the largest number of stems, basal area, and volume of wood—meaning they had the most, thickest, and largest trees of any land use type. Tree biomass carbon stocks were 56 ± 5 t/ha in forests, 33 ± 7 t/ha in fallows, and 9 ± 2 t/ha on farms. Fallows come in second in all these stocking parameters, featuring the next-best tree cover, woody biomass, and carbon storage. Furthermore, a one-way ANOVA test shows that the mean scores for stand parameters differed significantly between land uses: stocking (F (2, 45) = 53.245, p < 0.001); basal area (F (2, 45) = 32.143, p < 0.001); volume (F (2, 45) = 17.493, p < 0.001); and carbon (F (2, 45) = 18.114, p < 0.001). Post-hoc comparisons using the Tukey HSD test indicated that forest, farms, and fallow are all significantly different from each other in terms of stocking, basal area, volume, and carbon data (p < 0.01). A further notable result of our stocking analysis is that forest stocking is relatively low, characteristic of the perforated forests that cover much of the study area.

3.2. Land Use/Cover Change

For the year 2014, we obtained an overall accuracy of 87% and kappa coefficient of 0.84. We chose the year 2014 because during this period, ground reference data were collected composed of 48 plots used in the forest tree inventory and additional 80 training sites collected during transect walks. About 82% to 100% of reference data representing all land-cover classes in the classified maps were correctly identified. The probability that map users would find all classified land-cover classes on the ground ranges from 86% to 92% (Table 4).
From 1995–2020, land cover assessments indicate consistent increases in land cover under fallow and decreases in farmland (Figure 2 and Table 5). Forest, meanwhile, initially shrunk from 2007–2014 but expanded from 2014–2020. The annual rate of change in land cover was highest for farmland, followed by fallow and forest, respectively. Overall, the net change in land cover was positive for fallow and forest, but negative for farmland.
The overall land cover size of core areas remained unchanged from 1995–2007, but consistently increased for fallow and decreased for forest and farmland from 2007–2014 and 2014–2020. From 1995–2020, all the three land cover classes experienced losses and gains between 3000–7000 ha, indicating dynamic land use. During this period, fallow was more dynamic than forest and farmland (Table 6).
There is a clear decrease in overall farmland (Table 5) coupled with the shrinkage of core, stable areas devoted to agriculture (Table 6). Additionally, core areas devoted to fallows remain constant (Table 6). Finally, the overall prevalence of fallows within this landscape points toward the importance of traditional fallow practices, which entail rotational and alternate uses of cropping space, for communities in the Kolero sub-catchment.

3.3. Forest Fragmentation

In total, perforated forest grew in area by over 39% from 1995–2020, and significant change occurred in the last assessment period of 2014–2020. Forest fragmentation analysis shows that perforated forest exhibited more changes than other categories (Figure 3, Table 7). Patch, edge, and perforated forests occupy large spaces in the study area, which indicates the scattered nature of these types of forests. They exhibited large changes compared to large, medium, and small core forests. From 1995–2020, the area’s perforated forests experienced continuing decline. This data indicates the continuing effect of forest fragmentation—which can give way to deforestation in time—within the study area, especially in its eastern, southern, and western regions.

4. Discussion

4.1. Stocking Levels and the Potential of Fallows to Support Forest Recovery

Overall, the tree stocking parameters for the forests in the study site demonstrate the typical extent of stock depletion of Tanzanian Miombo woodlands [34]. In general, tree stocking levels decrease from forest patches to fallows to farms, as was expected, but the level of stocking itself, especially for tree fallows, was significant. We found that stocking levels for the forests under study were lower than for the sub-montane forests of the Uluguru Mountains [35]. If woody material in tree fallows is no longer harvested, forest patches may fully recover with time. Other studies have noted a positive relationship between basal area and fallow age in other parts of the Eastern Arc Mountains [13]. We posit that the longevity of fallows determines their tree species composition, tree size, and the colonization of land towards forest transition.
The longevity of tree fallows, in turn, may depend upon factors such as distance from residential areas, type of terrain, and perceived soil fertility. Communities indicated that the cycle of tree fallows lasts between 10 and 15 years. Cycle duration depends on landforms, such as hilltops, hillsides, and valleys, and on proximity to residential areas. Tree fallows on hilltops persist longer than those on hillsides, in valleys, and close to homesteads, perhaps because hilltops are far from most homesteads and feature difficult terrain and apparently low soil fertility.
The presence of leftovers of large trees on fallows and the proximity of forest patches guarantee the availability of seed sources dispersed by wind and animals, but germination and recruitment remain challenging. Tree regeneration in the Kolero sub-catchment fallow occurs mainly through asexual propagation as cut stumps and roots sprout. Farmers do not uproot cut stumps, so most of them survive. Tree seedlings that make it to the sapling stage flourish, but most become suppressed and die during their infant stage, while others fail to germinate in the first place. We observed the presence of long grasses in fallows, which impact the recruitment of tree species. The dominance of long grasses that are persistent and aggressive on the tree fallow floor deprive tree seedlings of the chance to flourish from propagation; a similar phenomenon has been observed in the East Usambara Mountains [27]. What is more, wildfires commonly occur at the study site in the dry season as a result of fire-based swidden methods. Wildfires suppress seed germination, root sprouting, and seedling recruitment, which has also been observed in the tropical woodlands of southeast Angola [36].
Even after trees mature, there are other barriers to forest transition. For instance, extraction of woody material from tree fallows remains a common practice through selective harvesting of sizeable and desirable trees according to their usefulness; people believe forests and fallows in farmland are open access, especially those forests that lack traditional and formal institutional protections, but this practice slows progress in forest transition [37]. Small- to medium-sized trees are extracted for energy, building materials, and various other uses, while large trees are left on-site. We observed more recent tree cuts in fallows than in forests and on farms. In addition, most large trees either are varieties that have no immediate economic value in the area, such as Sterculia appendiculata and Bombax rhodognaphalon, or have become overgrown and unsuitable for timber due to heart rot.
Yet good land management practices, informed by climate-smart agriculture, may boost the forest transition process. For example, attempts were made between 2011–2014 to improve tree cover on farm in Kinole sub-catchment. A climate-smart agriculture project (www.fao.org/in-action/micca/knowledge/climate-smart-agriculture/en/, accessed 10 December 2020) led to planting of estimated 110,000 trees including species such as Grevillea robusta, Khaya anthotheca, Tectona grandis, Acacia crassicarpa, and Terminalia cattapa. This project might help explain the unusually sharp surge in tree cover that occurred in the assessment period of 2014–2020.

4.2. Shrinking Farms, Expanding Fallows

Since the 1930s, population growth in the Uluguru Mountains has been linked to agricultural expansion [38]. According to the population census, the number of people has doubled from 1,753,362 in 2002 to 2,218,492 in 2012 in Morogoro Region, and 73% of this population resides in rural areas [
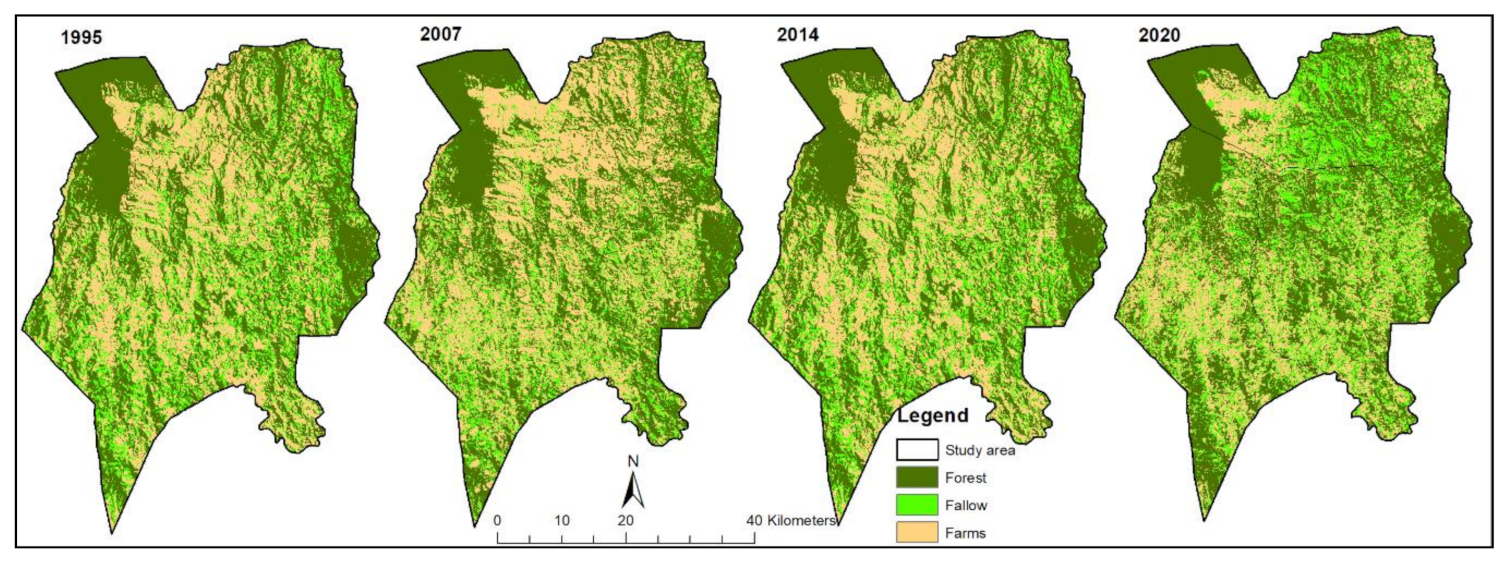
26]. Our observation, to the contrary, indicates that overall population growth in the Kolero sub-catchment and the Uluguru Mountains at large does not correspond to expanding farms. From 1995–2000, indeed, the area occupied by farms consistently declined (Table 5), and the stable, unchanged portion of farmland also continuously dwindled (Table 6). The data imply an unexpected trend of halted agricultural expansion and increased dynamism in land use.
This shrinkage of farms might be due to the increasing area under fallow. Projections from 1967 estimated that fallows in the Uluguru Mountains constitute 30% of the farmland area [39]. From 1995–2020, however, fallow area covered more than 40% of farmland, indicating that traditional tree fallows occupy a notable share of land in Kolero sub-catchment. The importance of fallows is further exemplified by the land use change matrix, which shows increments of unchanged fallow land in 2007–2020, a clear indication that the expansion of farms is contained.
In recent years, meanwhile, forest cover loss has also slowed in the study area. From 1995–2007, forest cover loss was higher than in 2007–2014. Most recently, the period of 2014–2020 experienced forest cover gain (Table 5), indicating a reduction in deforestation across the Kolero sub-catchment. Previous studies in the Uluguru Mountains highlighted similar trends of heightened deforestation prior to 2000 [40], and reduced deforestation and/or forest recovery in the early 2000s [41]. We speculate that the declining rate of forest loss in recent years may have arisen from a combination of factors including fewer forest disturbances, the diminishment of swidden, and the growing role of fallow in supplying forest produce.
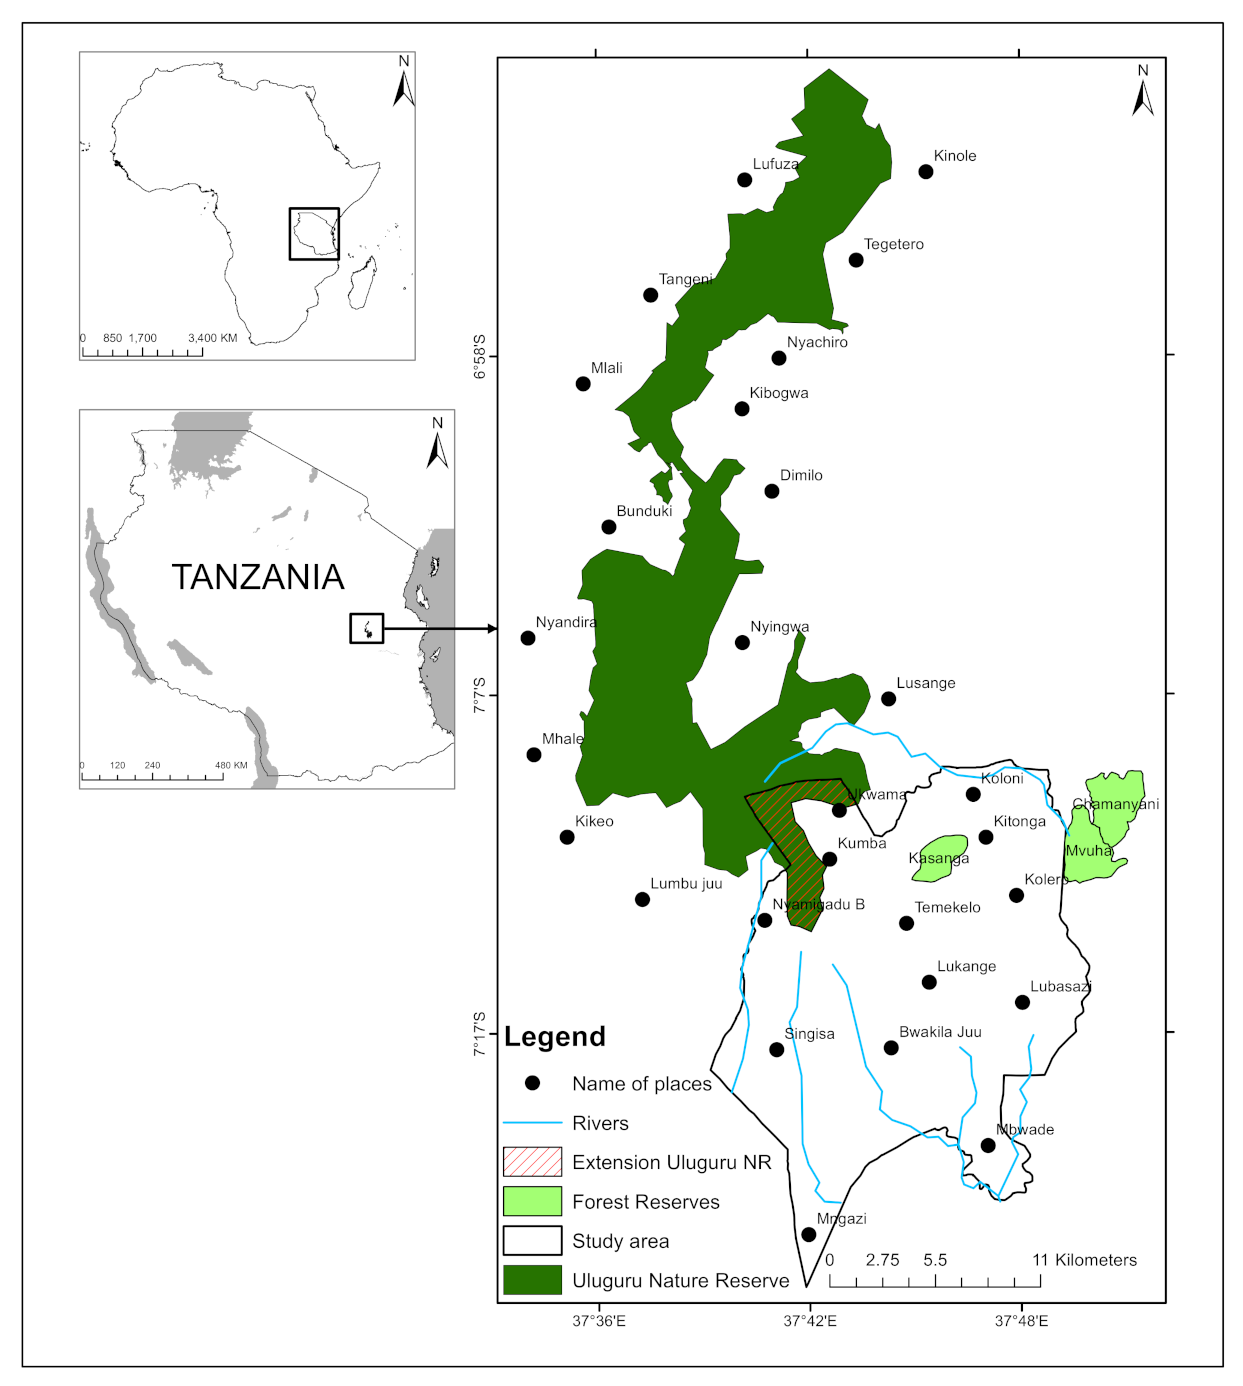
Accessibility from and proximity to villages may explain differences in forest cover changes because, as other studies have noted, there is often a relationship between accessibility and disturbances to forest vegetation [42]. The two state-owned forests in the study area furnish a good example of this effect. From 1995–2020, an extension of the Uluguru Nature Reserve remained stable, whereas Kasanga Forest Reserve succumbed to degradation from 1995–2007 and later recovered from 2014–2020 (Figure 2). The extension of Uluguru Nature Reserve is inaccessible, encompassing ridges with no roads, rough terrain, and deep valleys. It stands close to 1650 m above sea level, while the nearest villages, such as Mgata, Ukwama, and Longwe on the side of the Kolero sub-catchment, are located at 1250 m above sea level. Such physical barriers reduce and hinder human-induced disturbances. At 850 m above sea level, on the other hand, the Kasanga Forest Reserve is accessible from multiple directions and borders intensively cultivated farms, so it is prone to human-induced disturbances including fires.
Other positive factors may have influenced the expansion of fallow and increased tree cover. For instance, it seems that more farms were left as tree fallow and that the trend towards tree-based farming systems such as agroforestry has increased from 2007–2020. Between 2011 and 2014, conservation agriculture was promoted in the study site, but farmers did not view the returns as profitable [43], which may have dampened adoption rates [44]. However, we suggest that this effort may have increased awareness of agricultural intensification and so contributed to the reduction of swidden practices.
Traditional institutions are one of the key success factors in promoting community-led forest management in Tanzania [10]. Sacred forests under community-based forest management (Table 2) were found to be more protected and stable than forest patches that had no traditional significance. Despite their small size, sacred forests that are protected under traditional norms and customs provide important refugia for plant species, because access is limited to a few non-destructive utilizations. On the other hand, forest patches in farmland without community-based forest management arrangements faced excessive exploitation including conversion to other uses. Similarly, in other parts of Tanzania, traditionally protected forests have withstood exploitation pressure and remained intact [45].

4.3. The Threat of Deforestation

The study area faces a grave trend toward fragmentation that if not checked will result in complete deforestation. Across the whole of the Eastern Arc Mountains, deforestation has caused habitat reduction and forest fragmentation that has impacted more than 77% of the original forest cover in the past 2000 years [46]. At local and regional scales, forest fragmentation has caused a loss of biodiversity, continues to undermine forest transition in the Uluguru Mountains, and accelerates the extinction of important species such as birds [47,48].
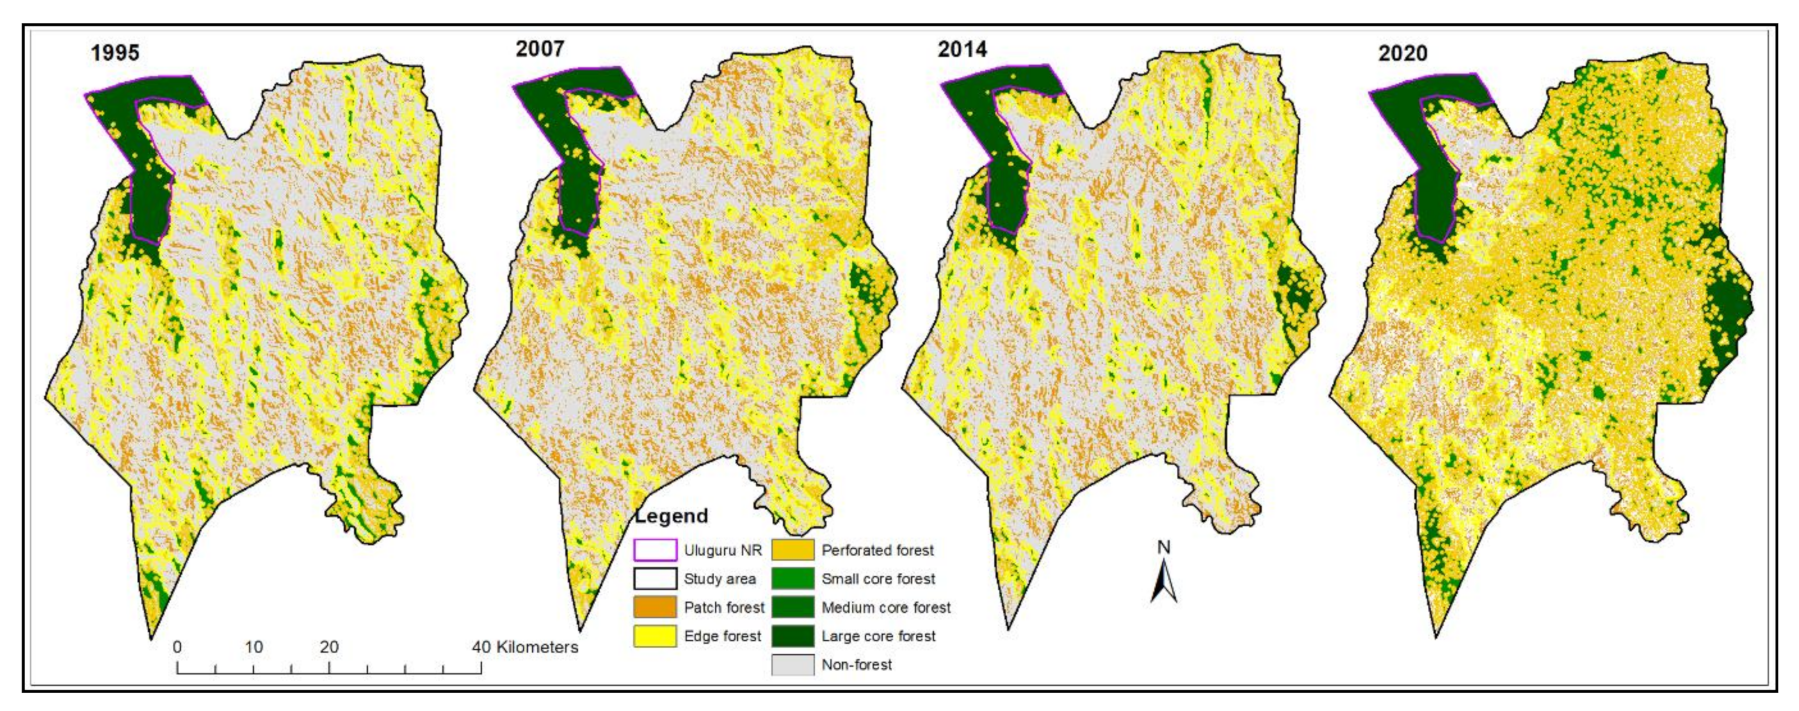
The trend toward increasing forest fragmentation in the Kolero sub-catchment landscape is notable, defined by the increasing isolation of continuous forests into smaller patches (Figure 3, Table 7). Forest fragmentation is exhibited both in spatial and temporal patterns. Temporal fragmentation can lead either to perforation (subdivision) or attrition (shrinkage) of the forest. Our observations on fragmentation (Table 7) conform with the tree inventory results (Table 3), indicating low stocking levels typical of perforated forests. In other parts of the Eastern Arc Mountains, forest fragmentation has involved encroachment affecting both protected and non-protected forests [49].
Forest fragmentation in the Kolero sub-catchment results from deforestation and forest degradation mainly due to anthropogenic factors such as expanding agricultural frontiers, excessive extraction of woody products, and fires. The scale and trends of forest fragmentation (Figure 3, Table 7) suggests the continuous decline of perforated forests throughout the assessment period of 1995–2020, especially in the eastern, western, and southern parts of the study site. Edge and small-core forests scattered across the study landscape also experienced shrinkage. Our field observations indicate that forests are not opened up in large-scale clearing but rather in small, incremental areas adjacent to existing farms. Similar observations were made previously of significant forest fragmentation in less dense forest classes in the Uluguru Mountains [50].

5. Conclusions

Our results indicate that whereas forests offer the best stocking of woody biomass and carbon storage, fallows also offer advantages in this regard. We found that, contrary to long-held assumptions, active farms in the study area are shrinking and fallows are expanding despite population growth, these fallows could help address the urgent risks posed by deforestation. These findings demonstrate the importance of traditional fallows in terms of tree stocking at the forest-agriculture interface, and points toward options for how fallow practices can be optimized to improve natural resource stocks in the community. This represents an underreported success story for traditional practices from rural Africa in terms of tree cover transition and landscape improvement.
Deforestation is an urgent concern in the study area. While the spatial and temporal arrangement of forests, farms, and fallows in the Kolero sub-catchment may not be optimal for maximizing carbon inputs, the current practices of tree fallows in the southern Uluguru Mountains offer significant opportunities for improvement toward becoming exemplary dry mountainous land management system. Given time, tree fallows promise to boost tree cover and support forest transition, offsetting the effects of deforestation. Although forests offer superior carbon storage, nonetheless tree fallows also represent an important carbon sink in a previously deforested landscape [22].
Any improvement of the traditional fallow should adhere to existing practices. The current land management arrangement is effective and socially acceptable and incorporates community expectations. It evolved through lengthy traditional experience from one generation to another, not through a top-down approach imposed by outsiders such as the government, non-governmental organizations, and researchers; hence, it is more likely to prevail in the long run. Attempts to impose best-bet technologies that are not compatible with traditional and well-accepted local practices often do not lead to proper adoption [51] or fall short of long-term sustainability [52].
Certain policy interventions that build on traditional fallow could continue to improve the landscape and reduce deforestation. For instance, wildfires endanger tree recruitment and retention. In response, we recommend local by-law guidance on prescribed fire for farm preparations and stronger enforcement of community-led wildfire management. In addition, farms in the Kolero sub-catchment are typically characterized by reduced tree cover because of continuous clearing and prioritization of shade-intolerant crop varieties such as upland rice, paddy rice, cassava, pineapples, and sesame. (The major exception to this is the middle and low altitudes, where tree planting and retention are commonplace around homesteads and in valleys, with strong preferences for fruit trees such as Artocarpus heterophyllus, Artocarpus altilis, and Cocos nucifera.) Farm preparation during the onset of cropping seasons is normally accompanied by swidden practices, which diminish long-term tree and shrub recruitment [51]. Adequate agricultural extension services and continuous public awareness campaigns targeting smallholders could effectively contribute to the tree cover transition.

Author Contributions

Conceptualization and design of study, M.M., E.J. and T.S.R.; methodology, M.M., E.J., A.K., R.A.G. and E.A.; analysis, M.M. and R.A.G.; writing—review and editing, M.M., T.S.R., E.A. and A.K. All authors have read and agreed to the published version of the manuscript.

Funding

This work was made possible through the FAO Mitigation of Climate Change in Agriculture Programme (MICCA) 2011–2014. The CGIAR Research Programs on Climate Change, Agriculture, and Food Security and Forests, Trees, and Agroforests supported T.S. and E.A.

Institutional Review Board Statement

Not applicable.

Informed Consent Statement

Informed consent was obtained from all people involved in the study.

Data Availability Statement

Data is available on request to corresponding author.

Acknowledgments

We would like to thank Anthony Kimaro, Jimmy Sianga, Anthony Tairo and Abdallah Liingilie for their tireless administrative support for the field part of this work in 2014. We also thank the community members of the Kolero sub-catchment for their valuable insights and for allowing us to access their forests, farms, and fallows for this research work.

Conflicts of Interest

The authors declare no conflict of interest.

References

  1. Achard, F.; Beuchle, R.; Mayaux, P.; Stibig, H.; Bodart, C.; Brink, A.; Carboni, S.; Desclée, B.; Donnay, F.; Eva, H.D.; et al. Determination of tropical deforestation rates and related carbon losses from 1990 to 2010. Glob. Chang. Biol. 2014, 20, 2540–2554. [Google Scholar] [CrossRef] [PubMed]
  2. FAO. Global Forest Resources Assessment 2020–Key Findings; FAO: Rome, Italy, 2020; Available online: https://0-doi-org.brum.beds.ac.uk/10.4060/ca8753en (accessed on 10 January 2021).
  3. Kindermann, G.E.; Obersteiner, M.; Rametsteiner, E.; McCallum, I. Predicting the deforestation trend under different carbon prices. Carbon Balance Manag. 2006, 1, 1–15. [Google Scholar] [CrossRef] [Green Version]
  4. Green, J.M.H.C.; Larrosa, N.D.; Burgess, A.; Balmford, A.; Johnston, B.P.; Mbilinyi, P.; Platts, P.J.; Coad, L. Deforestation in an African biodiversity hotspot: Extent, variation and the effectiveness of protected areas. Biol. Conserv. 2013, 164, 62–72. [Google Scholar] [CrossRef]
  5. URT (United Republic of Tanzania). National Forest Resources Monitoring and Assessment of Tanzania Mainland: Main Results; Ministry of Natural Resources and Tourism: Dar es Salaam, Tanzania, 2015; p. 124. [Google Scholar]
  6. Mwampamba, T.H.; Schwartz, M.W. The effects of cultivation history on forest recovery in fallows in the Eastern Arc Mountain, Tanzania. For. Ecol. Manag. 2011, 261, 1042–1052. [Google Scholar] [CrossRef]
  7. Sanchez, P. Soils and Slash-and-Burn Agriculture. In Properties and Management of Soils in the Tropics Cambridge; Cambridge University Press: Cambridge, UK, 2019; pp. 433–491. [Google Scholar] [CrossRef]
  8. Palm, C.A.; Vosti, S.A.; Sanchez, P.A.; Ericksen, P.J. (Eds.) Slash-and-Burn Agriculture: The Search for Alternatives; Colombia University Press: New York, NY, USA, 2005; p. 463. [Google Scholar]
  9. Deng, L.; Zhu, G.; Tang, Z.; Shangguan, Z. Global patterns of the effects of land-use changes on soil carbon stocks. Glob. Ecol. Conserv. 2016, 5, 127–138. [Google Scholar] [CrossRef] [Green Version]
  10. Thong, P.; Sahoo, U.K.; Thangjam, U.; Pebam, R. Pattern of forest recovery and carbon stock following shifting cultivation in Manipur, North-East India. PLoS ONE 2020, 15, e0239906. [Google Scholar] [CrossRef] [PubMed]
  11. Runyan, C.W.; Stehm, J. Deforestation: Drivers, Implications, and Policy Responses. In Oxford Research Encyclopedia of Environmental Science; Oxford University Press: Oxford, UK, 2020. [Google Scholar]
  12. Gomes, E.P.; Sugiyama, M.; Junior, C.J.F.O.; Prado, H.M.; Filho, A.A.A.; Adams, C. Post-agricultural succession in the fallow swiddens of South-Eastern Brazil. For. Ecol. Manag. 2020, 475, 118398. [Google Scholar] [CrossRef]
  13. Pollini, J. Agroforestry and the search for alternatives to slash-and-burn cultivation: From technological optimism to a political economy of deforestation. Agric. Ecosyst. Environ. 2009, 133, 48–60. [Google Scholar] [CrossRef]
  14. Dokken, T.; Caplow, S.; Angelsen, A.; Sunderlin, W.D. Tenure issues in REDD+ pilot project sites in Tanzania. Forests 2014, 5, 234–255. [Google Scholar] [CrossRef] [Green Version]
  15. Morton, O.; Boran, J.R.; Edwards, D.P. Economically viable forest restoration in shifting cultivation landscapes. Environ. Res. Lett. 2020, 15, 064017. [Google Scholar] [CrossRef]
  16. Mbwambo, L.; Eid, T.; Malimbwi, R.E.; Zahabu, E.; Kajembe, G.C.; Luoga, E. Impact of decentralised forest management on forest resource conditions in Tanzania. For. Trees Livelihood 2012, 21, 97–113. [Google Scholar] [CrossRef]
  17. Doggart, N.; Morgan-Brown, T.; Lyimo, E.; Mbilinyi, B.; Meshack, C.K.; Sallu, S.M.; Spracklen, D.V. Agriculture is the main driver of deforestation in Tanzania. Environ. Res. Lett. 2020, 15, 034028. [Google Scholar] [CrossRef]
  18. URT (United Republic of Tanzania). Tanzania’s Forest Reference Emission Level Submission to the UNFCCC; National Carbon Monitoring Centre: Morogoro, Tanzania, 2017; 56p. [Google Scholar]
  19. Kajembe, G.C.; Luoga, E.J.; Kijazi, M.S.; Mwaipopo, C.S. The role of traditional institutions in the conservation of forest resources in East Usambara, Tanzania. Int. J. Sustain. Dev. World Ecol. 2009, 10, 101–107. [Google Scholar] [CrossRef]
  20. Gizachew, B.; Rizzi, J.; Shirima, D.D.; Zahabu, E. Deforestation and Connectivity among Protected Areas of Tanzania. Forests 2020, 11, 170. [Google Scholar] [CrossRef] [Green Version]
  21. Osei, A.K.; Kimaro, A.A.; Peak, D.; Gillespie, A.W.; Van Rees, K.C.J. Soil carbon stocks in planted woodlots and Ngitili systems in Shinyanga, Tanzania. Agroforest. Syst. 2018, 92, 251–262. [Google Scholar] [CrossRef]
  22. Mukul, S.; Herbohn, J.; Firn, J. Tropical secondary forests regenerating after shifting cultivation in the Philippines uplands are important carbon sinks. Sci. Rep. 2016, 6, 22483. [Google Scholar] [CrossRef] [Green Version]
  23. Burgess, N.D.; Butynski, T.M.; Cordeiro, N.J.; Doggart, N.H.; Fjeldsa, J.; Howell, K.M.; Kilahama, F.B.; Loader, S.P.; Lovett, J.C.; Mbilinyi, B.; et al. The biological importance of the Eastern Arc Mountains of Tanzania and Kenya. Biol. Conserv. 2007, 134, 209–231. [Google Scholar] [CrossRef]
  24. Temu, R.P.C.; Macrice, S. Endemism of plants in the Uluguru Mountains, Morogoro, Tanzania. For. Ecol. Manag. 2008, 255, 2858–2869. [Google Scholar] [CrossRef]
  25. Rosenstock, T.S.; Mpanda, M.; Pelster, D.E.; Butterbach-Bahl, K.; Rufino, M.C.; Thiong’o, M.; Mutuo, P.; Abwanda, S.; Rioux, J.; Kimaro, A.A.; et al. Greenhouse gas fluxes from agricultural soils of Kenya and Tanzania. J. Geophys. Res. Biogeosci. 2016, 121, 1568–1580. [Google Scholar] [CrossRef] [Green Version]
  26. URT (United Republic of Tanzania). 2012 Population and Housing Census: Population Distribution by Administrative Areas; Ministry of Finance, Government Printers: Dar es Salaam, Tanzania, 2013; p. 264.
  27. Mathew, M.M.; Luoga, E.J.; Kajembe, G.C.; Eid, T. Impact of forestland tenure changes on forest cover, stocking and tree species diversity in Amani Nature Reserve, Tanzania. For. Trees Livelihood 2011, 20, 215–230. [Google Scholar]
  28. Chave, J.; Réjou-Méchain, M.; Búrquez, A.; Chidumayo, E.; Colgan, M.S.; Delitti, W.B.C.; Duque, A.; Eid, T.; Fearnside, P.M.; Goodman, R.C.; et al. Improved allometric models to estimate the aboveground biomass of tropical trees. Glob. Chang. Biol. 2014, 20, 3177–3190. [Google Scholar] [CrossRef] [PubMed]
  29. Nyg, R.; Bjorn, E. Stem basic density and bark proportion of 45 woody species in young savanna coppice forests in Burkina Faso. Ann. For. Sci. 2000, 57, 143–153. [Google Scholar] [CrossRef]
  30. Zanne, A.E.; Lopez-Gonzalez, G.; Coomes, D.A.; Ilic, J.; Jansen, S.; Lewis, S.L.; Miller, R.B.; Swenson, N.G.; Wiemann, M.C.; Chave, J. Data from: Towards a worldwide wood economics spectrum. Dryad Digit. Repos. 2009. [Google Scholar] [CrossRef]
  31. R Core Team. R: A Language and Environment for Statistical Computing; R Foundation for Statistical Computing: Vienna, Austria. Available online: https://www.R-project.org/ (accessed on 5 July 2020).
  32. Alawamy, J.S.; Balasundram, S.K.; Hanif, A.H.M.; Sung, C.T.B. Detecting and Analyzing Land Use and Land Cover Changes in the Region of Al-Jabal Al-Akhdar, Libya Using Time-Series Landsat Data from 1985 to 2017. Sustainability 2020, 12, 4490. [Google Scholar] [CrossRef]
  33. Vogt, P.; Riiters, K.H.; Estreguil, C.; Kozak, J.; Wade, T.G.; Wickham, J.D. Mapping spatial patterns with morphological image processing. Landsc. Ecol. 2007, 22, 171–177. [Google Scholar] [CrossRef]
  34. Kashindye, A.; Mtalo, E.; Mpanda, M.; Liwa, E.; Giliba, E. Multi-temporal Assessment of Forest Cover, Stocking Parameters and Above-ground Tree Biomass Dynamics in Miombo Woodlands of Tanzania. Afr. J. Environ. Sci. Technol. 2013, 7, 611–623. [Google Scholar]
  35. Kitula, M.M.; Kajembe, G.C.; Zahabu, E.; Luoga, E.J.; Katani, J.Z.; Ngowi, S.E.; Tron, E. Influence of forest land tenure regimes on forest condition in Uluguru Mountains, Tanzania. Tanzan. J. For. Nat. Conserv. 2012, 82, 68–91. [Google Scholar]
  36. Gonçalves, F.M.P.; Revermann, R.; Cachissapa, M.J.; Gomes, A.L.; Aidar, M.P.M. Species diversity, population structure, and regeneration of woody species in fallows and mature stands of tropical woodlands of southeast Angola. J. For. Res. 2018, 29, 1569–1579. [Google Scholar] [CrossRef]
  37. Kajembe, G.C.; Monela, G.C.; Mvena, Z.S.K. Making community-based forest management work: A case study of Duru-Haitemba Village Forest Reserve, Babati, Tanzania. In Policies and Management Structures in Woodlands of Southern Africa; Kowero, G., Campbell, B.M., Sumalia, U.R., Eds.; Centre for International Forestry Research (CIFOR): Jakarta, Indonesia, 2003; pp. 16–27. [Google Scholar]
  38. Jones, S.J. Farming systems and nutrient flows: A study from the Uluguru Mountains, Tanzania. Geography 1996, 353, 4289–4300. [Google Scholar]
  39. Lyamuya, V.E.; Noah, L.G.; Kilasara, M.; Kirenga, E.J.; Burgess, N.D. Socio-Economic and Land Use Factors Affecting the Degradation of the Uluguru Mountains Catchment in Morogoro Region, Tanzania; Regional Natural Resources Office of Morogoro Region: Morogoro, Tanzania; The Royal Society for the Protection of Birds: Sandy, UK, 1994. [Google Scholar]
  40. FBD. Forest Area Baseline for Eastern Arc Mountains; Forestry and Beekeeping Division: Dar es Salaam, Tanzania, 2006. [Google Scholar]
  41. Blomley, T.; Pfliegner, K.; Isango, J.; Zahabu, E.; Ahrends, A.; Burgess, N. Seeing the wood for the trees: An assessment of the impact of participatory forest management on forest condition in Tanzania. Oryx 2008, 42, 380–391. [Google Scholar] [CrossRef] [Green Version]
  42. Toivonen, J.M.; Kessler, M.; Ruokolainen, K.; Hertel, D. Accessibility predicts structural variation of Andean Polylepis forests. Biodivers. Conserv. 2011, 20, 1789–1802. [Google Scholar] [CrossRef]
  43. Rosenstock, T.S.; Mpanda, M.; Rioux, J.; Aynekulu, E.; Kimaro, A.A.; Neufeld, H.; Shepherd, K.D.; Luedeling, E. Targeting conservation agriculture in the context of livelihoods and landscapes. Agric. Ecosyst. Environ. 2014, 187, 47–51. [Google Scholar] [CrossRef]
  44. Mutabazi, K. Study on Barriers and Incentives to Adoption of Climate-Smart Agricultural Practices and Lessons Learned in the MICCA Pilot Site, Tanzania; FAO: Rome, Italy, 2014; p. 103. [Google Scholar]
  45. Ylhäisi, J. Indigenous forests fragmentation and the significance of ethnic forests for conservation in the North Pare, the Eastern Arc Mountains, Tanzania. Fenn. Int. J. Geogr. 2004, 182, 109–132. [Google Scholar]
  46. Newmark, W.D. Forest area, fragmentation, and loss in the Eastern Arc Mountains: Implications for the conservation of biological diversity. J. East Afr. Nat. Hist. 1998, 87, 29–36. [Google Scholar] [CrossRef]
  47. Kacholi, D.S.; Whitbread, A.M.; Worbes, M. Diversity, abundance, and structure of tree communities in the Uluguru forests in the Morogoro region, Tanzania. J. For. Res. 2015, 26, 557–569. [Google Scholar] [CrossRef]
  48. Werema, C. Seasonal variation in understorey bird species diversity and abundance in the Uluguru Nature Reserve, Tanzania. Afr. J. Ecol. 2016, 54, 299–307. [Google Scholar] [CrossRef]
  49. Hall, J.; Burgess, N.D.; Lovett, J.; Mbilinyi, B.; Gereau, R.E. Conservation implications of deforestation across an elevational gradient in the Eastern Arc Mountains, Tanzania. Biol. Conserv. 2009, 142, 2510–2521. [Google Scholar] [CrossRef]
  50. Ojoyi, M.M.; Odindi, J.; Mutanga, O.; Abdel Rahman, E.M. Analysing fragmentation in vulnerable biodiversity hotspots in Tanzania from 1975 to 2012 using remote sensing and fragstats. Nat. Conserv. 2016, 16, 19–37. [Google Scholar] [CrossRef]
  51. Zagst, L. Socio-Economic Survey: CARE-MICCA Pilot Projects Tanzania; World Agroforestry Centre and CARE International in Tanzania: Morogoro, Tanzania, 2011. [Google Scholar]
  52. Jacobson, M.; Ham, C. The (un)broken promise of agroforestry: A case study of improved fallows in Zambia. Environ. Dev. Sustain. 2020, 22, 8247–8260. [Google Scholar] [CrossRef]
Figure 1. Location of the Kolero sub-catchment, Uluguru Mountains, Tanzania.
Land 10 00571 g001
Figure 2. Land cover map for the years 1995, 2007, 2014, and 2020.
Land 10 00571 g002
Figure 3. Maps of the forest fragmentation pattern in the study area for the years 1995, 2007, 2014, and 2020.
Land 10 00571 g003
Table 1. Land use classes for the assessment of land use, land cover, and forest fragmentation.
Land Use and Land CoverDescription
ForestLand covered by closed forest, semi-closed forest, and open forest under both protected and unprotected management regimes.
FallowLand that has been previously cultivated and left under no prescribed management for at least five years.
FarmLand under active crop farming of annual and perennial crops. A farm further includes land under settlement and infrastructure.
Table 2. Sacred and other general-purpose forests in the Kolero sub-catchment, Uluguru Mountains, Tanzania.
WardVillageForestSize (ha)Uses of the Forest
KasangaKitongaMongwe20Water catchment
Kivule0.5Sacred
Ng’obambe0.5Sacred
Lubakwe1.5Water catchment
KasangaBomani32Water catchment
Sungwi5Sacred
Lukwangule>200Sacred and water catchment
KizagilaMtembe25Sacred and water catchment
Kikwega8Sacred and water catchment
Bagala9Water catchment
KoleroKoleroChasamoyo0.5Sacred
LukangeMapanga0.25Sacred
Kiduge0.25Sacred and water catchment
Ng’amba0.5Water catchment
LubasaziPango A4Sacred
Pango B1.25Sacred
Uhamvi38.5General purposes
* Chalupia>50Sacred and water catchment
Mapanga10Sacred and water catchment
Dabala15General purposes
BunguMihangeKunguwi5Sacred and water catchment
Mihange1.5Sacred and water catchment
MalowaniKitala2Sacred and water catchment
BalaniLutite35Sacred and water catchment
Mingo>50Water catchment
Bwakila JuuBwakila JuuMsinule>30Sacred and water catchment
Kigenge0.5Water catchment
Milango Miwili0.25Sacred and water catchment
* Also known as Kwa Bibi, a Swahili term that means “belongs to Grandmother”, this forest contains graves of prominent traditional ritual leaders.
Table 3. Descriptive statistics of stand parameters in the Kolero sub-catchment, Uluguru Mountains, Tanzania.
Stocking ParametersLand UseSample Size (N)MeanSE95% Confidence IntervalMinimumMaximum
No. of stems (stems ha−1)Forest20346.0023.06297.73–394.27170.00580.00
Fallow15178.0011.88152.52–203.48120.00290.00
Farm1364.6217.1927.15–102.0810.00210.00
Basal Area (m2 h−1)Forest201.100.080.93–1.260.611.82
Fallow150.600.100.38–0.820.171.67
Farm130.180.040.10–0.260.030.48
Volume of wood (m3 ha−1)Forest2013.191.1210.84–15.535.9025.29
Fallow158.011.844.06–11.961.4325.93
Farm132.170.570.94–3.410.277.48
Carbon (t ha−1C)Forest2056.054.9845.62–66.4826.25115.17
Fallow1532.857.4716.83–48.866.59103.55
Farm138.992.294.00–13.980.9128.12
Table 4. Cross-tabulation error matrix of a classified image versus reference data for 2014.
Reference Data
Classified ImageForestFallowFarmsTotal
Forest464050
Fallow045550
Cropland/Farms042428
Total465329128
Producer Accuracy100%85%82%
User Accuracy92%90%86%
Overall accuracy 89%
Kappa 84%
Table 5. Land cover area, change, and annual rate of change (ha) for the study landscape, 1995–2020.
Land Cover Type1995200720142020Change (1995–2007)Change (2007–2014)Change (2014–2020)Total Change (1995–2020)Annual Change
Forest14,909.8514,450.7614,258.0715,268.41−459.09−192.691010.34358.5614.34
Fallow5027.135572.896987.878229.42545.761414.981241.553202.29128.09
Farm12,467.8812,381.2111,158.928908.38−86.67−1222.29−2250.54−3559.50−142.38
Table 6. Land use change (ha) between 1995 and 2020. Bold numbers indicate no change in land cover during the assessment period.
Land CoverForestFallowFarmTotal (2007)Losses
Forest10,9331964155414,451−3518
Fallow1836131024275573−4263
Farms21411753848712,381−3894
Total (1995)14,910502712,46832,405
Gains397737173981
Land CoverForestFallowFarmTotal (2014)Losses
Forest10,3591611228914,258−3899
Fallow2119202628426988−4961
Farms19721936725011,159−3909
Total (2007)14,45055,72312,38132,405
Gains409235465131
Land CoverForestFallowFarmTotal (2020)Losses
Forest10,2482743227615,268−5020
Fallow1236242145728229−5808
Farm2773182443118908−4597
Total (2014)14,258698811,15932,405
Gains401045676848
Table 7. Forest fragmentation and annual change of each class (% area), 1995–2020.
Forest ClassForest Cover (%)Forest Cover Change (%)
19952007201420201995–20072007–20142014–20201995–2020Annual Change
Patch forest21.6232.0328.567.8910.42−3.48−21.43−14.48−0.58
Edge forest37.2031.6735.4811.35−5.543.81−24.12−25.85−1.03
Perforated forest20.6019.2918.3860.14−1.31−0.9141.7639.541.58
Small core forest7.852.872.978.00−4.980.105.030.150.01
Medium core forest0.001.050.000.621.05−1.050.620.620.02
Large core forest12.7313.0914.6112.000.351.53−2.62−0.74−0.03
Publisher’s Note: MDPI stays neutral with regard to jurisdictional claims in published maps and institutional affiliations.

