
Does Polycentric Development Improve Green Utilization Efficiency of Urban Land? An Empirical Study Based on Panel Threshold Model Approach

College of Public Administration, Nanjing Agricultural University, Nanjing 210095, China
*
Author to whom correspondence should be addressed.
Land 2022, 11(1), 124; https://0-doi-org.brum.beds.ac.uk/10.3390/land11010124
Submission received: 6 December 2021
/
Revised: 31 December 2021
/
Accepted: 10 January 2022
/
Published: 12 January 2022
(This article belongs to the Section Land Socio-Economic and Political Issues)
Abstract
:In the context of increasing resource and environmental constraints, measurement and determinants of green utilization efficiency of urban land (GUEUL) is currently the subject of a rapidly expanding literature. Previous research concerning determinants of GUEUL focuses primarily on effects of socio-economic conditions on GUEUL, and little attention has been devoted to impacts of spatial structure and urban development patterns. This research explores impacts of polycentric development on GUEUL of urban agglomeration (UA), using data for major UAs in China covering the period 2005–2019. GUEUL and the extent of polycentricity is measured by employing an improved directional slack-based measure (SBM) model and the rank-size distribution-based approach, respectively. The linkage between polycentric development and GUEUL is explored by estimating models of determinants of GUEUL, and the nonlinear characteristics of the relationship are investigated by employing the panel threshold model approach. The results suggest that polycentric development positively impacts GUEUL of UAs, and such effect rises with economic development levels. In addition, degree of agglomeration, economic development level and intensity of government investment in science and technology is found to be positively related to GUEUL. The empirical results have significant implications for improving GUEUL through formulating and implementing regional and urban policies.
1. Introduction
In the context of increasingly serious resource and environmental challenges (resource bottlenecks, water and air pollution, environmental degradation, biodiversity loss, climate change, etc.), there has been a growing consensus among economic elites and policy makers about the need for changing the traditional resource-intensive growth paradigm, and “green growth” has emerged as an essential theme of global discussion on development policy [1,2,3,4]. Around the time of the Rio+ 20 United Nations conference on Sustainable Development, a range of flagship reports on “green growth” were published by leading international organizations. According to those reports, “green growth” can be defined as promoting economic growth while substantially reducing environmental damage, ecological scarcities and unsustainable use of resources, and green utilization efficiency of urban land (GUEUL) generally reflects the capacity to maximize urban economic output with a certain level of land and other inputs while minimizing the undesirable outputs (e.g., environmental pollutants). In recent years, a rapidly expanding literature has been devoted to measurement and analysis of GUEUL [5,6,7,8,9,10]. Another essential concept in the field of sustainable development is green infrastructure (GI), which generally refers to a strategically planned network of natural and semi-natural areas designed and managed to deliver a variety of ecosystem services [11]. Since GI provides a wide range of ecological (climate change mitigation, biodiversity conservation, etc.), economic (tourism, increased land values, etc.) and social benefits (education, enhancement of social cohesion, etc.), it plays a vital role in promoting sustainable utilization of urban land [12,13,14]. It is noteworthy that a significant proportion of existing literature on GI pays attention to urban and peri-urban landscapes [11].
Due to the rapid advances in transport and information technologies and consequent increase in mobility of factors of production and speed of technology and knowledge diffusion, the past few decades have witnessed a widening geographical scope of economic processes [15,16]. Urban agglomeration (UA, similar concepts including urban region, city network, urban network, city cluster, city group, etc.), which generally refers to a cluster of distinct but proximally located and economically, socially and culturally connected cities [17,18,19,20,21], has been increasingly perceived as the spatial entity where agglomeration externalities are primarily localized [22,23]. Given the fact that the global leading UAs (e.g., the southern California UA, the Greater Tokyo UA, the Amsterdam-Brussels-Antwerp UA, etc.) constitute a significant proportion of the globe’s population and economic activities, it is well recognized that UA has emerged as a curial platform for national or international competition. There is also an increasing trend to treat UA as the unit of analysis, and many studies have explored economic performance of UAs and its influencing factors [24,25,26,27].
Spatial structure, i.e., the way in which population and economic activities are distributed over a certain UA, is a vital determinant of resource utilization efficiency within a UA [28,29,30]. More specifically, spatial structure affects the creation and accumulation of agglomeration economies and diseconomies within a certain UA, which in turn affects resource utilization efficiency. The degree of polycentricity is a crucial indicator for characterizing spatial structure [30,31,32], and “polycentrism” and “polycentric development” have become popular planning concepts [23]. Many planners and policy makers believe that polycentric development has the potential for promoting economic competitiveness and environmental sustainability [20,26]. However, these claims have not yet been satisfactorily substantiated, and the empirical evidence concerning the impact of polycentric development on resource utilization efficiency is still inconclusive [28,29].
This research examines the impacts that polycentric development exerts on GUEUL of UAs, using data for major UAs in China covering the period 2005–2019. Although the empirical analysis focuses on UAs in China, it is of global relevance given the increasing worldwide trend towards a widening geographical scope of economic processes and “regionalization” of agglomeration economies, and highlights the importance of urban and regional policies in promoting “green growth”. The contributions made by this research to the existing literature on GUEUL are multifaceted. First, this research is among the first to empirically examine impacts of polycentric development on GUEUL. Previous research on the determinants of GUEUL mainly pays attention to impacts of socio-economic conditions on GUEUL [7,8,9], and little research has focused on effects of polycentric development on GUEUL. Second, this research explores the nonlinear characteristics of the effect of polycentric development on GUEUL by developing and estimating a panel threshold model. To our knowledge, relatively little empirical research has examined whether the effects of polycentric development on GUEUL are conditional upon other factors (such as economic development level). Examining nonlinear effects of polycentric development is of great value in proposing differentiated urban and regional policies for nations and regions at different phases of economic development. Third, this study provides a more precise measure of GUEUL. An improved directional slack-based measure (SBM) model, i.e., the directional super-SBM model developed under the window data envelopment analysis (DEA) framework, is employed to measure GUEUL in this research. Compared with the directional SBM model employed in previous studies [6,10], the model employed in this study allows distinguishing between efficient decision-making units (DMUs), thus avoiding the problem of assigning identical efficiency score to different DMUs. In addition, the window DEA framework employed allows the comparison of the performance of a particular DMU in a specific year with its own performance in other years and with the other DMUs’ performance.
The rest of this paper is structured as follows. A theoretical framework is outlined in Section 2 and research hypotheses are proposed based on that. Section 3 presents empirical methodology and data. Section 4 and Section 5 present empirical results and discussion, respectively. Concluding remarks follow in Section 5.
2. Theoretical Framework
2.1. Effects of Polycentric Development on GUEUL
Over the last few decades, a large literature has been devoted to conceptualizing and empirically investigating polycentricity [18,20,23,26,28]. According to the literature, polycentricity generally refers to coexistence of multiple centers of approximately similar significance in terms of population (employment) or economic power in an area [23,26]. Polycentricity can be defined from two different perspectives [26,28,33,34]: the morphological perspective and the functional perspective. More specifically, an area is considered to be more morphologically polycentric if it exhibits a more even size distribution of centers. By comparison, an area is considered to be more functionally polycentric if it exhibits a more even distribution of functional linkages among centers. Since the data for measuring extent of morphological polycentricity is more readily available, the morphological approach to polycentricity has been employed in a large amount of empirical research [28,31,35].
Polycentric development exerts effects on GUEUL by influencing the creation and accumulation of agglomeration effects, which are further categorized into agglomeration economies and diseconomies [20,23,30,36]. Sharing infrastructures and intermediate input suppliers, more efficient matches between enterprises and factors of production, and knowledge creation and transmission are the primary sources of agglomeration economies, and agglomeration economies positively affect resource utilization efficiency [37]. Agglomeration diseconomies (which take the forms of traffic congestion, environmental pollution, high prices of factors of production, etc.) tend to have a cost-raising effect and can thus adversely impact resource utilization efficiency [29,38,39]. Many scholars suggest that polycentric development contributes to the improvement of resource utilization efficiency, since it can not only promote an increase in agglomeration economies, but also facilitate a decrease in agglomeration diseconomies. However, there are also some researchers who argue that whether polycentric development can facilitate the accumulation of agglomeration economies is conditional on some other factors. The mechanism through which polycentric development affects GUEUL are demonstrated in Figure 1 and analyzed in detail in this section.
Supporters of a more polycentric pattern of urban development suggest that the polycentric spatial structure allows reaping agglomeration economies and, meanwhile, avoids at least some of the agglomeration diseconomies, thus having a positive effect on economic efficiency. It is argued that agglomeration economies have been “regionalized” to a substantial extent owing to the rapid advances in information technologies, communication technologies and transport technologies [15,25,28]. More specifically, positive agglomeration externalities are not restricted by the boundaries of individual cities, but instead can be shared among a cluster of functionally connected cities [28,39,40]. Such “regionalization” of agglomeration economies is related to Alonso’s [41] notion of “borrowed size” which suggests that smaller cities within an urban network can exhibit certain characteristics of a larger-sized city. Based on this concept, many scholars argue that the combined agglomeration economies of a group of functionally linked cities within a polycentric UA can be equal to or even exceed that of a single city of their aggregate size [19,23,25,38,42]. More specifically, enterprises within a polycentric UA can share infrastructures, public facilities, business services and suppliers of intermediate inputs located in different cities. In addition, functional connection between cities facilitates more efficient matching between enterprises and inputs (capital goods, labor, novel production technologies, etc.) within a polycentric UA. These can expand the production possibilities of enterprises and significantly decrease production costs within the polycentric UA, thus resulting in a larger quantity of output with a certain level of resource endowment and improved economic efficiency. While the spatial scope of agglomeration economies is increasingly expanding, agglomeration diseconomies tend to be restricted by the boundaries of individual cities [39,43]. Many researchers suggest that agglomeration diseconomies, such as traffic congestion, high prices of factors of production and exposure to environmental pollution and crime, tend to increase with the size of individual cities [26,40,44,45,46], and smaller cities exhibit higher ability to keep agglomeration diseconomies under control [47]. Since an increase in the extent of polycentricity results in a more even distribution of city sizes within an UA and helps prevent the emergence of excessively large cities, it is reasonable to argue that a more polycentric development pattern can be an effective avenue to reduce negative agglomeration externalities. Some scholars have provided empirical evidence supporting a more polycentric development pattern [23,28].
There are also some scholars who analyze the downsides of a polycentric spatial structure and argue that whether polycentric development can promote an increase in agglomeration economies depends on some other factors [48,49,50]. Meijers et al. [25] argue that the “regionalization” of agglomeration economies is conditional on the functional, institutional and cultural integration of different cities within an UA. When those conditions are not fulfilled, a polycentric development pattern can give rise to a competing relationship (rather than a cooperative and complementary relationship) within an UA, which in turn can result in fragmented efforts by individual cities, redundant construction and lower level of economic efficiency [20,25]. Parr [20] suggested that it is difficult for certain types of agglomeration economies to be “regionalized”. For example, the creation and transmission of knowledge, which is deemed to be a crucial source of agglomeration economies [37], is closely associated with such factors as unplanned interaction, face-to-face communication and informal arrangements, which in turn are highly associated with density and physical proximity. By comparison with a polycentric development pattern, a more monocentric spatial structure can better fulfill the requirement for density and physical proximity. In addition, some scholars argue that a more monocentric UA is more likely to possess high-order infrastructures and public facilities (which is of crucial importance for increasing economic efficiency) than its similar-sized polycentric counterparts. This is due to the fact that local factors still play an essential role in determining presence of high-order infrastructures and facilities, and the principal city in a more monocentric UA are more likely to reach the critical mass to support such functions [21,25].
2.2. Research Hypotheses
As discussed above, it is widely accepted that polycentric development has the potential to improve economic efficiency. However, whether polycentric development can facilitate the accumulation of agglomeration economies may be contingent upon some other factors. Economic development level can be an essential factor influencing the effectiveness of polycentric development in promoting efficiency [49,50,51]. In early phase of economic development, a more concentrated economic geography helps to significantly reduce production costs and transaction costs and facilitate human capital accumulation, since transport and communication infrastructures tend to be scant, and the reach of input markets tends to be limited. By comparison, it can be relatively difficult for a polycentric UA to reap the benefits of positive agglomeration externalities when economic development level is relatively low. As an economy develops, the improvement of infrastructures and the development of market system helps to strengthen the functional connections between cities and facilitate “regionalization” of agglomeration economies, making geographical concentration a less important factor in enhancing efficiency. On the other hand, the advantage of a more dispersed economic geography in reducing agglomeration diseconomies can become more apparent. Thus, a more polycentric development pattern can be more favorable to efficiency improvement from a certain economic development level onwards, and the positive effect of polycentric development on GEE can rise as economic development level increases. As China has entered the middle phase of industrialization around 2005 and urbanization and marketization in China has progressed significantly over the last two decades, it is reasonable to expect that extent of polycentricity is positively linked to GUEUL of UAs in China during the sample period. According to the above analysis, the first and second research hypotheses are proposed.
Hypothesis 1.
Polycentric development positively impacts GUEUL of UAs in China during the sample period.
Hypothesis 2.
The positive impact of polycentric development on GUEUL of UAs increases with economic development level.
3. Methodology and Data
3.1. Empirical Methodology
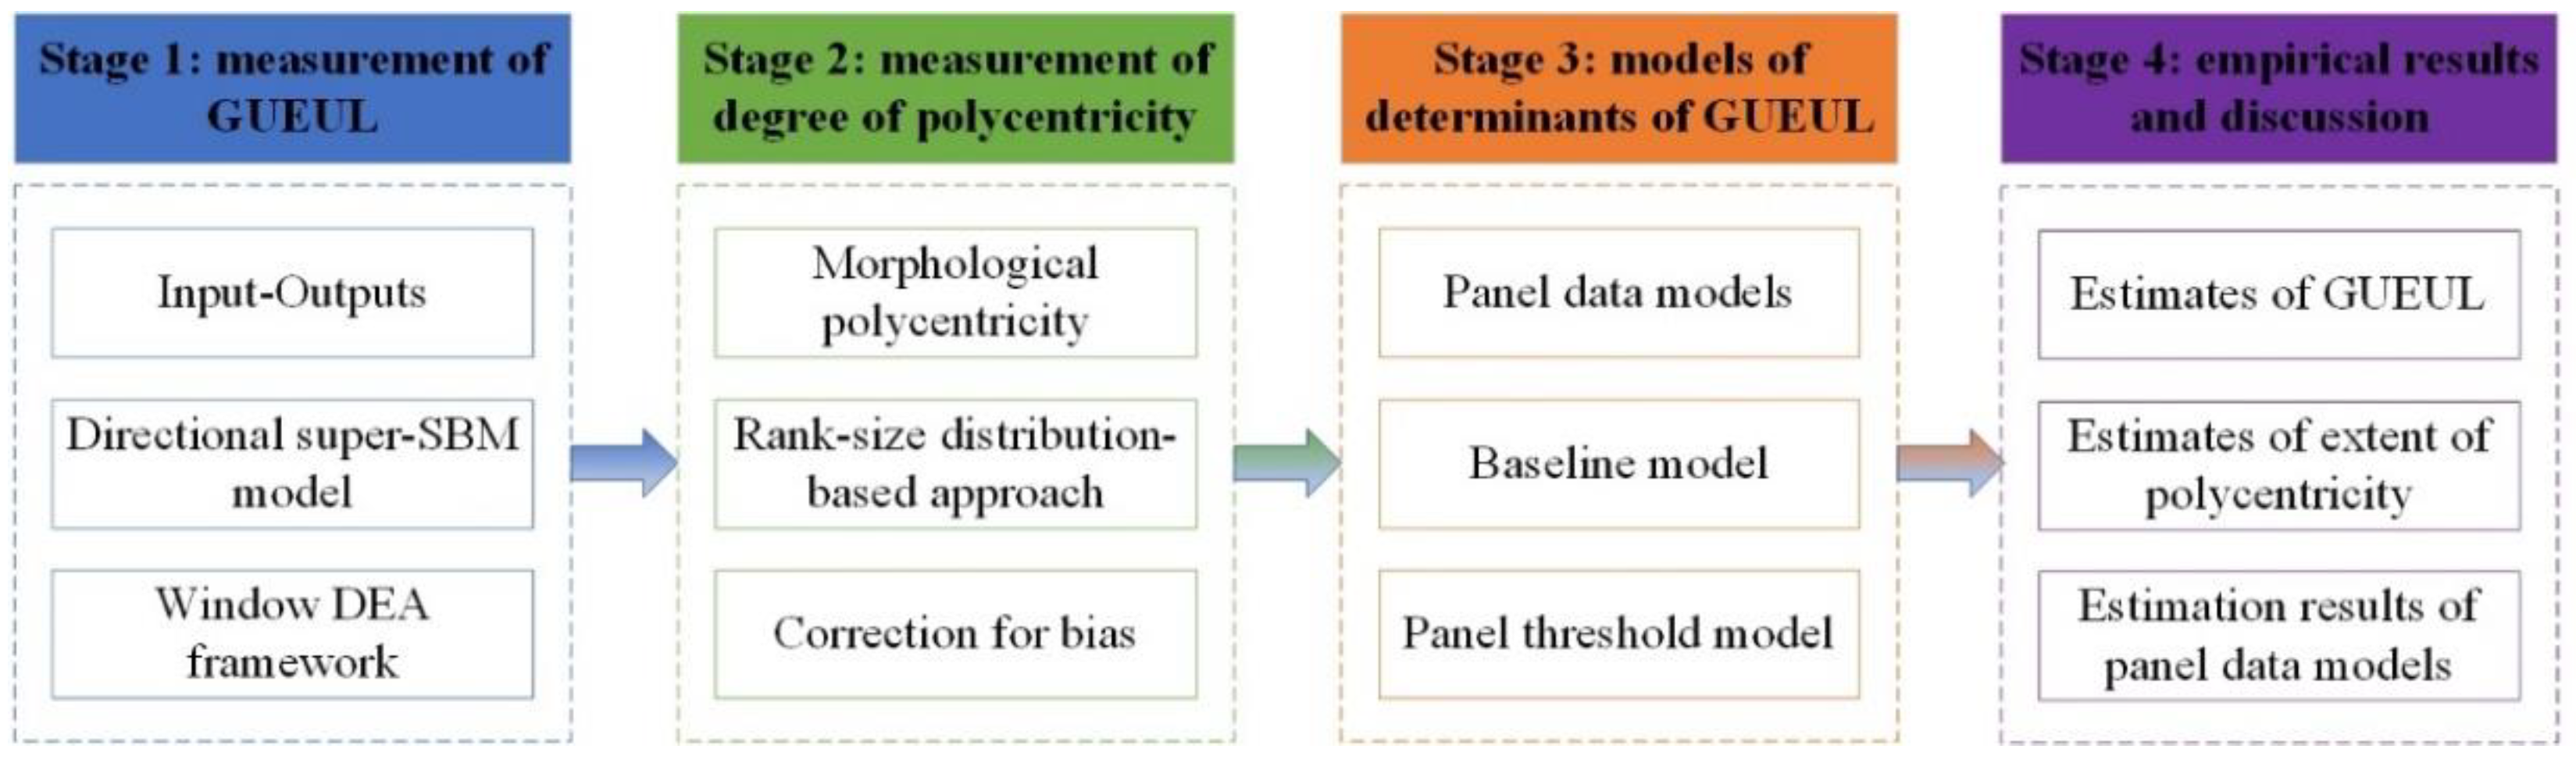
In this study, GUEUL is measured by employing the directional super-SBM model developed under the window DEA framework, and the extent of polycentricity is measured by employing the rank-size distribution-based approach. Linkage between polycentric development and GUEUL is then explored by estimating the models of determinants of GUEUL. In order to test the research hypotheses proposed earlier, both the baseline model and a panel threshold model are estimated. The research process of this study is demonstrated in Figure 2.
3.1.1. The Measurement of GUEUL
There are two issues deserving careful consideration when measuring GUEUL. The first concerns whether a stochastic frontier analysis (SFA) approach or a DEA approach should be employed. The second concerns the treatment of undesirable outputs (i.e., environmental pollutants). Regarding the first issue, most scholars have employed the DEA-based approach to measure GUEUL, since this approach does not require researchers to specify an ad hoc functional form and is capable of handling multiple outputs (including desirable and undesirable outputs) [52,53]. Regarding the second issue, there are generally three approaches to dealing with environmental pollutants: (i) treating environmental pollutants as inputs [54,55]; (ii) applying a monotone transformation to environmental pollutants and then using adapted variables as outputs [56]; (iii) applying the DDF based approach [4]. The first method exhibits obvious shortcomings, since it fails to characterize the actual production process [57]. The second method also has apparent drawbacks, as it is only valid under variable returns to scale as a result of strong convexity constraints [58].
The DDF based approach is used to measure GUEUL in this research. More specifically, the directional super-SBM model developed under the window DEA framework is employed. This approach generates a non-oriented, non-radial efficiency measure which directly handles input and output slack and simultaneously accounts for decline in inputs/undesirable outputs and enlargement of desirable outputs. Another advantage of this approach is that it is capable of distinguishing between efficient DMUs and ranking efficient DMUs, thus avoiding the problem of assigning identical efficiency scores to different DMUs [59,60]. In addition, the window DEA approach is suitable for panel data sets and allows comparison of a specific DMU’s performance in a specific year with its own performance over time and with the other DMUs’ performance [61,62].
Assume that there are K DMUs (which are UAs in this research). Each DMU transforms M inputs, () into N desirable outputs, () and L undesirable outputs, (). denotes DMU k’s input-output vector at period t. The directional slack-based inefficiency measure can be written as:
where denotes DMU o’s input-output vector at period t, is a directional vector that increases the quantity of desirable outputs and decreases the quantity of inputs/undesirable outputs, and is a slack vector concerning inputs and desirable/undesirable outputs. The slack vector has the same units of measurement as the directional vector, allowing the ratios of normalized slacks to be added.
In this research, the measure of desirable output is value added of secondary and tertiary industries. Labor, land and capital are included as inputs. Measure of labor input is quantity of employees in urban sectors, measure of land input is the area of built-up land, and measure of capital input is the capital stock in urban sectors. Emissions of sulfur dioxide, emissions of soot (dust) and industrial wastewater discharge are included as undesirable outputs. Following existing studies, these three indicators of environmental pollution are standardized first, and then synthesized into a composite pollution indicator using an entropy-based approach for ease and accuracy of measurement.
3.1.2. The Measurement of the Degree of Polycentricity
Following most existing studies [29,35,63], the extent of polycentricity is measured from the morphological perspective in this research, since the data for the morphological approach to polycentricity is more readily available. As discussed earlier, the more even the size distribution of centers within an area is, the more morphologically polycentric an area is.
In this research, extent of morphological polycentricity is measured by employing the most widely used rank-size distribution-based approach [28,29,64]. More specifically, the rank-size model generally takes the following forms:
where denotes the natural logarithm, SIZE denotes the size of each principal city within an UA, RANK denotes the rank of each principal city according to their sizes, and is the error term. Since the main focus of this research is on GUEUL, city size is considered from the economic perspective and measured by the scale of economic activities (more specifically, gross regional product). The slope coefficient , also referred to as the Pareto exponent [29,63,65], indicates the extent of morphological polycentricity. The larger the absolute value of the slope coefficient is, and hence the steeper the regression slope is, the more morphologically polycentric an UA is.
In small samples, the estimation of the rank-size model parameters can be biased. Gabaix and Ibragimov [65] provide a simple correction for this bias, i.e., using instead of as the dependent variable of the rank-size model. They have proved that this approach can optimally reduce the small sample bias to a leading order. Thus, modified log-log rank-size regression is employed in this research:
In empirical research, a critical issue concerns the number of cities taken into account (i.e., the sample size) when estimating the size-distribution model. As suggested by Meijers [66] and Brezzi and Veneri [28], the extent of polycentricity is normally judged based on sizes and distribution of only a handful of largest cities. There are mainly three methods for determining the sample size of the size-distribution model [26,66,67]: (i) considering a fixed number of cities; (ii) considering cities whose size (the size of individual city) is above a certain threshold; (iii) considering cities whose combined size accounts for a certain proportion of an area’s total size. The second approach has obvious drawbacks, since there tends to be no one-size-fits-all threshold for all the different areas [34,66]. For example, the principal cities in a relatively small area can be insignificant in a relatively large area. The third approach has apparent shortcomings as well. When employing such an approach, the quantity of cities included would be greater for more polycentric UAs and smaller for more monocentric UAs. Thus, in that case, the number of centers itself would be an indicator of the degree of polycentricity and employing such an indicator twice could introduce a degree of systematic bias [66,67,68]. In addition, the results would be less comparable among different areas. Therefore, it is more appropriate to consider a fixed number of cities when estimating the size-distribution model [31,66]. Following existing studies [28,30], the largest four cities are included in the sample for each UA in this research.
3.1.3. The Models of Determinants of GUEUL
The models of determinants of GUEUL are developed and estimated to explore the association between polycentric development and GUEUL in this subsection. The baseline model is as follows:
where subscripts i and t denote UA i and year t, respectively. X represents a vector of control variables, denotes the UA-specific effect, denotes a vector of year-specific dummy variables, and denotes the idiosyncratic error. In addition to the degree of polycentricity (POL), another independent variable characterizing the spatial structure of UAs, i.e., the degree of agglomeration (AGG), is also included in the model. Following existing studies, the degree of agglomeration is measured using the spatial Gini index:
where represents the number of cities in UA i, and represents average city-level GDP within UA i in year t (calculated as UA i’s GDP in year t divided by ). and denote the economic size of city j and city k within UA i in year t, respectively. While the degree of polycentricity concerns the spatial distribution of economic activity across the principal cities within a UA (i.e., characterizes spatial structure from the monocentricity-polycentricity perspective), the degree of agglomeration concerns the spatial distribution of economic activity across all the cities within a UA (i.e., characterizes spatial structure form the agglomeration-dispersion perspective). The degree of agglomeration is expected to be positively linked to GUEUL. Since the efficiency scores measured by using directional super-SBM model can be greater than 1 and there is no upper limit on the explained variable of model (4) (in other words, the explained variable is not censored), there is no need to employ the Tobit regression model. All independent variables are lagged by 1 year to alleviate potential endogeneity problem. The control variables are selected according to existing research on the determinants of GUEUL [11,12,13].
PCGDP is per capita GDP, which is an indicator of economic development level. As an economy develops, human capital accumulates, market system matures, and infrastructure tends to improve. Thus, the level of economic development is expected to positively impact GUEUL.
FDI is ratio of quantity of foreign capital utilized to GDP, which is a measure of inward FDI intensity. Inward FDI can bring superior managerial skills and advanced technologies to host countries through forward and backward linkages, employee training and technology transfer [69,70]. Thus, UAs with higher inward FDI intensity are expected to exhibit higher GUEUL.
GEXP is the ratio of local governments’ budgetary expenditure to GDP, which is a measure of degree of government intervention in economic activities. There is a theoretical debate on the impact of government intervention on resource utilization efficiency. Some scholars argue that as a result of governments’ information problems and multiplicity of objectives, government intervention can lead to resource misallocation and negatively impacts resource utilization efficiency [71]. Other scholars argue that government intervention helps to rectify market failure (externalities, information asymmetry, etc.) and thus can positively impact resource utilization efficiency [72].
STEXP is the proportion of expenditure on science and technology in local governments’ budgetary expenditure, which is a measure of the intensity of government investment in science and technology. Scientific research and technology upgrading plays a crucial role in expanding production possibilities and lowering production cost. Thus, the intensity of government investment in science and technology is expected to positively impact GUEUL.
In order to explore the nonlinear characteristics of the impact of polycentric development on GUEUL, a panel threshold model is further developed in this research [73]. The panel threshold model approach allows for heterogeneous regression coefficients and is widely employed to investigate nonlinear relationships between variables. The approach specifies that observations can be grouped into different regimes based on the value of the threshold variable, and the slope coefficients on the independent variables can vary across different regimes. In this study, the panel threshold model of determinants of GUEUL takes the following form:
where PCGDP is the threshold variable, is the specific estimated threshold value, and is the indicator function (it takes the value 1 when the expression in the parentheses holds, otherwise it takes the value 0). Since the main focus of this research is on the impacts of spatial structure on GUEUL, the slope coefficients on the two variables characterizing the spatial structure (i.e., POL and AGG) are allowed to switch between regimes. As suggested by Hansen [73], the least-squares approach is used to estimate the threshold parameters, the bootstrap approach is employed to test statistical significance of the threshold effect, and asymptotic distribution theory is employed to construct confidence intervals for threshold parameters. In empirical analysis, the following procedure can be used to determine the number of thresholds. The hypothesis of no threshold is tested at first. If it is rejected, then the hypothesis of two thresholds is tested. Continue until the hypothesis of a higher-order threshold can no longer be rejected.
3.2. Study Area and Data
3.2.1. Study Area
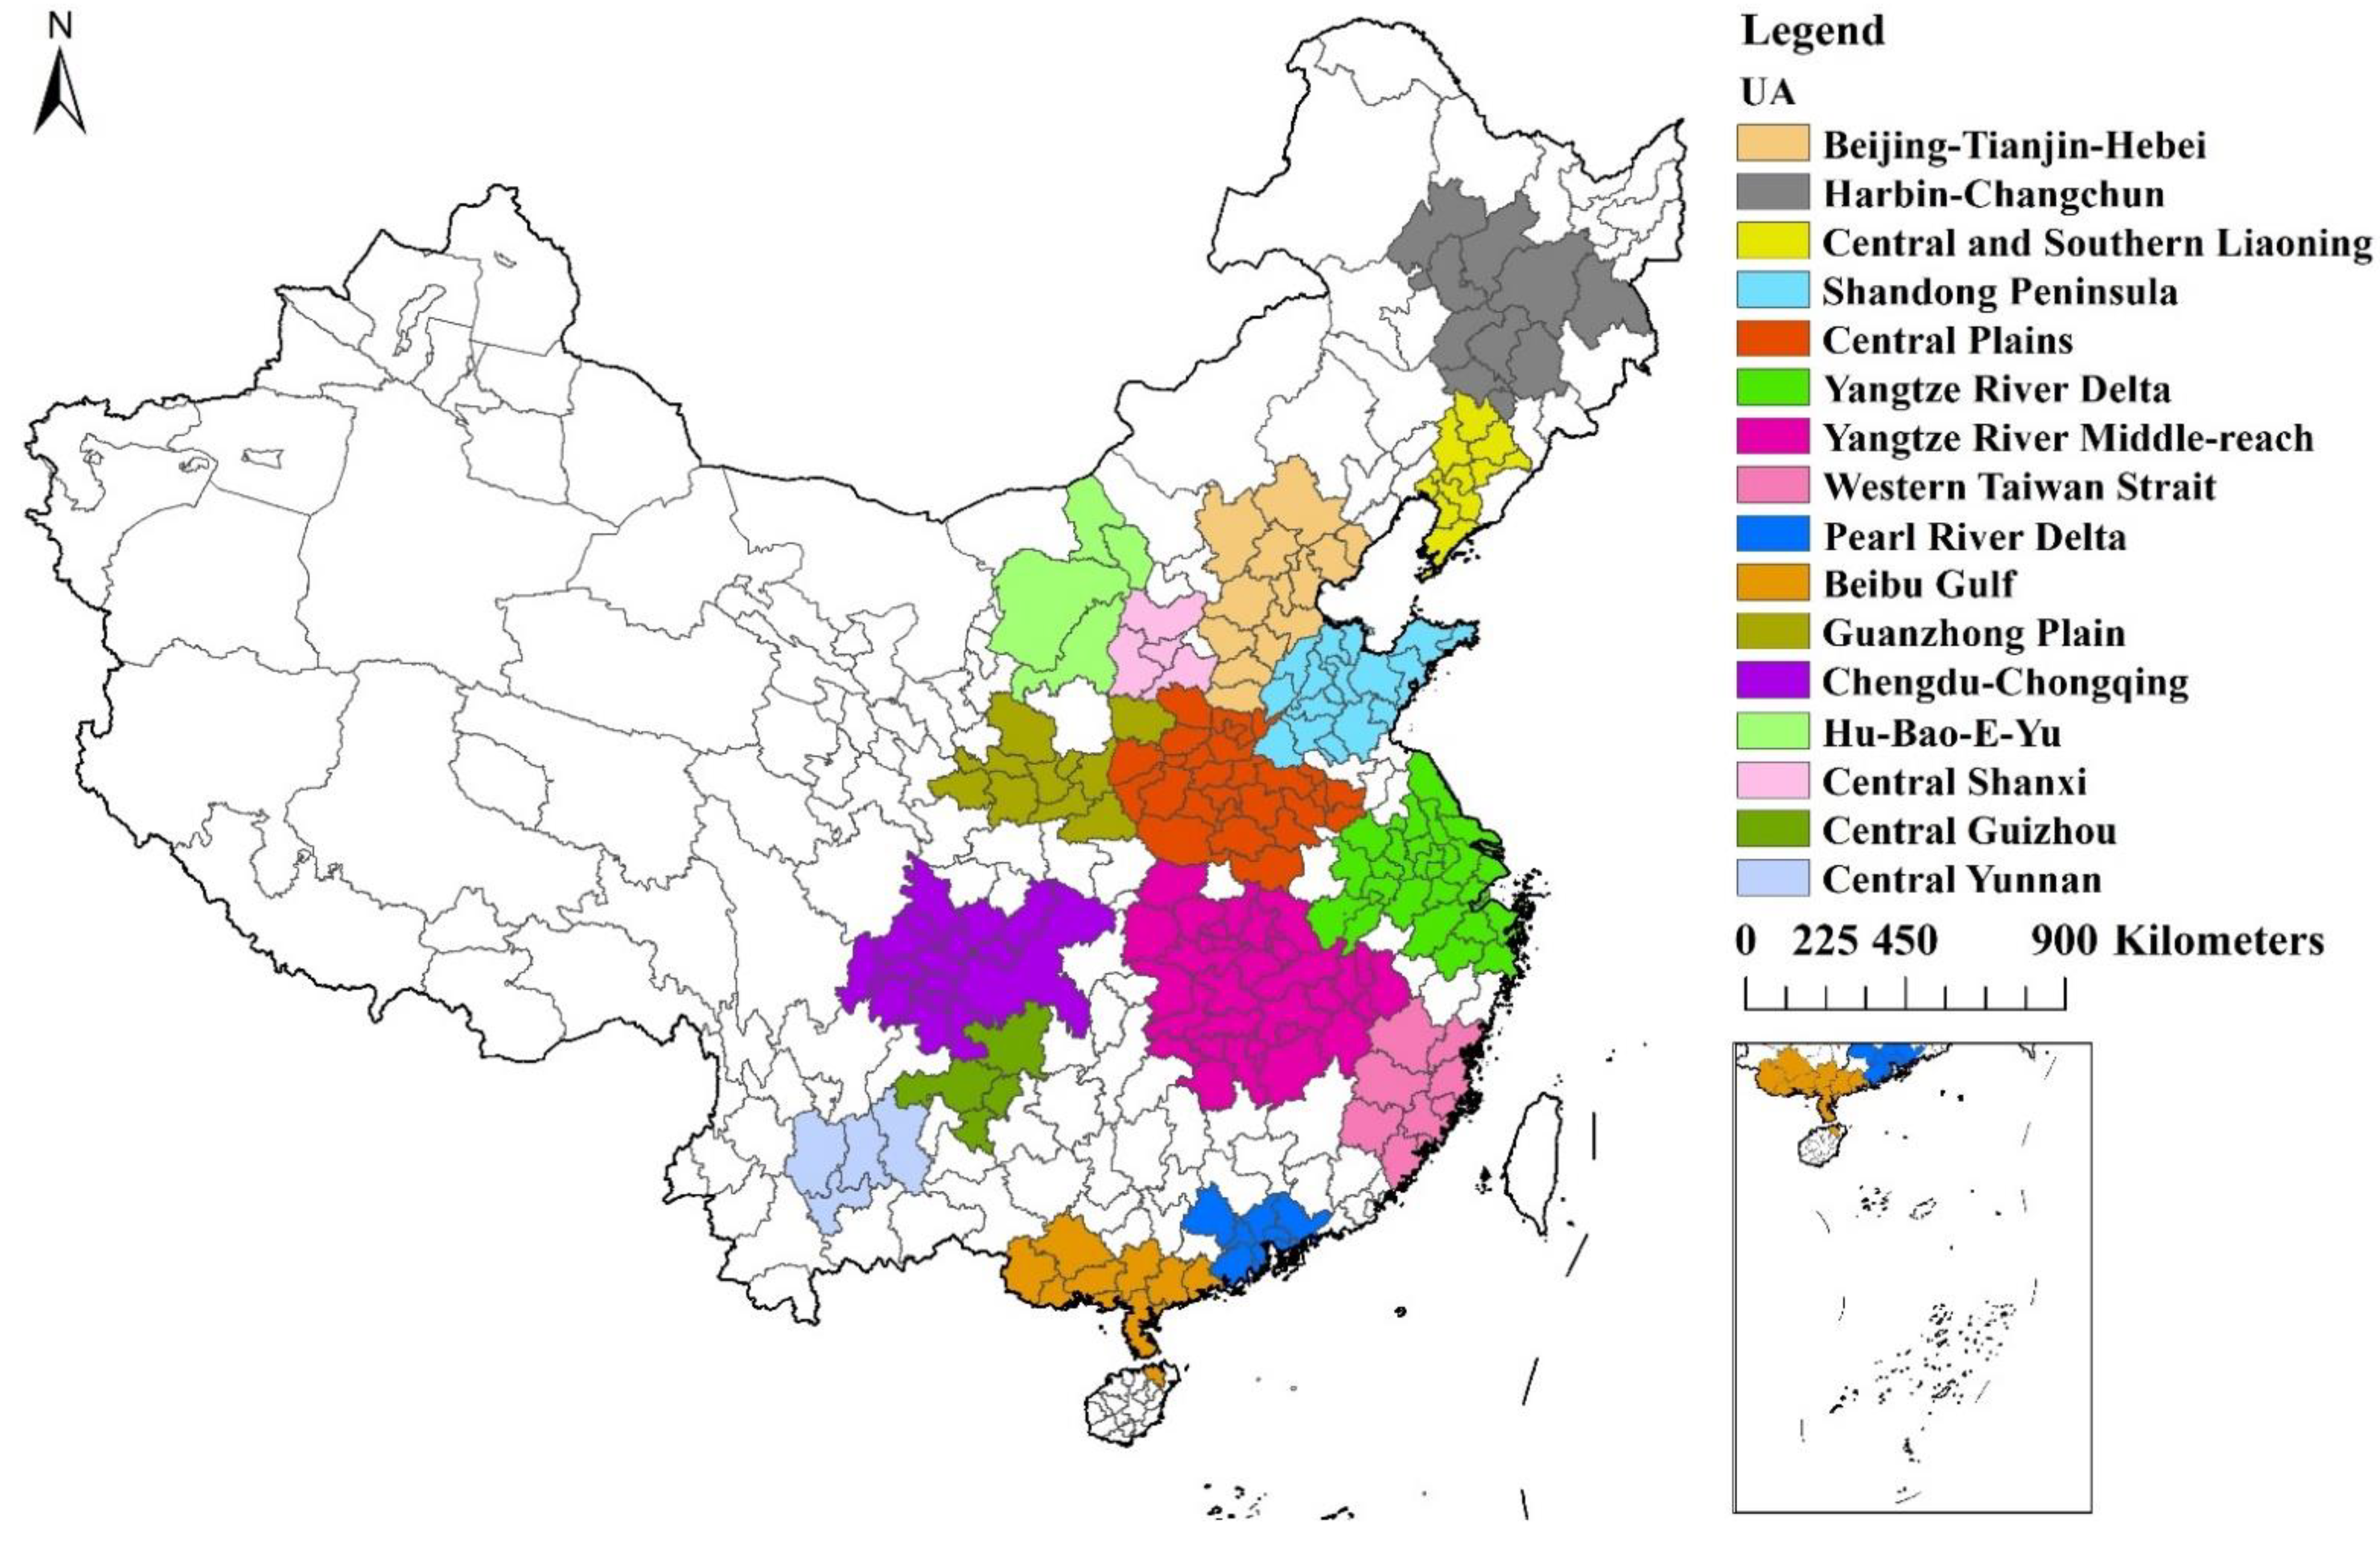
Development of UAs has been the main focus of China’s “new-type” urbanization which aims at achieving more sustainable and people-oriented urbanization [17]. Following existing studies [27], this research focuses on 16 major UAs in China which cover a total of 198 cities. These UAs are all stressed in “National Major Function-oriented Zone Planning” of China. The locations of the study area are demonstrated in Figure 3.
3.2.2. Data
Data on the value added of secondary and tertiary industries, quantity of employees in urban sectors, and quantities of emissions of sulfur dioxide, emissions of soot (dust) and industrial wastewater discharge are sourced from China Urban Statistical Yearbook Series. Following existing studies [45,74], the capital stock in urban sectors is measured by employing the perpetual inventory method based on the estimates of Zhang et al. [75]. Data on quantity of built-up land are sourced from China Urban Construction Statistical Yearbook Series. Data on gross regional product, quantity of foreign capital utilized, and local governments’ budgetary expenditure are collected from China Urban Statistical Yearbook Series. The definition of variables and their summary statistics are shown in Table 1.
4. Results
4.1. Estimates of GUEUL and Extent of Polycentricity
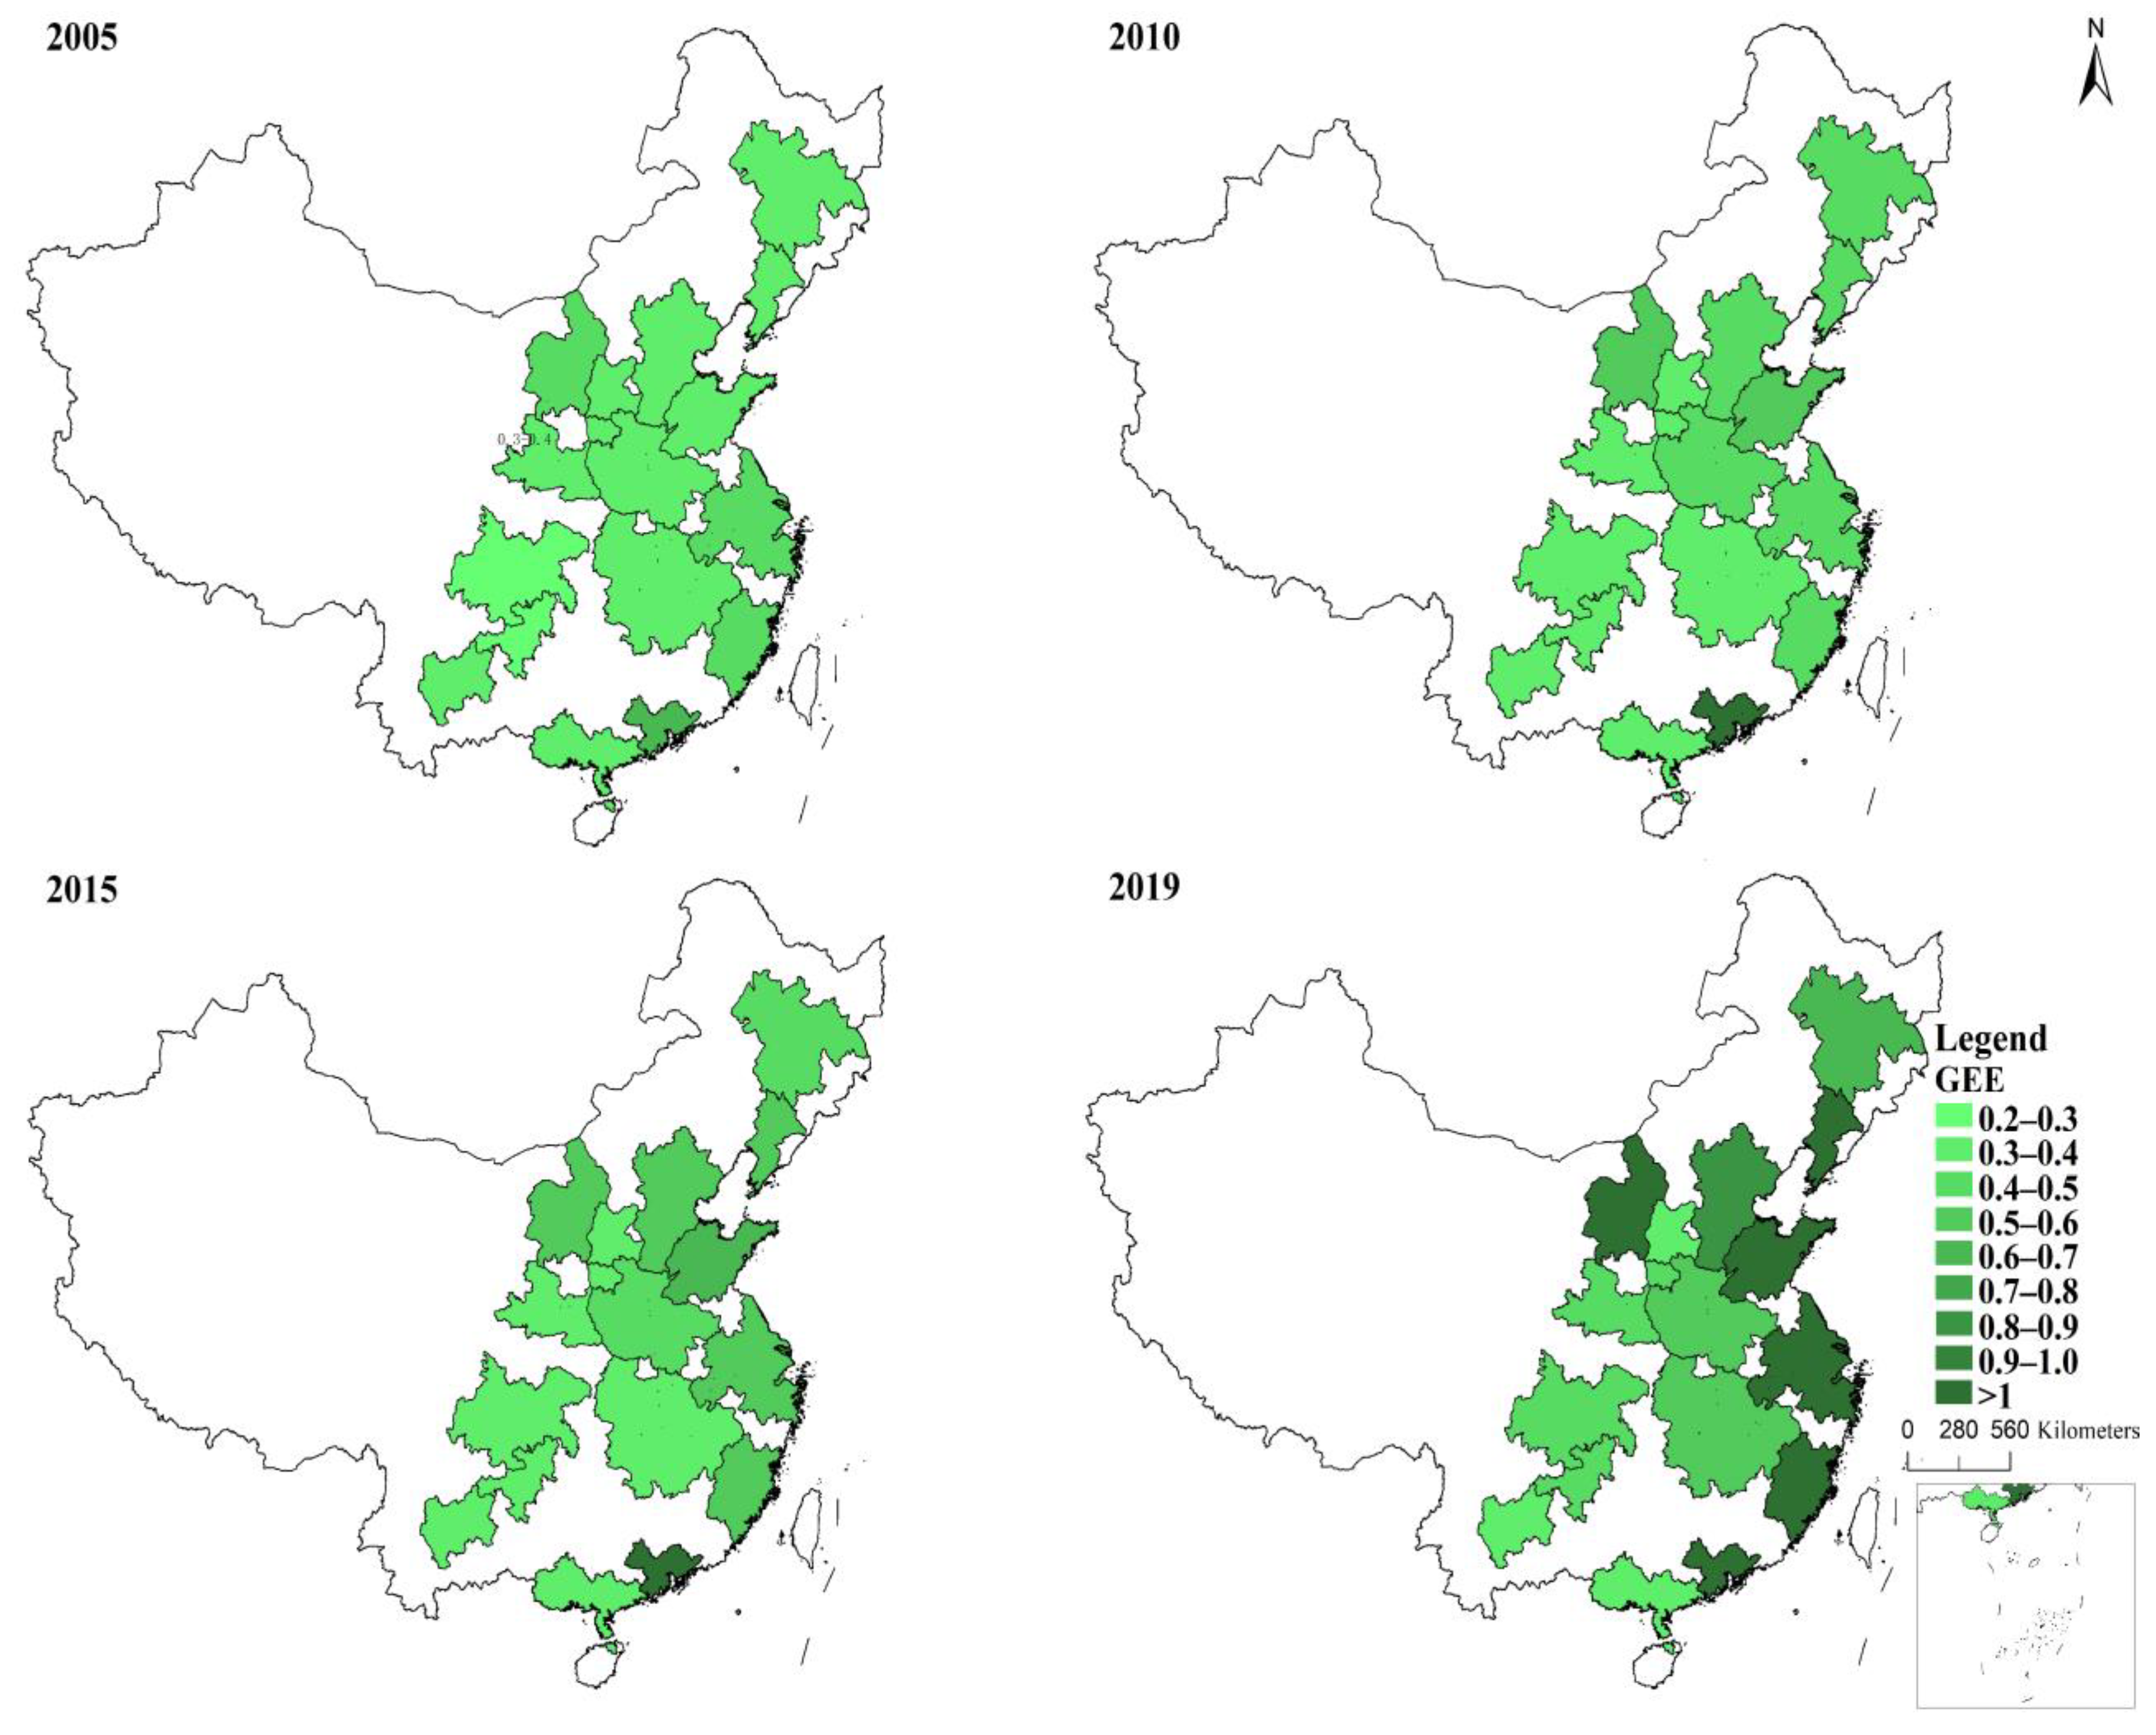
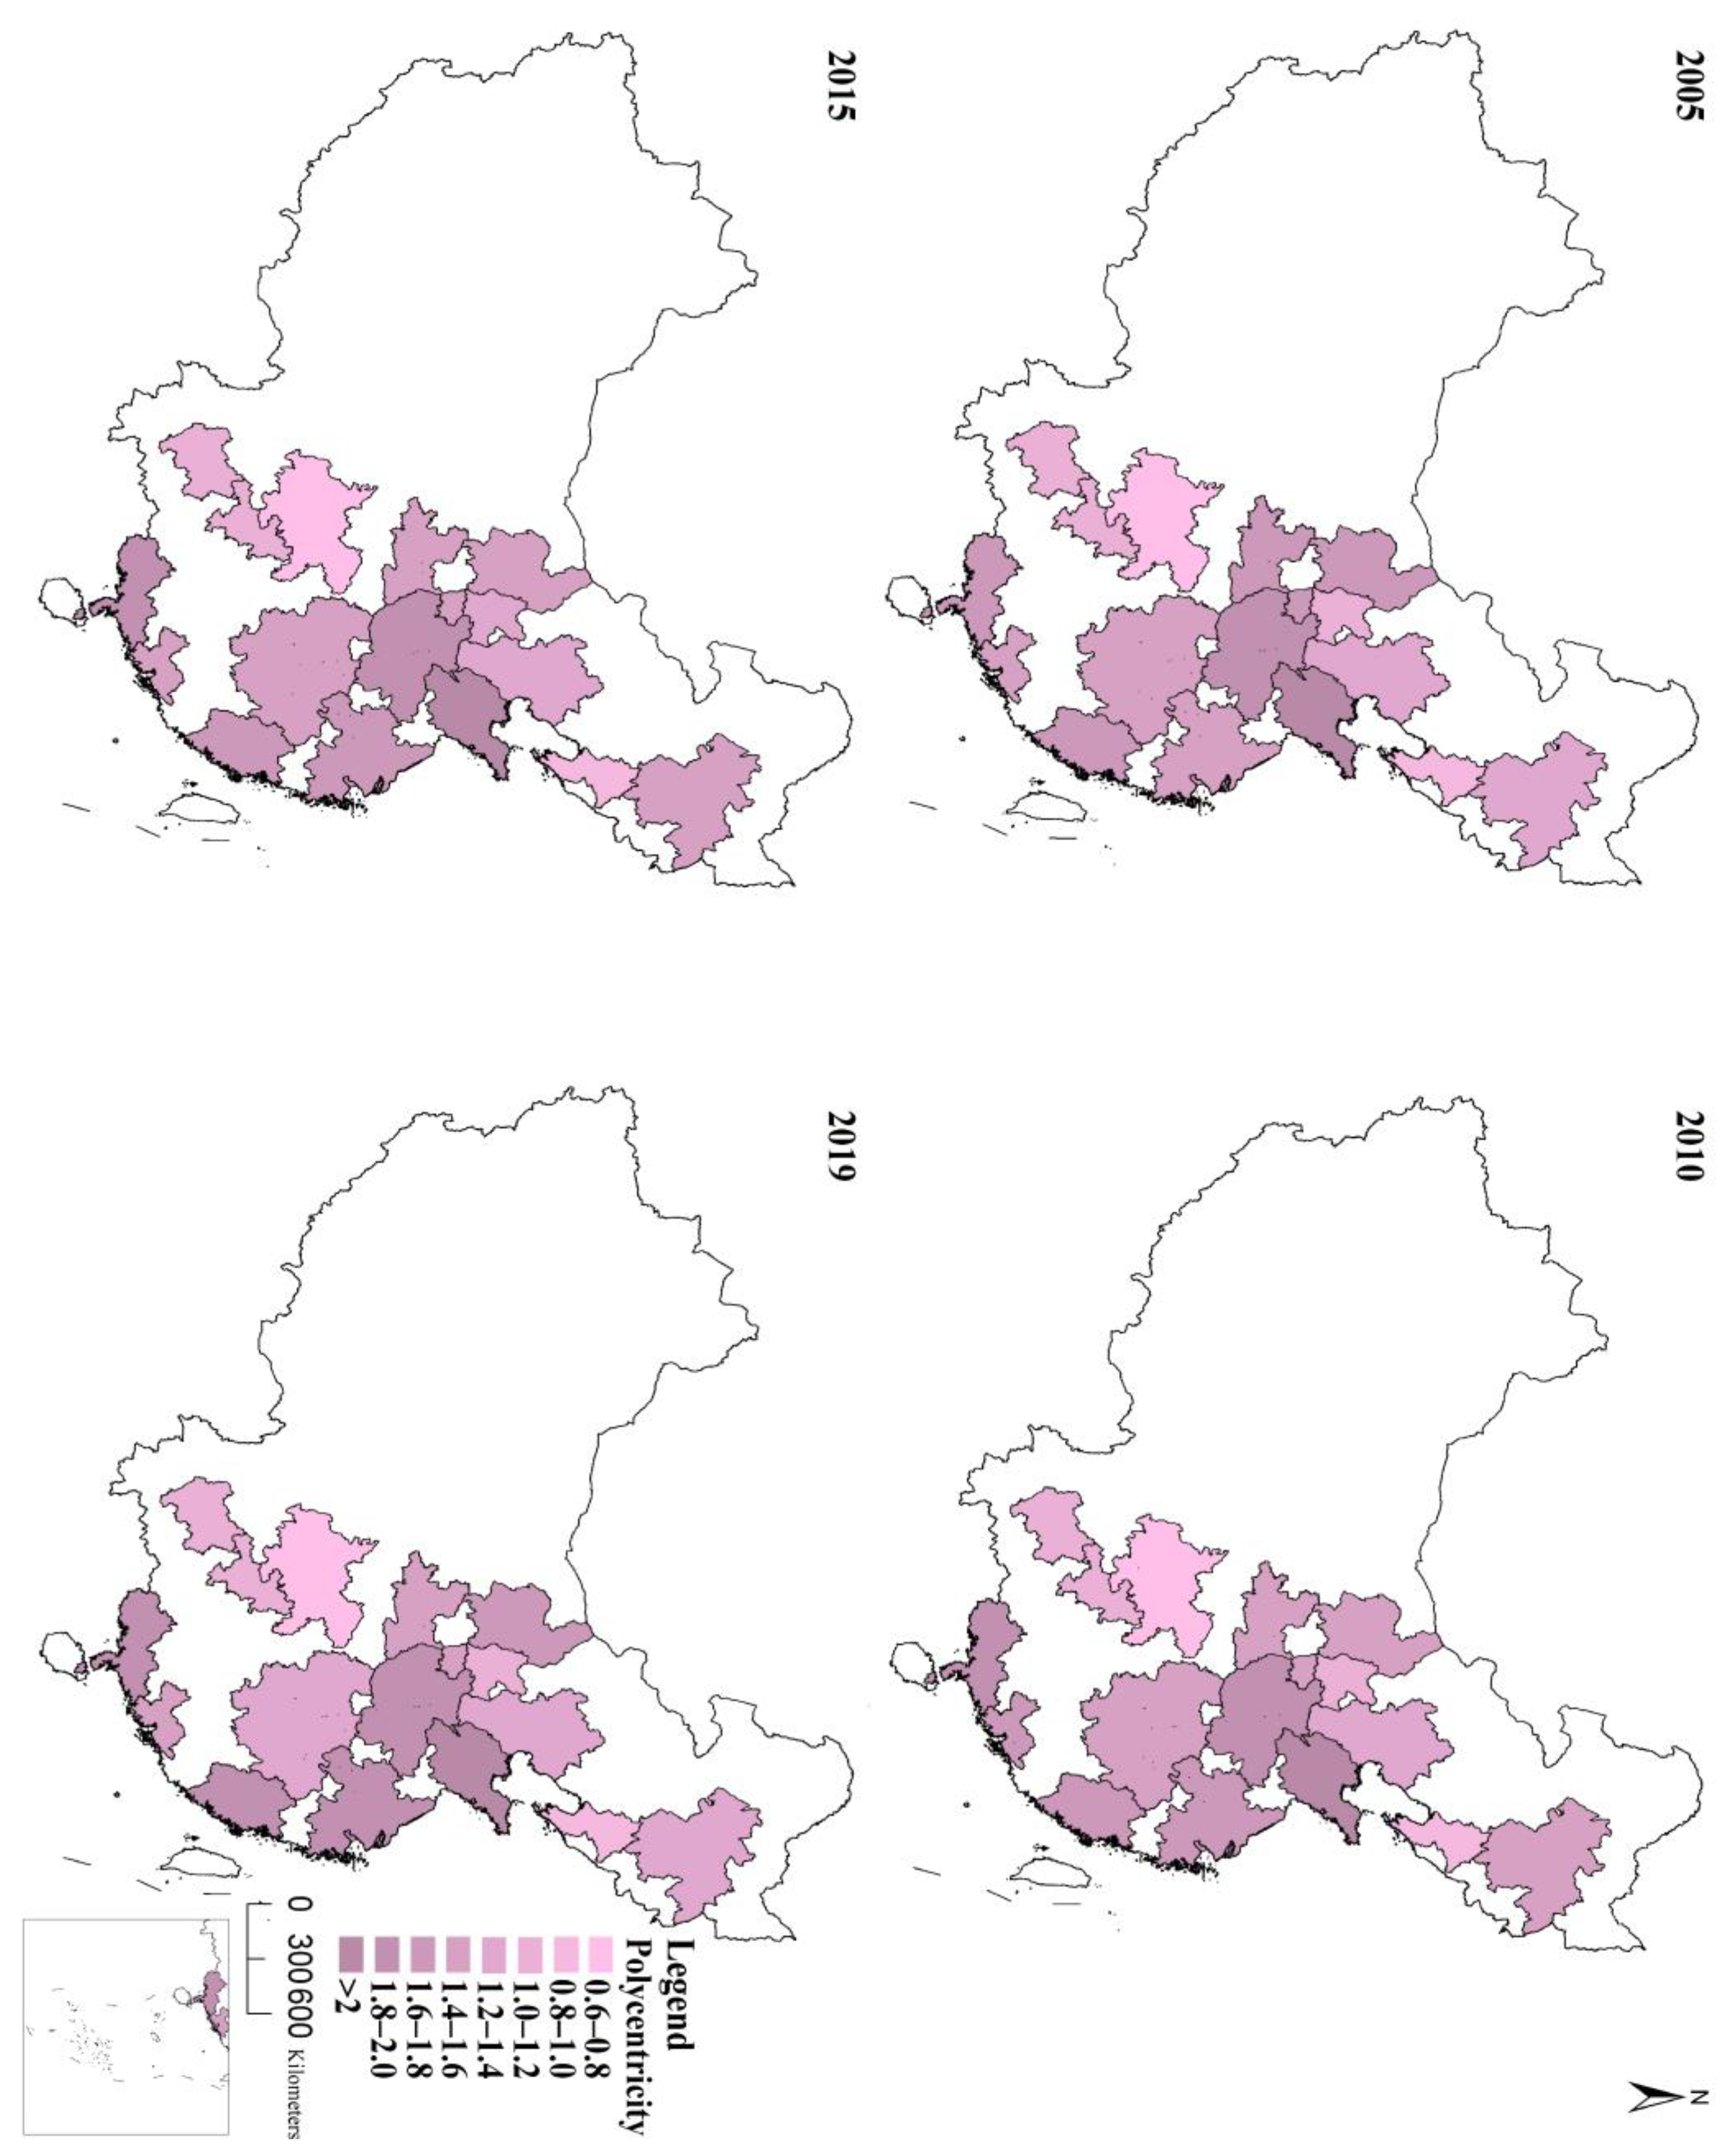
GUEUL and the extent of polycentricity for the sample UAs for selected years are shown in Figure 4 and Figure 5, respectively. GUEUL shows a clear increasing trend during the period 2005–2019, with average GUEUL of the sample UAs rising considerably from 0.384 in 2005 to 0.715 in 2019. In addition, GUEUL varies noticeably across UAs, with UAs in eastern China exhibiting relatively higher GUEUL. In 2005, Pearl River Delta UA (0.656) and Western Taiwan Strait UA (0.488) are at the top of the list of most efficient UAs, followed by Yangtze River Delta UA (0.423), Hu-Bao-E-Yu UA (0.406) and Shandong Peninsula UA (0.400). By comparison, Chengdu-Chongqing UA (0.292) and Central Guizhou UA (0.272) exhibit relatively low GEE. In 2019, Yangtze River Delta UA (1.048) and Pearl River Delta UA (1.030) exhibit the highest GUEUL, followed by Hu-Bao-E-Yu UA (1.019), Shandong Peninsula UA (1.013) and Western Taiwan Strait UA (1.012). By contrast, Beibu Gulf UA (0.391) and Central Shanxi UA (0.353) exhibit relatively low GUEUL. As demonstrated in Figure 5, there are also significant variations in the extent of polycentricity across UAs. In 2005, Shandong Peninsula UA (3.305) and Central Plains UA (1.870) are at the top of the list of most polycentric UAs, followed by Beibu Gulf UA (1.798), Guanzhong Plain UA (1.649) and Pearl River Delta UA (1.591). By comparison, Central and Southern Liaoning UA (0.939) and Chengdu-Chongqing UA (0.746) can be characterized as the most monocentric UAs. In 2019, Shandong Peninsula UA (3.239) and Central Plains UA (2.010) still exhibit the highest degree of polycentricity, followed by Beibu Gulf UA (2.005), Yangtze River Delta UA (1.847) and Western Taiwan Strait UA (1.808). By contrast, Central and Southern Liaoning UA (0.948) and Chengdu-Chongqing UA (0.698) exhibit the lowest degree of polycentricity.
4.2. Estimation Results of Models of Determinants of GUEUL
Estimation results of the baseline model of determinants of GUEUL are shown in Table 2. Results of pooled OLS estimation, fixed-effects estimation and random-effects estimation are presented in column (1), column (2) and column (3), respectively. Since Hausman specification test rejects random-effects specification (Chisq = 17.83, p value = 0.01), fixed-effects specification is preferred, and the following analysis is based on that specification. Of primary interest is the coefficient on the variable indicating the degree of polycentricity (POL), which has a positive sign and is statistically significant. Hence, the hypothesis that polycentric development positively impacts GUEUL of major UAs in China during the sample period (Hypothesis 1) is supported by the estimation results. Another variable characterizing the spatial structure, i.e., the degree of agglomeration (AGG), positively impact GUEUL as well. Economic development level is positively associated with GUEUL. A 10,000-CNY rise in per capita GDP leads to a 0.103-unit rise in GUEUL. The intensity of government investment in science and technology is positively related to GUEUL. A 1-percentage-point increase in the proportion of expenditure on science and technology in local governments’ budgetary expenditure results in a 0.04-unit rise in GUEUL.
In the next step, the panel threshold model of determinants of GUEUL is estimated. As shown in Table 3, the single threshold effect is statistically significant (p-value being 0.030), and the double threshold effect is not statistically significant. The estimate of the threshold value is 8.925 (as shown in Table 4). Thus, a single threshold model is estimated, and estimation results are presented in Table 5. The effect of polycentric development on GUEUL exhibits nonlinear characteristics and tends to increase with economic development level (Hypothesis 2). When per capita GDP is lower than 89,250 CNY, a one-unit rise in the degree of polycentricity leads to a 0.253-unit rise in GUEUL; when per capita GDP is higher than 89,250 CNY, a one-unit rise in the degree of polycentricity results in a 0.348-unit rise in GUEUL. As discussed previously, as an economy develops, infrastructure tends to improve and market system tends to mature, facilitating the “regionalization” of agglomeration economies. In addition, the advantage of a more polycentric development pattern in reducing agglomeration diseconomies can become more apparent. The positive effect of the degree of agglomeration on GUEUL decreases with economic development level (when GDP per capita is lower than 89,250 CNY, the coefficient on AGG is 1.109; when GDP per capita is higher than 89,250 CNY, the coefficient on AGG is 0.584), suggesting a declining importance of geographical concentration in enhancing resource utilization efficiency (consistent with the view that geographical agglomeration can be substituted by network connections [15]).
5. Discussion
The empirical results of this research add to the growing literature concerning the effectiveness of polycentric development in improving resource utilization efficiency and promoting environmental sustainability. While much previous research finds that there exists a positive linkage between the degree of polycentricity and labor productivity [28,29,31], this study provides evidence that polycentric development can improve GUEUL, which takes into account environmental pollutants and is deemed to be a more accurate and comprehensive measure of urban land use efficiency. Thus, empirical evidence supports the view that polycentric development can be a useful tool for promoting superior resource utilization efficiency, when infrastructures and functioning market systems are well developed and the prerequisites for the “regionalization” of agglomeration economies are fulfilled. The nonlinear characteristics of the impacts of spatial structure on GUEUL found in this research have important policy implications. Firstly, since the empirical results suggest that effect of polycentric development on GUEUL of UAs rises with economic development level, it can be more beneficial for UAs undergoing rapid economic growth to apply polycentric development strategies. Secondly, given the declining importance of geographical concentration in enhancing resource utilization efficiency, planners and policy makers should pay attention to not only agglomeration economies but also negative agglomeration externalities.
Since a UA covers multiple cities and many socio-economic polices must be coordinated across administrative boundaries, there is a need to foster cooperation at the regional level so as to generate the desirable effects summarized as “a polycentric UA being more than the sum of the parts”. First, it is vital to facilitate the formation of complementarity between different cities within a UA. Complementarity refers to a situation in which individual cities within a UA perform different economic roles (specializing in manufacturing, financial services, transport services, etc.) and host different urban facilities (educational facilities, cultural facilities, medical facilities, etc.), and each city provides services for other cities within the UA (not only for the city itself). On the one hand, complementarity allows individual cities to concentrate their efforts on core activities (i.e., attain a higher level of specialization) and obtain access to a larger market, thus leading to improved resource utilization efficiency of individual cities. Citizens and enterprises within a UA can also benefit by choosing from a more diverse set of urban facilities and services. On the other hand, complementarity helps avoid multiplication of efforts or fragmented efforts by individual cities, thus reducing disorderly competitions within a UA. Second, it is essential to strengthen the connections between different cities within a UA through infrastructure development. This can assist the movement of factors of production and substantially decrease transport costs and commuting costs, thus improving allocative efficiency and enhancing resource utilization efficiency. Since investment in infrastructure is subject to indivisibilities and economies of scale, individual cities need to cooperate closely in infrastructure provision. However, as suggested by Parr [20], this type of cooperation can only be sustained when the allocation of benefits among different cities is broadly in conformity with corresponding allocation of costs. Third, individual cities within a UA need not only to be physically linked through infrastructure, but also to be institutionally, socially and culturally connected, and it is important to build a sense of identity among different cities. In addition, resolving many urban problems or challenges requires the participation of multiple stakeholders in public and private sectors and is increasingly achieved through a governance mode [19].
6. Conclusions
In the context of increasing environmental and resource constraints and rising environmental awareness around the globe, “green growth” is widely acknowledged as a more inclusive and sustainable development paradigm, and the measurement and determinants of GUEUL is currently the subject of a rapidly expanding literature. In the era of a widening geographical scope of economic processes due to rapid technical advance, UA is increasingly being treated as the unit of analysis in research on resource utilization efficiency. This research contributes to the literature concerning determinants of GUEUL by paying attention to the effects exerted by spatial structure. More specifically, this research examines impacts of polycentric development on GUEUL of UAs, using data for major UAs in China covering the period between 2005 and 2019. GUEUL is measured by employing directional super-SBM model, and extent of polycentricity is measured by employing the rank-size distribution-based approach. It is found that GUEUL shows a clear rising trend during the sample period. There are significant variations in GUEUL and the degree of polycentricity across UAs. The association between polycentric development and GUEUL is examined by estimating models of determinants of GUEUL, and the nonlinear characteristics of the relationship are investigated by employing the panel threshold model approach. The results suggest that polycentric development positively impacts GUEUL, and such effect rises with economic development level. In addition, degree of agglomeration, economic development level and intensity of government investment in science and technology is found to be positively linked to GUEUL.
This research employs socio-economic data to characterize spatial structure. It is worth noting that researchers with different disciplinary background or in different subject areas employ different methodological approaches and different types of data to explore spatial structure. For example, many researchers have employed landscape data to characterizing spatial structure. Future research can explore the effects of spatial structure on GUEUL based on other spatial metrics and other types of data. There is an increasing trend in urban and regional studies to employ the social network analysis approach to examine the connections between different cities within a UA based on various types of flow data (data on goods flow, commuting flow, capital flow, information flow, knowledge flow, etc.), and many scholars argue that there can be interaction effects between the strength of connections within a UA and the spatial structure of a UA in determining resource utilization efficiency. As data technologies advance and more flow data becomes available, it is interesting to explore such interaction effects and investigate whether the effects of spatial structure on resource utilization efficiency are contingent on the strength of connections within a UA. In addition, since it is widely recognized that deepening market integration helps improve allocative efficiency and enhance resource utilization efficiency, efforts can be made to measure extent of market integration and explore its impact on GUEUL.
Author Contributions
Conceptualization, S.Y.; Methodology, S.Y. and J.W.; Software, S.Y.; Validation, S.Y. and J.W.; Formal Analysis, S.Y.; Investigation, S.Y. and J.W.; Resources, J.W.; Data Curation, S.Y.; Writing—Original Draft Preparation, S.Y.; Writing—Review & Editing, J.W.; Visualization, S.Y.; Supervision, S.Y.; Project Administration, S.Y.; Funding Acquisition, S.Y. All authors have read and agreed to the published version of the manuscript.
Funding
This research was funded by the National Social Science Fund of China, grant number 21CGL058.
Institutional Review Board Statement
Not applicable.
Informed Consent Statement
Not applicable.
Data Availability Statement
The data presented in this study are available on request from the corresponding author.
Conflicts of Interest
The authors declare no conflict of interest.
References
- Hickel, J.; Kallis, G. Is Green Growth Possible? New Polit. Econ. 2020, 25, 469–486. [Google Scholar] [CrossRef]
- Jänicke, M. “Green growth”: From a growing eco-industry to economic sustainability. Energy Policy 2012, 48, 13–21. [Google Scholar] [CrossRef]
- Reilly, J.M. Green growth and the efficient use of natural resources. Energy Econ. 2012, 34, 85–93. [Google Scholar] [CrossRef] [Green Version]
- Ma, L.; Long, H.; Chen, K.; Tu, S.; Zhang, Y.; Liao, L. Green growth efficiency of Chinese cities and its spatio-temporal pattern. Resour. Conserv. Recycl. 2019, 146, 441–451. [Google Scholar] [CrossRef]
- Tang, Y.; Wang, K.; Ji, X.; Xu, H.; Xiao, Y. Assessment and spatial-temporal evolution analysis of urban land use efficiency under green development orientation: Case of the yangtze river delta urban agglomerations. Land 2021, 10, 715. [Google Scholar] [CrossRef]
- Chen, W.; Ning, S.; Chen, W.; Liu, E.-N.; Wang, Y.; Zhao, M. Spatial-temporal characteristics of industrial land green efficiency in China: Evidence from prefecture-level cities. Ecol. Indic. 2020, 113, 106256. [Google Scholar] [CrossRef]
- Zhu, X.; Zhang, P.; Wei, Y.; Li, Y.; Zhao, H. Measuring the efficiency and driving factors of urban land use based on the DEA method and the PLS-SEM model—A case study of 35 large and medium-sized cities in China. Sustain. Cities Soc. 2019, 50, 101646. [Google Scholar] [CrossRef]
- Xie, H.; Chen, Q.; Lu, F.; Wang, W.; Yao, G.; Yu, J. Spatial-temporal disparities and influencing factors of total-factor green use efficiency of industrial land in China. J. Clean. Prod. 2019, 207, 1047–1058. [Google Scholar] [CrossRef]
- Wang, A.; Lin, W.; Liu, B.; Wang, H.; Xu, H. Does smart city construction improve the green utilization efficiency of urban land? Land 2021, 10, 657. [Google Scholar] [CrossRef]
- Lu, X.; Kuang, B.; Li, J. Regional difference decomposition and policy implications of China’s urban land use efficiency under the environmental restriction. Habitat Int. 2018, 77, 32–39. [Google Scholar] [CrossRef]
- Chatzimentor, A.; Apostolopoulou, E.; Mazaris, A.D. A review of green infrastructure research in Europe: Challenges and opportunities. Landsc. Urban Plan. 2020, 198, 103775. [Google Scholar] [CrossRef]
- Tzoulas, K.; Korpela, K.; Venn, S.; Yli-Pelkonen, V.; Kaźmierczak, A.; Niemela, J.; James, P. Promoting ecosystem and human health in urban areas using Green Infrastructure: A literature review. Landsc. Urban Plan. 2007, 81, 167–178. [Google Scholar] [CrossRef] [Green Version]
- Demuzere, M.; Orru, K.; Heidrich, O.; Olazabal, E.; Geneletti, D.; Orru, H.; Bhave, A.G.; Mittal, N.; Feliu, E.; Faehnle, M. Mitigating and adapting to climate change: Multi-functional and multi-scale assessment of green urban infrastructure. J. Environ. Manag. 2014, 146, 107–115. [Google Scholar] [CrossRef] [PubMed]
- Kati, V.; Jari, N. Bottom-up thinking—Identifying socio-cultural values of ecosystem services in local blue-green infrastructure planning in Helsinki, Finland. Land Use Policy 2016, 50, 537–547. [Google Scholar] [CrossRef]
- Burger, M.J.; Meijers, E.J. Agglomerations and the rise of urban network externalities. Pap. Reg. Sci. 2016, 95, 5–15. [Google Scholar] [CrossRef]
- van Oort, F.; Burger, M.; Raspe, O. On the economic foundation of the Urban network paradigm: Spatial integration, functional integration and economic complementarities within the Dutch Randstad. Urban Stud. 2010, 47, 725–748. [Google Scholar] [CrossRef] [Green Version]
- Fang, C.; Yu, D. Urban agglomeration: An evolving concept of an emerging phenomenon. Landsc. Urban Plan. 2017, 162, 126–136. [Google Scholar] [CrossRef]
- Kloosterman, R.C.; Musterd, S. The polycentric urban region: Towards a research agenda. Urban Stud. 2001, 38, 623–633. [Google Scholar] [CrossRef]
- Meijers, E. Polycentric urban regions and the quest for synergy: Is a network of cities more than the sum of the parts? Urban Stud. 2005, 42, 765–781. [Google Scholar] [CrossRef]
- Parr, J.B. The polycentric urban region: A closer inspection. Reg. Stud. 2004, 38, 231–240. [Google Scholar] [CrossRef]
- Meijers, E. Summing small cities does not make a large city: Polycentric urban regions and the provision of cultural, leisure and sports amenities. Urban Stud. 2008, 45, 2323–2342. [Google Scholar] [CrossRef]
- Zheng, S.; Du, R. How does urban agglomeration integration promote entrepreneurship in China? Evidence from regional human capital spillovers and market integration. Cities 2020, 97, 102529. [Google Scholar] [CrossRef]
- Wang, M.; Derudder, B.; Liu, X. Polycentric urban development and economic productivity in China: A multiscalar analysis. Environ. Plan. A 2019, 51, 1622–1643. [Google Scholar] [CrossRef]
- Florida, R.; Gulden, T.; Mellander, C. The rise of the mega-region. Camb. J. Reg. Econ. Soc. 2008, 1, 459–476. [Google Scholar] [CrossRef]
- Meijers, E.; Hoogerbrugge, M.; Cardoso, R. Beyond Polycentricity: Does Stronger Integration Between Cities in Polycentric Urban Regions Improve Performance? Tijdschr. Econ. Soc. Geogr. 2018, 109, 1–21. [Google Scholar] [CrossRef] [Green Version]
- Veneri, P.; Burgalassi, D. Questioning polycentric development and its effects. Issues of definition and measurement for the Italian NUTS-2 regions. Eur. Plan. Stud. 2012, 20, 1017–1037. [Google Scholar] [CrossRef] [Green Version]
- Yu, J.; Zhou, K.; Yang, S. Land use efficiency and influencing factors of urban agglomerations in China. Land Use Policy 2019, 88, 104143. [Google Scholar] [CrossRef]
- Brezzi, M.; Veneri, P. Assessing Polycentric Urban Systems in the OECD: Country, Regional and Metropolitan Perspectives. Eur. Plan. Stud. 2015, 23, 1128–1145. [Google Scholar] [CrossRef]
- Li, W.; Sun, B.; Zhang, T. Spatial structure and labour productivity: Evidence from prefectures in China. Urban Stud. 2019, 56, 1516–1532. [Google Scholar] [CrossRef]
- Meijers, E.J.; Burger, M.J. Spatial structure and productivity in US metropolitan areas. Environ. Plan. A 2010, 42, 1383–1402. [Google Scholar] [CrossRef] [Green Version]
- Li, Y.; Liu, X. How did urban polycentricity and dispersion affect economic productivity? A case study of 306 Chinese cities. Landsc. Urban Plan. 2018, 173, 51–59. [Google Scholar] [CrossRef]
- Zhang, T.; Sun, B.; Li, W. The economic performance of urban structure: From the perspective of Polycentricity and Monocentricity. Cities 2017, 68, 18–24. [Google Scholar] [CrossRef]
- Liu, X.; Derudder, B.; Wu, K. Measuring Polycentric Urban Development in China: An Intercity Transportation Network Perspective. Reg. Stud. 2016, 50, 1302–1315. [Google Scholar] [CrossRef]
- Liu, X.; Wang, M. How polycentric is urban China and why? A case study of 318 cities. Landsc. Urban Plan. 2016, 151, 10–20. [Google Scholar] [CrossRef]
- Riguelle, F.; Thomas, I.; Verhetsel, A. Measuring urban polycentrism: A European case study and its implications. J. Econ. Geogr. 2007, 7, 193–215. [Google Scholar] [CrossRef]
- Garcia-López, M.À.; Muñiz, I. Urban spatial structure, agglomeration economies, and economic growth in Barcelona: An intra-metropolitan perspective. Pap. Reg. Sci. 2013, 92, 515–534. [Google Scholar] [CrossRef]
- Duranton, G.; Puga, D. Micro-foundations of urban agglomeration economies. In Handbook of Regional and Urban Economics; Henderson, J.V., Thisse, J.-F., Eds.; Elsevier: Amsterdam, The Netherlands, 2004; Volume 4, pp. 2063–2117. [Google Scholar]
- Capello, R. The city network paradigm: Measuring urban network externalities. Urban Stud. 2000, 37, 1925–1945. [Google Scholar] [CrossRef]
- Parr, J.B. Agglomeration economies: Ambiguities and confusions. Environ. Plan. A 2002, 34, 717–731. [Google Scholar] [CrossRef] [Green Version]
- Meijers, E.J.; Burger, M.J.; Hoogerbrugge, M.M. Borrowing size in networks of cities: City size, network connectivity and metropolitan functions in Europe. Pap. Reg. Sci. 2016, 95, 181–198. [Google Scholar] [CrossRef] [Green Version]
- Alonso, W. Urban zero population growth. Daedalus 1973, 102, 191–206. [Google Scholar] [CrossRef]
- Quigley, J.M. Agglomeration and networks in spatial economies. Fifty Years Reg. Sci. 2004, 83, 165–176. [Google Scholar] [CrossRef] [Green Version]
- Meijers, E.J.; Burger, M.J. Stretching the concept of ‘borrowed size’. Urban Stud. 2017, 54, 269–291. [Google Scholar] [CrossRef]
- Brinkman, J.C. Congestion, agglomeration, and the structure of cities. J. Urban Econ. 2016, 94, 13–31. [Google Scholar] [CrossRef] [Green Version]
- Chen, J.; Zhou, Q. City size and urban labor productivity in China: New evidence from spatial city-level panel data analysis. Econ. Syst. 2017, 41, 165–178. [Google Scholar] [CrossRef]
- Duranton, G.; Puga, D. Nursery cities: Urban diversity, process innovation, and the life cycle of products. Am. Econ. Rev. 2001, 91, 1454–1477. [Google Scholar] [CrossRef] [Green Version]
- Capello, R.; Camagni, R. Beyond optimal city size: An evaluation of alternative urban growth patterns. Urban Stud. 2000, 37, 1479–1496. [Google Scholar] [CrossRef]
- Bailey, N.; Turok, I. Central Scotland as a polycentric urban region: Useful planning concept or chimera? Urban Stud. 2001, 38, 697–715. [Google Scholar] [CrossRef]
- Brülhart, M.; Sbergami, F. Agglomeration and growth: Cross-country evidence. J. Urban Econ. 2009, 65, 48–63. [Google Scholar] [CrossRef] [Green Version]
- Lambregts, B. Polycentrism: Boon or barrier to metropolitan competitiveness? The case of the Randstad Holland. Built Environ. 2006, 32, 114–123. [Google Scholar] [CrossRef]
- Castells-Quintana, D. Malthus living in a slum: Urban concentration, infrastructure and economic growth. J. Urban Econ. 2017, 98, 158–173. [Google Scholar] [CrossRef]
- Lampe, H.W.; Hilgers, D. Trajectories of efficiency measurement: A bibliometric analysis of DEA and SFA. Eur. J. Oper. Res. 2015, 240, 1–21. [Google Scholar] [CrossRef]
- Zhang, J.; Chang, Y.; Wang, C.; Zhang, L. The green efficiency of industrial sectors in China: A comparative analysis based on sectoral and supply-chain quantifications. Resour. Conserv. Recycl. 2018, 132, 269–277. [Google Scholar] [CrossRef]
- Ramanathan, R. An analysis of energy consumption and carbon dioxide emissions in countries of the Middle East and North Africa. Energy 2005, 30, 2831–2842. [Google Scholar] [CrossRef]
- Reinhard, S.; Lovell, C.A.K.; Thijssen, G. Econometric Estimation of Technical and Environmental Efficiency: An Application to Dutch Dairy Farms. Am. J. Agric. Econ. 1999, 81, 44–60. [Google Scholar] [CrossRef]
- Hua, Z.; Bian, Y.; Liang, L. Eco-efficiency analysis of paper mills along the Huai River: An extended DEA approach. Omega 2007, 35, 578–587. [Google Scholar] [CrossRef]
- Li, K.; Lin, B. Impact of energy conservation policies on the green productivity in China’s manufacturing sector: Evidence from a three-stage DEA model. Appl. Energy 2016, 168, 351–363. [Google Scholar] [CrossRef]
- Song, M.; An, Q.; Zhang, W.; Wang, Z.; Wu, J. Environmental efficiency evaluation based on data envelopment analysis: A review. Renew. Sustain. Energy Rev. 2012, 16, 4465–4469. [Google Scholar] [CrossRef]
- Andersen, P.; Petersen, N.C. A Procedure for Ranking Efficient Units in Data Envelopment Analysis. Manage. Sci. 1993, 39, 1261–1264. [Google Scholar] [CrossRef]
- Tone, K. A slacks-based measure of super-efficiency in data envelopment analysis. Eur. J. Oper. Res. 2002, 143, 32–41. [Google Scholar] [CrossRef] [Green Version]
- Halkos, G.E.; Polemis, M.L. The impact of economic growth on environmental efficiency of the electricity sector: A hybrid window DEA methodology for the USA. J. Environ. Manag. 2018, 211, 334–346. [Google Scholar] [CrossRef]
- Pulina, M.; Detotto, C.; Paba, A. An investigation into the relationship between size and efficiency of the Italian hospitality sector: A window DEA approach. Eur. J. Oper. Res. 2010, 204, 613–620. [Google Scholar] [CrossRef]
- Li, W.; Sun, B.; Zhao, J.; Zhang, T. Economic performance of spatial structure in Chinese prefecture regions: Evidence from night-time satellite imagery. Habitat Int. 2018, 76, 29–39. [Google Scholar] [CrossRef]
- Batty, M. The size, scale, and shape of cities. Science 2008, 319, 769–771. [Google Scholar] [CrossRef] [PubMed] [Green Version]
- Gabaix, X.; Ibragimov, R. Rank−1/2: A Simple Way to Improve the OLS Estimation of Tail Exponents. J. Bus. Econ. Stat. 2011, 29, 24–39. [Google Scholar] [CrossRef] [Green Version]
- Meijers, E. Measuring Polycentricity and its Promises. Eur. Plan. Stud. 2008, 16, 1313–1323. [Google Scholar] [CrossRef]
- Cheshire, P. Trends in sizes and structures of urban areas. In Handbook of Regional and Urban Economics; Cheshire, P., Mills, E.S., Eds.; Elsevier: Amsterdam, The Netherlands, 1999; Volume 3, pp. 1339–1373. [Google Scholar]
- Burger, M.J.; Meijers, E. Form follows function? linking morphological and functional polycentricity. Urban Stud. 2012, 49, 1127–1149. [Google Scholar] [CrossRef]
- Wang, F.; Ning, L.; Zhang, J. FDI pace, rhythm and host region technological upgrading: Intra- and interregional evidence from Chinese cities. China Econ. Rev. 2017, 46, S65–S76. [Google Scholar] [CrossRef]
- Yan, S.; Peng, J.; Wu, Q. Exploring the non-linear effects of city size on urban industrial land use efficiency: A spatial econometric analysis of cities in eastern China. Land Use Policy 2020, 99, 104944. [Google Scholar] [CrossRef]
- Knowles, S.; Garces-Ozanne, A. Government intervention and economic performance in East Asia. Econ. Dev. Cult. Chang. 2003, 51, 451–477. [Google Scholar] [CrossRef]
- Lin, C.; Wong, S.M.-L. Government intervention and firm investment: Evidence from international micro-data. J. Int. Money Financ. 2013, 32, 637–653. [Google Scholar] [CrossRef]
- Hansen, B.E. Threshold effects in non-dynamic panels: Estimation, testing, and inference. J. Econom. 1999, 93, 345–368. [Google Scholar] [CrossRef] [Green Version]
- Bai, C.-E.; Hsieh, C.-T.; Qian, Y. The Return to Capital in China. Brook. Pap. Econ. Act. 2006, 37, 61–88. [Google Scholar] [CrossRef]
- Zhang, J.; Wu, G.; Zhang, J. The Estimation of China’s provincial capital stock: 1952–2000. Econ. Res. J. 2004, 10, 35–44. [Google Scholar]
Figure 1.
The mechanism through which polycentric development affects GUEUL.

Figure 2.
Research process of this study.

Figure 3.
Locations of the study area.

Figure 4.
GUEUL of sample UAs for selected years.

Figure 5.
Degree of polycentricity of sample UAs for selected years.


Table 1.
Variable definitions and summary statistics.
| Variable | Definition | Mean | Std. Dev. | Min | Max |
|---|---|---|---|---|---|
| Y | Value added of secondary and tertiary industries (unit: 1 billion CNY) | 2370.78 | 2472.05 | 106.58 | 14,233.58 |
| LABOR | The number of employees in urban sectors (unit: 10,000 persons) | 1572.89 | 1476.76 | 170.87 | 8138.95 |
| CAPITAL | The capital stock in urban sectors (unit: 1 billion CNY) | 7075.45 | 7621.54 | 244.70 | 41,888.90 |
| LAND | The area of built-up land (unit: square kilometer) | 2355.85 | 2047.62 | 284.29 | 9582.17 |
| WWATER | Industrial wastewater discharge (unit: 10,000 tons) | 101,395.60 | 105,041 | 7564 | 511,642 |
| SD | Emissions of sulfur dioxide (unit: ton) | 690,987.40 | 551,067.30 | 48,961 | 2,335,005 |
| SOOT | Emissions of soot (dust) (unit: ton) | 405,314.30 | 480,674.10 | 47,989 | 5,306,546 |
| PCGDP | Per capita GDP (unit: 10,000 CNY) | 3.98 | 2.30 | 0.75 | 11.39 |
| FDI | The ratio of the quantity of foreign capital utilized to GDP | 0.0240 | 0.0141 | 0.0010 | 0.0740 |
| GEXP | The ratio of local governments’ budgetary expenditure to GDP | 0.1442 | 0.0400 | 0.0666 | 0.2390 |
| STEXP | The proportion of expenditure on science and technology in local governments’ budgetary expenditure | 0.0181 | 0.0146 | 0.0019 | 0.0900 |
Table 2.
Estimation results of the baseline model of determinants of GUEUL.
| (1) | (2) | (3) | |
|---|---|---|---|
| Pooled OLS Estimation | Fixed-Effects Estimation | Random-Effects Estimation | |
| 0.037 *** | 0.277 *** | 0.109 *** | |
| (0.013) | (0.084) | (0.029) | |
| 0.167 ** | 1.055 *** | 0.429 *** | |
| (0.070) | (0.305) | (0.135) | |
| 0.072 *** | 0.103 *** | 0.101 *** | |
| (0.004) | (0.010) | (0.008) | |
| 1.278 ** | −0.397 | −0.606 | |
| (0.525) | (0.508) | (0.451) | |
| −0.896 *** | 0.616 | 0.688 | |
| (0.197) | (0.447) | (0.414) | |
| 0.802 | 4.021 *** | 3.366 *** | |
| (0.642) | (0.705) | (0.691) | |
| Constant | 0.258 *** | −0.634 *** | −0.142 |
| (0.052) | (0.228) | (0.100) | |
| UA-specific effects | No | Yes | Yes |
| Year dummies | No | Yes | Yes |
| Number of observations | 224 | 224 | 224 |
| R-squared | 0.804 | 0.771 | 0.763 |
Notes: (1) Standard errors are shown in parentheses below parameter estimates. (2) *** and ** denote significance at the 1% and 5% level, respectively.
Table 3.
The results of the tests for threshold effects.
| Threshold | F-Statistics | p-Value | 10% Critical Value | 5% Critical Value | 1% Critical Value |
|---|---|---|---|---|---|
| Single threshold | 43.010 *** | 0.030 | 31.030 | 38.603 | 49.482 |
| Double threshold | 18.930 | 0.400 | 58.679 | 76.200 | 95.336 |
Notes: *** denotes significance at the 1% level.
Table 4.
Threshold estimates.
| Estimate | 95% Confidence Interval | |
|---|---|---|
| 8.925 | [8.876, 9.322] |
Table 5.
Estimation results of panel threshold model of determinants of GUEUL.
| Variables | Coefficient Estimates | Standard Errors | t-Statistics | p-Value |
|---|---|---|---|---|
| 0.103 *** | 0.010 | 9.920 | 0.000 | |
| −0.605 | 0.502 | −1.210 | 0.229 | |
| 0.979 | 0.644 | 1.520 | 0.131 | |
| 2.619 *** | 0.845 | 3.100 | 0.002 | |
| 0.253 *** | 0.083 | 3.030 | 0.003 | |
| 0.348 *** | 0.092 | 3.800 | 0.000 | |
| 1.109 *** | 0.307 | 3.610 | 0.000 | |
| 0.584 * | 0.337 | 1.730 | 0.085 | |
| Constant | −0.653 | 0.225 | −2.910 | 0.004 |
| UA-specific effects | Yes | |||
| Year dummies | Yes | |||
| Number of observations | 224 | |||
| R-squared | 0.783 |
Notes: *** and * denote significance at the 1% and 10% level, respectively.
Publisher’s Note: MDPI stays neutral with regard to jurisdictional claims in published maps and institutional affiliations. |
© 2022 by the authors. Licensee MDPI, Basel, Switzerland. This article is an open access article distributed under the terms and conditions of the Creative Commons Attribution (CC BY) license (https://creativecommons.org/licenses/by/4.0/).
Share and Cite
MDPI and ACS Style
Yan, S.; Wang, J. Does Polycentric Development Improve Green Utilization Efficiency of Urban Land? An Empirical Study Based on Panel Threshold Model Approach. Land 2022, 11, 124. https://0-doi-org.brum.beds.ac.uk/10.3390/land11010124
AMA Style
Yan S, Wang J. Does Polycentric Development Improve Green Utilization Efficiency of Urban Land? An Empirical Study Based on Panel Threshold Model Approach. Land. 2022; 11(1):124. https://0-doi-org.brum.beds.ac.uk/10.3390/land11010124
Chicago/Turabian StyleYan, Siqi, and Jian Wang. 2022. "Does Polycentric Development Improve Green Utilization Efficiency of Urban Land? An Empirical Study Based on Panel Threshold Model Approach" Land 11, no. 1: 124. https://0-doi-org.brum.beds.ac.uk/10.3390/land11010124
Note that from the first issue of 2016, this journal uses article numbers instead of page numbers. See further details here.